 Open Access
ARTICLE
Impact of Different Rooftop Coverings on Photovoltaic Panel Temperature
1 Faculty of Engineering/AL-Mussayib, University of Babylon, Babylon, 51001, Iraq
2 Construction and Projects Department, Al Iraqia University, Baghdad, 10011, Iraq
* Corresponding Author: Aws Al-Akam. Email:
Energy Engineering 2024, 121(12), 3761-3777. https://doi.org/10.32604/ee.2024.055198
Received 20 June 2024; Accepted 14 October 2024; Issue published 22 November 2024
Abstract
Photovoltaic (PV) panels are essential to the global transition towards sustainable energy, offering a clean, renewable source that reduces reliance on fossil fuels and mitigates climate change. High temperatures can significantly affect the performance of photovoltaic (PV) panels by reducing their efficiency and power output. This paper explores the consequential effect of various rooftop coverings on the thermal performance of photovoltaic (PV) panels. It investigates the relationship between the type of rooftop covering materials and the efficiency of PV panels, considering the thermal performance and its implications for enhancing their overall performance and sustainability. The study compares four rooftop covering materials: wooden flakes packs (both dry and wet), polystyrene, and woolen insulation. The measurements were implemented under Iraqi weather conditions. The comparison was based on the PV panels’ thermal behavior and its impact on conversion efficiency. The results revealed that covering the roof beneath the installed PV panels reduces their temperature and increases efficiency. The best performance was observed when placing wet wooden flakes beneath the panels, with an efficiency increase of 5%. Moreover, the woolen insulation offered an efficiency rise of 12% near sunset. The main outcome of this work is that the wet–wooden–flakes showed the best performance improvement of the PV panels.Keywords
Solar energy is one of the most readily available sources and can be converted into clean electric power using photovoltaic systems. Environmental concerns related to global warming and greenhouse gas emissions are prompting the engineering community to search for more renewable sources or develop new technologies to exploit clean energy sources [1]. Iraq experiences long hours of sunshine, and studies have shown that it receives over 3000 h of solar radiation annually in Baghdad alone. The potential solar irradiation in Iraq amounts to 2000 kWh/m²/year. Iraq’s mean monthly total solar exposure, including indirect and direct sunlight, varies throughout the year, ranging from 2766 Wh/m²/day in December to 6842 Wh/m²/day in June [2].
Additionally, the average solar radiation on a flat surface in Iraq ranges from 4.5 kWh/m²/day in the northern regions to 5.7 kWh/m²/day in the southern areas [3,4]. The installation of photovoltaic panels as a power source in Iraq started years ago; however, significant steps to consider it as an additional power source began in 2019 [5]. Households and businesses began to use it as a replacement for generator power or as the main source of electricity in rural areas. Starting in mid-2019, Iraq initiated a more sustained effort with the assistance of global organizations to create a solar strategy aimed at installing several thousand megawatts of large-scale solar facilities, along with 5 MW of household photovoltaic systems by 2028 [5].
Heat is one of the problems facing this initiative as due to the hot weather in this region, the PV cell has become very hot, which reduces its efficiency. The efficiency of a PV module drops by 0.5% for every 1.0°C rise in surface temperature [6]. Several studies were conducted to reduce the temperature of the PV cells using different techniques, such as lowering the temperature, reducing resistance, and increasing power production [7]. Sivaram et al. [8] used ventilated airflow from a room to cool the backward surface of a rooftop PV panel. Moreover, Salameh et al. [9] cooled a PV module using the exhausted air from an Air conditioning unit. The findings showed an improvement in the PV system by 11% to 18% when the Air Conditioning (AC) system load rose from 0.0 to 160 kW. Modified with the Phase Change Material (PCM), the PV temperature was controlled using the ventilated air from the Heating, Ventilation, and Air Conditioning (HVAC) [10]. Based on the natural convection, several studies focused on installing fins over the back side of the PV [11–13]. Several fin configurations and patterns were examined, and an improvement of 1.5% in efficiency was recorded [12,13]. Ducted airflow was also one method to reduce the PV system temperature [14–20]. This technique is based on attaching a duct over the underside of the PV panels and forcing the air to flow inside it. The impact of the number of channels inside the duct [15], the velocity of the airflow [17], and locating various configurations of the fins and baffles inside the duct [16] and [20] were examined. Moreover, Hudișteanu et al. [21] found an increase of 6.5% in power production using Perforated fins located at the back surface of the PV panels.
To use low energy air blowing system, Hussien et al. [18] attached several Directe Current (DC) fans to the duct and estimated a 1.34% efficiency improvement. In other techniques, the lower surface of the PV panels provided several configurations of heat sinks [22–26]. The results showed an improvement in the PV system’s performance due to temperature dissipation. In one of the recent studies, the author [27] combined cooling using humid air and thermal electric generators, which cool and produce electricity [27]. The configuration has a temperature reduction of 5.2°C and a PV efficiency increase of 4.96% [27].
The above-mentioned cooling techniques are mainly based on using several active methods. However, the location of the PV modules in a relatively cold environment while retaining the same solar load could improve the performance [1,28–36]. The impact of installing the PV panels over a greened rooftop is investigated by [28–31,33–35]. The results reported an improvement in the performance of the PV system between 6.2% and 8.8% [28]. Although the showdown from the PV panel on the rooftop has a significant impact [37] the heat reflected and dissipated from the rooftop affects the PV panel temperature. Furthermore, taking into consideration the impact of the reflected solar irradiance from the roof, Mahmood et al. [36] applied a cool coating. The results showed an improvement in peak power output by 3.30%. Osma-Pinto et al. [31] studied the impact of the height of the installation, the type of the roof, and the airflow velocity beneath the PV panels. Four height ranges, three velocity levels, and green and concrete roof types were examined. The efficiency of the PV system improved by 1.30% when installed on the green surface. Ramkiran et al. [33] conducted an experimental study on various passive cooling methods, such as plant cooling, greenhouse and plant cooling, coir pith, and phase change material cooling, which were the different approaches analyzed in the research. The significant increase, in power amounting to 11.34% was seen when utilizing coir pith cooling. The largest drop in temperature reaching 14°C was noted in the cooling of plants inside a greenhouse. Gazania rigens and Sedum Clavatum were chosen for the PV system while a PV gravel setup was used as the roof, in the research [34]. The results obtained for five sunny days showed a rise in the maximum power output of the PVs of 1.29% to 3.33% based on the plant type.
Iraq’s hot weather effects made the temperature of the PV panel very high, reaching up to 81°C in August [38]. As above concluded, passive cooling increases the PV system’s electrical efficiency by 15.0% with temperature reduction from 6.0–20 [39]. Several studies considered the impact of rooftop covering and greened rooftops on the thermal performance of the PV panels. However, their suggested materials are costly and could be difficult to implement, which adds to the high cost of the PV panels. This work suggests four new rooftop covering materials placed under the PV panels, and these are: wooden flakes packs (both dry and wet), polystyrene, and woolen insulation. The thermal behavior and the conversion efficiency of the PV panel was examined under Iraqi hot summer conditions. These suggested materials are relatively cheap and can be used in buildings where it is difficult to make their rooftops green.
Two Photovoltaic (PV) panels were installed to enable the comparison, as depicted in Fig. 1. The PV panels are Monocrystalline cell panels (Model: DSP-150M) with dimensions of 1460 mm × 660 mm × 35 mm were used. The maximum power of the PV panels is 150 W, the rated voltage (Vmp) is 18 V, and the maximum current is 8.33 A [40]. Both sets of PV panels were installed with an inclination angle of 30° facing towards the south in Hilla city (32.4736° N, 44.4252° E). An adjustable steel frame was used for the installation.
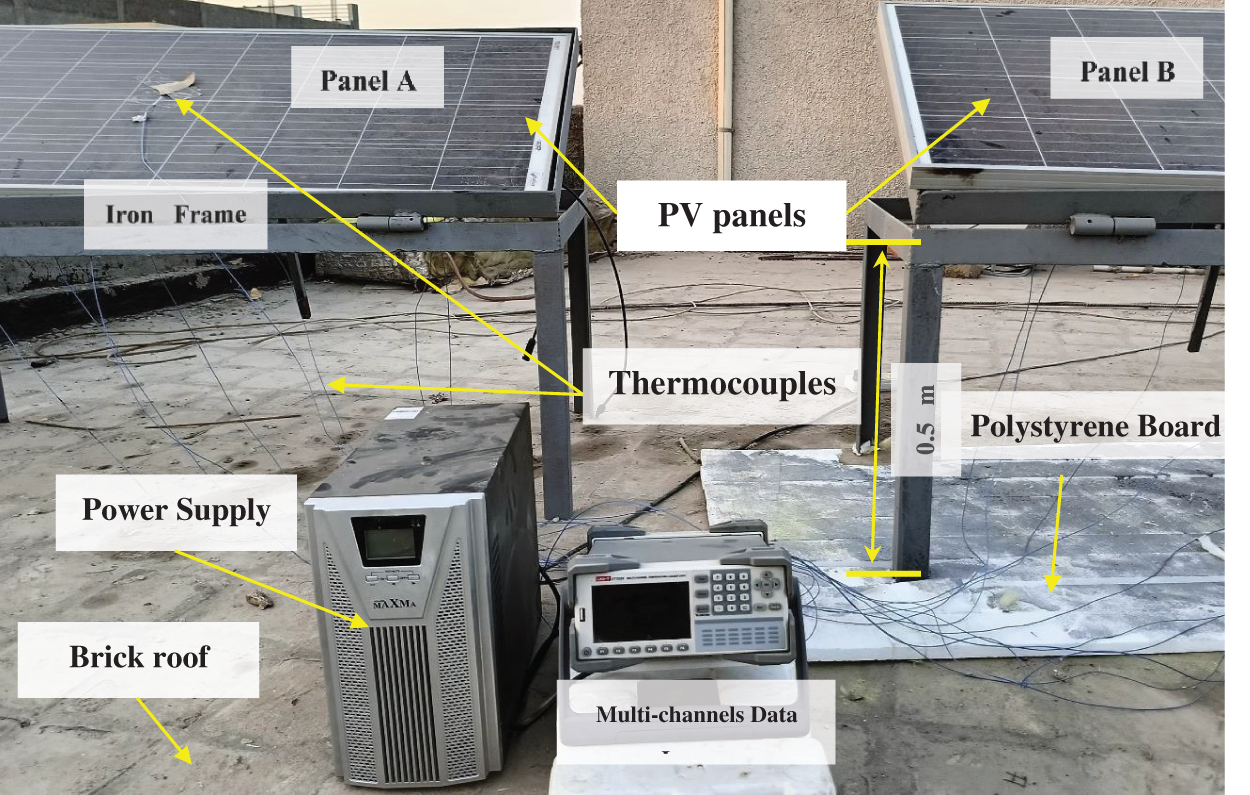
Figure 1: Experimental setup
2.2 Selected Material Specifications
In this work, the cost of the utilized material to be placed under the panel was low. Therefore, three types of material were selected: Wood flakes pack (Fig. 2a), polystyrene insulation board (Fig. 2b), and glass wool installation (Fig. 2c). These three materials can be used as additional layers of insulation over the roof in hot weather, except for the wood flakes, as suggested in this research. It should be mentioned that the covering area under the panel did not exceed the projected area of the inclined panel. This is because, in this work, only the area beneath the system is considered. Although a larger covering area could affect the temperature of the PV panel differently, this case was left for future work.
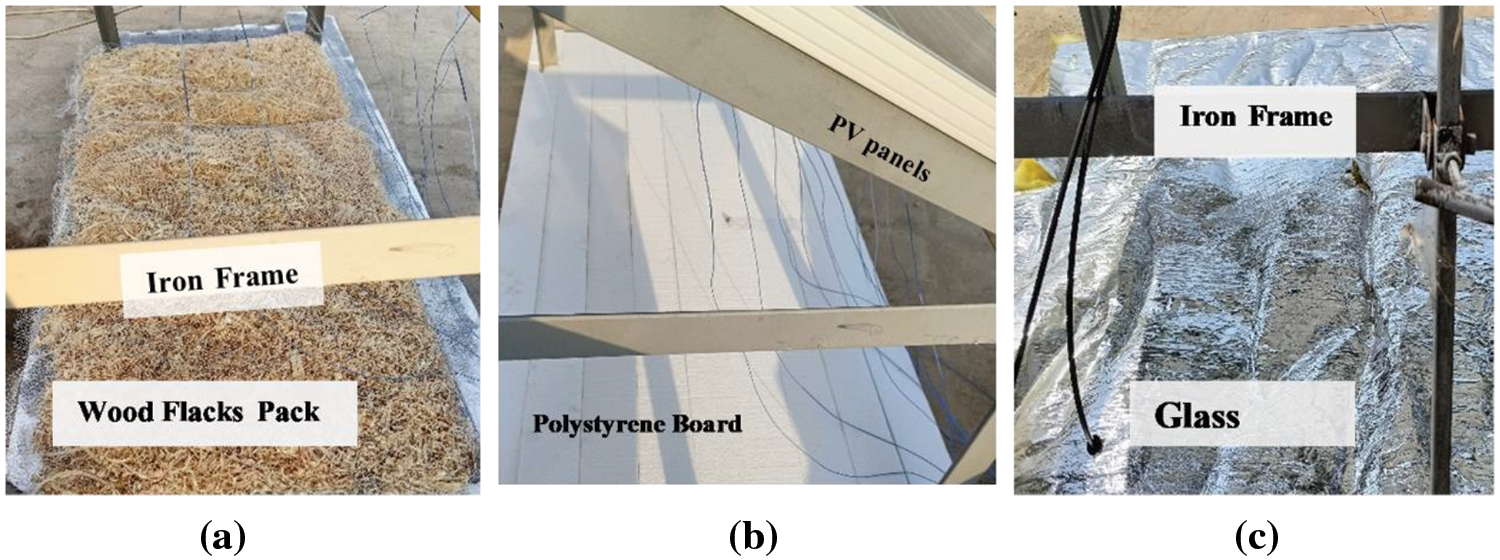
Figure 2: Selected materials: (a) wood flakes pack, (b) polystyrene board, and (c) glass wool
A temperature data logger, with 24 channels the Uni T UT 3224 model was used to gather information from K type thermocouples. Each PV panel had eight thermocouples attached to its back (refer to Fig. 3a). Solar radiation was measured using a power meter that ranged from 1.0 to 2000 W/m² (refer to Fig. 3b). Wind speed readings were taken using an anemometer the UNI T UT 363 BT model, which can measure speeds between 0 and 30 m/s (refer to Fig. 3c). The voltage and current output of the PV panels were monitored using a multimeter labeled as Model; UT60EU (refer to Fig. 3d). As per the user manual of these devices the accuracy of measurements for this study is detailed as follows; the solar power meter has a measurement error rate of around 10% the data loggers reported instability is within or less, than ±0.1°C. The anemometer has an estimated error margin of 5.0%.
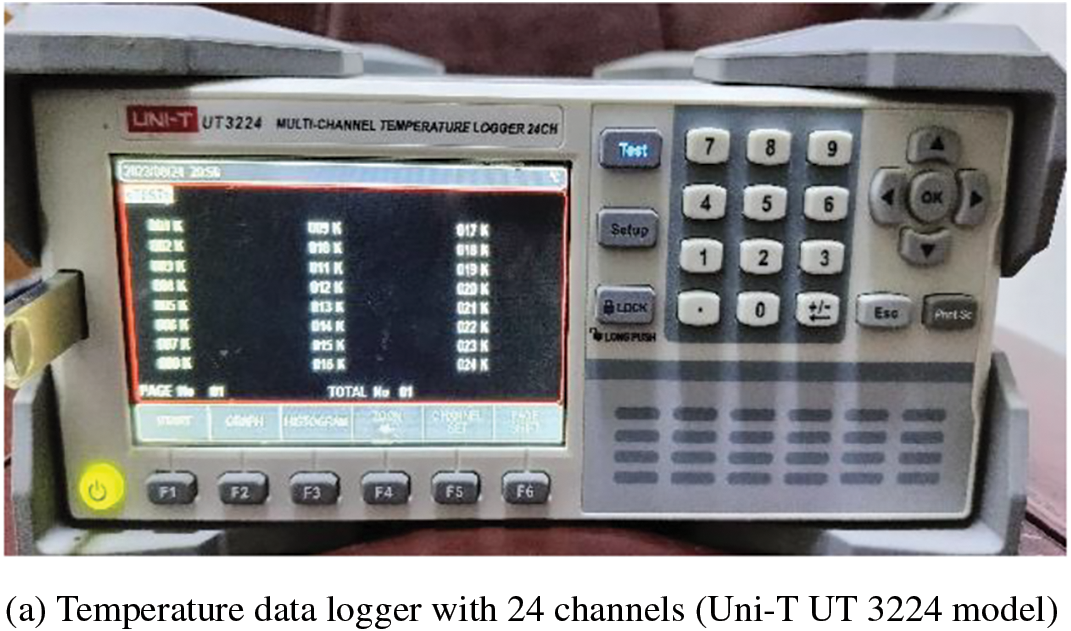
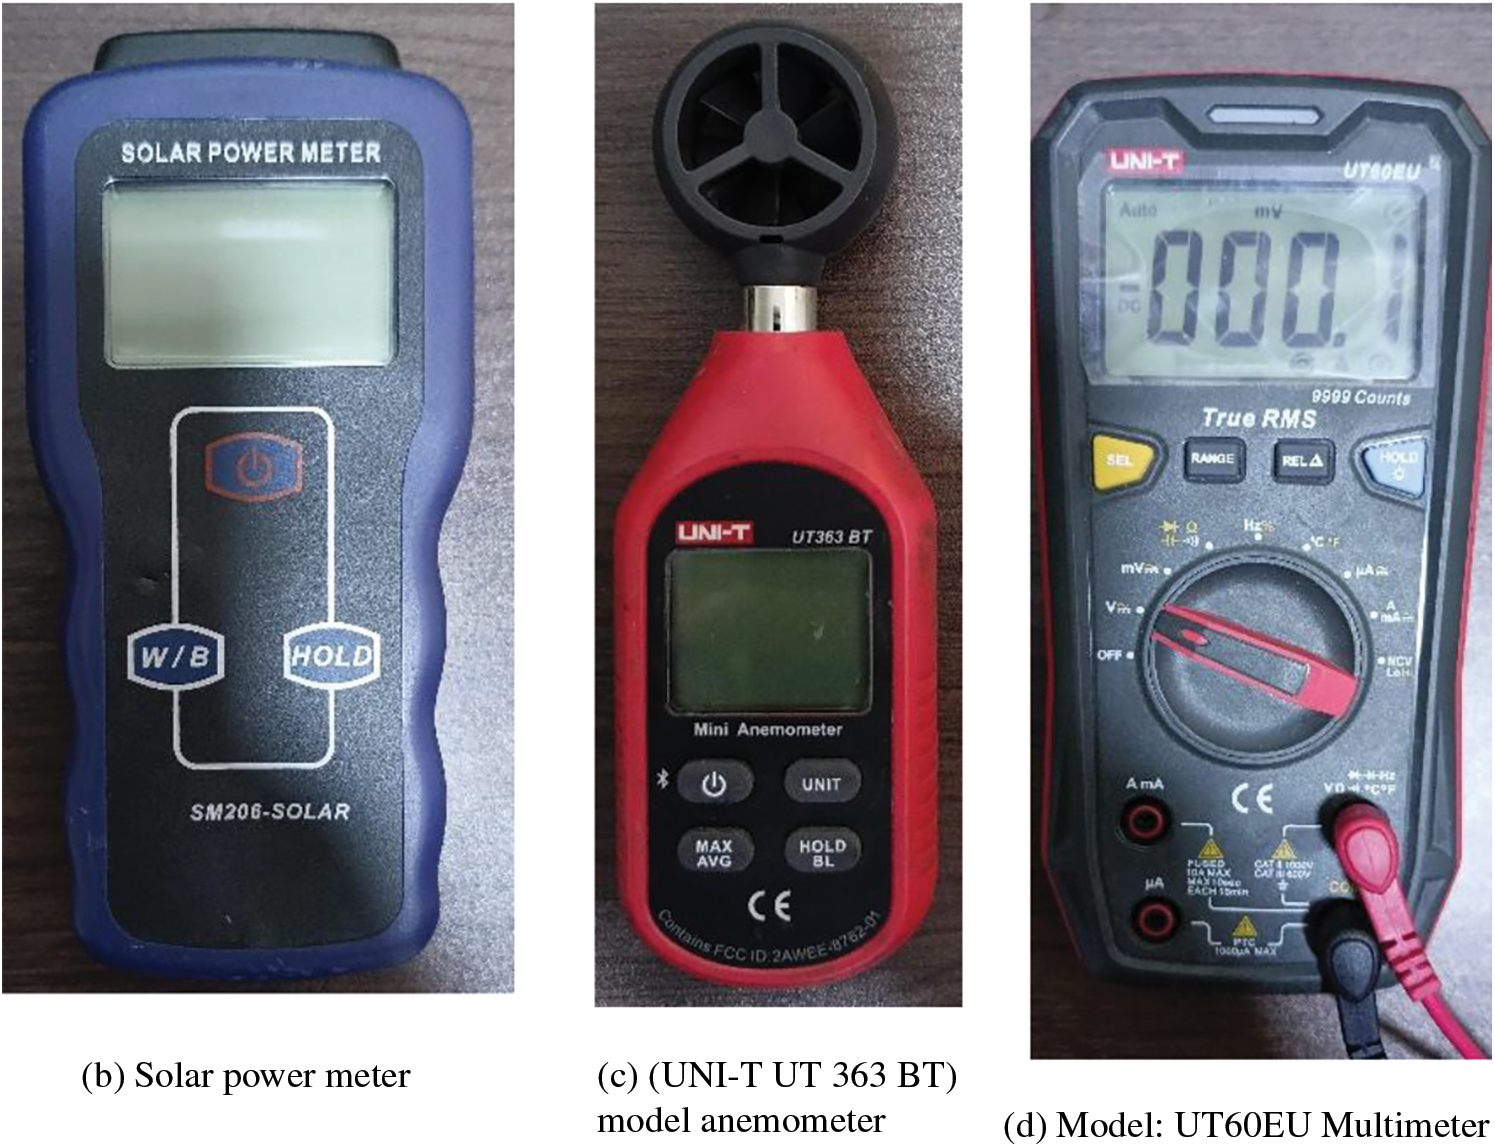
Figure 3: Measuring devices
Five days of measurement were conducted, and both panels without roof covering were measured. These are to assess potential performance differences. Subsequently, the four days involved using a wood flake pack (both wet and dry) for two days, a polystyrene insulation board for one day, and glass wool insulation on the final day. The selected days were ensured to have no clouds, clear skies, and low wind speeds. The data collected included the upper surface temperature (measured by a single thermocouple), eight temperature sensors on the lower surface of the panels, the ambient temperature, and the temperature in the space between the panels and the ground (measured by a floating thermocouple, as shown in Fig. 4a,b). The temperature was reported as a ratio of Tr to eliminate the impact of varying ambient temperatures on different days. The Temperature ratio (Tr) represents the ratio of the local temperature to the ambient temperature (Tsurf/Tamb). The PV system’s solar irradiance, wind speed, current, and voltage were also collected. The measurements were conducted daily from 9:00 to 19:00 h, as these are the daylight hours during this time of the year. The wood flake packs were evenly wetted using one liter of water hourly. Besides temperature measurement, the conversion efficiency of the PV panel (ηp) is calculated using Eq. (1), where Pmax(W) is the maximum power produced by the PV panel (I × V) with a 0.5-amp load, Ap is the panel’s surface area, and Isolar is the incident solar irradiance (W/m²) on the panels.
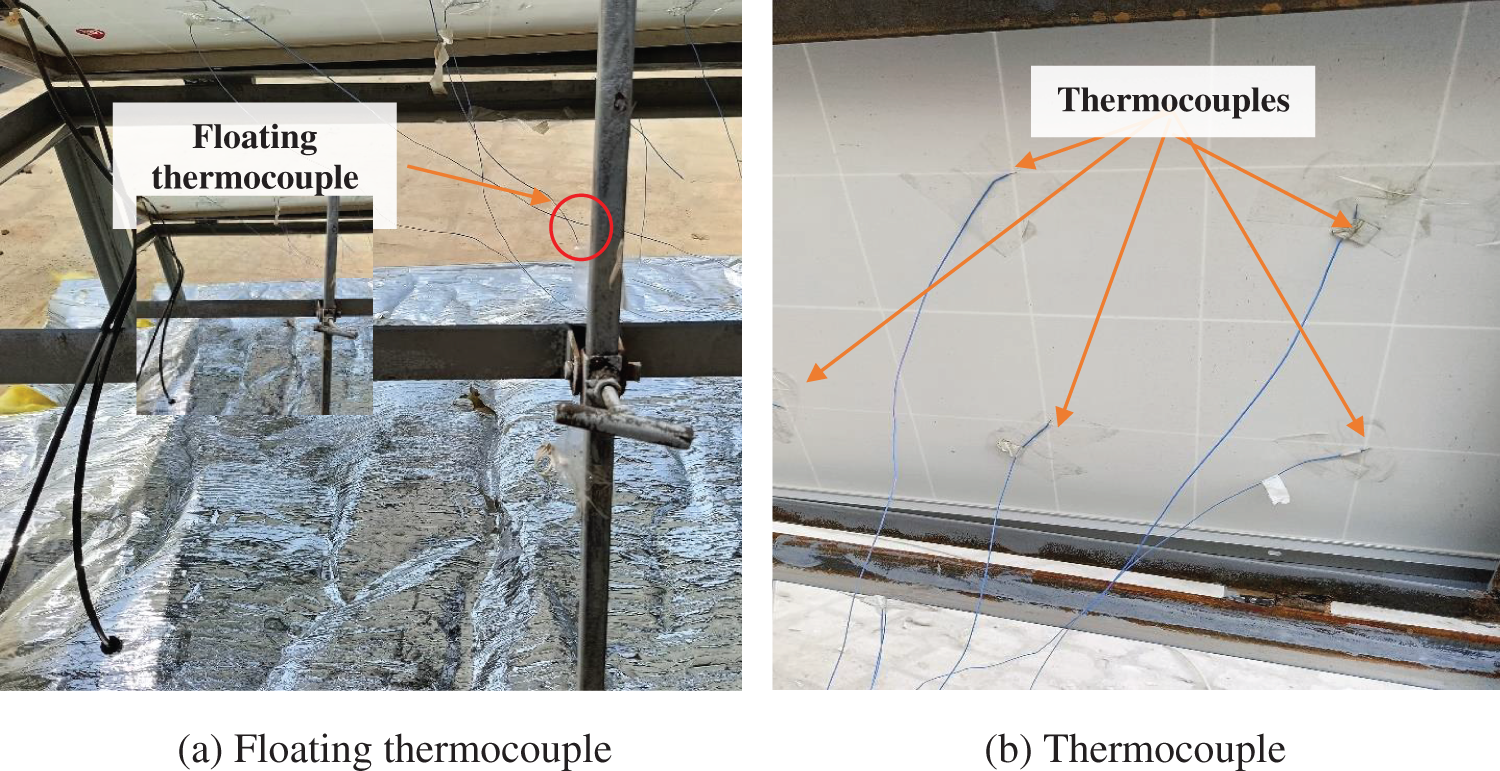
Figure 4: Location of the thermocoupls
3.1 Temperature Variation of the PV Panels with Different Roof Covering
The variation of temperature distribution over the top surface of the PV panel was recorded hourly (9:00–18:00 h) for the four days of the test as a temperature difference of ΔT. ΔT represents the difference between the temperature for the PV panel with the roof covering and the panel without roof covering. The results showed that the area under the PV panel covered with the polystyrene board had a higher temperature than the clean one, with a maximum temperature difference of 2.2°C at 14:00 h, Fig. 5. However, a reduction at 18:00 h. was recorded, which can be attributed to the decrease in ambient temperature. The wet-flakes pack showed a temperature reduction most of the day with a maximum drop of 0.8°C at 15:00 h, followed by a dry wood-flakes pack at 0.3°C at 17:00 h, Fig. 5.
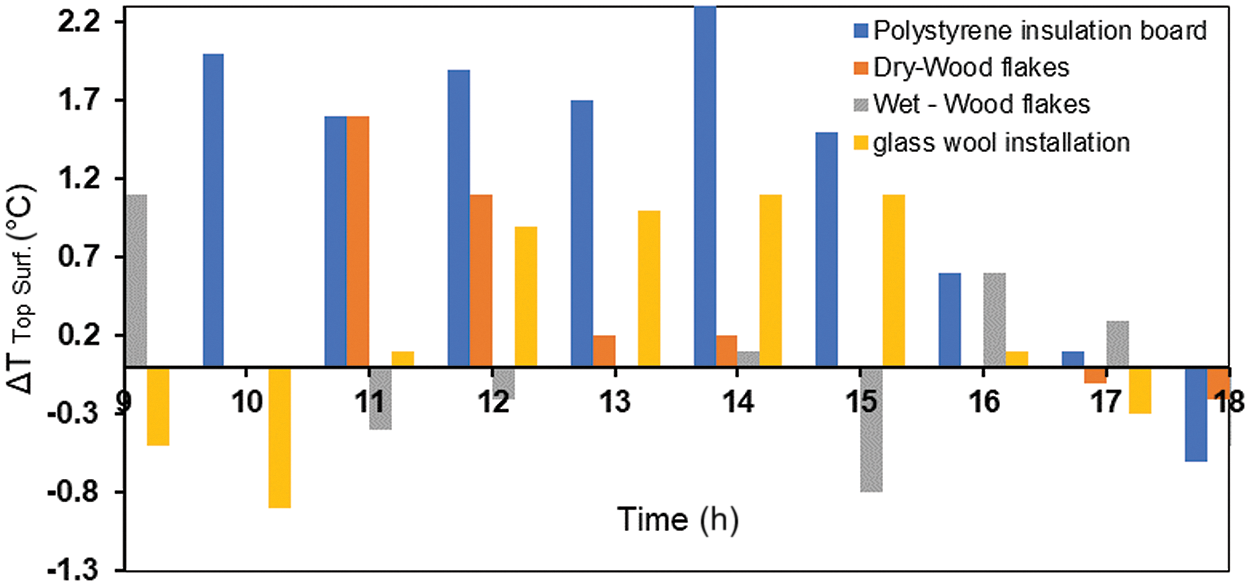
Figure 5: Hourly temperature difference between the PV panel top surface with the roof covering under it and the panel without for the four types of roof covering
The floating temperature sensor measurements showed an increase in the temperature after placing the Polystyrene board by 2.2°C at 14:00 h. and a reduction with installing the wet wood flakes pack, Fig. 6. The decrease in temperature was expected since, after locating the wet-wood flaks pack, there will be evaporation in the water and a reduction in the local temperature under the PV panel, Fig. 6. It is worth mentioning that the wind speed has a noticeable impact on the data; for instance, the measurements at 16:00 showed a more significant reduction, which is attributed to the high wind speed at this time, which was 2.2 m/s.
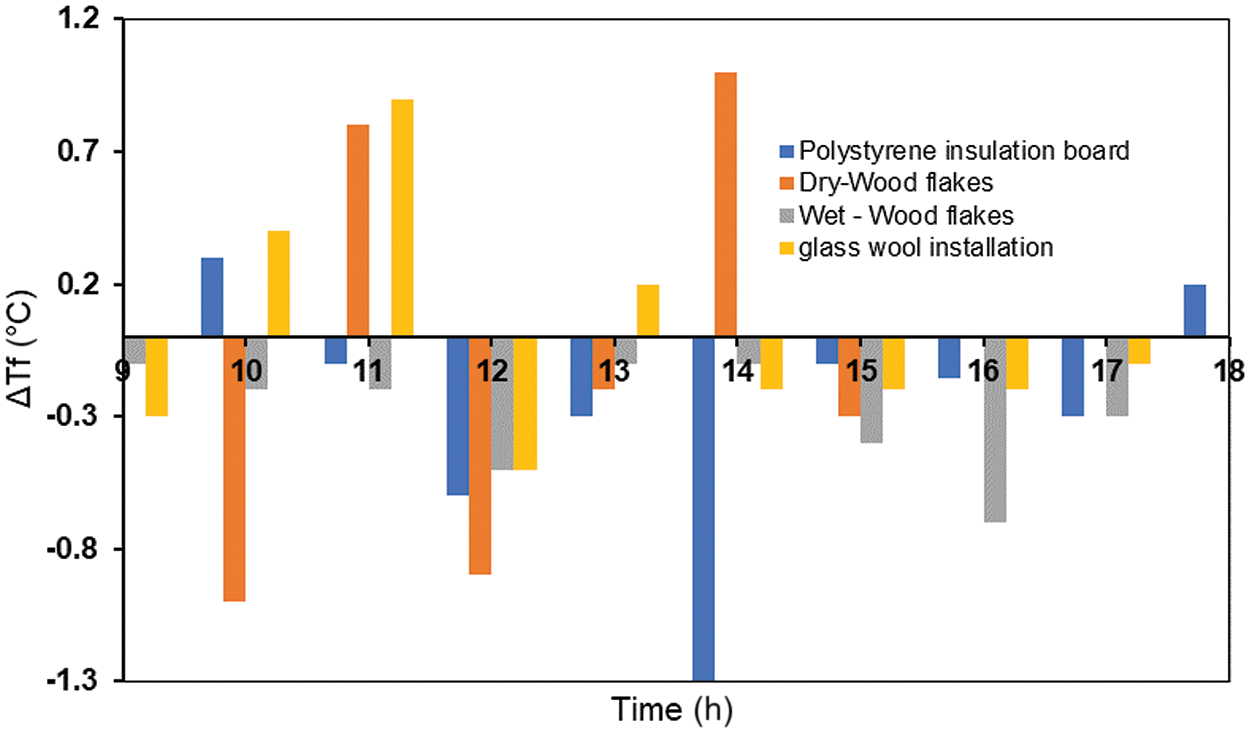
Figure 6: Hourly floating Temperature difference between the PV panel with the roof covering under it and the panel without for the four types of roof covering
A comparison between the temperature over the lower surface of the panels was made for all cases, Figs. 7–10. To eliminate the impact of the change in the ambient temperature throughout the testing days, the local temperature of the PV panel is normalized over the ambient temperature (Tr) (Tr = Tsurf./Tamb). The addition of polystyrene insulation showed an increase in temperature compared to the PV panel without placing the insulation beneath it, Fig. 7. This is attributed to the impact of the reflected solar radiation from the surface of polystyrene insulation as it has a color. However, adding dry-wood flakes reduced the temperature for noon h and 15:00 h, Fig. 8. The texture of the dry-wood flaks could cause dissipation of the incident solar irradiance besides the insulation behavior of this type of material. A slight increase in the temperature was measured early at 9:00 h. in the front right region of the PV panel. This can be regarded as the sun’s location at this time, which affects the ground near this side of the PV (not covered with the dry wood flakes); therefore, the roof reflects the heat to the panel.
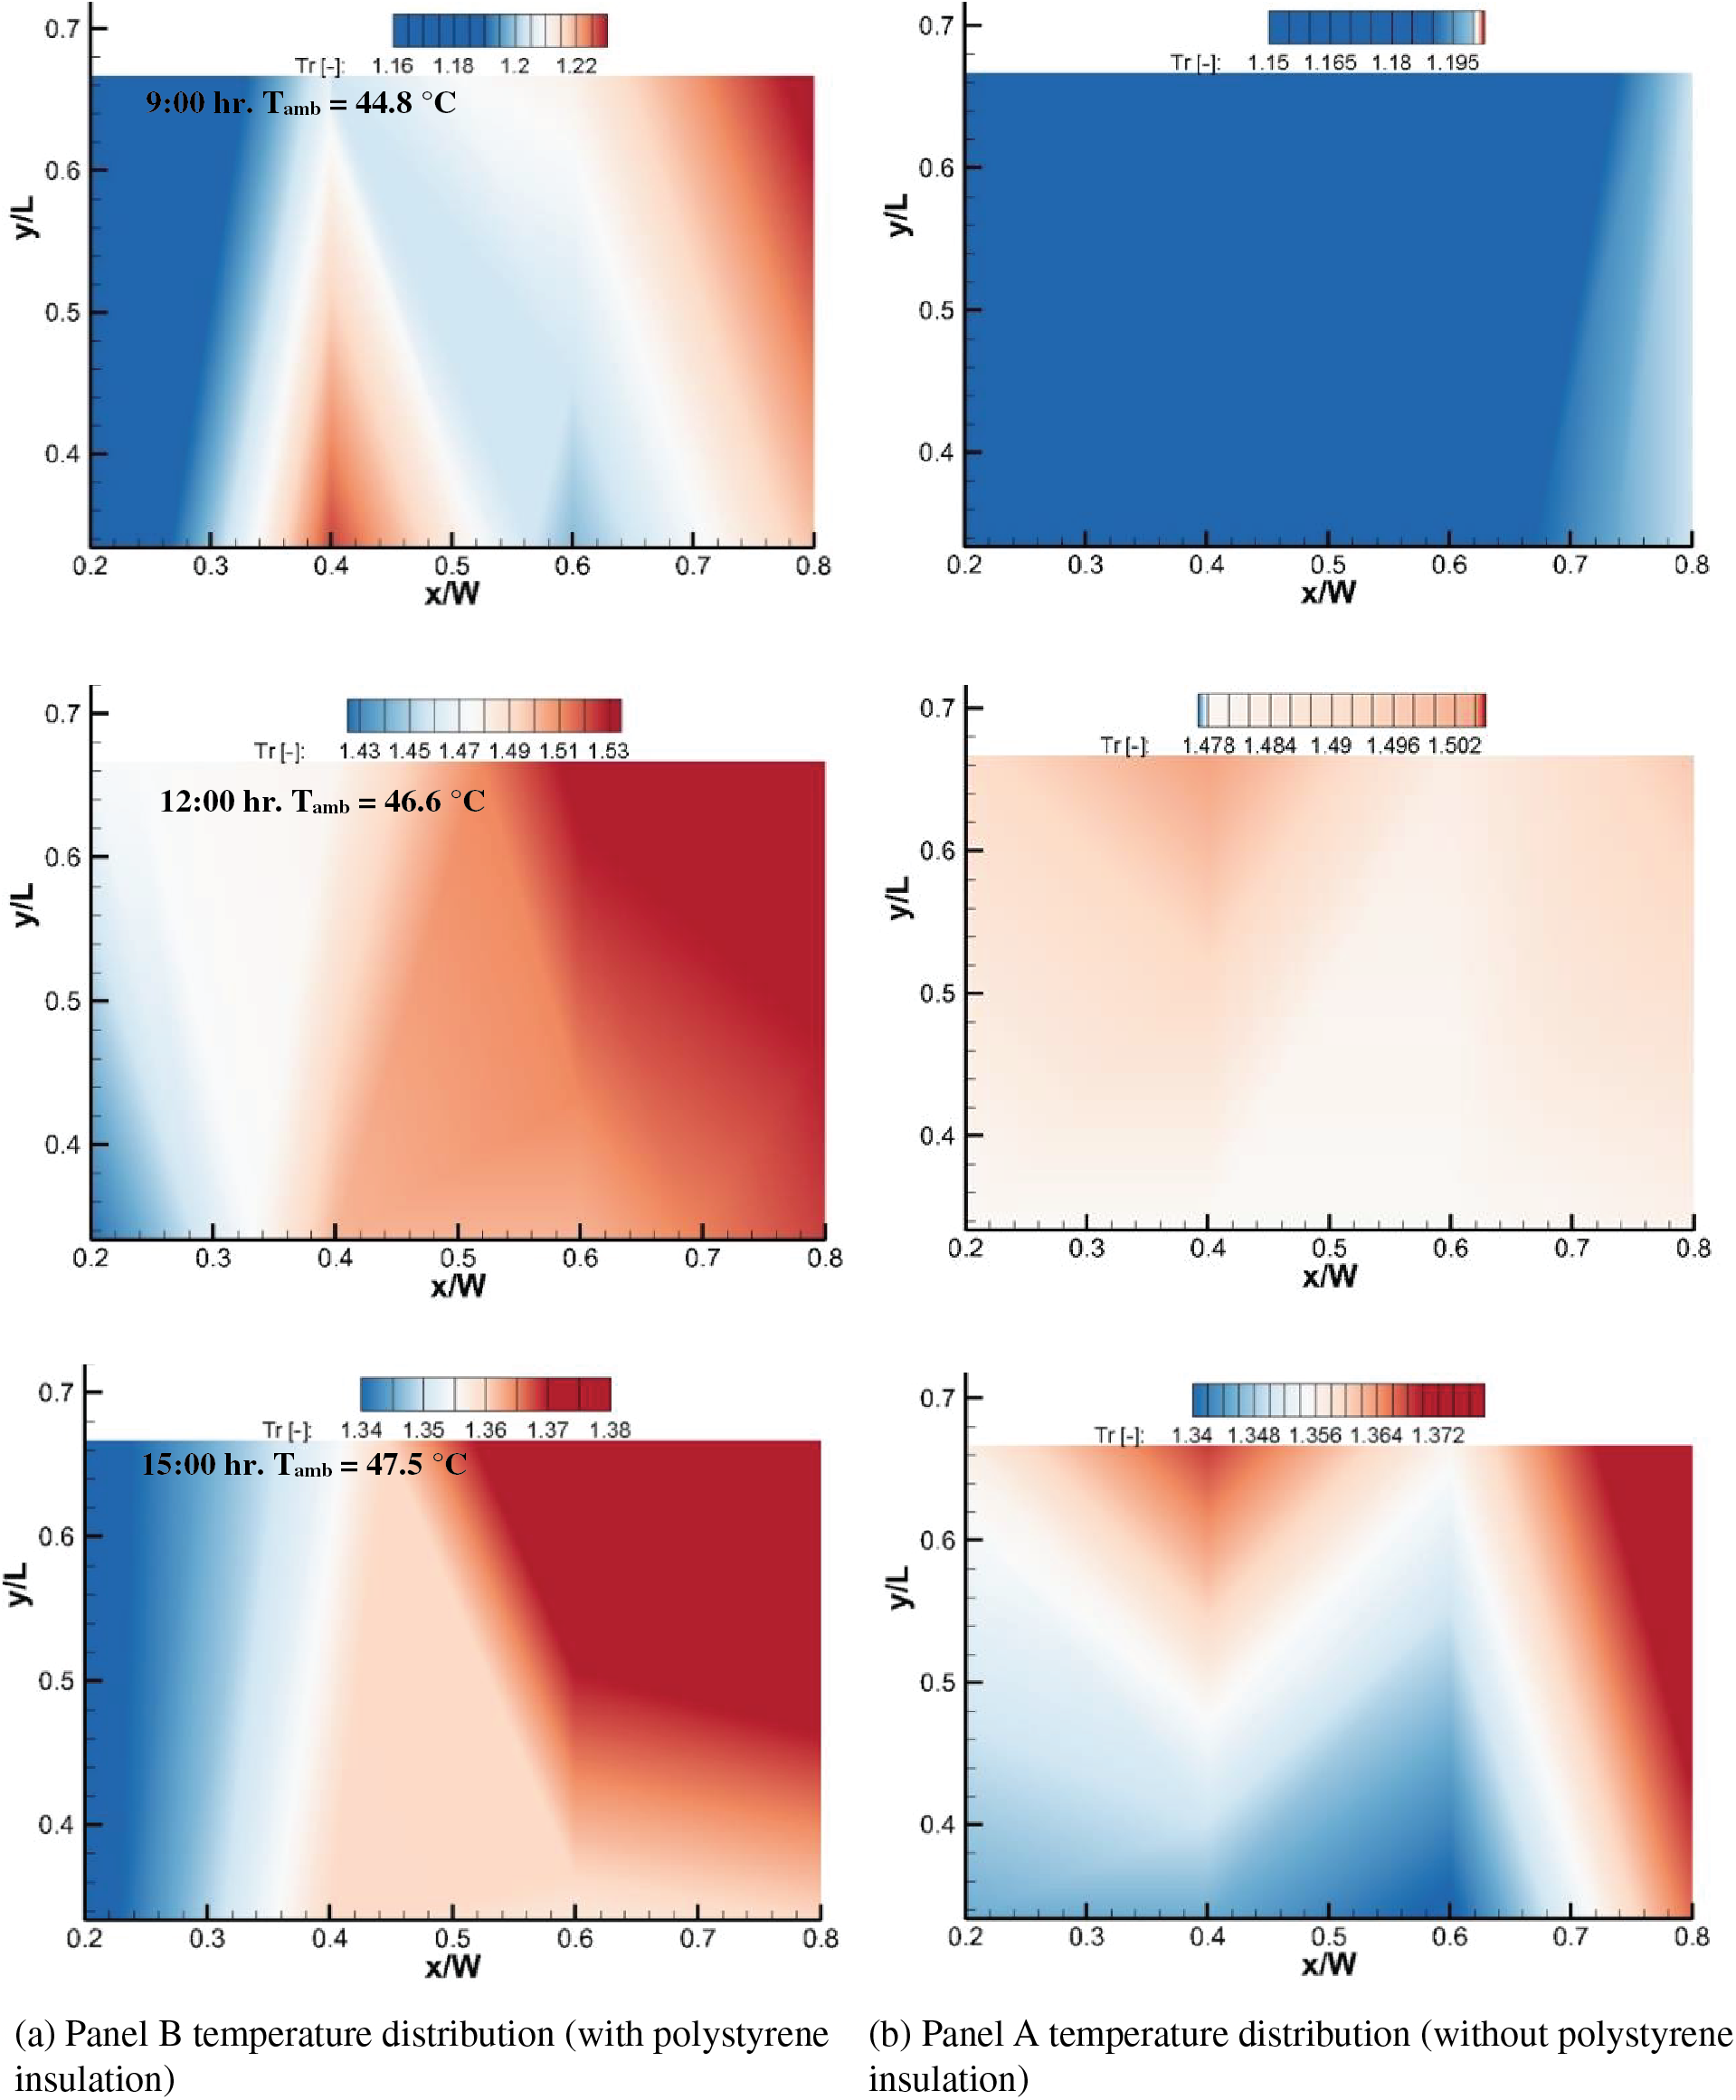
Figure 7: Temperature distribution (Tr) of the back surface of the PV panel with polystyrene board insulation as a rooftop covering
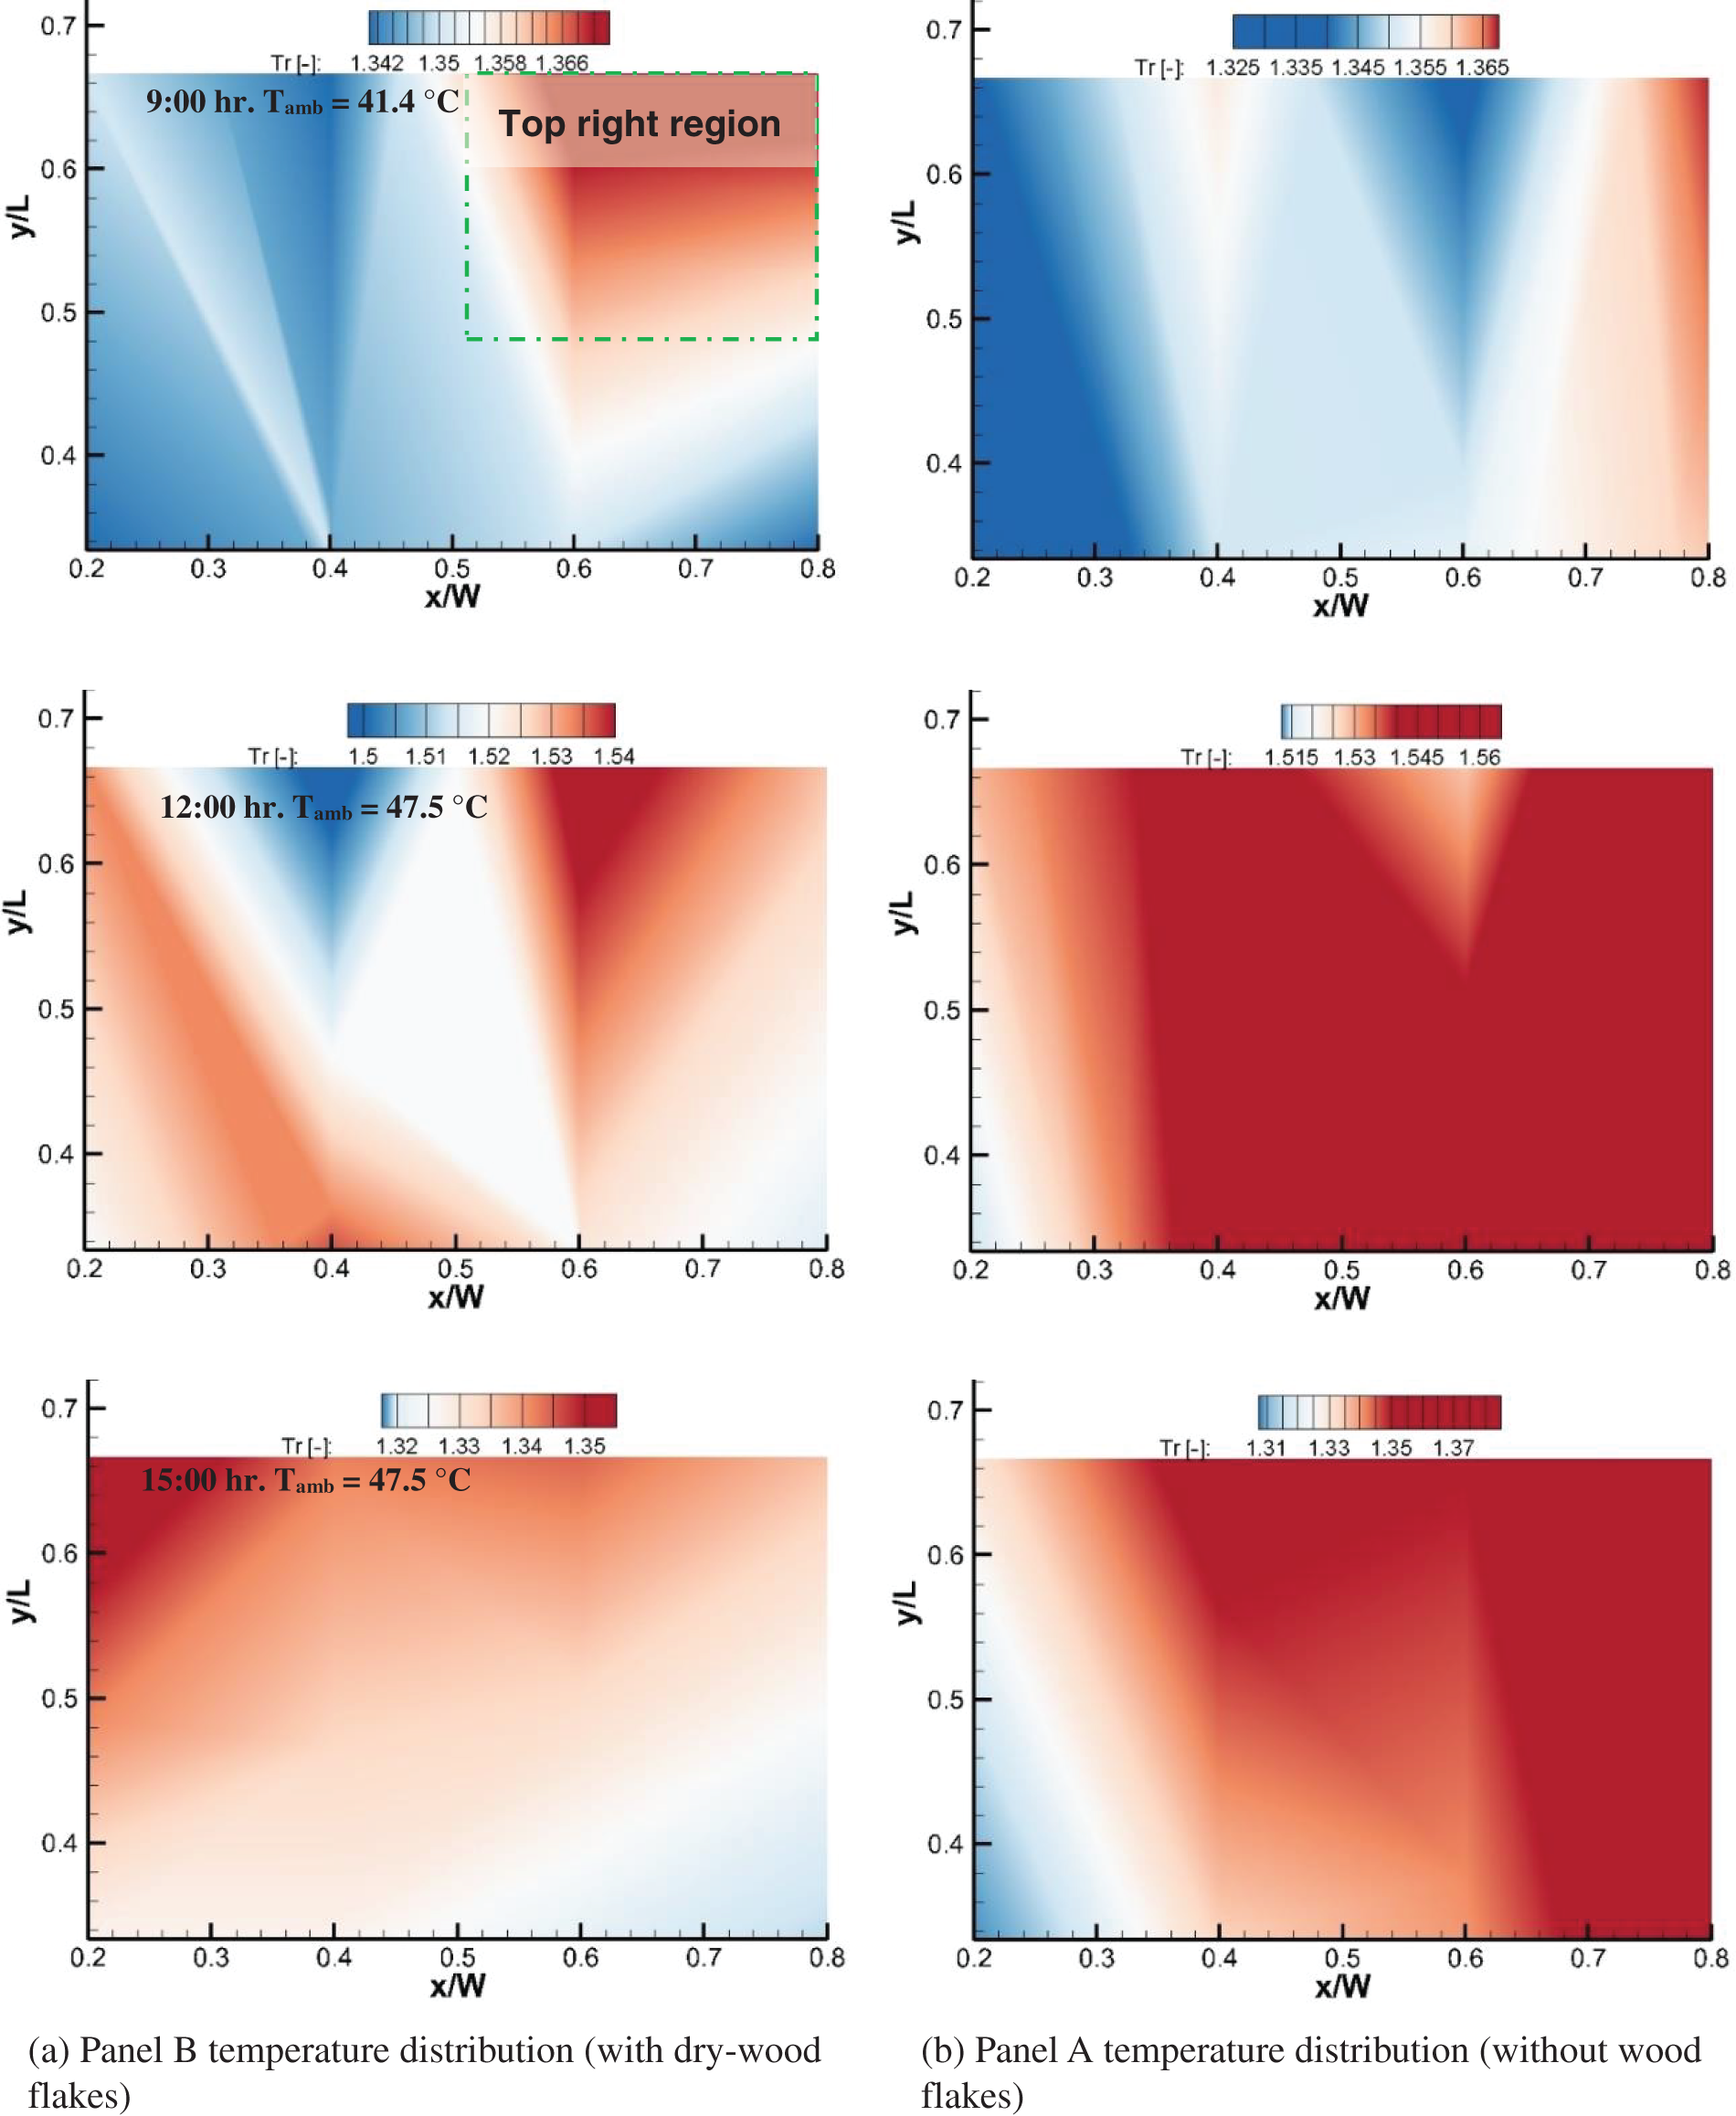
Figure 8: Temperature distribution (Tr) of the back surface of the PV panel with dry-wood flakes pack rooftop covering
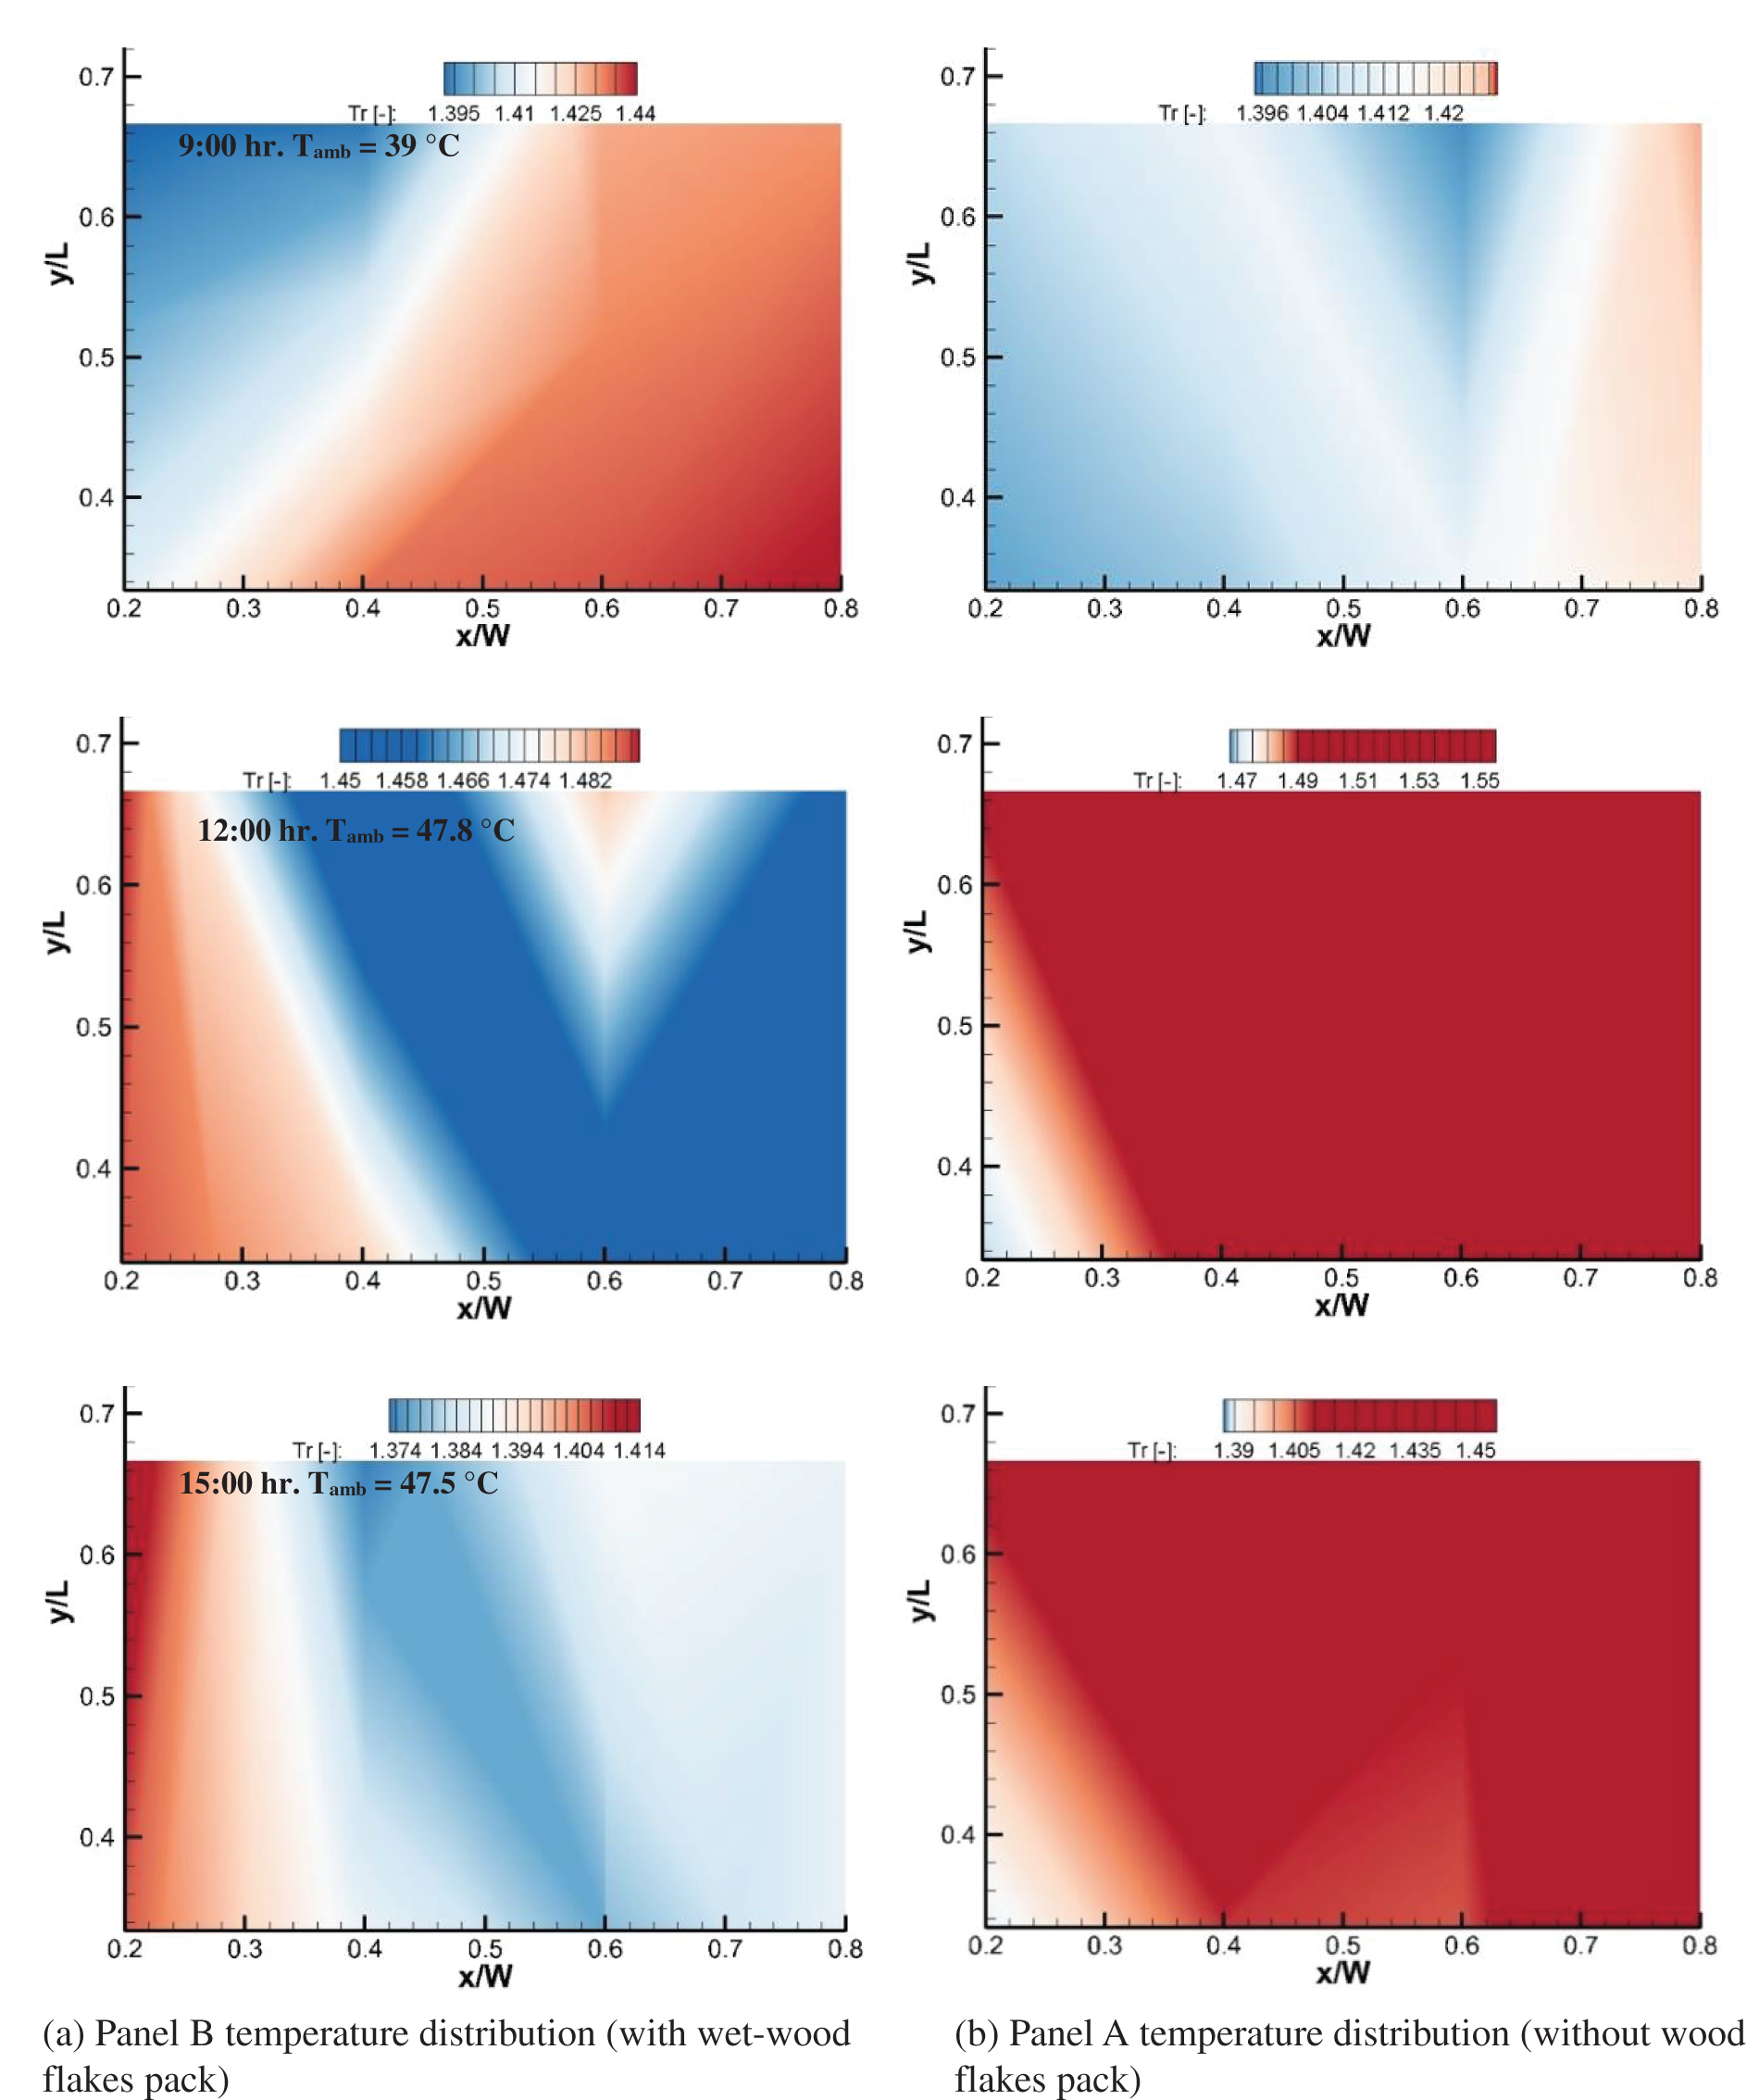
Figure 9: Temperature distribution (Tr) of the back surface of the PV panel with wet wood flakes pack rooftop covering
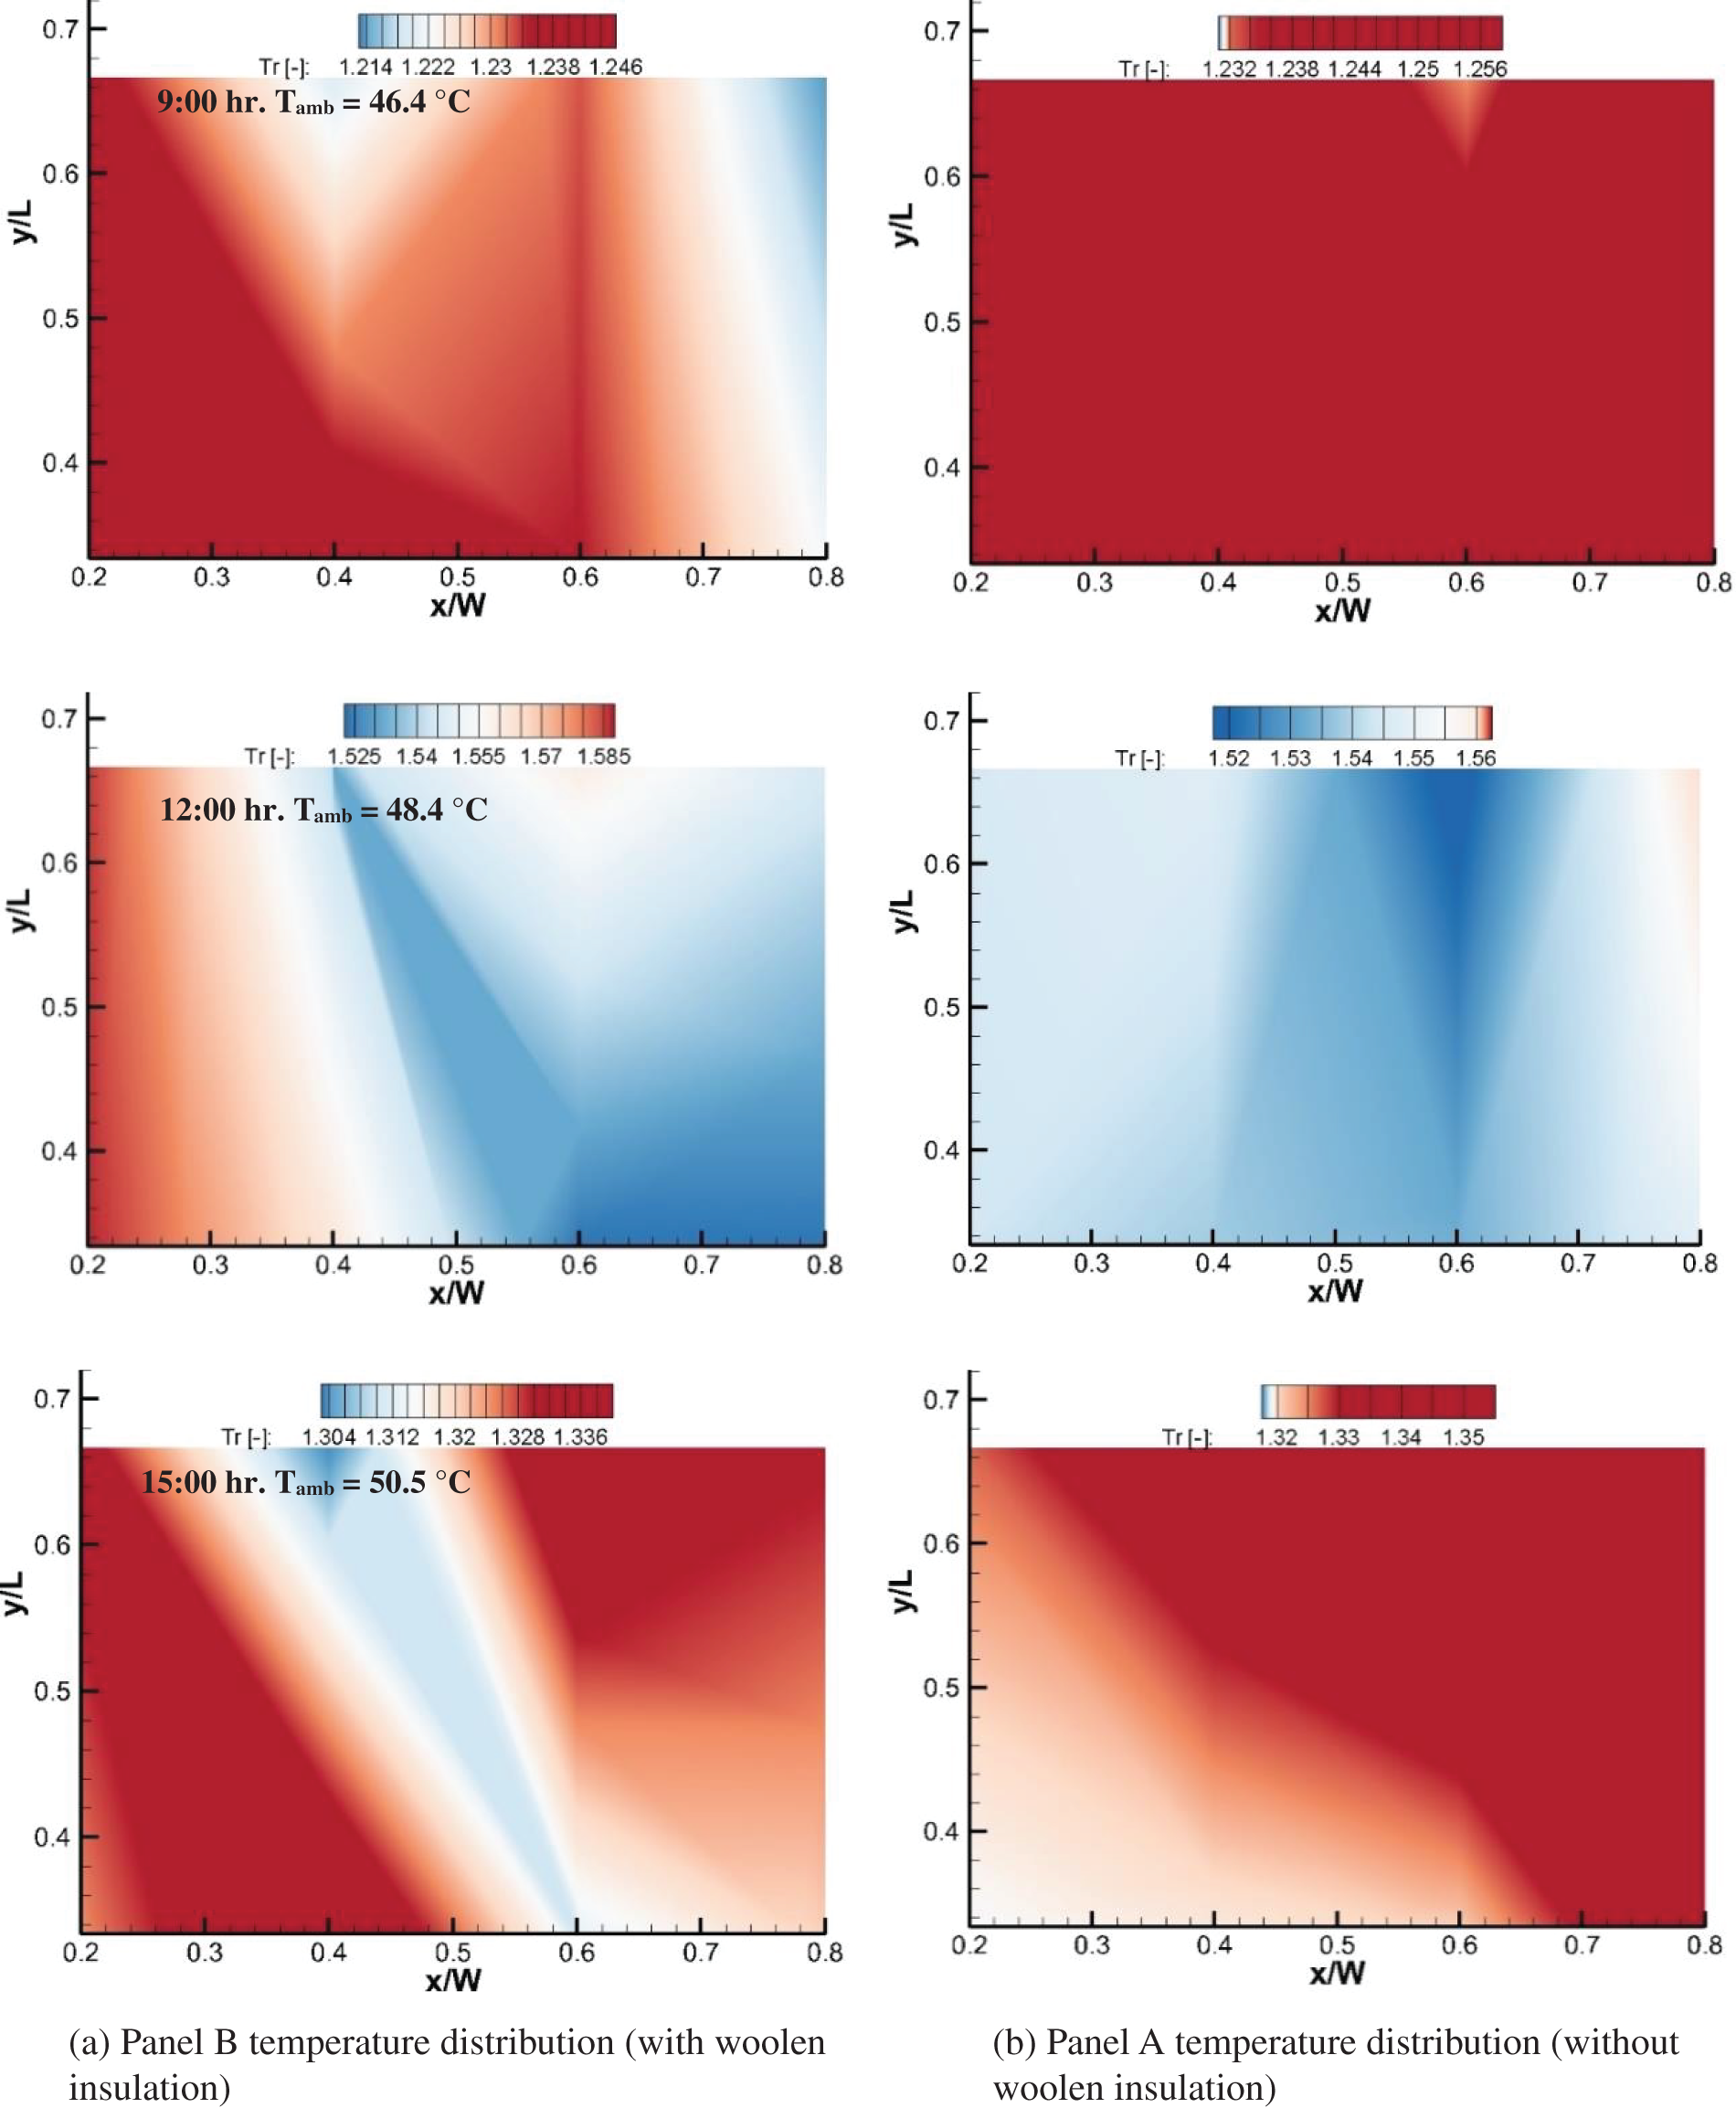
Figure 10: Temperature distribution (Tr) of the back surface of the PV panel with woolen insulation rooftop covering
Moreover, adding water to the wood flakes also showed an increase in the temperature at 9:00 h. over the same side of the PV panel, Fig. 9. However, a noticeable decrease in the temperature was observed at 12:00 h and 15:00 h, Fig. 9. Making the dry wood flakes wet causes an evaporation of the water. It decreases the temperature at the lower region of the PV panel (Fig. 6), compared to the panel without insulation and the dry one, Figs. 8 and 9.
A small reduction in the temperature was measured for the PV panel with the woolen insulation compared with the clear one, Fig. 10. Although it performs better than the PV panels with polystyrene insulation, the shiny surface of this type of material also reduces the temperature level, Fig. 2c. Based on the value of Tr at 12:00 h. (which represents the highest level of solar irradiance recorded (Imin = 1099.1 W/m2 and Imax = 1208.1 W/m2)) better the selected materials, the wet wooden flakes should the superior thermal performance with averaged Tr of 1.46. It should be mentioned that Tr at 18:00 h was ignored during the results as it was found that the temperature of the PV panels is almost equal to the ambient temperature at this time of the year.
3.2 Impact on the Power Production
To ensure that the results were not compromised by design flaws or differences between the two PV panels (Panels A and B) shown in Fig. 1, voltage measurements were conducted without accounting for the impact of the chosen roof covering. In Fig. 11, Panel B produces a higher voltage rate than Panel A, with a maximum difference of 0.21 V at 12:00 h and a lower variation of 0.07 V at 9:00 h. This difference will be considered during the discussion of the results. It should be mentioned that the reading at 19:00 h. was neglected in this comparison as no voltage was recorded due to the low level of sunlight.
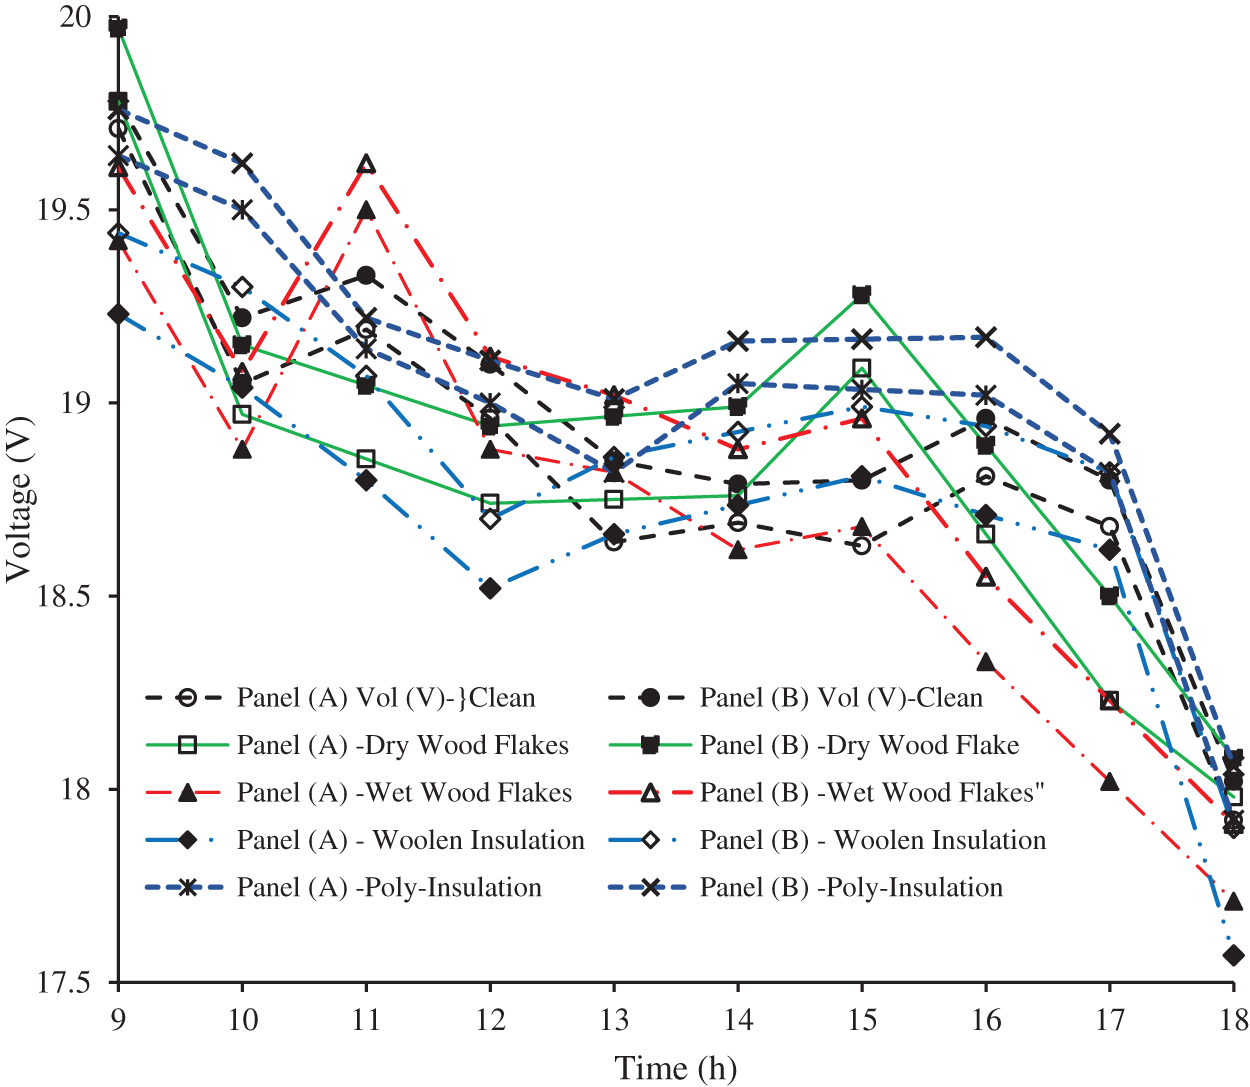
Figure 11: Voltage variation with time (h) between the two employed PV panels; the measurements were taken with and without adding roof covering
Apart from the measurement at 09:00 and 18:00 h, adding the Polystyrene board rooftop covering showed a decrease in the voltage compared with the clean panel during most of the day times Fig. 11. It can be seen that the maximum improvement in the voltage becomes 0.15 V, Fig. 12, as compared with the clean one. This is attributed to the increase in the temperature of the PV panels after adding the insulation board, as shown in Fig. 7. A significant improvement in the voltage production of Panel B was noted when the dry wood flakes, Figs. 11 and 12, with a maximum difference between the two panels of 0.27 V at 17:00 h. This increase is supported by the reduction in the PV panel temperature as depicted in Fig. 8. Making the wood flakes wet showed an improvement in the voltage of the PV panels B, Fig. 11. The maximum variation was recorded as 0.29 V at 16:00 h, Fig. 12. This is regarded as the noticeable reduction in the panel temperature after adding this material, as shown above. At 18:00 h, when the woolen insulation was, the greatest increase in the voltage was measured by 0.32 V, Figs. 11 and 12. This is because, at this time, solar radiation has reached its lowest level of about 85 W/m2. The roof’s surface starts dissipating the stored heat, and the presence of the insulation prevents Panel B from gaining heat compared with A. This behavior recognizes this type of insulation as all the rest of the material can only block part of the rooftop heat.
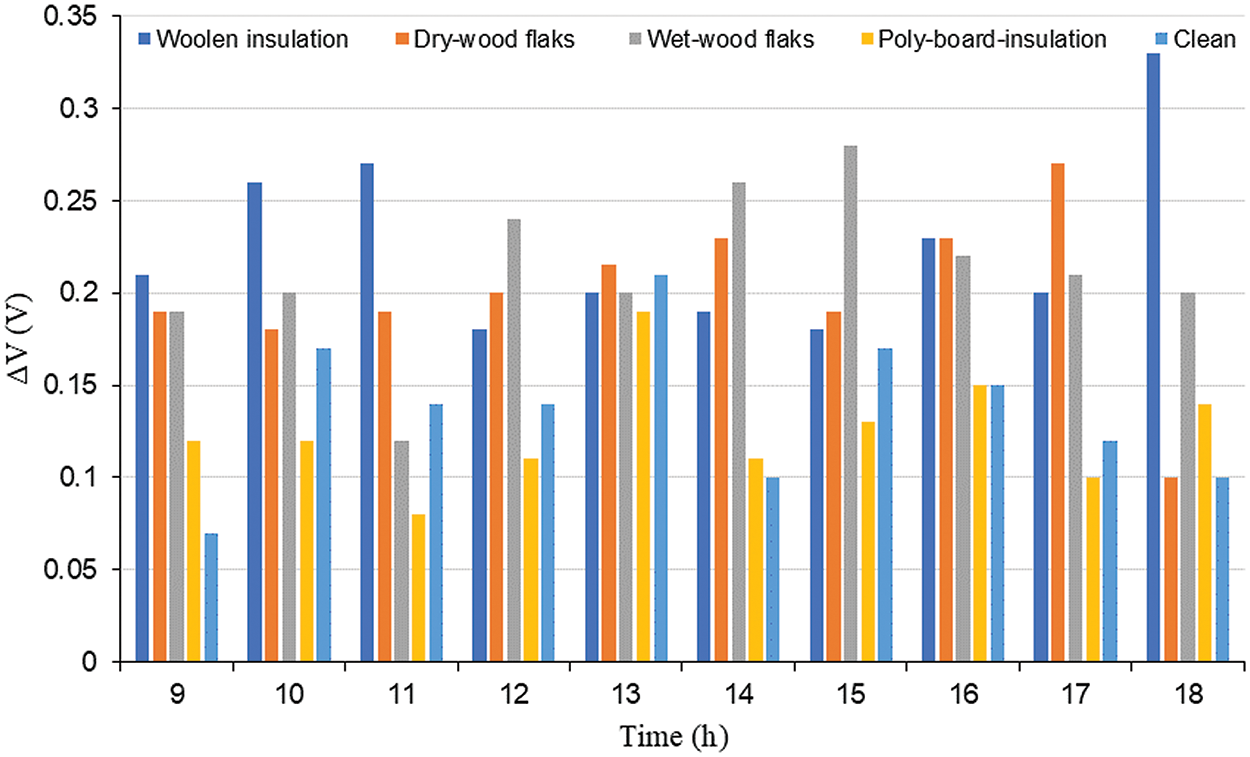
Figure 12: Voltage difference between the employed PV panels, with the selected covering materials compared with the clean one
The conversion efficiency of PV panels was calculated using Eq. (1). Fig. 13 compares Panels A and B efficiency after adding the roof covering materials. The results showed a high efficiency rate in the early hours of the day and reduced efficiency during the midday from 12:00 to 14:00 due to the high-temperature level during this period, Fig. 13. The highest efficiency levels were captured after 15:00 to 18:00 h due to the cooling effect over the PV panels and decreased irradiation incidence. The addition of the roof covering also played a role in increasing efficiency. The highest improvement in efficiency was estimated at 18:00 h after installing the wet-wood-flakes with an increase of 5% and for the woolen insulation of about 12%, Fig. 13 compared with the reported value that uses water spray from 9%–22% [41]. The highest efficiency during the selected day was when the dry wood flakes were installed. However, this depends on the environmental conditions on that day.
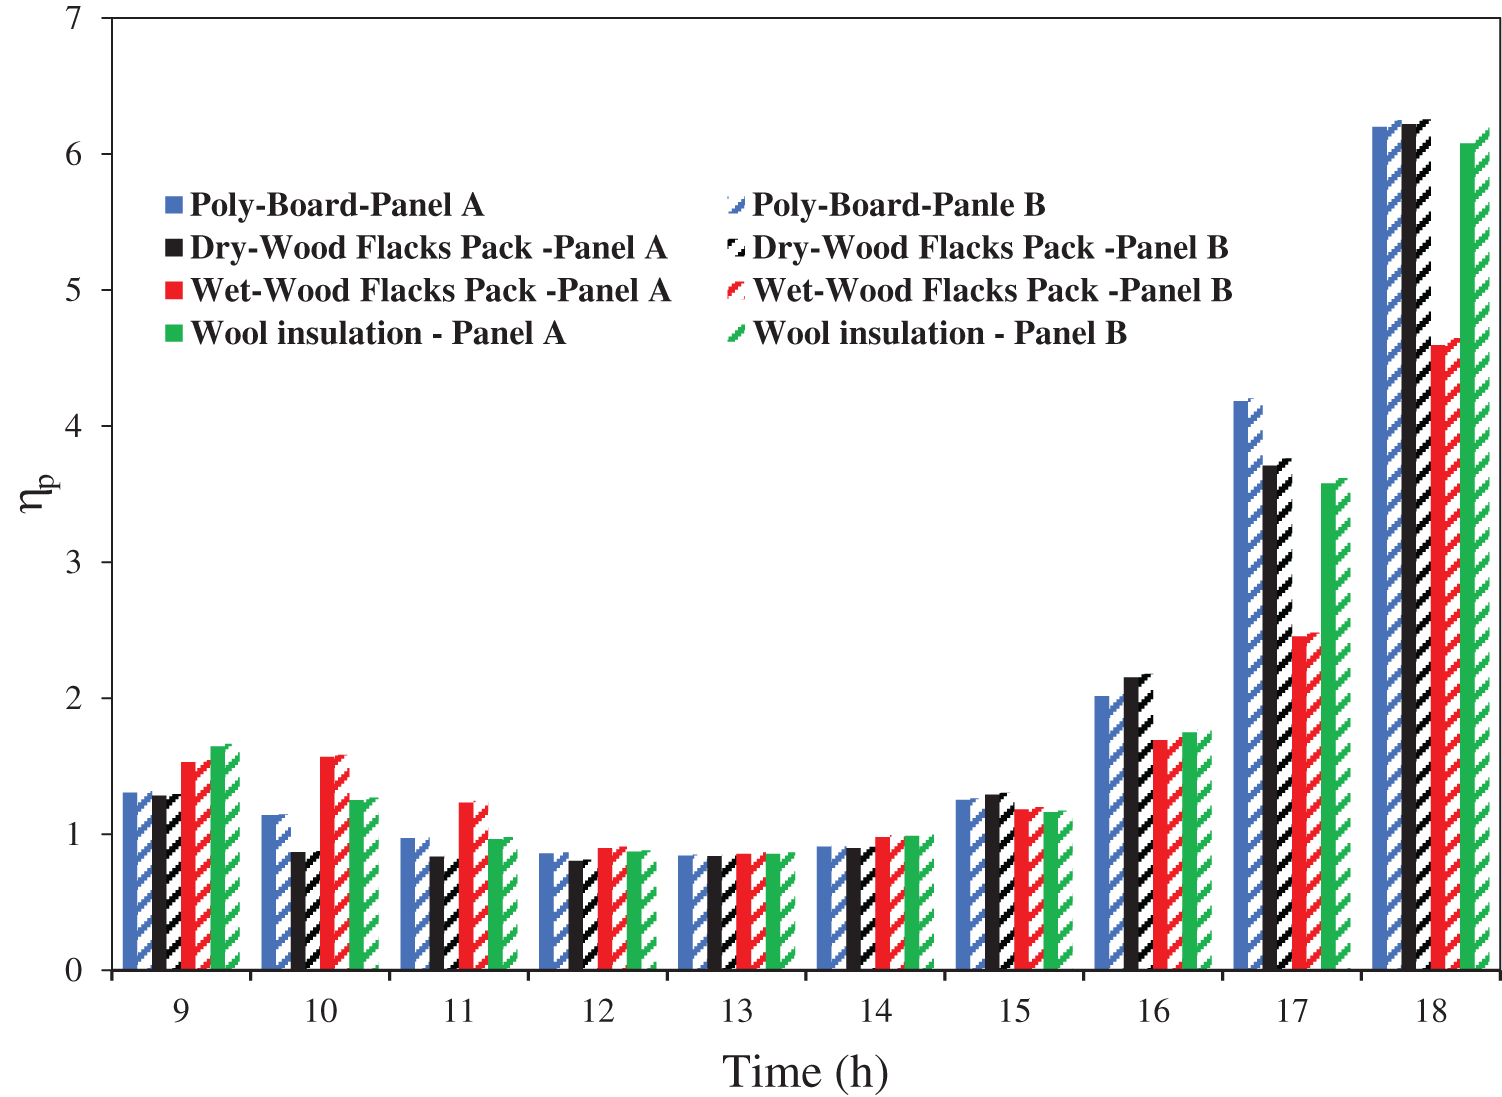
Figure 13: PV panel conversion efficiency with time after adding the roof covering, compared with the clean panel
To conclude, adding the roof covering improves the panels’ performance. The best roof covering among the selected materials in the current work was wet-wood flakes during the day and woolen insulation during the afternoon. This means that for larger-scale PV systems, the addition of one of the two roof coverings will enhance power production. Furthermore, it would be expected that for the wet wood flakes, as the area increases, the rate of water evaporation increases, producing cool air under the system and reducing the temperature even more. This result showed range improvement compared with the previous work, where the other rooftop converging technique showed an enhancement [28].
An experimental investigation was performed into the impact of the different types of rooftop covering materials on the temperature of the Photovoltaic panels and, consequently, the electrical efficiency. Four types of materials were selected: (wooden flake packs (dry and wet), insulation foam, and woolen insulation). Comparisons between two panels (clean and modified) were made over five days with and without installing the roof covering. The temperature variation and the conversion efficiency were evaluated. The results showed that placing the wet-wood-flakes lowered the surface temperature of the PV panel with a temperature reduction most of the day with a maximum drop of 0.8°C at 15:00 h, followed by a dry wood-flakes pack at 0.3°C at 17:00 h. The worst material was the polystyrene insulation, which had a higher temperature than the clean one, with a maximum temperature difference of 2.2°C at 14:00 h. The optimal performance was achieved by placing wet wooden flakes beneath the panels, resulting in a 5% increase in efficiency. Furthermore, woolen insulation provided a 12% boost in performance around sunset. This work suggests using wet–wood–flakes to enhance the performance of the PV panels installed over the rooftops of the building.
Acknowledgement: None.
Funding Statement: The authors received no specific funding for this study.
Author Contributions: The authors confirm their contribution to the paper as follows: study conception and design, data collection: Aws Al-Akam; analysis and interpretation of results: Ahmed A. Abduljabbar and Aws Al-Akam; draft manuscript preparation: Ali Jaber Abdulhamed. All authors reviewed the results and approved the final version of the manuscript.
Availability of Data and Materials: The data are available on request.
Ethics Approval: Not applicable.
Conflicts of Interest: The authors declare that they have no conflicts of interest to report regarding the present study.
References
1. A. Kumar Behura, A. Kumar, D. Kumar Rajak, C. I. Pruncu, and L. Lamberti, “Towards better performances for a novel rooftop solar PV system,” Sol. Energy, vol. 216, no. 2020, pp. 518–529, 2020. doi: 10.1016/j.solener.2021.01.045. [Google Scholar] [CrossRef]
2. Al-Monitor, “Iraq inches toward solar-powered future,” Accessed: Sep. 27, 2024. [Online]. Available: https://www.al-monitor.com/originals/2023/11/iraq-inches-toward-solar-powered-future [Google Scholar]
3. A. A. Kazem, M. T. Chaichan, and H. A. Kazem, “Dust effect on photovoltaic utilization in Iraq: Review article,” Renew. Sustain. Energ. Rev., vol. 37, pp. 734–749, 2014. doi: 10.1016/j.rser.2014.05.073. [Google Scholar] [CrossRef]
4. H. A. Kazem and M. T. Chaichan, “Status and future prospects of renewable energy in Iraq,” Renew. Sustain. Energ. Rev., vol. 16, no. 8, pp. 6007–6012, 2012. doi: 10.1016/j.rser.2012.03.058. [Google Scholar] [CrossRef]
5. H. Istepanian Harry, “Iraq solar energy: From dawn to dusk,” Friedrich-Ebert-Stiftung Jordan & Iraq, Jordan, 2020. Accessed: Aug. 20, 2024. [Online]. Available: https://library.fes.de/pdf-files/bueros/amman/16324-20200722.pdf [Google Scholar]
6. S. Kumari, A. Bhende, A. Pandit, and S. Rayalu, “Efficiency enhancement of photovoltaic panel by heat harvesting techniques,” Energy Sustain. Dev., vol. 73, pp. 303–314, 2023. doi: 10.1016/j.esd.2023.02.007. [Google Scholar] [CrossRef]
7. G. F. Al-Doori, R. A. Mahmood, A. Al-Janabi, A. M. Hassan, and G. T. Chala, “Impact of surface temperature of a photovoltaic solar panel on voltage production,” in Energy and Environment in the Tropics, Singapore: Springer Nature Singapore, 2023, pp. 81–93. doi: 10.1007/978-981-19-6688-0_6. [Google Scholar] [CrossRef]
8. P. M. Sivaram, M. Premalatha, and A. Arunagiri, “Computational studies on the airflow developed by the building-integrated passive solar energy system,” J. Build. Eng., vol. 39, 2021, Art. no. 102250. doi: 10.1016/j.jobe.2021.102250. [Google Scholar] [CrossRef]
9. W. Salameh, C. Castelain, J. Faraj, R. Murr, H. El Hage and M. Khaled, “Improving the efficiency of photovoltaic panels using air exhausted from HVAC systems: Thermal modelling and parametric analysis,” Case Stud. Therm. Eng., vol. 25, 2021, Art. no. 100940. doi: 10.1016/j.csite.2021.100940. [Google Scholar] [CrossRef]
10. A. Shahsavar, I. Baniasad Askari, and A. Roohbakhsh Meyary Dovom, “Energy saving in buildings by using the exhaust air and phase change material for cooling of photovoltaic panels,” J. Build. Eng., vol. 53, 2022, Art. no. 104520. doi: 10.1016/j.jobe.2022.104520. [Google Scholar] [CrossRef]
11. L. Micheli, K. S. Reddy, and T. K. Mallick, “Plate micro-fins in natural convection: An opportunity for passive concentrating photovoltaic cooling,” Energy Proc., vol. 82, pp. 301–308, 2015. doi: 10.1016/j.egypro.2015.12.037. [Google Scholar] [CrossRef]
12. F. Bayrak, H. F. Oztop, and F. Selimefendigil, “Effects of different fin parameters on temperature and efficiency for cooling of photovoltaic panels under natural convection,” Sol. Energy, vol. 188, pp. 484–494, 2019. doi: 10.1016/j.solener.2019.06.036. [Google Scholar] [CrossRef]
13. A. M. Elbreki, K. Sopian, A. Fazlizan, and A. Ibrahim, “An innovative technique of passive cooling PV module using lapping fins and planner reflector,” Case Stud. Therm. Eng., vol. 19, 2020, Art. no. 100607. doi: 10.1016/j.csite.2020.100607. [Google Scholar] [CrossRef]
14. A. E. Kabeel, M. Abdelgaied, and R. Sathyamurthy, “A comprehensive investigation of the optimization cooling technique for improving the performance of PV module with reflectors under Egyptian conditions,” Sol. Energy, vol. 186, pp. 257–263, 2019. doi: 10.1016/j.solener.2019.05.019. [Google Scholar] [CrossRef]
15. C. Shen, F. Liu, S. Qiu, X. Liu, F. Yao and Y. Zhang, “Numerical study on the thermal performance of photovoltaic thermal (PV/T) collector with different parallel cooling channels,” Sustain. Energy Technol. Assess., vol. 45, 2021, Art. no. 101101. doi: 10.1016/j.seta.2021.101101. [Google Scholar] [CrossRef]
16. Z. Özcan, M. Gülgün, E. Şen, N. Y. Çam, and L. Bilir, “Cooling channel effect on photovoltaic panel energy generation,” Sol. Energy, vol. 230, pp. 943–953, 2021. doi: 10.1016/j.solener.2021.10.086. [Google Scholar] [CrossRef]
17. A. S. Kaiser, B. Zamora, R. Mazón, J. R. García, and F. Vera, “Experimental study of cooling BIPV modules by forced convection in the air channel,” Appl. Energy, vol. 135, pp. 88–97, 2014. doi: 10.1016/j.apenergy.2014.08.079. [Google Scholar] [CrossRef]
18. A. Hussien, A. Eltayesh, and H. M. El-Batsh, “Experimental and numerical investigation for PV cooling by forced convection,” Alex. Eng. J., vol. 64, pp. 427–440, 2023. doi: 10.1016/j.aej.2022.09.006. [Google Scholar] [CrossRef]
19. A. Shrivastava et al., “A study on the effects of forced air-cooling enhancements on a 150 W solar photovoltaic thermal collector for green cities,” Sustain. Energy Technol. Assess., vol. 49, 2022, Art. no. 101782. doi: 10.1016/j.seta.2021.101782. [Google Scholar] [CrossRef]
20. S. Benzarti, M. Chaabane, H. Mhiri, and P. Bournot, “Performance improvement of a naturally ventilated building integrated photovoltaic system using twisted baffle inserts,” J. Build. Eng., vol. 53, 2022, Art. no. 104553. doi: 10.1016/j.jobe.2022.104553. [Google Scholar] [CrossRef]
21. S. V. Hudişteanu, F. E. Ţurcanu, N. C. Cherecheş, C. G. Popovici, M. Verdeş and I. Huditeanu, “Enhancement of PV panel power production by passive cooling using heat sinks with perforated fins,” Appl. Sci., vol. 11, no. 23, 2021, Art. no. 11323. doi: 10.3390/app112311323. [Google Scholar] [CrossRef]
22. U. J. Rajput and J. Yang, “Comparison of heat sink and water type PV/T collector for polycrystalline photovoltaic panel cooling,” Renew. Energy, vol. 116, pp. 479–491, 2018. doi: 10.1016/j.renene.2017.09.090. [Google Scholar] [CrossRef]
23. A. Aldossary, S. Mahmoud, and R. Al-Dadah, “Technical feasibility study of passive and active cooling for concentrator PV in harsh environment,” Appl. Therm. Eng., vol. 100, pp. 490–500, 2016. doi: 10.1016/j.applthermaleng.2016.02.023. [Google Scholar] [CrossRef]
24. C. G. Popovici, S. V. Hudişteanu, T. D. Mateescu, and N. C. Cherecheş, “Efficiency improvement of photovoltaic panels by using air cooled heat sinks,” Energy Proc., vol. 85, pp. 425–432, 2016. doi: 10.1016/j.egypro.2015.12.223. [Google Scholar] [CrossRef]
25. M. Awad, A. Radwan, O. Abdelrehim, M. Emam, A. N. Shmroukh and M. Ahmed, “Performance evaluation of concentrator photovoltaic systems integrated with a new jet impingement-microchannel heat sink and heat spreader,” Sol. Energy, vol. 199, pp. 852–863, 2020. doi: 10.1016/j.solener.2020.02.078. [Google Scholar] [CrossRef]
26. A. Radwan, S. Ookawara, and M. Ahmed, “Analysis and simulation of concentrating photovoltaic systems with a microchannel heat sink,” Sol. Energy, vol. 136, pp. 35–48, 2016. doi: 10.1016/j.solener.2016.06.070. [Google Scholar] [CrossRef]
27. Z. Gholami, M. H. Rahmati, A. Arabhosseini, and M. Gharzi, “Combined cooling of photovoltaic module integrated with thermoelectric generators, by using earthenware water tank and ultrasonic humidifier: An experimental study,” Sustain. Energy Technol. Assess., vol. 53, 2022, Art. no. 102601. doi: 10.1016/j.seta.2022.102601. [Google Scholar] [CrossRef]
28. C. Lamnatou and D. Chemisana, “Photovoltaic-green roofs: A life cycle assessment approach with emphasis on warm months of Mediterranean climate,” J. Clean. Prod., vol. 72, pp. 57–75, 2014. doi: 10.1016/j.jclepro.2014.03.006. [Google Scholar] [CrossRef]
29. K. Dimond and A. Webb, “Sustainable roof selection: Environmental and contextual factors to be considered in choosing a vegetated roof or rooftop solar photovoltaic system,” Sustain. Cities Soc., vol. 35, pp. 241–249, 2017. doi: 10.1016/j.scs.2017.08.015. [Google Scholar] [CrossRef]
30. T. Baumann, H. Nussbaumer, M. Klenk, A. Dreisiebner, F. Carigiet and F. Baumgartner, “Photovoltaic systems with vertically mounted bifacial PV modules in combination with green roofs,” Sol. Energy, vol. 190, pp. 139–146, 2019. doi: 10.1016/j.solener.2019.08.014. [Google Scholar] [CrossRef]
31. G. Osma-Pinto and G. Ordóñez-Plata, “Measuring factors influencing performance of rooftop PV panels in warm tropical climates,” Sol. Energy, vol. 185, pp. 112–123, 2019. doi: 10.1016/j.solener.2019.04.053. [Google Scholar] [CrossRef]
32. S. S. Bhuvad and Udayraj, “Investigation of annual performance of a building shaded by rooftop PV panels in different climate zones of India,” Renew. Energy, vol. 189, no. 9, pp. 1337–1357, 2022. doi: 10.1016/j.renene.2022.03.004. [Google Scholar] [CrossRef]
33. B. Ramkiran, C. K. Sundarabalan, and K. Sudhakar, “Sustainable passive cooling strategy for PV module: A comparative analysis,” Case Stud. Therm. Eng., vol. 27, no. 4, 2021, Art. no. 101317. doi: 10.1016/j.csite.2021.101317. [Google Scholar] [CrossRef]
34. D. Chemisana and C. Lamnatou, “Photovoltaic-green roofs: An experimental evaluation of system performance,” Appl. Energy, vol. 119, pp. 246–256, 2014. doi: 10.1016/j.apenergy.2013.12.027. [Google Scholar] [CrossRef]
35. A. M. Elbreki, M. A. Alghoul, K. Sopian, and T. Hussein, “Towards adopting passive heat dissipation approaches for temperature regulation of PV module as a sustainable solution,” Renew. Sustain. Energ. Rev., vol. 69, pp. 961–1017, 2017. doi: 10.1016/j.rser.2016.09.054. [Google Scholar] [CrossRef]
36. K. Mahmood, A. Hussain, M. Arslan, and B. Tariq, “Experimental investigation of impact of cool roof coating on bifacial and monofacial photovoltaic modules,” Eng. Proc., vol. 45, no. 1, 2023. doi: 10.3390/engproc2023045038. [Google Scholar] [CrossRef]
37. A. Solaimanian and R. Roshandel, “Effect of PV roof coverage on the lighting availability, heating, and cooling demands for a Venlo greenhouse in Tehran,” in 2023 8th Int. Conf. Technol. Energy Manag. (ICTEM), 2023, pp. 1–5. doi: 10.1109/ICTEM56862.2023.10083896. [Google Scholar] [CrossRef]
38. M. Al-Damook, K. Waleed Abid, A. Mumtaz, D. Dixon-Hardy, P. J. Heggs and M. Al Qubeissi, “Photovoltaic module efficiency evaluation: The case of Iraq,” Alex. Eng. J., vol. 61, no. 8, pp. 6151–6168, 2022. doi: 10.1016/j.aej.2021.11.046. [Google Scholar] [CrossRef]
39. M. Hasanuzzaman, A. B. M. A. Malek, M. M. Islam, A. K. Pandey, and N. A. Rahim, “Global advancement of cooling technologies for PV systems: A review,” Sol. Energy, vol. 137, pp. 25–45, 2016. doi: 10.1016/j.solener.2016.07.010. [Google Scholar] [CrossRef]
40. “Amp Solar,” Accessed: Sep. 27, 2024. [Online]. Available: https://www.amp-solar.com/amm150/en [Google Scholar]
41. M. A. Akrouch, K. Chahine, J. Faraj, F. Hachem, C. Castelain and M. Khaled, “Advancements in cooling techniques for enhanced efficiency of solar photovoltaic panels: A detailed comprehensive review and innovative classification,” Energy Built Environ., 2023. doi: 10.1016/j.enbenv.2023.11.002. [Google Scholar] [CrossRef]
Cite This Article
 Copyright © 2024 The Author(s). Published by Tech Science Press.
This work is licensed under a Creative Commons Attribution 4.0 International License , which permits unrestricted use, distribution, and reproduction in any medium, provided the original work is properly cited.


 Submit a Paper
 Propose a Special lssue
 View Full Text
 Download PDF
 Downloads
 Citation Tools