
 Submit a Paper
 Propose a Special lssue
 Open Access
ARTICLE

Assessment of Operational Performance in a Power Generation/Selling Integrated Company Using a Dynamic Proportional Adjustment Coefficient
1 Economics and Management College, Changsha University of Science and Technology, Changsha, 410114, China
2 Electrical and Information Engineering College, Changsha University of Science and Technology, Changsha, 410114, China
* Corresponding Author: Jingbin Wu. Email:
Energy Engineering 2024, 121(11), 3263-3287. https://doi.org/10.32604/ee.2024.054019
Received 16 May 2024; Accepted 14 September 2024; Issue published 21 October 2024
 View Full Text
 Download PDF
Abstract
Currently, the operational performance assessment system in the power market primarily focuses on power generation and electricity retail companies, lacking a system tailored to the operational characteristics of power generation/selling integrated companies. Therefore, this article proposes an assessment index system for assessing the operational performance of a power generation/selling integrated company, encompassing three dimensions: basic capacity, development potential, and external environment. A dynamic proportional adjustment coefficient is designed, along with a subjective and objective weighting model for assessment indexes based on a combined weighting method. Subsequently, the operational performance of an integrated company is assessed using extension theory. The results in the case study demonstrate the feasibility and effectiveness of the proposed dynamic proportional adjustment coefficient.Graphic Abstract
Keywords
Driven by recent electricity reform policies, power generation companies have actively expanded into electricity sale by leveraging their existing power generation capacity and accumulated customer resources, leading to the formation of power generation/selling integrated companies. Unlike standalone power generation or electricity retail companies, power generation/selling integrated companies consist of two organization levels: parent companies and subsidiaries. Subsidiaries handle specific power generation or electricity sales operations, while the parent company is tasked with assessing the overall operational performance of the integrated company.
The integrated resource structure has facilitated the growth of these integrated companies, allowing them to capture significant market share. According to the bilateral negotiation transaction results from a provincial power center for 2021 and 2022, these integrated companies accounted for 80% of the electricity sales in the province. Notably, large power generation companies such as Huadian, Huaneng, and Datang have established power generation/selling integrated companies, dominating the top three trading positions [1]. Therefore, assessing the operational performance of these power generation/selling integrated companies and identifying areas for improvement is crucial for ensuring stable operations and promoting the healthy development of the electricity market.
Scholars worldwide have researched the assessment of the operational performance of electricity market participants. For power generation companies, several methods have been employed to assess market power and their size, leading to the development of performance evaluation index systems for conventional and auxiliary service transactions, particularly in the Guangdong and North China regional markets [2–4]. These systems have often been evaluated using a combination weighting method-matter-element model with a fixed proportional adjustment coefficient [5]. In response to national carbon reduction policies, low-carbon operational performance assessment systems have been developed for both thermal and renewable energy generation companies [6–7], also evaluated using the combination weighting method-matter-element model with the fixed proportional adjustment coefficient [8]. A comprehensive assessment system encompassing economic, social, and other metrics had been constructed to assess the investment benefits of various types of power generation companies [9–10], employing a combination weighting method-matter-element model with a fixed proportional adjustment coefficient [11].
For electricity retail companies, a core competitiveness evaluation method incorporating non-price factors and based on value chain analysis was proposed [12–13]. An assessment system for their operational performance was developed to assess business and transaction activities [14], using a combination weighting method-matter-element model with a fixed proportional adjustment coefficient [15]. Acknowledging the varying operational characteristics of different electricity retail companies, a comprehensive assessment system was constructed, examining operational, sales, and management metrics [16]. This system was evaluated using an improved matter-element model with a combination weighting method and a fixed proportional adjustment coefficient [17]. Furthermore, an integrated evaluation index system was developed to assess investment and operational benefits during the different stages of electricity retail company establishment and operation [18], evaluated using a combination weighting method-matter-element model with a fixed proportional adjustment coefficient [19].
The above analysis reveals that while the existing literature extensively explores the operational and investment performance of power generation and electricity retail companies, it predominantly focuses on each type separately, lacking a comprehensive study on the performance assessment of power generation/selling integrated companies. Power generation/selling integrated companies, which manage both generation and sales operations, exhibit operational characteristics that are more complex than the mere aggregation of their components. The dual-level organizational structure, consisting of parent and subsidiary entities, and the presence of internal transactions between power generation and retail units further complicate their operations. Existing performance assessment index systems are inadequate for comprehensively and objectively assessing the operational performance of integrated companies. Additionally, the fixed proportional adjustment coefficient models used in existing literature fail to capture the real-time effects of changing evaluation objectives and sample data on the coefficient value and, consequently, on the assessment results. Thus, there is a need to develop an operational performance assessment index system tailored to the unique organizational and operational characteristics of these companies and to enhance the current fixed-proportion adjustment coefficient model.
Therefore, this article proposes a comprehensive assessment index system for the operational performance of power generation/selling integrated companies, encompassing three dimensions: basic capabilities, development potential, and external environment, with a total of 23 assessment indexes across three levels. A dynamic proportional adjustment coefficient, accounting for varying objective requirements of the assessment system, is designed. A dynamic adjustment model for the subjective and objective weight proportions of assessment indexes is also established, integrating the fuzzy analytic hierarchy process (FAHP) and entropy weight method (EWM). On this basis, matter-element extension theory is applied to assess the operational performance of power generation/selling integrated companies. The feasibility and effectiveness of the dynamic proportional adjustment coefficient design are verified through case analysis.
2 Preparation Information for the Construction of an Assessment Index System for Power Generation/Selling Integrated Company
2.1 Definition and Operational Characteristics of Power Generation/Selling Integrated Company
Unlike foreign companies, which consolidate their power generation and selling functions into a single legal entity and participate in market transactions using an integrated decision-making model, Chinese independent power generation and electricity retail companies operate separately, each focusing solely on power generation or sales and making decisions independently to maximize their own interests. However, the current Chinese power generation/selling integrated company is organized as a parent-subsidiary enterprise cluster, based on a corporate system linked by equity relationships and covering both power generation and sales. At present, the parent company exercises absolute control over the board of its subsidiary power generation or electricity retail companies by holding a majority equity stake. While subsidiaries retain decision-making authority for power generation or sales transactions, this authority is influenced by the resolutions of the boards of directors, which are controlled by the parent company.
For example, in cooperative game scenarios between internal power generation and electricity retail companies, the parent company influences transaction decisions through the boards of the subsidiaries it controls. These decisions aim to maximize the overall profit of the integrated group, but may not optimize the individual profits of each subsidiary. At this stage, each subsidiary’s transaction profit is ensured to be at least at the Nash bargaining breakdown point, representing the maximum transaction profit achievable under non-cooperative conditions.
2.2 Basic Principles for Constructing an Index System
Developing an operational performance assessment index system for a power generation/selling integrated company should adhere to principles of comprehensiveness, objectivity, rationality, representativeness, development potential, foresight, and operational simplicity. Additionally, the indexes must account for the overall impact of internal/external potential and uncertain factors on the operational performance of the power generation/selling integrated company. In addition, the assessment system must also consider the organizational and operational characteristics of the power generation/selling integrated company. Firstly, the parent company manages its subsidiary power generation and electricity retail companies indirectly through their boards of directors. The alignment of their objectives and the extent of their involvement in subsidiary management impact the group’s overall operational performance. Secondly, since intermediate income and costs generated from transactions between the subsidiary power generation and electricity retail companies are considered fictitious, the associated generation costs and transaction income with end users are recorded in the operational performance of the integrated company.
2.3 Assessment Process of Index System
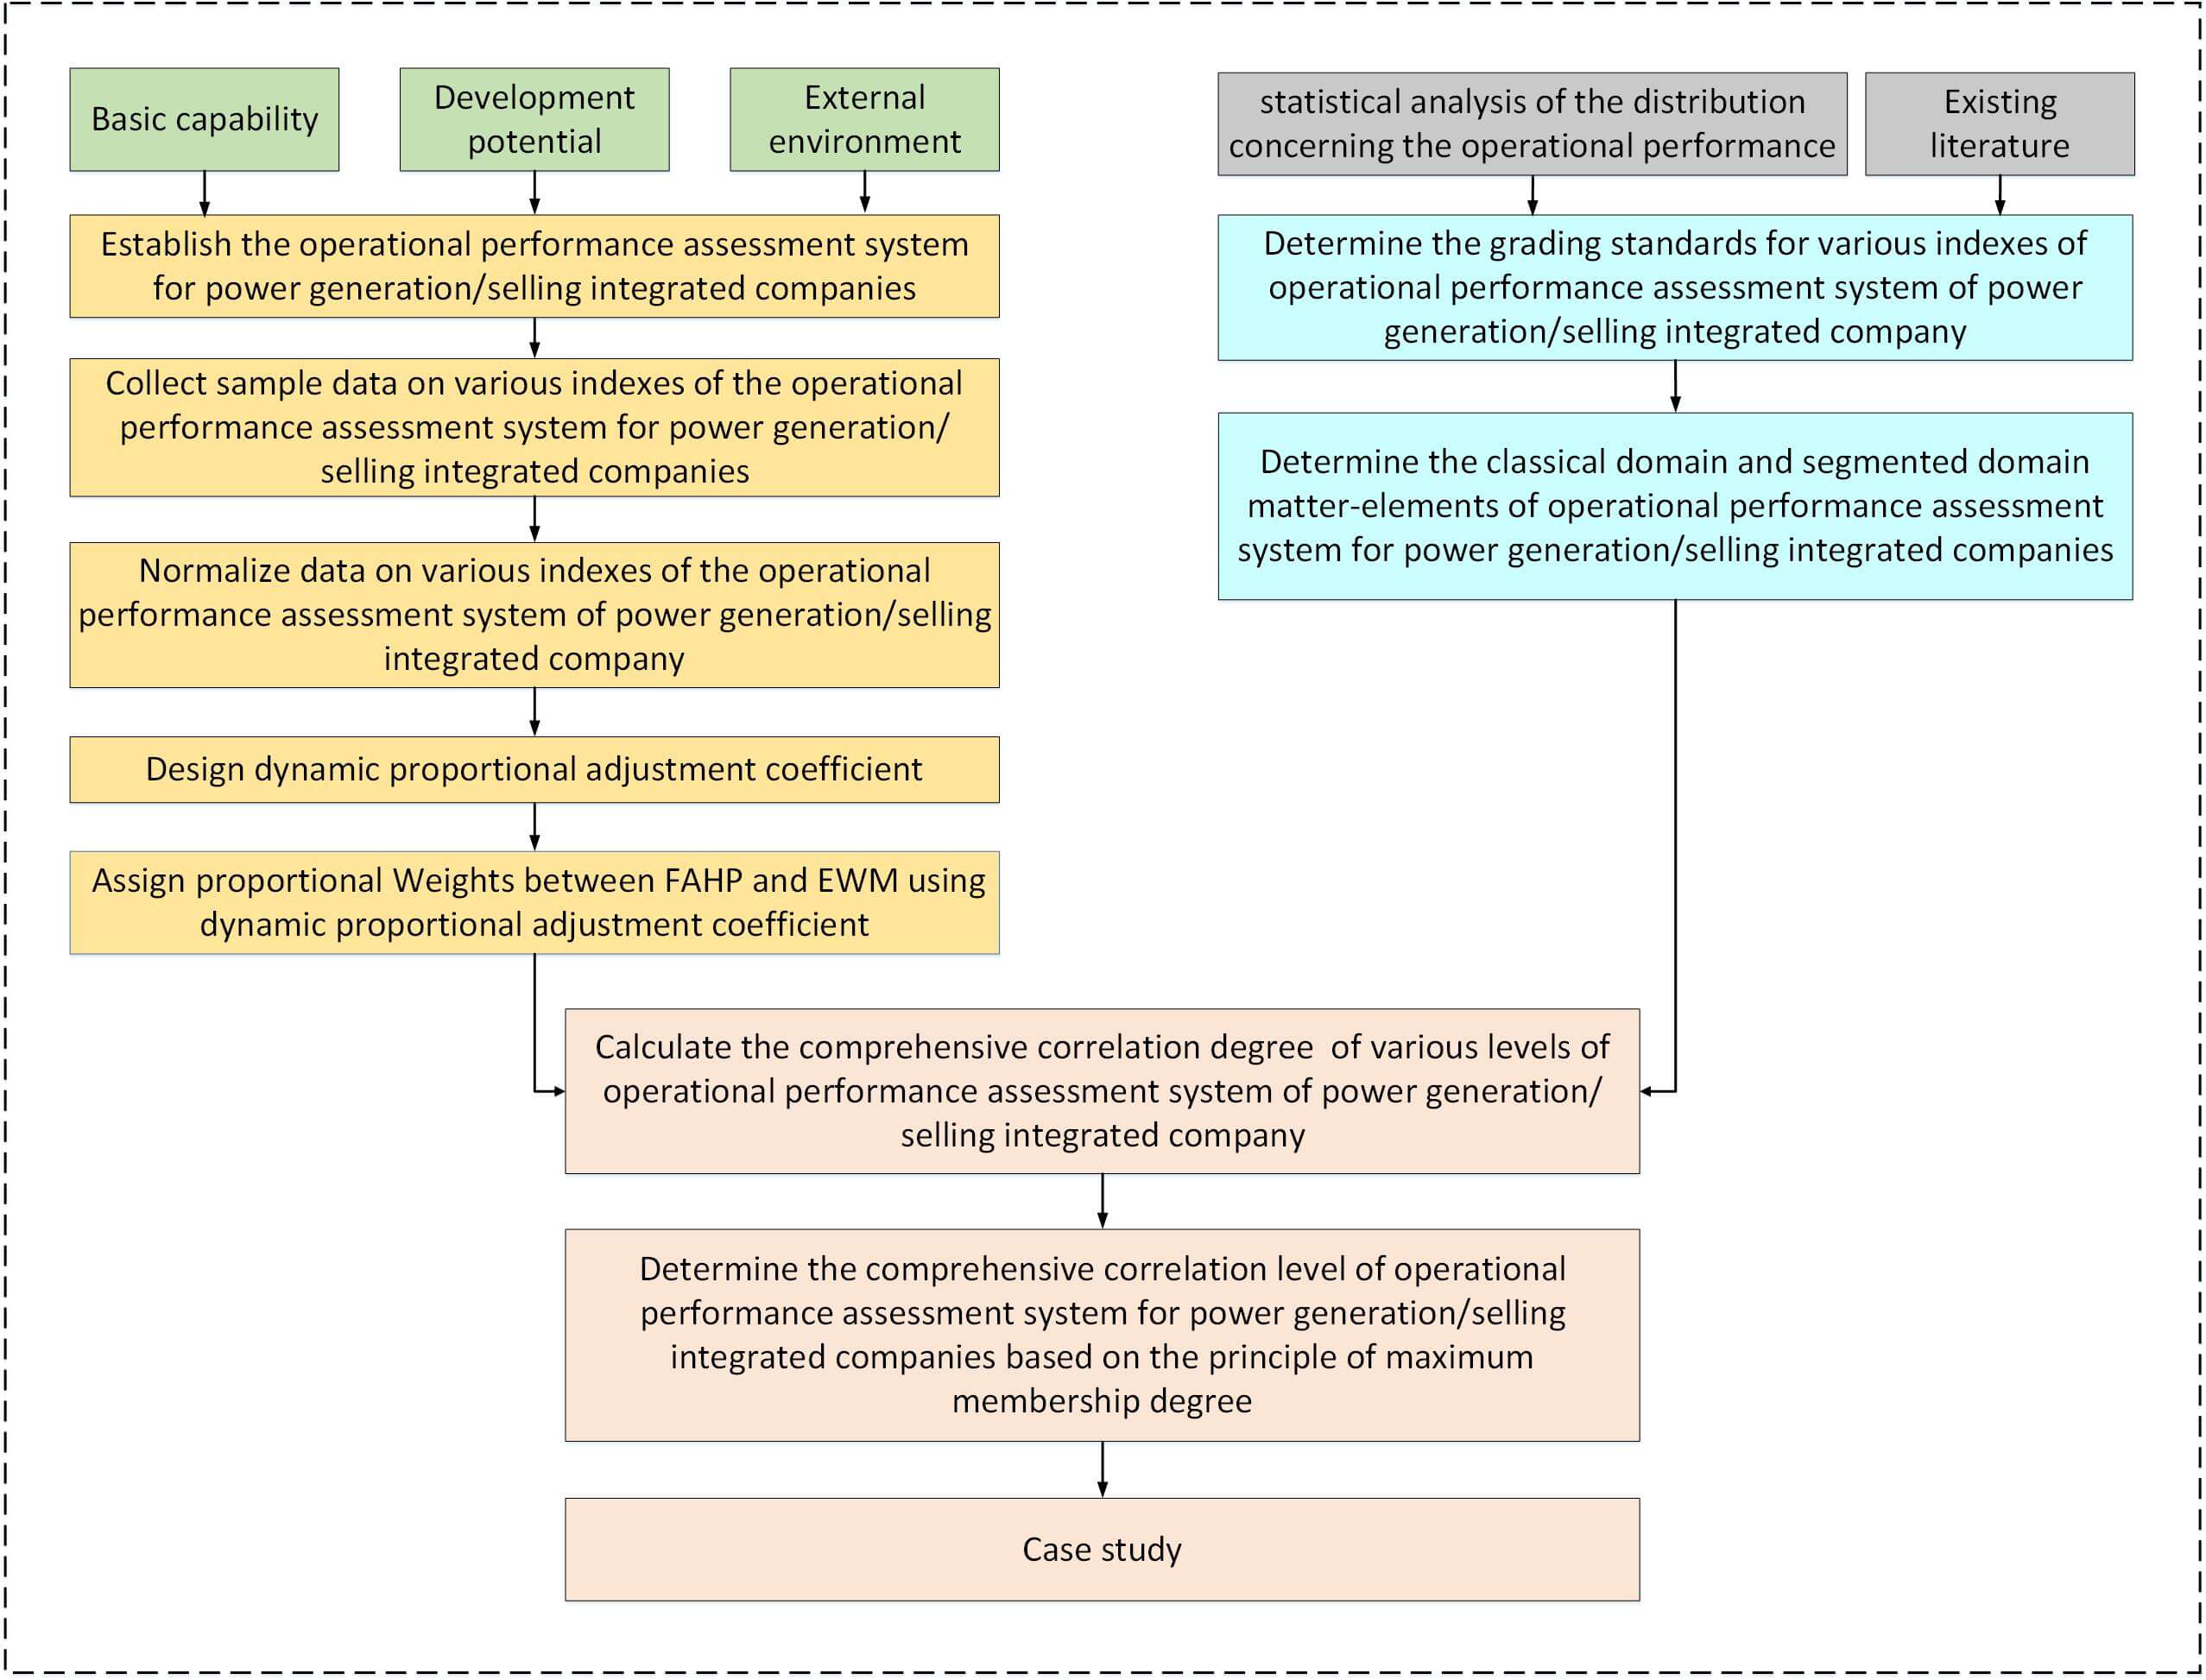
The assessment process for the operational performance of power generation/selling integrated companies is shown in Fig. 1.
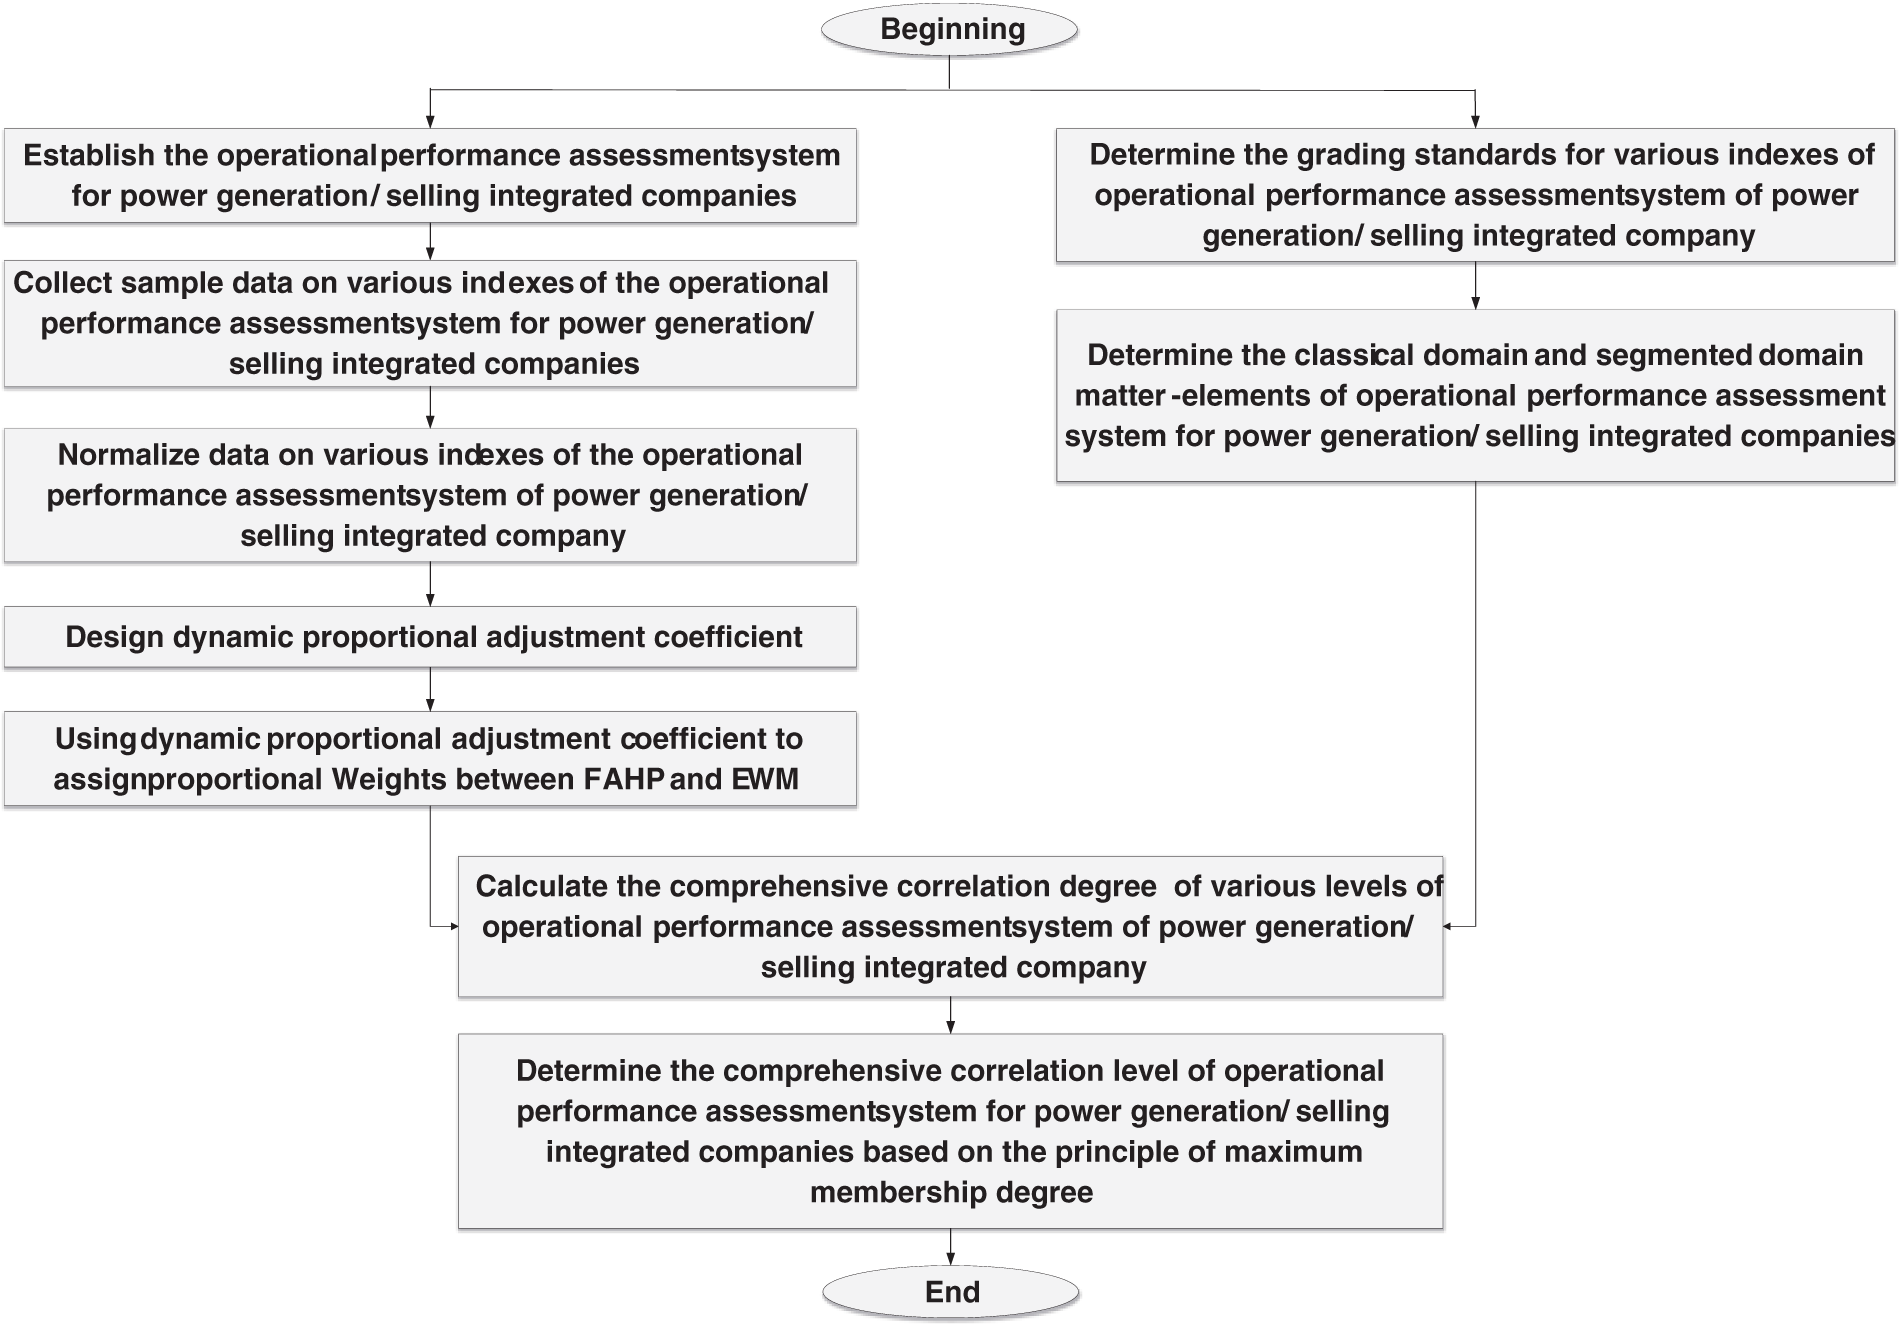
Figure 1: Assessment process for operation performance of the power generation/selling integrated company
3 Assessment Index System for Operational Performance of Power Generation/Selling Integrated Companies
3.1 Selection of Assessment Indexes
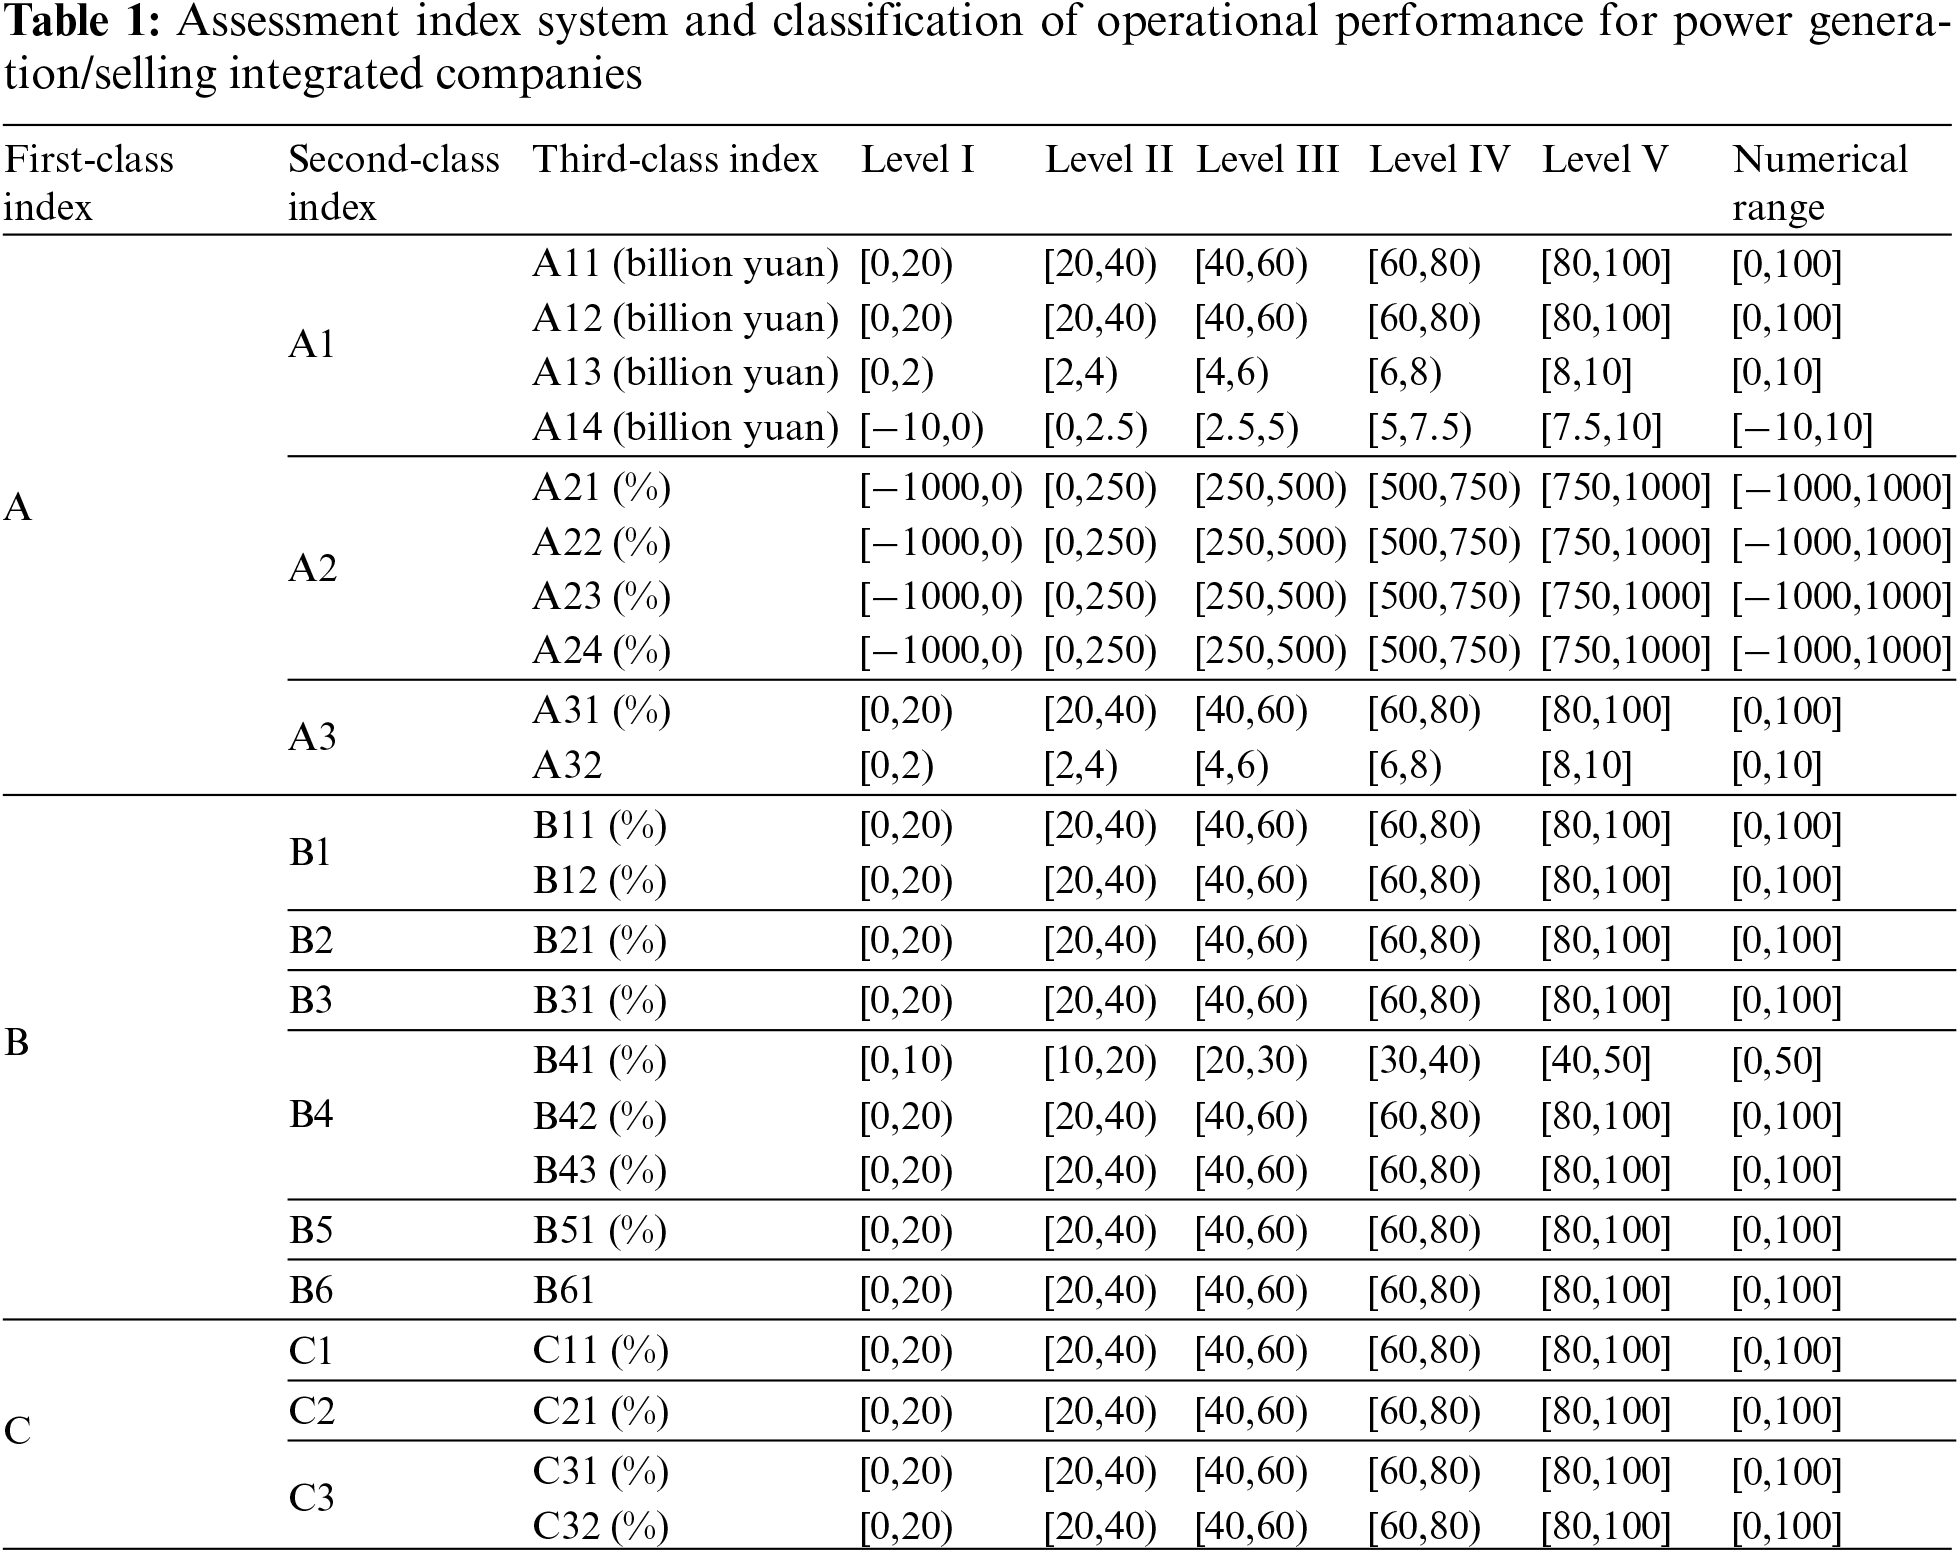
Following the principles outlined in Section 2.1 and considering the operational characteristics of the company, this study conducts a detailed analysis of typical power generation/selling integrated companies in a provincial electricity market from 2021 to 2023, collecting various factors that directly and indirectly impact their operational performance. Experts are consulted to rate and rank the degree of impact of various factors on operational performance, and important factors are selected based on the “80–20 principle”. A comprehensive assessment index system is developed, comprising 23 indexes across three dimensions: basic capacity, development potential, and external environment (calculation formulas for each index are omitted here). This system covers the full spectrum of research and development, production, sales, management, and service, while accounting for the timing, source attributes of the assessment indexes, and diverse perspectives within the electricity market. Among these, all secondary and tertiary indexes under basic capability, and all tertiary indexes under the technical and equipment capability indexes (all secondary indexes) under development potential, are quantitative. The remaining indexes are qualitative. A detailed list of all indexes is provided in Table 1.
In line with the approaches used for independent power generation or electricity retail companies, each assessment index is designed to fully reflect its relevance to the operational performance of integrated power generation and sales companies, and its alignment with the evolving development trajectory of the power industry [6]. Operational performance here refers to an organization’s comprehensive abilities in production and business activities, encompassing profitability, debt repayment ability, organizational efficiency, service capability, technical proficiency, creditworthiness, environmental impact, and more [7].
The indexes A11, A12, A13, A14, A21, A22, A23, and A24 assess the overall and incremental profitability levels of power generation/selling integrated companies, respectively. The indexes A31 and A32 assess long-term and short-term solvency [1], while indexes B11 and B12 measure the alignment of parent-subsidiary goals and actual organizational collaboration levels [1]. The index B21 assesses the service level [16], and index B41 assesses the response to market emergency transaction demands [5], such as upward/downward adjustment transactions, ancillary services, and orderly electricity consumption. The indexes B41, B42, and B43 examine the input and output technical levels considering the “dual carbon target” [6], and index B51 measures the level of renewable energy generation. Unlike conventional projects, which might assess metrics such as the ratio of research and development (R&D) funds to total funds, R&D personnel to total employees, and equipment loss rates [17–18], the indexes B41, B42, B43, and B51 are aligned with current electricity market trends, focusing on the “dual carbon goals” and renewable energy to provide a forward-looking assessment of operational performance [6]. The index B61 examines the overall credit level [16]; and indexes C11, C21, C31, and C32 examine market competition, government regulation, and bank credit tightness [20].
Of the indexes mentioned above, B31, B41, B42, B43, B51, B61, C11, C21, C31, and C32 are specifically tailored to power generation/selling integrated companies to foster healthy and stable development in the electricity market, accounting for 43.48% of the total indexes. B31 assesses the contribution to market stability, while B41, B42, B43, B51, B61, C11, C21, C31, and C32 evaluate contribution to market health. These assessment indexes enable a comprehensive, objective, forward-looking, and effective assessment of the operational performance of integrated companies and their contribution to the electricity market’s healthy and stable development.
It is important to note that, unlike independent power generation or electricity retail companies that transact solely with external entities, integrated power generation and sales companies engage in transactions both internally (between their own power generation and retail subsidiaries) and externally (with outside companies). Given the unique operational characteristics of integrated power generation and sales companies, specific indexes have been established to compare and analyze the impact of internal and external transactions on their operational performance, allowing for targeted improvements. These include internal profit scale indexes (A11, A13), external profit scale indexes (A12, A14), internal profit growth rate indexes (A21, A23), and external profit growth rate indexes (A22, A24). Among them, the profit scale index measures the total profitability of a power generation/selling integrated company, while the profit growth rate index indicates incremental profitability. Additionally, unlike standalone power generation and electricity retail companies whose operational performance is solely determined by their factors, the operational performance of power generation/selling integrated companies is also influenced by the alignment of parent and subsidiary goals and the extent of the parent company’s involvement in subsidiary decision-making. To address this, the consistency index for parent and subsidiary operating goals (B11) and the index measuring the extent of the parent company involvement in subsidiary decision-marking companies (B12) have been established.
3.2 Assessment Index System Architecture and Index Level Division, Interval Range
Building on the selection of assessment indexes in Section 3.1, this section specifically establishes a three-level assessment index system architecture for assessing the operational performance of power generation/selling integrated companies. Drawing from research on important influencing factors (23 specific indexes) and a statistical analysis of their distribution concerning the operational performance of typical power generation/selling integrated companies in a provincial electricity market from 2021 to 2023, this section also references existing literature [5,6] regarding the number of assessment indexes for power generation and electricity retail companies, as well as the categorization of index levels. To balance accuracy and complexity in the calculation, the levels within the operational performance assessment index system for power generation/selling integrated companies are defined, the numerical ranges for each level are set, as detailed in Table 1.
In Table 1, A, B, C represent the basic capabilities, development potential, and external environment of power generation/selling integrated companies, respectively. A1, A2, and A3 correspond to the profit scale, profit growth rate, and debt paying ability of these companies. B1, B2, B3, B4, B5, and B6 represent the organizational characteristics, customer service capabilities, response capabilities, technical capabilities, equipment capabilities, and credit capabilities, respectively. C1, C2, and C3 denote the market environment, regulatory environment, and financial environment faced by these integrated companies, respectively. A11 and A21 represent the revenue and revenue growth rate from electricity transaction between internal power generation companies and internal electricity retail companies. A12 and A22 reflect the revenue and revenue growth rate from electricity transaction between internal companies and external companies. A13 and A23 represent the profit and profit growth rate from internal transactions between power generation and electricity retail companies. A14 and A24 indicate the profit and profit growth rate from transactions involving internal power generation or electricity retail companies and external companies. A31 denotes the asset liability ratio, while A32 indicates the quick asset ratio of power generation/selling integrated companies. B11 measures the consistency between the operating objectives of parent and subsidiary companies, and B12 assesses the extent of the parent company’s involvement in subsidiary business decision-making. B21 evaluates customer satisfaction, while B31 counts the frequency of emergency transaction responses in the market. B41 indicates the proportion of research and development funds allocated to the “dual carbon target” relative to the total research and development funds. B42 measures the proportion of technical personnel capable of designing “dual carbon products”, and B43 reflects the achievement rate of “dual carbon” stage goal. B51 measures the ratio of renewable energy generation to the total power generation, and B61 indicates the credit rating score. C11 assesses the level of market competition freedom, C21 evaluates the extent of regulatory standardization by the government, C31 measures the flexibility of bank loan policies, and C32 assesses the leniency of government tax policies towards these companies.
Establishing an assessment index system architecture for the operational performance of integrated power generation and sales companies addresses the lack of a suitable performance assessment system that aligns with their unique operational characteristics in the electricity market, providing a guiding framework for future assessments.
4 Assessment of Operational Performance of Power Generation/Selling Integrated Companies Using Combination Weighting Method-Extension Theory
4.1 Design of Dynamic Proportional Adjustment Coefficient for Combination Weighting Method
4.1.1 The Shortcomings of Proportional Adjustment Coefficient in the Current Combination Weighting Method
The combination weighting method, a recent development, integrates subjective weighting methods (such as fuzzy analytic hierarchy process, ordinal relationship method, etc.) with objective weighting methods (such as principal component method, entropy weighting method, etc.) for scoring. Compared to using a single subjective or objective weighting method–where the former focuses solely on assessment indexes and overlooks data factors, and the latter relies only on data while ignoring the significance of assessment indexes–the combination weighting method balances both, enhancing the objectivity of assessment results. Because it balances the influence of assessment indexes and data, the combination weighting method has been increasingly applied in many fields, such as electricity, transportation, and geology [21–23].
The proportional adjustment coefficient model of the current combination weighting method is:
where
The current fixed proportion adjustment coefficient model in the current combination weighting method is simple to calculate, but does not account for the impact of different idealized goals and sample data of the assessed object. In the current model, because the effects of idealized goals and sample data on the allocation of proportional adjustment coefficients are not considered, the coefficients for subjective and objective weights remain the same across different scenarios. This often leads to inconsistencies between the assessment results for operating costs and benefits of integrated power generation and sales companies under the fixed proportion adjustment model and the actual results obtained using nationally recognized standard assessment methods (i.e., the assessment may be too high or too low). Therefore, improving the current fixed proportional adjustment coefficient mode is necessary.
4.1.2 Design of Dynamic Proportional Adjustment Coefficient for Combination Weighting Method
To address the limitations of the current fixed proportional adjustment coefficient model, a new coefficient must be developed that considers the idealized goals of the evaluated object and the influence of sample data. Given that system evaluation typically focuses on maximizing benefits or minimizing costs, the proportional adjustment coefficient derived from modeling the optimal conditions of the assessed object’s idealized goals, based on existing sample data, is theoretically more robust. Considering the different idealized goals in the assessment of operational benefits and costs for integrated companies, this study proposes a dynamic proportional adjustment coefficient model (2) and (3). The model uses the fuzzy analytic hierarchy process (FAHP) for subjective weighting and the entropy weighting method (EWM) for objective weighting. By solving the model, optimal proportional adjustment coefficients for different idealized goals are determined. The dynamic proportional adjustment coefficient is updated according to the idealized goals and sample data of the assessment system, ensuring that the resulting assessed results are more logically sound.
When the assessed subject is operational benefits, its idealized goal is to maximize the assessment results, considering existing conditions. The model for maximizing the operational benefits, under a specific assessment cycle using the dynamic proportional adjustment coefficient, is:
When the assessment subject is operational costs, its idealized goal is to minimize the assessment results, considering existing conditions. The model for minimizing the operational costs, under a specific assessment cycle using the dynamic proportional adjustment coefficient, is:
Among:
where
Under established conditions, where the scheme to be assessed and its sample data are all known quantities, the normalized data matrix, subjective weight matrix, and objective weight matrix for each assessment index are constants. Based on the idealized goals of maximizing operational benefits and minimizing operational costs, models (2) and (3) can be solved to determine the optimal dynamic proportional adjustment coefficients.
4.1.3 Dynamic Proportional Adjustment Coefficient Solving Process
Here, further explain the solution process of dynamic proportional adjustment coefficient models (2) and (3), as shown in Fig. 2.
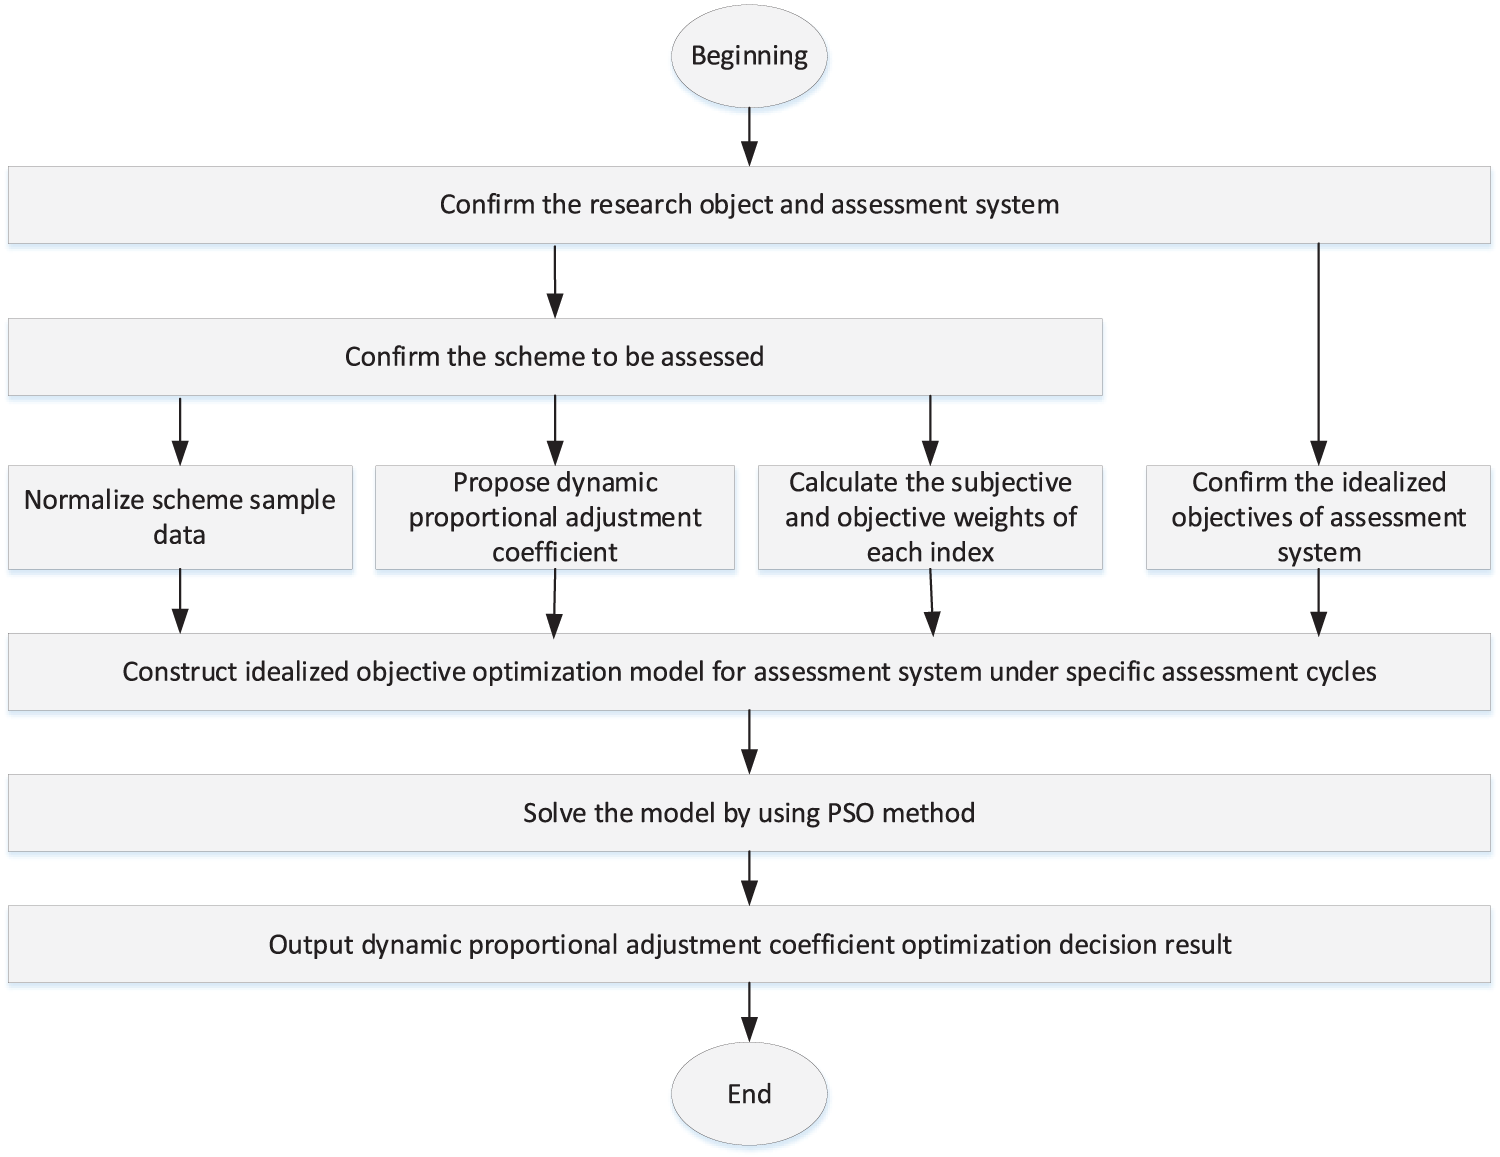
Figure 2: Dynamic proportional adjustment coefficient solving process
4.1.4 Comparison of Fixed and Dynamic Proportional Adjustment Coefficient Modes
The difference between the dynamic proportional adjustment coefficient mode and the current fixed proportional adjustment coefficient mode is shown in Table 2.
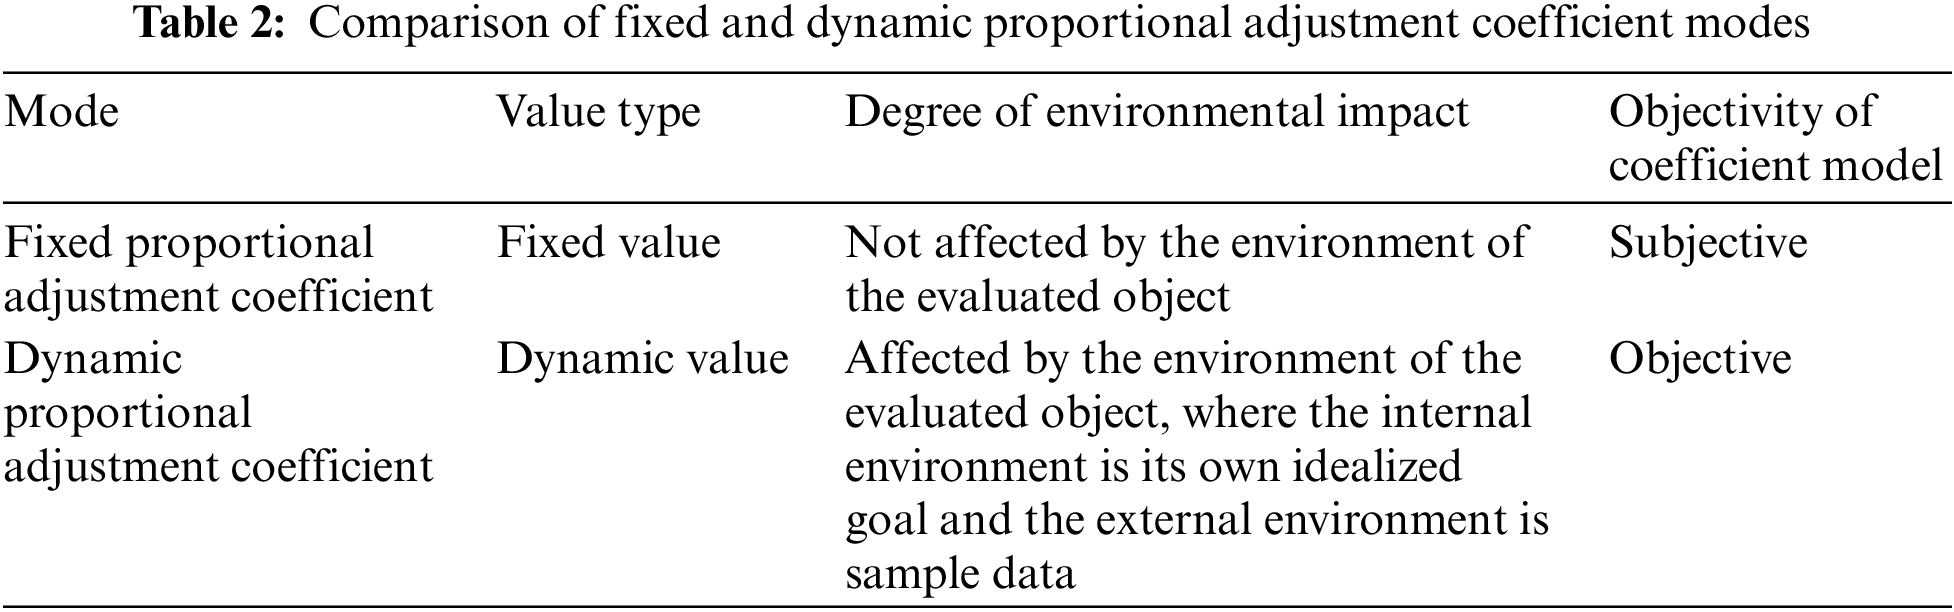
Contribution of the dynamic proportional adjustment coefficient mode: unlike the fixed proportional adjustment coefficient, the dynamic proportional adjustment coefficient design drives the coefficient by incorporating an optimization model that integrates the idealized goals of an assessment object and the sample data of the assessment scheme. This mode effectively captures the real-time impact of changes in the idealized goal and sample data on the proportional adjustment coefficient, thereby optimizing system assessment outcomes and providing a more theoretically sound approach.
4.2 Weight Modeling of Combination Weighting Method Based on Dynamic Proportional Adjustment Coefficient
Given the simplicity and computational efficiency of FAHP and EWM [24], the study uses FAHP as the subjective weighting method and EWM as the objective weighting method. Since both FAHP and EWM are mature theories, the weighting modeling process for these two methods in the operational performance assessment index system integrated companies are omitted here. For details on the weight modeling processes and procedures for FAHP and EWM, refer to the relevant literature [22–23]. Only the comprehensive weight calculation model of index
where
4.3 Modeling of Operational Performance Assessment for Power Generation/Selling Integrated Companies Using Combinatorial Weighting Method-Extension Theory
Extension theory is an assessment method that employs extension distance to quantitatively assess a company’s operational performance characteristics, values, and changes. It is widely used in assessing company operational performance in many industries [25]. Here, extension theory is used to evaluate the operational performance of the power generation/selling integrated company, while the combination weighting method allocates the weights of each assessment index.
Building on the combinatorial weighting method and extension theory, and drawing on the extension model construction process from existing literature [26], the following process is established to assess the operational performance of power generation/selling integrated companies:
(1) Determine the assessment index system for the operational performance of the power generation/selling integrated company, and establish a classical domain element matrix for a specific assessment level (note: the classical domain element of the assessment level is related to the value ranges of each assessment index for the power generation/selling integrated company).
where
(2) Establish the segment domain matter-element matrix for the operational performance assessment index system of the power generation/selling integrated company (note: the segment domain matter-element is related to the upper limit of the value of a range of the highest assessment level and the lower limit of the value of a range of the lowest assessment level of each assessment index).
where
(3) Establish the matter-element matrix for assessing the power generation/selling integrated company (note: the matter-element to be assessed represents the sample data of the operational performance scheme for the power generation/selling integrated company discussed in this article; the matter-element matrix to be assessed is the sample data matrix of the operational performance scheme of the power generation/selling integrated company to be assessed, which is related to the sample data of corresponding scheme for each assessment index).
where
(4) Determine the extensibility distance between the dimensional
where
(5) Calculate the correlation function between the dimensional
where
(6) Since the assessed object of this article is operational performance, the idealized goal is to maximize the operational performance of the corresponding power generation/selling integrated company. Therefore, the dynamic proportional adjustment coefficient model using Formula (2) is adopted. Furthermore, based on the solution results of Formulas (8) and (13), calculate the total correlation between the matter-element matrix
where
(7) Based on Step (6), determine the assessment level of the matter-element matrix
where
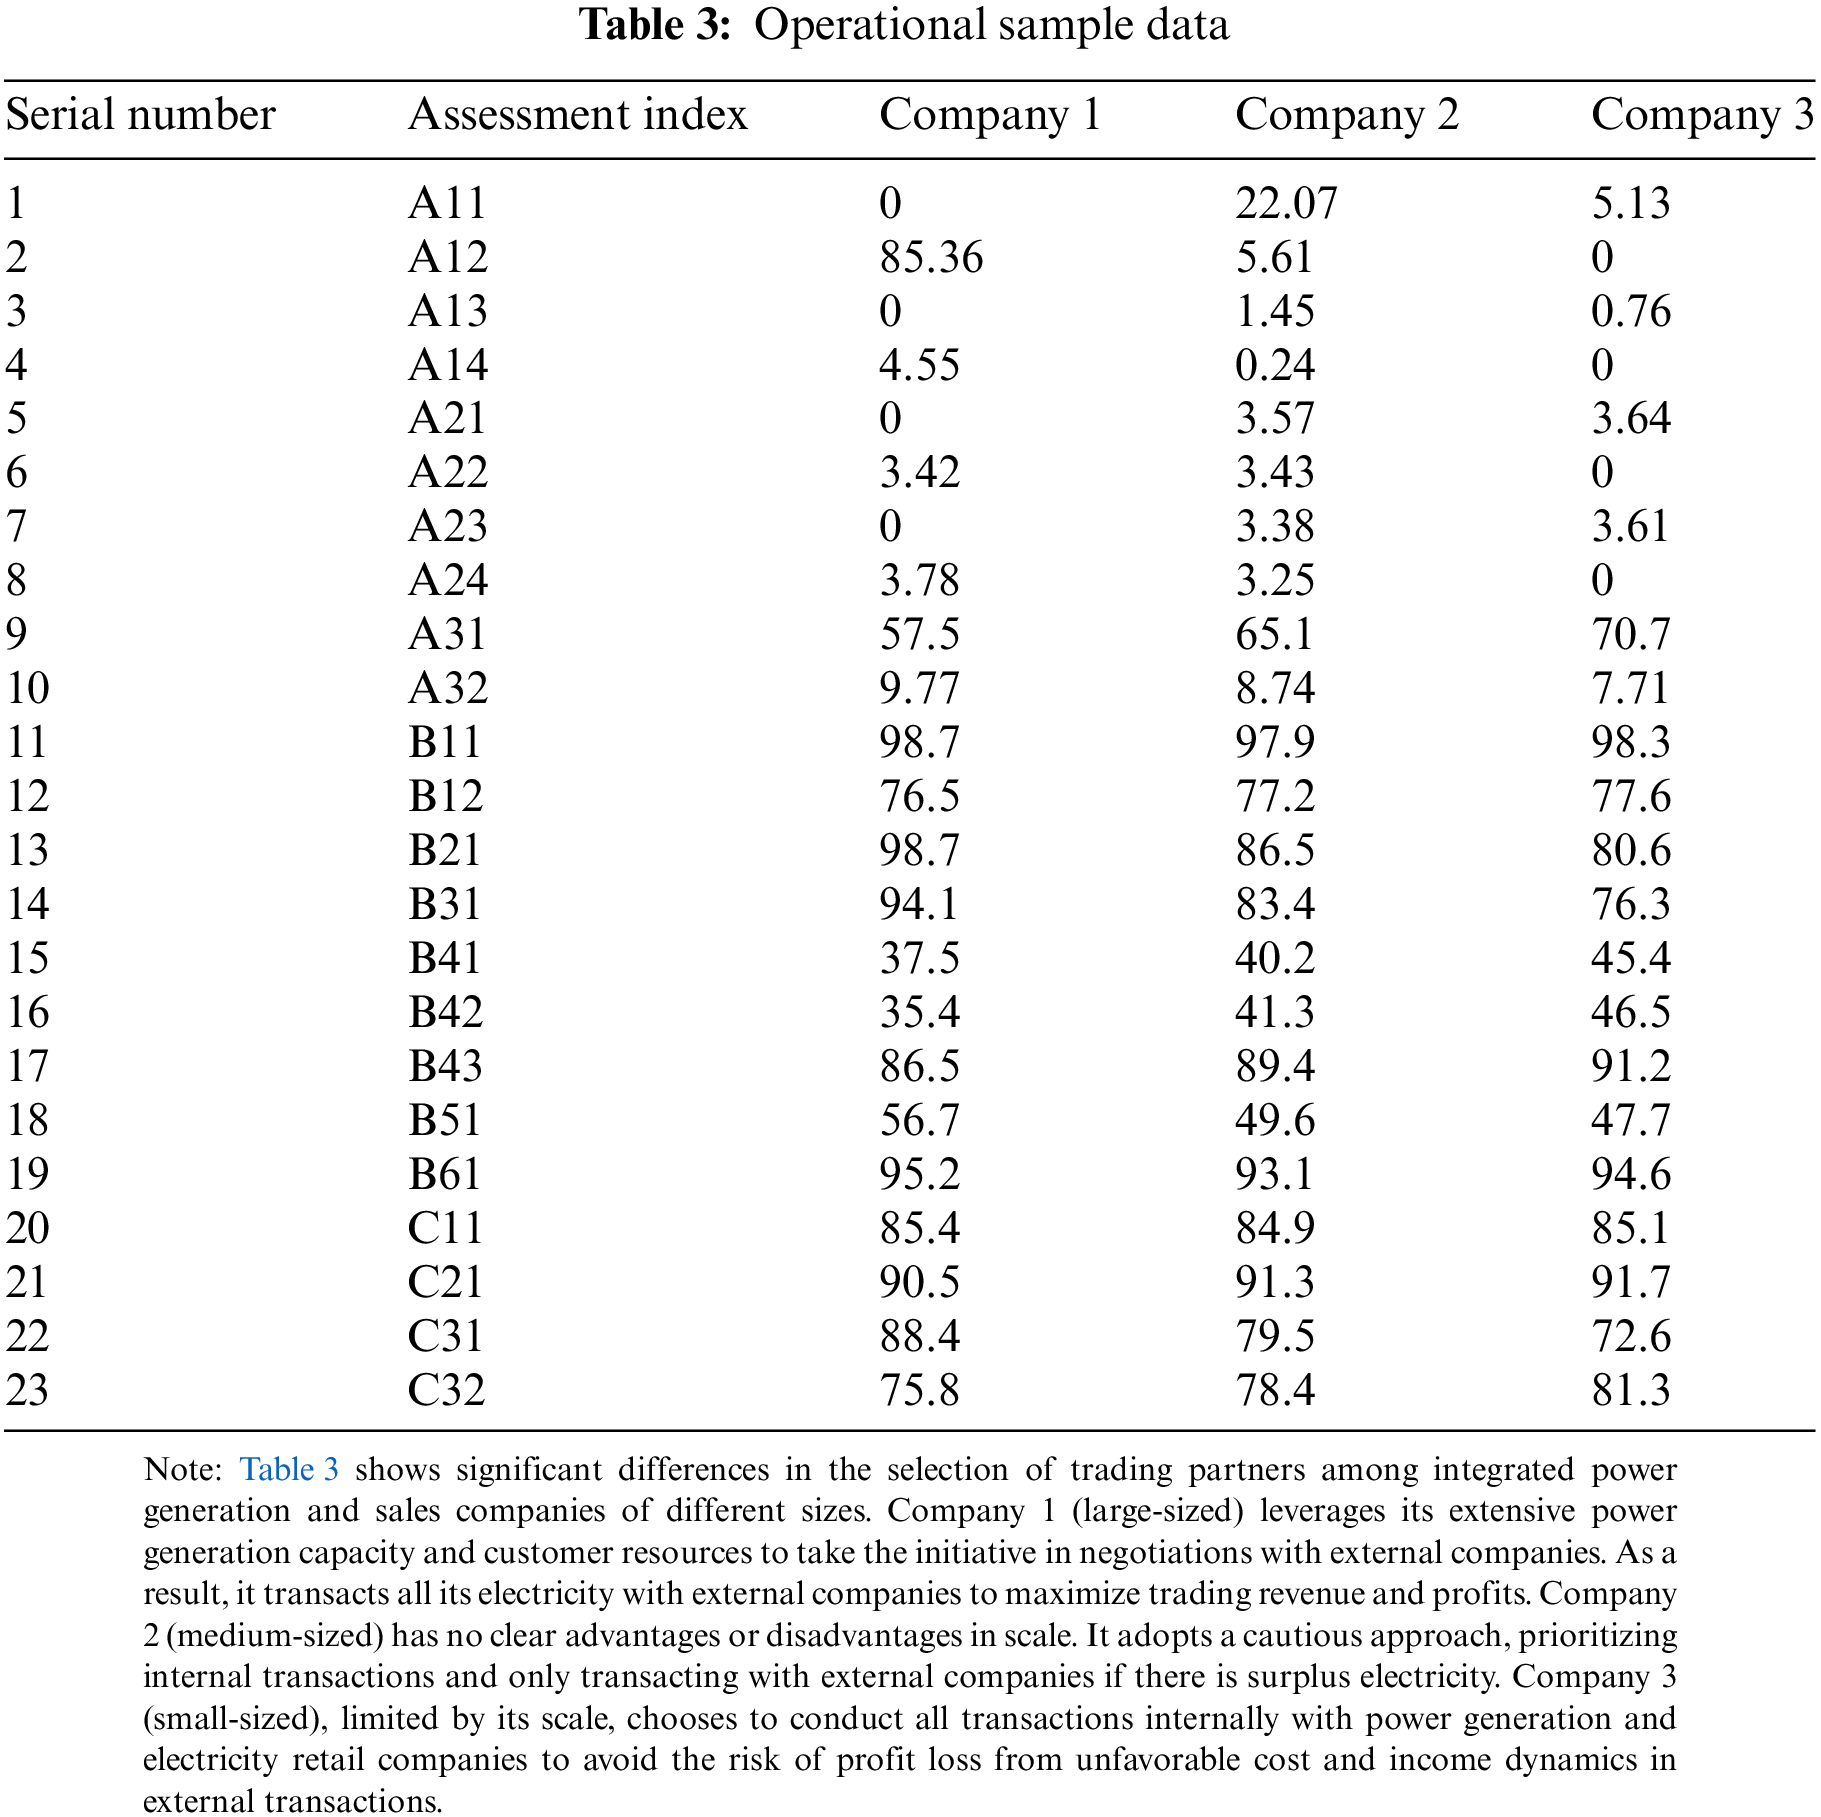
5 Simulation and Numerical Results
To verify the feasibility and effectiveness of the proposed method, a survey of the operational status of power generation/selling integrated companies in a specific province’s electricity market are conducted, selecting three companies of varying sizes typical research subjects. An empirical analysis is performed using their actual operational data from June 2023 as the matter-element samples for assessment. Company 1 is large-sized, Company 2 is medium-sized, and Company 3 is small-sized (company names and other details are omitted for confidentiality). The operational sample data for the three power generation/selling integrated companies, collect during on-site investigations in June 2023 are shown in Table 3.
5.2 Determination of Subjective and Objective Weights for Operational Performance Assessment Index
Since Companies 1, 2, and 3 use the same index system for assessment, the subjective weight values derived through FAHP are solely dependent on the configuration of the assessment indexes. Therefore, the subjective weight values for each assessment index of Companies 1, 2, and 3 are identical. Given these characteristics and the need for easy comparison, the subjective and objective weight values for the operational performance assessment indexes of Companies 1, 2, and 3 are represented on the same graph (with the subjective weights represented by the same curve for each company). The subjective and objective weight values of the operational performance assessment indexes of Companies 1, 2, and 3 are shown in Fig. 3:
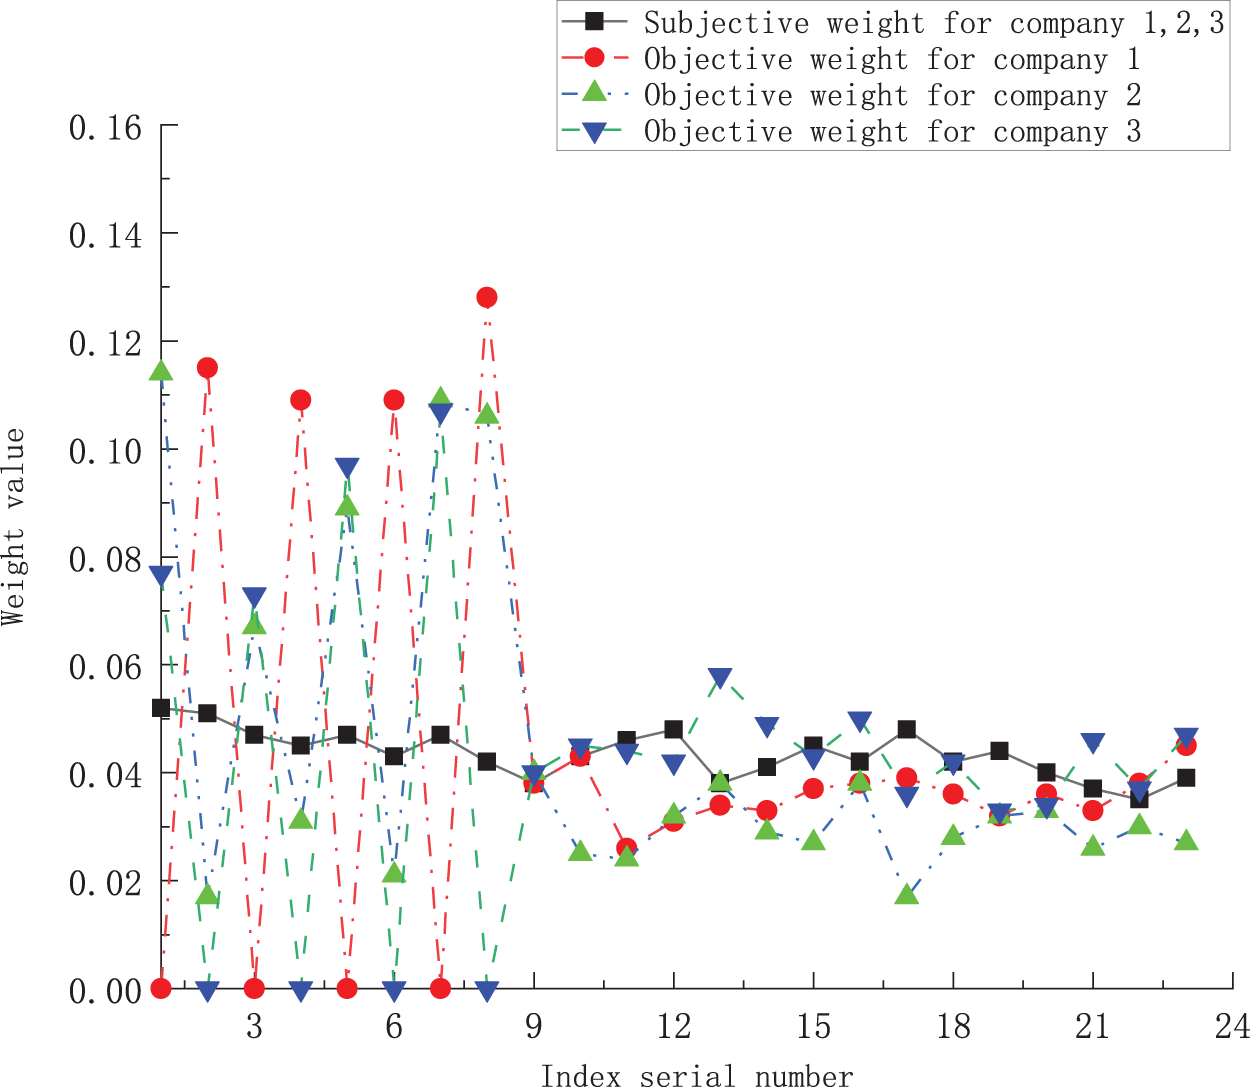
Figure 3: Assessment index subjective and objective weighting result for every company
Fig. 3 shows that the subjective weight values of the assessment indexes for Companies 1, 2, and 3, obtained using FAHP, are consistent; while the objective weight values derived from EWM differ significantly among the companies. At the same time, there are significant differences among the subjective and objective weight values for each company.
5.3 Comparison of Proportional Adjustment Coefficient Values in Two Modes
Fig. 4 illustrates the fixed and dynamic proportional adjustment coefficient values for June, under the idealized goal of operational performance, for three integrated power generation and sales companies of different sizes: Companies 1, 2, and 3. In the fixed proportional adjustment coefficient model, the subjective and objective weight coefficients for all three companies are set to 0.5, resulting in overlapping curves in Fig. 4.
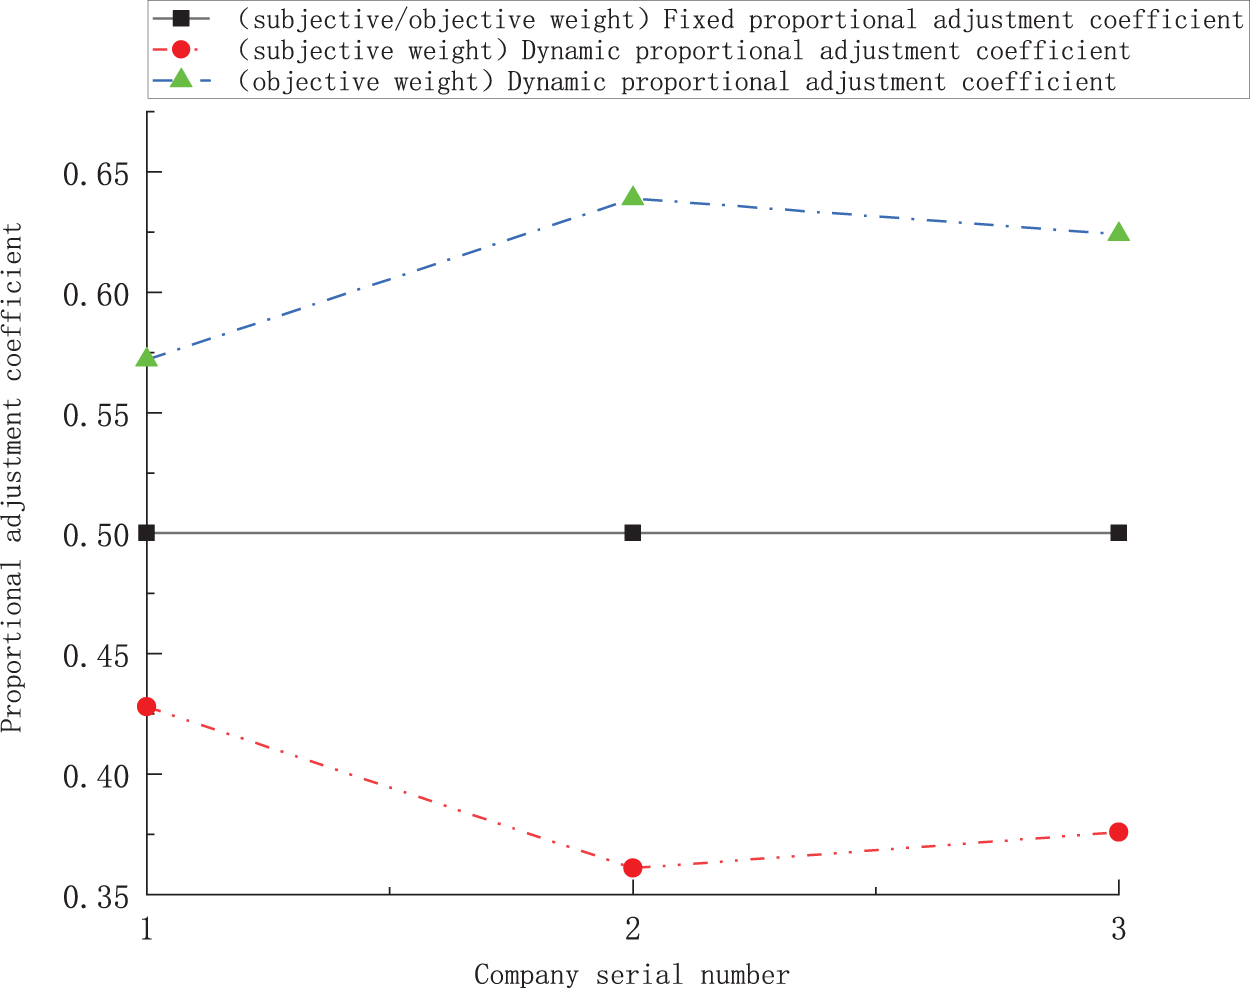
Figure 4: Results of proportional adjustment coefficient values in two modes
Fig. 4 shows that the line representing the fixed proportional adjustment coefficient values for subjective and objective weights of Companies 1, 2, and 3 (with different sample data values for each company’s assessment index) is a horizontal line; In contrast, the line representing the dynamic proportional adjustment coefficient values for subjective and objective weights of Companies 1, 2, and 3 is a fluctuating curve (Note: Since the sample data values differ each month, the line representing the dynamic proportional adjustment coefficients for different months of the same company also fluctuates. This curve is not displayed here). Moreover, the dynamic proportion adjustment coefficient values for the objective weights of each company are all greater than those for the subjective weights. (Note: when the assessment object is operating costs, with the idealized goal of minimizing the result value, the dynamic proportion adjustment coefficients for subjective and objective weights, derived from the same sample data, differ from the values shown in Fig. 4. But the fixed proportional adjustment coefficients of the subjective and objective weights of Companies 1, 2, and 3 are still 0.5. Considering that the focus of this study is on operational performance, not operational costs, the comparison graph of the two proportional adjustment coefficients under the idealized objective of operational costs is not shown).
Based on the analyses above, it can be concluded that, compared to the fixed proportional adjustment coefficient model, the dynamic proportional adjustment coefficient model effectively captures the comprehensive impact of factors, such as the company’s assessment index sample data and the idealized goals of the assessment system on the proportional adjustment coefficient.
5.4 Determination of Comprehensive Weights of Operational Performance Assessment Index under Two Proportional Adjustment Coefficient Modes
Fig. 5a–c show the comprehensive weight results for each assessment index of the three companies under two proportional adjustment coefficient modes.
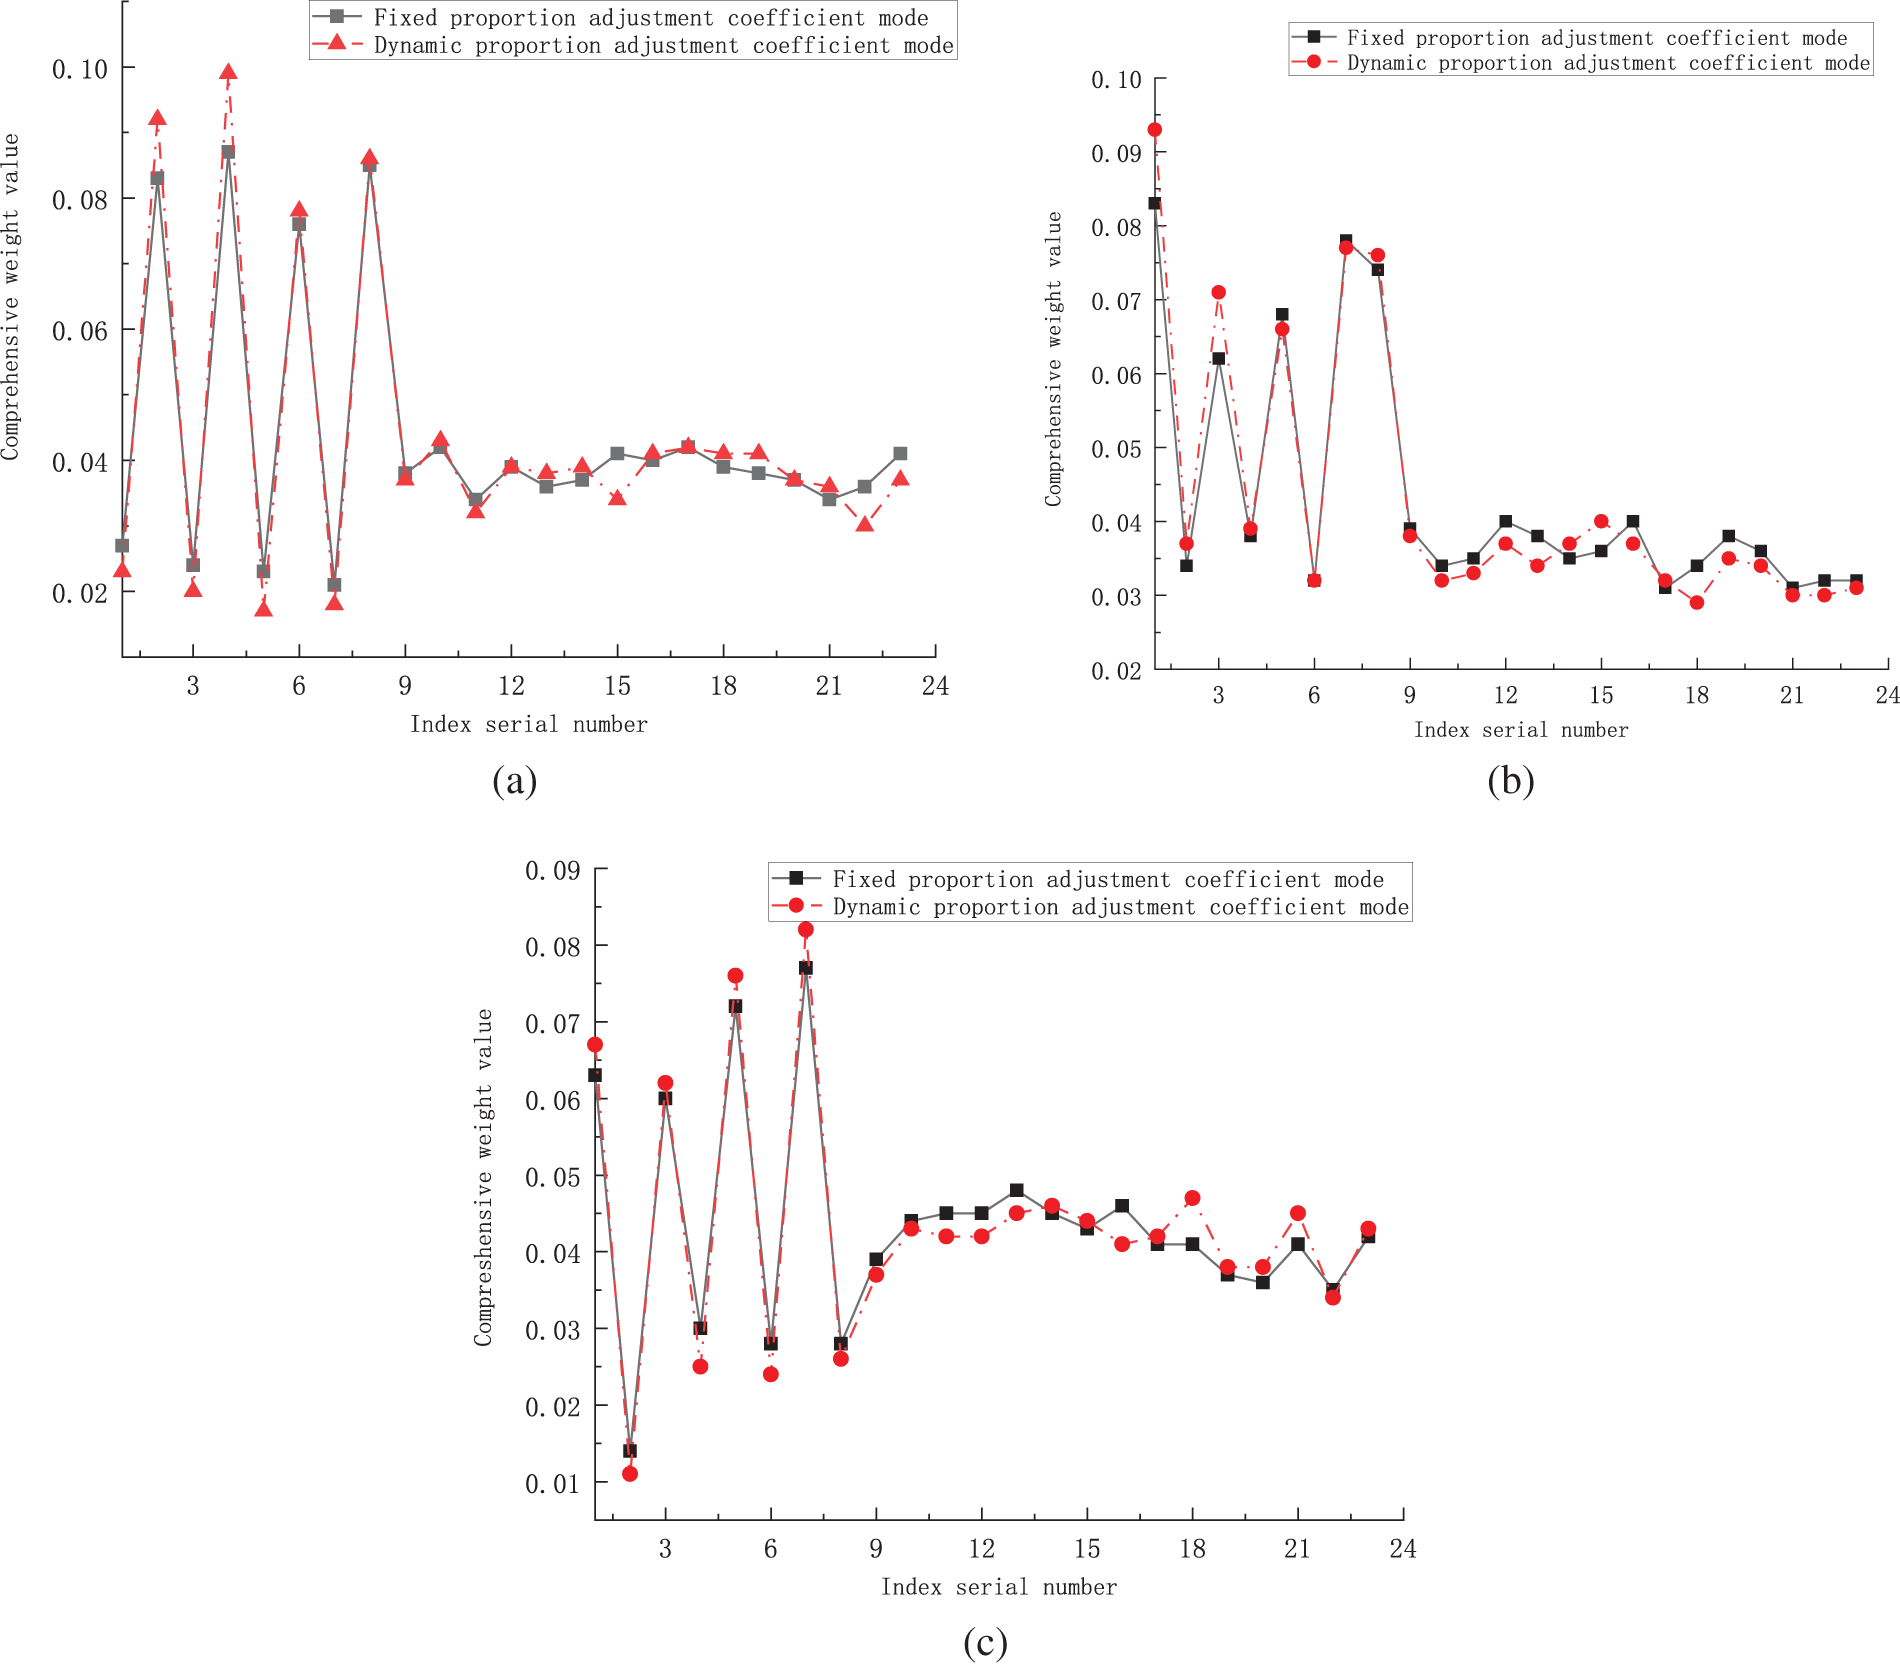
Figure 5: (a): Evaluation index comprehensive weight result for Company 1; (b): Evaluation index comprehensive weight result for Company 2; (c): Evaluation index comprehensive weight result for Company 3
Fig. 5a–c show that the comprehensive weight curves for the assessment indexes of Companies 1, 2, and 3 differ significantly under the dynamic proportional adjustment coefficient model compared to the fixed model. Further analysis indicates that the dynamic model significantly enhances the comprehensive weight assignment of the assessment indexes and can substantially maximize the operational performance assessment results for each company. Conversely, under the fixed model, there may be varying degrees of decline.
Based on the analyses above, it can be concluded that, the proposed dynamic proportional adjustment coefficient mode meets the design requirements.
5.5 Comparison of Operational Performance Assessment Levels under Different Weighting Modes
Compare the operational performance assessment levels of the following methods: single subjective weighting mode, single objective weighting mode, fixed proportional adjustment coefficient with combined weighting mode, dynamic proportional adjustment coefficient with combined weighting mode (as proposed in this article), and existing index correction coefficient with a single subjective weighting mode. The first four methods are assessed based on extension theory, while the fifth method is assessed using government regulations and the efficiency coefficient method. This comparison aims to confirm the advantages and disadvantages of the dynamic proportional adjustment coefficient with combined weighting mode proposed in this study. The mode of adjusting coefficients for each index with a single subjective weighting mode is derived from the guidance document “Operating Rules for Enterprise Performance Evaluation (Revised)” [27] issued by the Ministry of Finance, in collaboration with the Development and Reform Commission, the Ministry of Human Resources and Social Security, the Ministry of Commerce, and other ministries. This is a standard assessment mode recognized by the government, characterized by strong credibility and widespread application. In practice, its results are used as the actual assessment level and serve as a benchmark to assess the accuracy of assessment levels obtained from other modes. However, this method requires first calculating the comprehensive correction coefficients of each index, and then substituting these coefficients and the sample data into the assessment model to obtain the final score. The operation process is complex and time-consuming [27].
Firstly, calculate the operational performance assessment level results for each of the three power generation/selling integrated companies in June under the five weighting modes (due to the complexity of the calculation process, intermediate results are not presented). For each weighting mode, the subjective and objective weightings are consistently determined using FAHP and EWM. The results of assessment for each of the five weighting modes are as follows:
(1) Single subjective weighting mode
Under the single subjective weighting mode, the total correlation between the matter-element
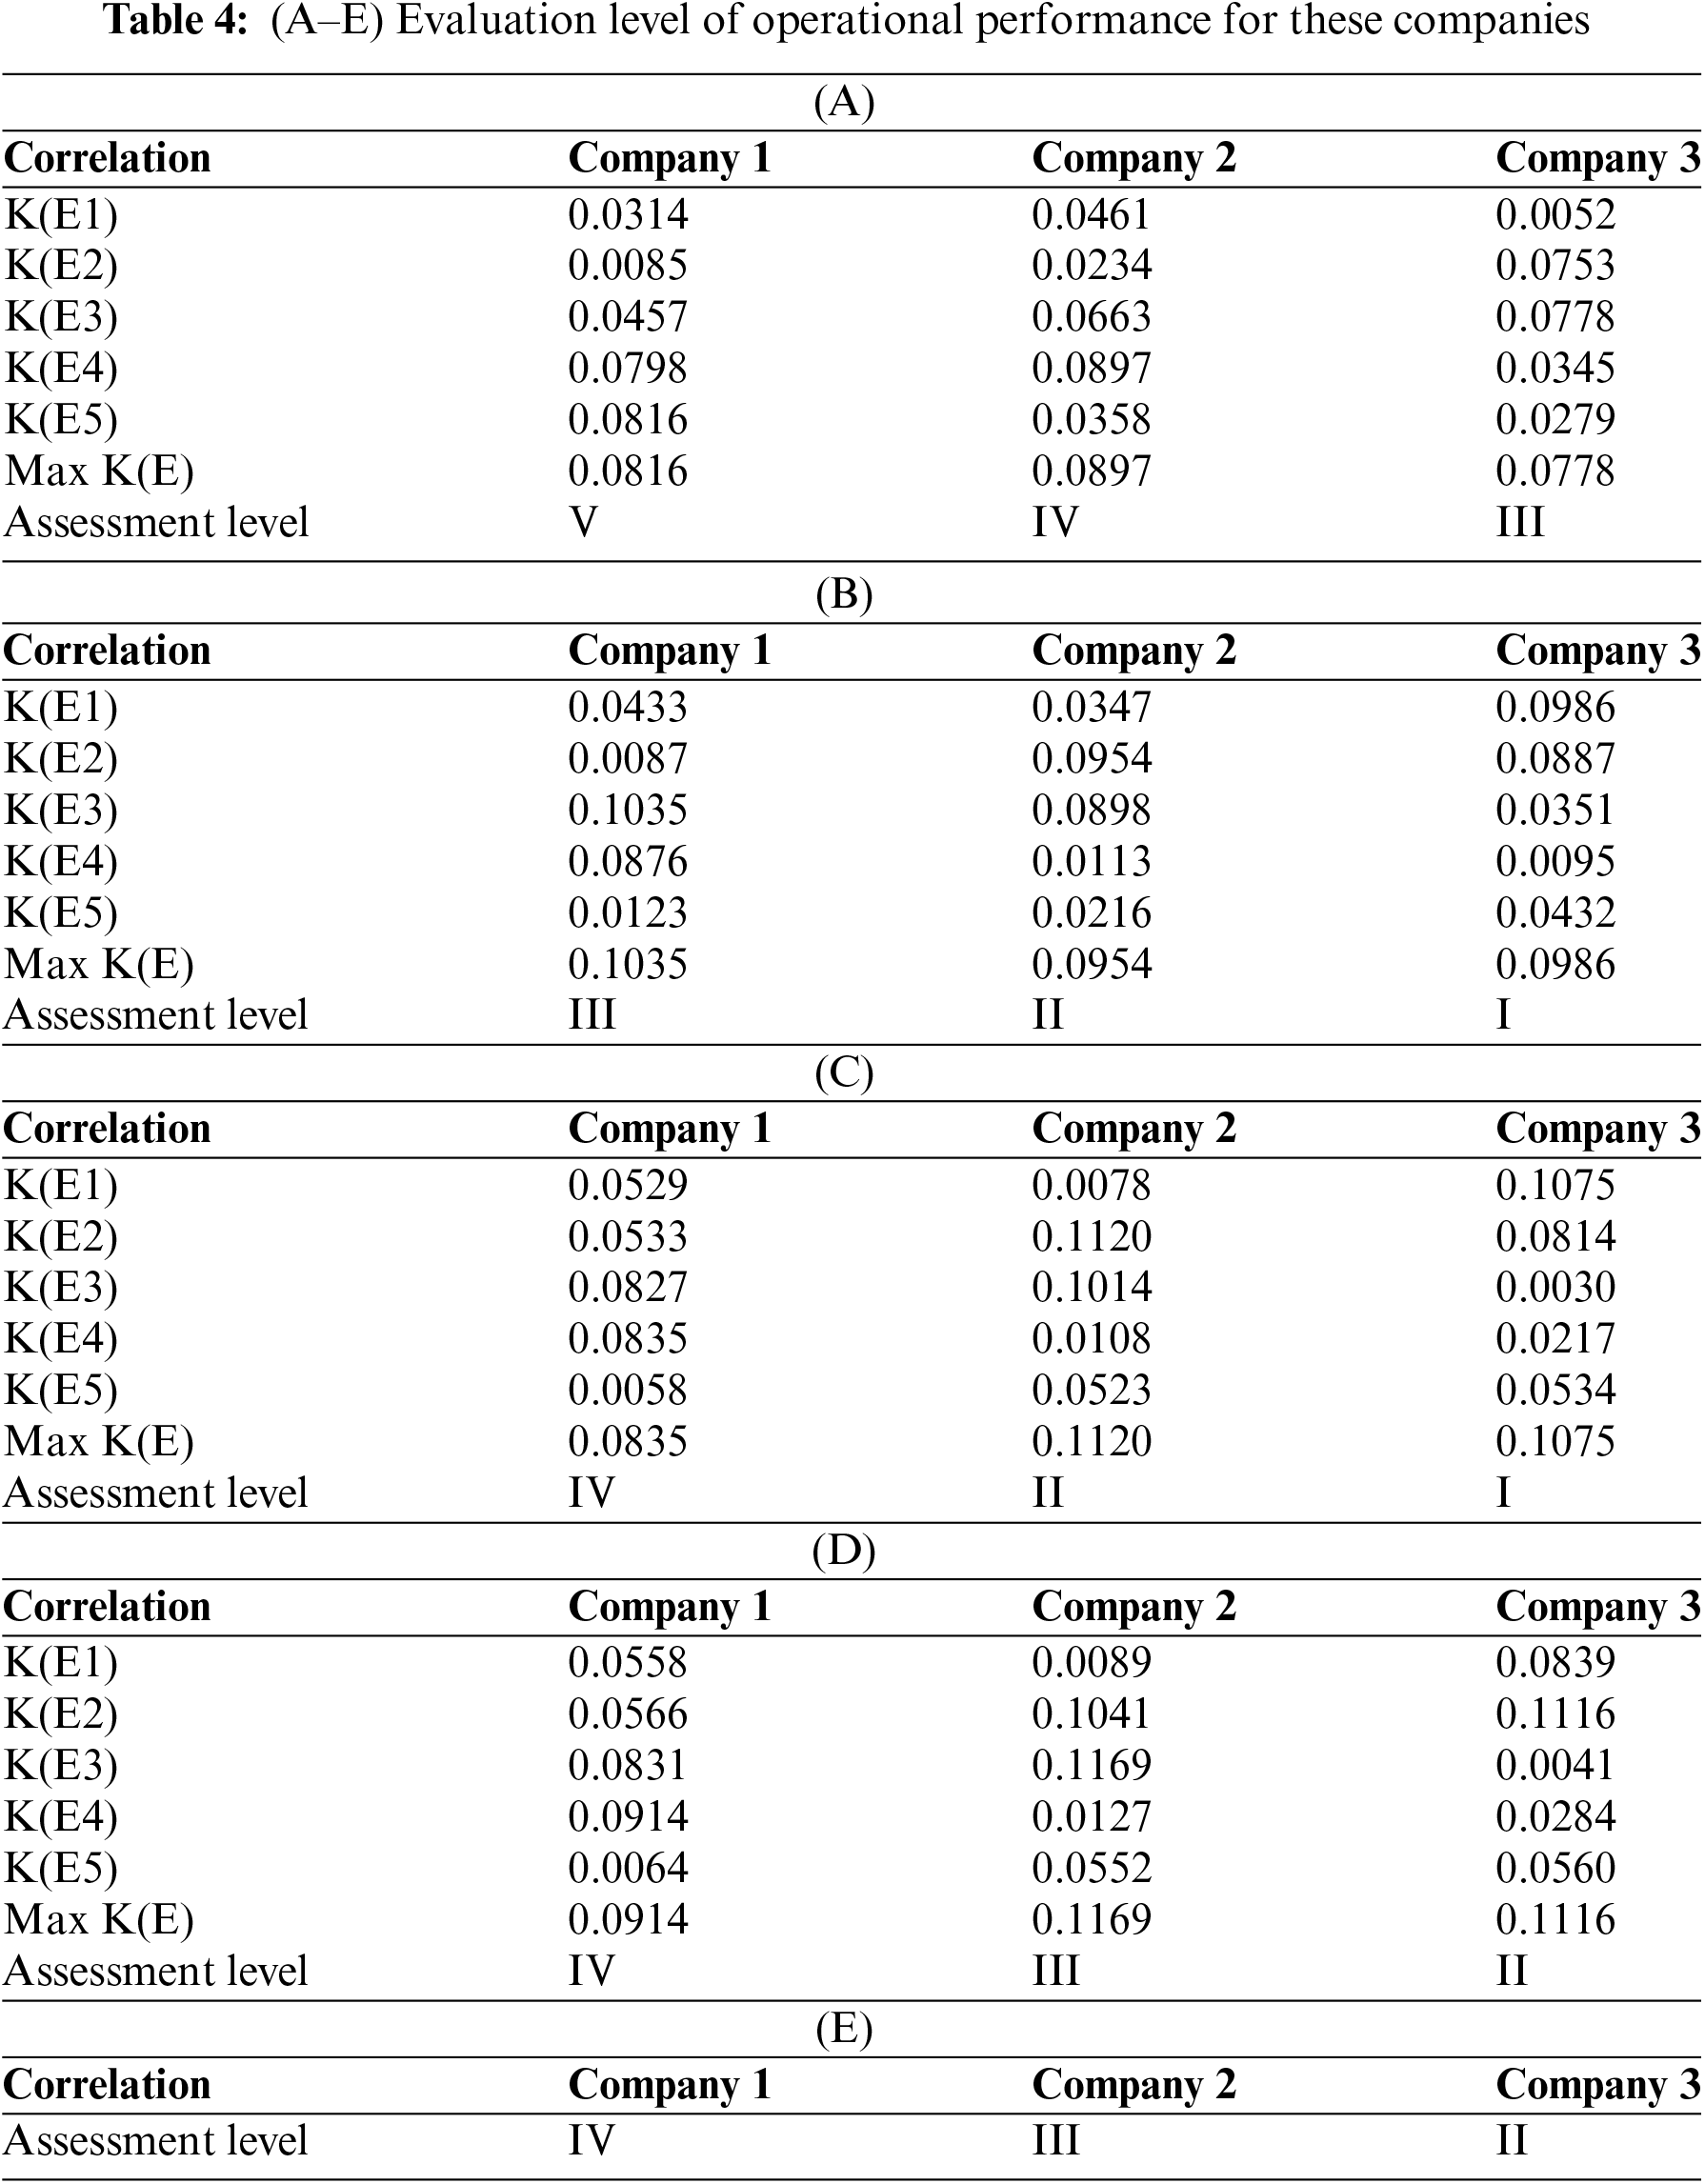
Table 4(A) shows that the operational performance of Company 1 is at level V (with the highest degree of membership at 0.0816), Company 2 is at level IV (with the highest degree of membership at 0.0897), and Company 3 is at level III (with the highest degree of membership at 0.0778).
(2) Single objective weighting mode
Under the single objective weighting mode, the total correlation between the matter-element
Table 4(B) shows that the operational performance of Company 1 is at level Ⅲ (with the highest degree of membership at 0.1035), Company 2 is at level Ⅱ (with the highest degree of membership at 0.0954), and Company 3 is at level Ⅰ (with the highest degree of membership at 0.0986).
(3) Fixed proportional adjustment coefficient with combined weighting mode
Under the fixed proportional adjustment coefficient with combined weighting mode, the total correlation between the matter-element
Table 4(C) shows that the operational performance of Company 1 is at level Ⅳ (with the highest degree of membership at 0.0835), Company 2 is at level Ⅱ (with the highest degree of membership at 0.1120), and Company 3 is at level Ⅰ (with the highest degree of membership at 0.1075).
(4) Dynamic proportional adjustment coefficient with combined weighting mode
Under the dynamic proportional adjustment coefficient with combined weighting mode, the total correlation between the matter-element
Table 4(D) shows that the operational performance of Company 1 is at level Ⅳ (with the highest degree of membership at 0.0914), Company 2 is at level Ⅲ (with the highest degree of membership at 0.1169), and Company 3 is at level Ⅱ (with the highest degree of membership at 0.1116).
(5) Index correction coefficient with a single subjective weighting mode
Under the index correction coefficient with a single subjective weighting mode, the final rating values of the three integrated companies are 73.57, 57.89, and 38.43, respectively. The corresponding rating ranges for each assessment level are as follows: level I is [0, 20), level II is [20, 40), level III is [40, 60), level IV is [60, 80), and level V is [80,100]. Based on the final rating values of each company and the numerical range of each assessment level, the actual assessment level is shown in Table 4(E).
Table 4(E) shows that the operational performance of Company 1 is at level IV, Company 2 is at level III, Company 3 is at level II.
Secondly, compare the operational performance assessment results of the three power generation/selling integrated companies under the five different weighting modes, based on the previously obtained assessment levels. For simplicity, the single subjective weighting mode, single objective weighting mode, fixed proportional adjustment coefficient with combined weighting mode, dynamic proportional adjustment coefficient with combined weighting mode, and index correction coefficient with a single subjective weighting mode are referred to as weighting modes 1, 2, 3, 4, and 5, respectively. Table 5 presents the comparison of operational performance assessment levels for each power generation/selling integrated company in June under different weighting modes:
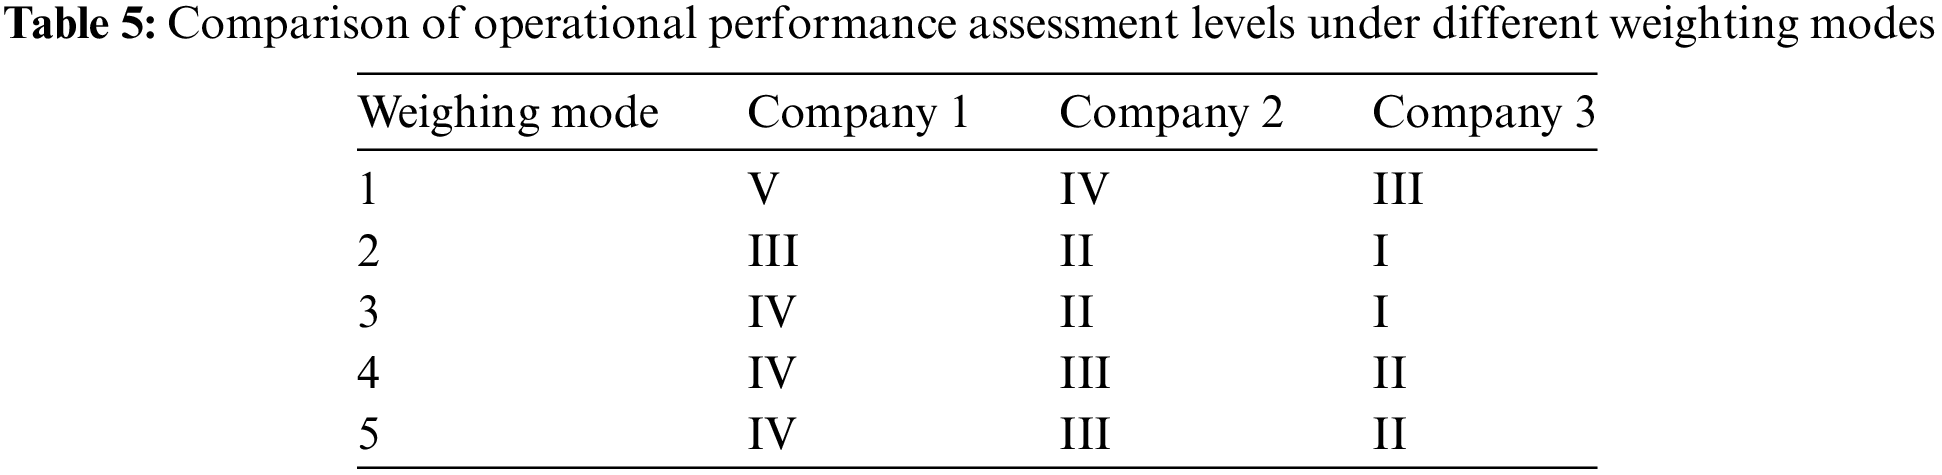
Table 5 shows that the assessment results of the operational performance levels for Companies 1, 2, and 3 under mode 5, which serve as the benchmark for assessment, are completely consistent with those under mode 4 but differ from the results under modes 1, 2, and 3. The assessment results for operational performance levels under modes 1, 2, and 3 also differ from each other. Among them, mode 1, based on a single subjective weighting mode, yields an overall higher rating; mode 2, based on a single objective weighting mode, produces an overall low rating; and mode 3, based on a fixed proportional adjustment coefficient with combined weighting, shows partially lower results for Company 1 (although the assessment results of Company 1 in modes 3, 4, and 5 are all at level IV, the total correlation degrees for levels Ⅲ and Ⅳ in mode 3 are 0.0827 and 0.0835, respectively, showing only a slight numerical difference).
As shown in Table 4(D), when the sample data of the overall assessment index for Companies 1, 2, and 3 is considered as the sample data for Company 1 under different scenarios, the following inference can be drawn: When the sample data for each assessment index changes significantly, the correlation degree and total correlation degree for each assessment level, as determined by extension theory, will also change significantly, resulting in different assessment level outcomes for the assessment scheme. Conversely, when the sample data for each assessment index only slightly, the assessment level result of the assessed scheme remains unchanged (the proof for this inference under scenarios with minor data changes is omitted). From the above two inferences, it can be inferred that there is a moderate correlation between the overall assessment index sample data and the assessment level result, indicating a moderate sensitivity between the two.
To verify the continuous consistency between the dynamic proportional adjustment coefficient with combined weighting method (mode 4) and the index correction coefficient with a single subjective weighting method (mode 5), the above five modes will be used to compare the assessment level results of Companies 1, 2, and 3 for each month in 2023. The comparison results are shown in Tables 6(A)–(C).
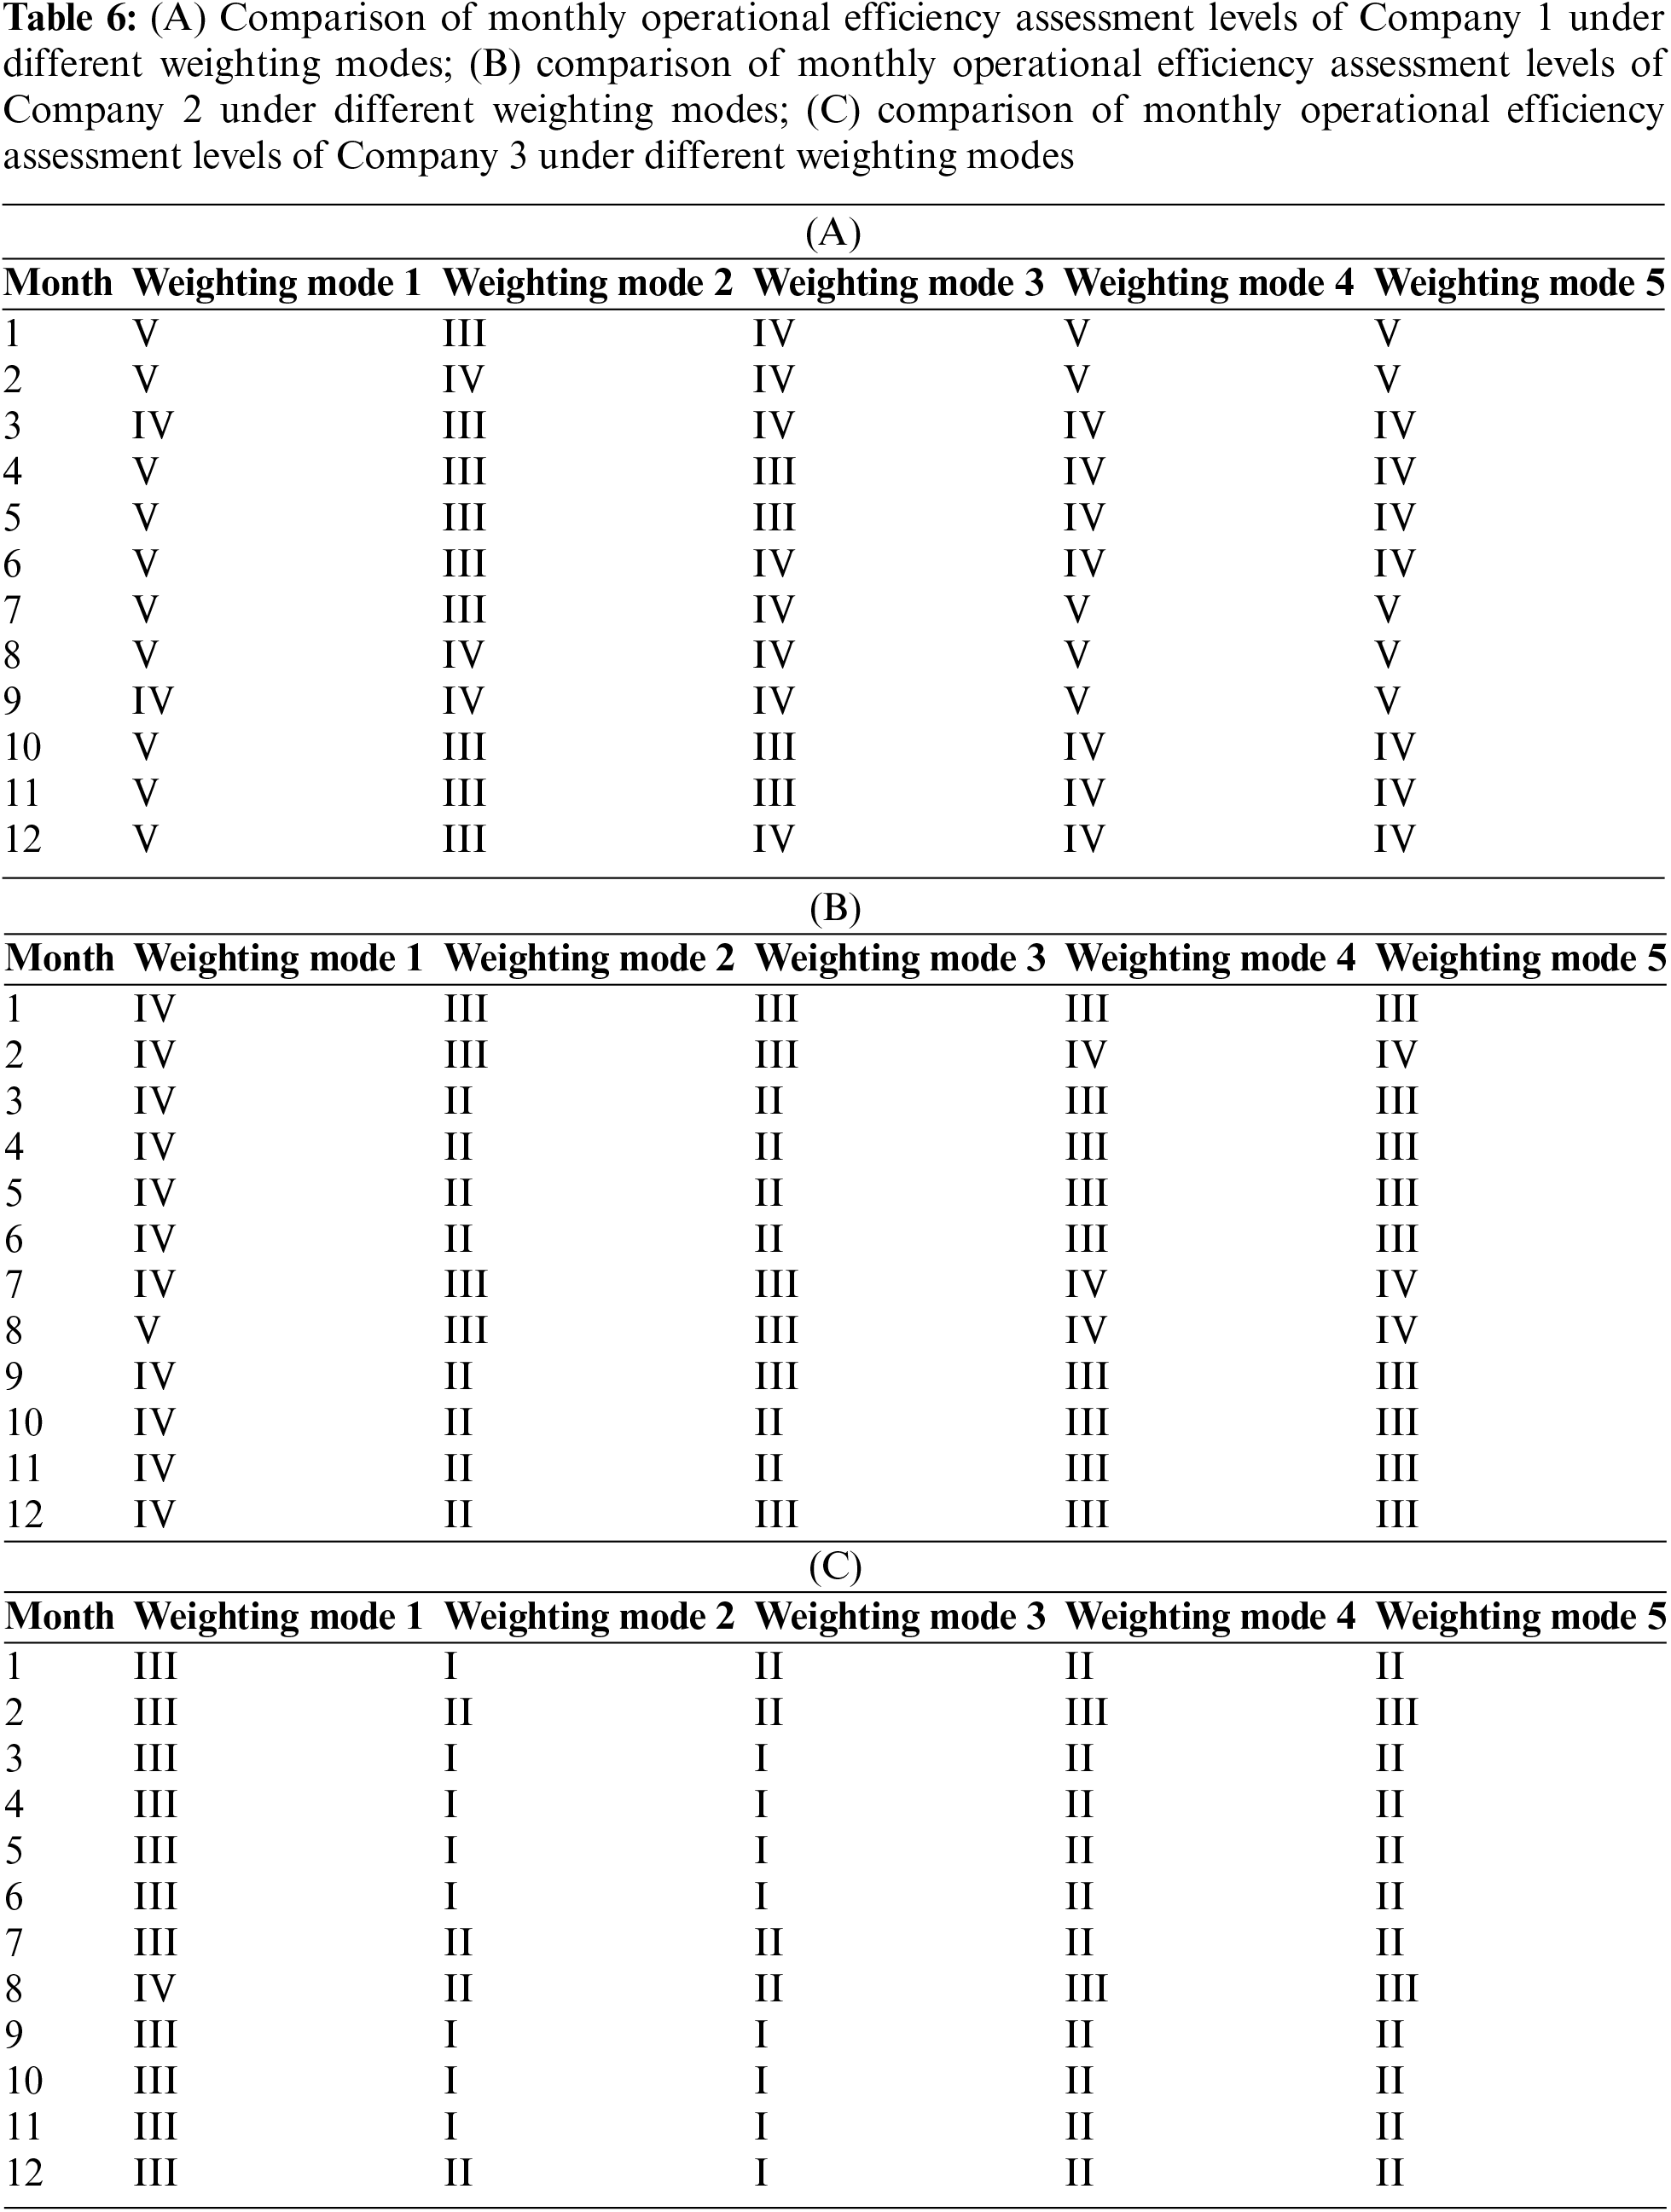
Tables 6(A)–(C) show that, based on continuous tracking of the assessment levels of Companies 1, 2, and 3 over the 12 months of 2023, the assessment results under mode 4 and 5, which serve as the benchmark for assessment methods, are completely consistent. However, the assessment results of the operational performance level for Companies 1, 2, and 3 under mode 5 differ from those under mode 1, 2, and 3. Therefore, there is continuous consistency between the dynamic proportional adjustment coefficient with combined weighting method (mode 4) and the index correction coefficient with a single subjective weighting method (mode 5).
Based on the above analyses, it can be concluded that, under the dynamic proportional adjustment coefficient mode, the operational performance assessment results of the power generation/selling integrated company, using the combination weighting method-extension theory, are accurate, demonstrating the effectiveness of the dynamic proportional adjustment coefficient mode.
5.6 Sensitivity Analysis between Sample Data of Single Assessment Index and Assessment Level Result
Based on the sensitivity analysis between the overall assessment index sample data and the assessment level results presented in Section 5.5, further analysis is conducted to examine the sensitivity relationship between the sample data of a single assessment index and the assessment level result using the dynamic proportional adjustment coefficient with combined weighting method (mode 4). The sample data for each assessment index in the assessment scheme is categorized into high, medium, and low ratio groups based on its value relative to its range. Due to the significant differences in the ratio of assessment index sample data in Company 1 compared to Companies 2 and 3, Company 1 is selected for sensitivity analysis between the sample data of a single assessment index and the assessment level result.
To effectively identify the impact of various assessment indexes on assessment level results and reduce the workload of identification activities, A12, B51, and B42 are selected as typical indexes of high, medium, and low ratio sample data. The sensitivity relationship between the sample data of these assessment indexes and the assessment level result are analyzed under the same sample data of other assessment indexes. The specific results are shown in Tables 7(A)–(C) (Scenario 1 of each index in each table directly references the corresponding scenario in Section 5.5).
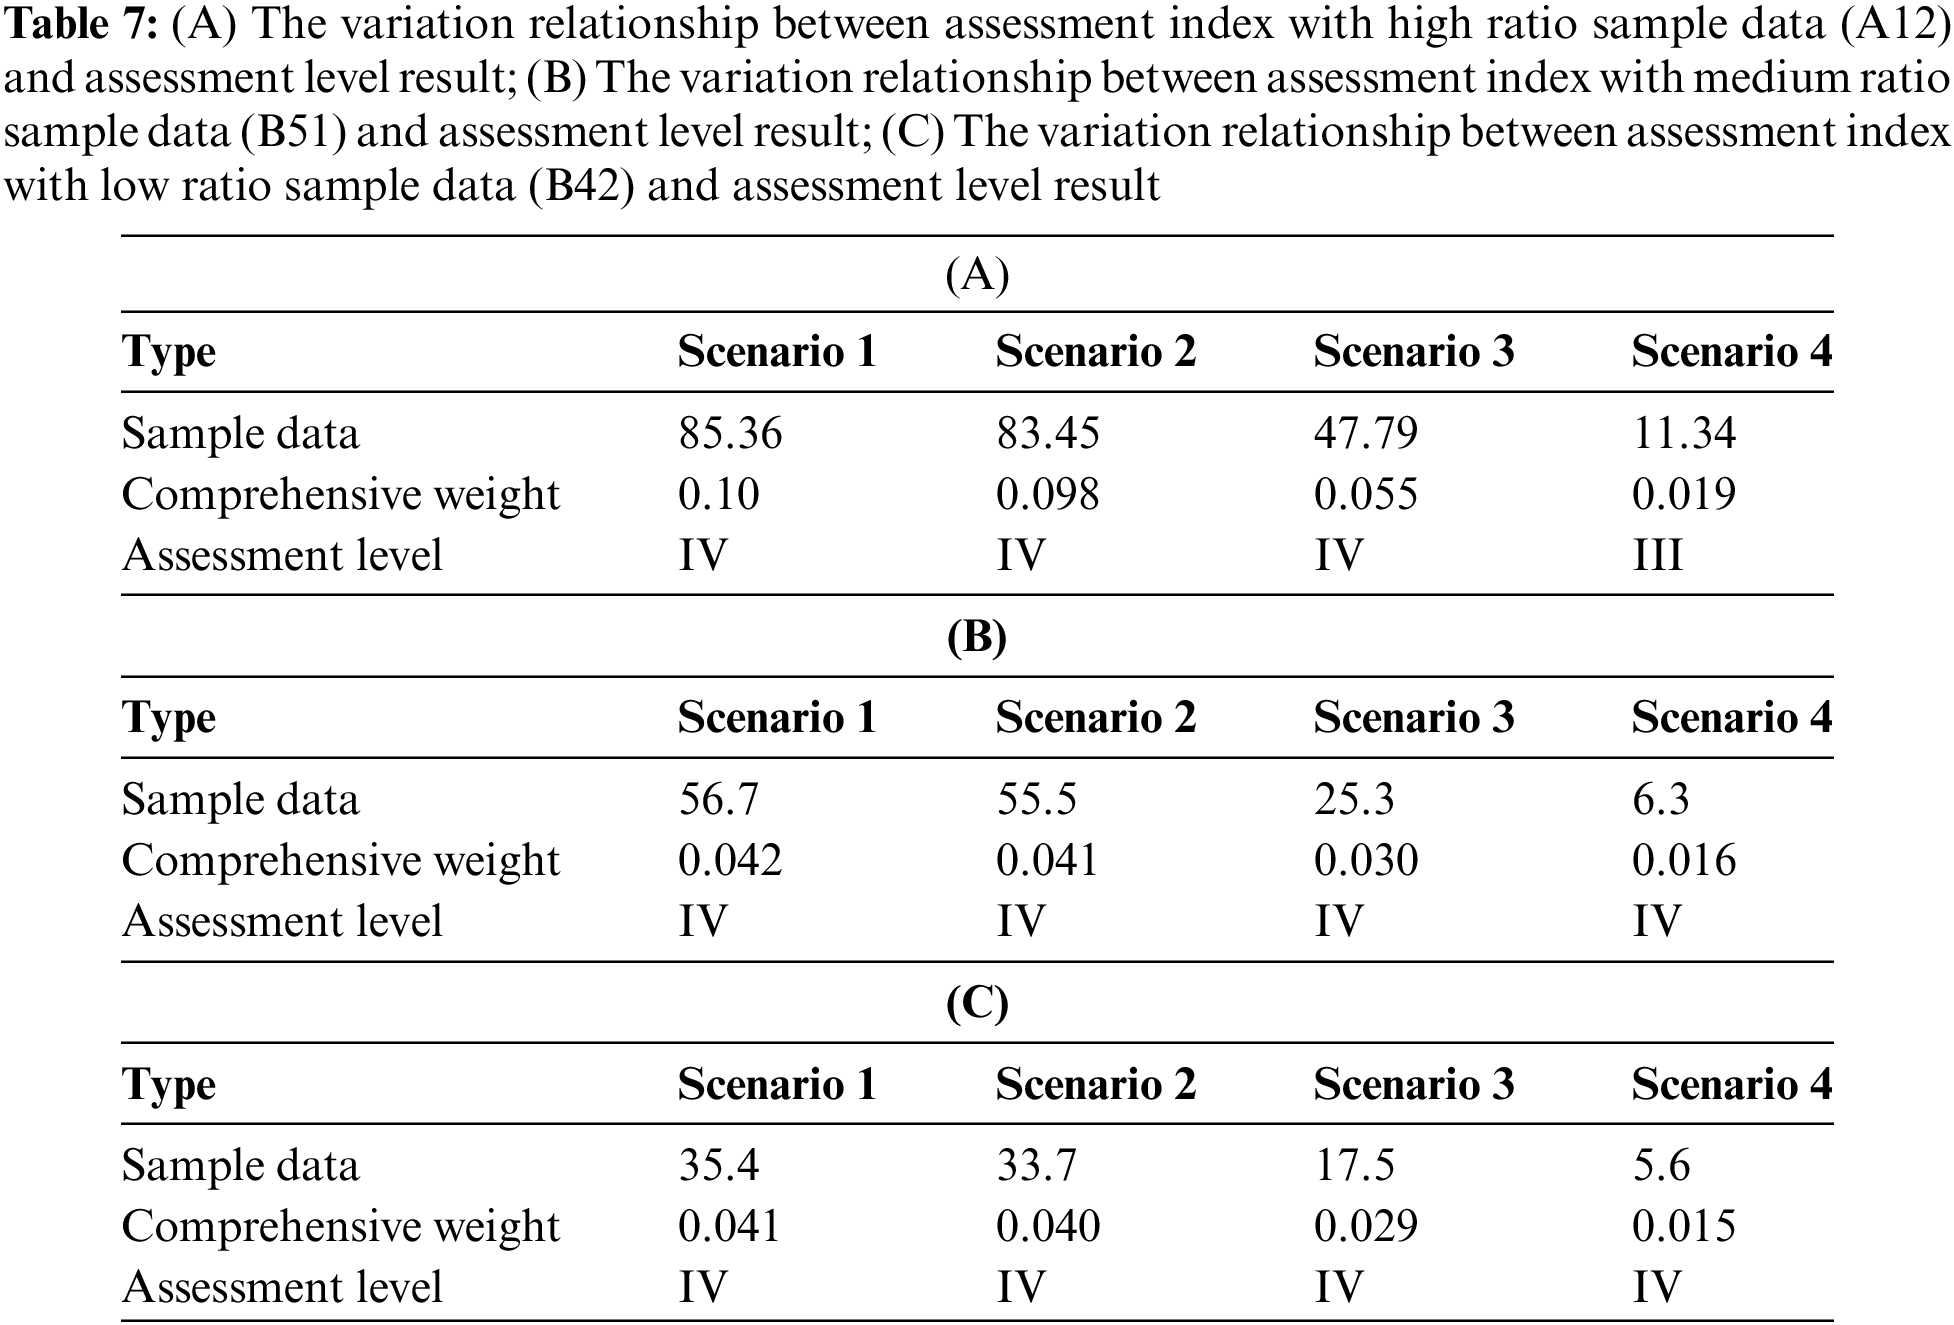
From Tables 7(A)–(C), it is observed that except for a sharp decrease in the sample data of assessment index A12 in Scenario 4, which will lead to a decrease in the assessment level, the assessment level remains unchanged for slight or moderate decrease in the sample data in Scenarios 2 and 3, and for slight, moderate, or a sharp decrease in the assessment indexes B51 and B42 across all scenarios. This occurs because when there is a sharp decrease in the value of high-ratio sample data, the comprehensive weight corresponding to this assessment index decreases significantly, whereas the comprehensive weights of the other 22 indices do not substantially increase after redistribution and calculation. At this point, the correlation and total correlation between each assessment level, as determined through the theory of extension, undergo significant changes, leading to variations in the assessment level. When the sample data of the assessment index increases, the derived result mirrors the downward scenario; therefore, the analysis process is omitted here.
Based on the above analyses, it can be concluded that when the sample data of a single assessment index is high ratio data, there is a weak correlation between it and the assessment level (i.e., the sensitivity of its correlation is weak). Conversely, the relationship shows no correlation (i.e., the sensitivity of their correlation is zero).
This article proposes an assessment index system for assessing the operational performance of a power generation/selling integrated company, addressing the absence of an index system and assessment model suited to its organizational and operational characteristics. The dynamic proportional adjustment coefficient design proposed in this article effectively addresses the limitations of the current fixed proportional adjustment coefficient model, which fails to capture the idealized goals of the assessment system and the impact of sample data changes, leading to assessment results that do not align with reality. Moreover, the assessment results of the operation performance of the power generation/selling integrated company, derived using the combination weighting method-matter-element extension theory method based on the dynamic proportional adjustment coefficient design, are both accurate and straightforward, offering a more suitable approach for future system assessment activities. However, the research in this article is limited to the assessment of operational performance of power generation/selling integrated companies and does not address the assessment of investment performance in the creation stage. To address this limitation, further research in this area will be pursued.
Acknowledgement: Thanks to Hunan Trading Center who provided relevant data and technical support for this work.
Funding Statement: This study was supported in part by the Science and Technology Innovation Program of Hunan Province under Grants 2023JJ40046 and 2023JJ30049.
Author Contributions: The authors confirm contribution to the paper as follows: study conception and design: Jingbin Wu, Hongming Yang; data collection: Hongming Yang; analysis and interpretation of results: Jingbin Wu; draft manuscript preparation: Jingbin Wu; draft manuscript modification and translation: Sheng Xiang. All authors reviewed the results and approved the final version of the manuscript.
Availability of Data and Materials: The data that support the findings of this study are available from the corresponding author, Jingbin Wu, upon reasonable request.
Ethics Approval: Not applicable.
Conflicts of Interest: The authors declare that they have no conflicts of interest to report regarding the present study.
References
1. H. M. Yang and J. B. Wu, “Medium and long-term trading cooperation game decision of power generating & trading integrated company based on dynamically adjusted risk aversion factor,” (in Chinese), Electr. Power Constr., vol. 44, no. 5, pp. 16–27, May 2023. doi: 10.12204/j.issn.1000-7229.2023.05.015. [Google Scholar] [CrossRef]
2. A. Fallahpour, E. U. Olugu, and S. N. Musa, “A hybrid model for supplier selection: Integration of AHP and Multi Expression Programming (MEP),” Neural Comput. Appl., vol. 28, no. 3, pp. 499–504, Sep. 2017. doi: 10.1007/s00521-015-2078-6. [Google Scholar] [CrossRef]
3. M. Dolmatova, D. Kozlovskiy, O. Khrustaleva, T. Sultanova, and A. Vasin, “Market parameters dependent indices for competition evaluation in electricity market,” Elect. Power Syst. Res., vol. 190, Jan. 2021, Art. no. 106762. doi: 10.1016/j.epsr.2020.106762. [Google Scholar] [CrossRef]
4. N. Wang, E. Lu, S. Q. Kong, X. D. Wang, and Z. Y. Liang, “Comprehensive evaluation index system of guangdong electricity auxiliary service market,” in IEEE 3rd Int. Electr. Energy Conf., Beijing, China, Sep. 7–9, 2019, pp. 236–240. [Google Scholar]
5. P. X. Shi, P. R. Shi, P. W. Wang, Y. Wang, and S. N. Chen, “Analysis and operation evaluation of power peak-shaving ancillary service market in north china,” (in Chinese), Autom. Electr. Power Syst., vol. 45, no. 20, pp. 175–184, Aug. 2021. doi: 10.7500/AEPS20201025003. [Google Scholar] [CrossRef]
6. M. P. Xiong and C. M. Zhang, “Research on performance evaluation of low-carbon transition of power generation enterprises in China,” (in Chinese), J. North China Electr. Power Univ. (Soc. Sci.), vol. 131, no. 3, pp. 50–59, Jun. 2021. doi: 10.14092/j.cnki.cn11-3956/c.2021.03.007. [Google Scholar] [CrossRef]
7. Y. F. Qin et al., “Research on green management effect evaluation of power generation enterprises in china based on dynamic hesitation and improved extreme learning machine,” Processes, vol. 7, no. 7, Nov. 2019, Art. no. 474. doi: 10.3390/pr7070474. [Google Scholar] [CrossRef]
8. Z. S. Ji, X. Y. Yu, W. Y. Li, and D. X. Niu, “A multi-criteria decision-making framework for distributed generation projects investment considering the risk of electricity market trading,” J. Clean. Prod., vol. 416, Sep. 2023, Art. no. 137837. doi: 10.1016/j.jclepro.2023.137837. [Google Scholar] [CrossRef]
9. H. T. Qiao, S. Y. Weng, L. Z. Wu, and B. Zeng, “Research on wind power project investment risk evaluation based on fuzzy-gray clustering trigonometric function,” Energy Rep., vol. 8, no. S5, pp. 1191–1199, Aug. 2022. doi: 10.1016/j.egyr.2022.02.222. [Google Scholar] [CrossRef]
10. Y. Zhou, X. G. Zhao, and L. Xu, “Supply side incentive under the renewable portfolio standards: A perspective of China,” Renew. Energy, vol. 193, pp. 505–518, Jun. 2022. doi: 10.1016/j.renene.2022.05.046. [Google Scholar] [CrossRef]
11. S. A. Qadir, H. Al-Motairi, F. Tahir, and L. Al-Fagih, “Incentives and strategies for financing the renewable energy transition: A review,” Energy Rep., vol. 7, pp. 3590–3606, Nov. 2021. doi: 10.1016/j.egyr.2021.06.041. [Google Scholar] [CrossRef]
12. X. S. Lin, T. Huang, E. Bompard, B. B. Wang, and Y. X. Zheng, “Ex-ante market power evaluation and mitigation in day-ahead electricity market considering market maturity levels,” Energy, vol. 278, Sep. 2023, Art. no. 127777. doi: 10.1016/j.energy.2023.127777. [Google Scholar] [CrossRef]
13. Y. Y. Zhang, H. R. Zhao, B. K. Li, Y. H. Zhao, and Z. Qi, “Research on credit rating and risk measurement of electricity retailers based on bayesian best worst method-cloud model and improved credit metrics model in china’s power market,” Energy, vol. 252, Aug. 2022, Art. no. 124088. doi: 10.1016/j.energy.2022.124088. [Google Scholar] [CrossRef]
14. D. F. Zhao, C. B. Li, Q. Q. Wang, and J. H. Yuan, “Comprehensive evaluation of national electric power development based on cloud model and entropy method and TOPSIS: A case study in 11 countries,” J. Clean. Prod., vol. 277, Dec. 2020, Art. no. 123190. doi: 10.1016/j.jclepro.2020.123190. [Google Scholar] [CrossRef]
15. S. Li, “Study on the profit model and benefits evaluation of electricity retailers for power grid enterprises under the new round of power industry reform,” (in Chinese), M.S. thesis. North China Electric Power Univ., Beijing, China, 2017. [Google Scholar]
16. Y. C. Zhi Zhang et al., “Optimal alliance strategies among retailers under energy deviation settlement mechanism in china’s forward electricity market,” IEEE Trans. Power Syst., vol. 35, no. 3, pp. 2059–2071, May 2020. doi: 10.1109/TPWRS.2019.2955479. [Google Scholar] [CrossRef]
17. D. X. Niu, S. Li, and S. Y. Dai, “Comprehensive evaluation for operating efficiency of electricity retail companies based on the improved TOPSIS method and LSSVM optimized by modified ant colony algorithm from the view of sustainable development,” Sustainability, vol. 10, no. 3, Jan. 2018, Art. no. 860. doi: 10.3390/su10030860. [Google Scholar] [CrossRef]
18. S. Li, D. X. Niu, and L. F. Wu, “Evaluation of energy saving and emission reduction effects for electricity retailers in china based on fuzzy combination weighting method,” Appl. Sci., vol. 8, no. 9, Sep. 2018, Art. no. 1564. doi: 10.3390/app8091564. [Google Scholar] [CrossRef]
19. Z. B. Wei et al., “A comprehensive competitiveness decision method for electricity retailers considering the integration of device operation, investment planning, and marketing strategy,” IEEE Syst. J., vol. 18, no. 1, pp. 244–255, Mar. 2024. doi: 10.1109/JSYST.2023.3328004. [Google Scholar] [CrossRef]
20. S. Liang and Y. S. Wang, “Evaluation of An integrated energy system planning scheme for an industrial park based on an improved cloud matter-element model,” (in Chinese), Power Syst. Prot. Control, vol. 51, no. 9, pp. 165–176, May 2023. doi: 10.19783/j.cnki.pspc.221097. [Google Scholar] [CrossRef]
21. W. Liu, W. L. Cui, M. J. Chen, Q. F. Hu, and Z. Y. Song, “Operation safety risk assessment of water distribution networks based on the combined weighting method (CWM),” KSCE J. Civil Eng., vol. 27, no. 5, pp. 2116–2130, Apr. 2023. doi: 10.1007/s12205-023-1552-4. [Google Scholar] [CrossRef]
22. G. J. Liang, C. You, Y. Zhang, and J. An, “Risk assessment model and its application on existing building reconstruction based on FAHP,” (in Chinese), J. Xichang Univ. (Nat. Sci. Ed.), vol. 37, no. 2, pp. 28–33, Jun. 2023. doi: 10.16104/j.issn.1673-1891.2023.02.005. [Google Scholar] [CrossRef]
23. Y. Qin, LV. G., K. Guan, and H. Zhou, “Durability assessment and life prediction of concrete by entropy weight method,” (in Chinese), J. Chinese Ceram. Soc., vol. 51, no. 5, pp. 1344–1354, Feb. 2023. doi: 10.14062/j.issn.0454-5648.20220694. [Google Scholar] [CrossRef]
24. J. B. Wu and K. Meng, “Dynamic adjustment model of performance guarantee quota based on optimization decision of medium/long-term transactions of power selling companies,” Energy Rep., vol. 9, no. s7, pp. 145–154, Sep. 2023. doi: 10.1016/j.egyr.2023.04.083. [Google Scholar] [CrossRef]
25. Z. Y. Song, J. Zhang, X. L. Xiao, and D. X. Niu, “Multi-energy combined peak dispatching system synthetic benefit evaluation based on variable weight theory and matter-element extension model,” Int. J. Energy Sect. Manag., vol. 13, no. 3, pp. 713–725, Aug. 2019. doi: 10.1108/IJESM-08-2018-0004. [Google Scholar] [CrossRef]
26. W. Wang, H. P. Wang, B. Zhang, S. Wang, and W. B. Xing, “Coal and gas outburst prediction model based on extension theory and its application,” Process Saf. Environ. Prot., vol. 154, pp. 329–337, Oct. 2021. doi: 10.1016/j.psep.2021.08.023. [Google Scholar] [CrossRef]
27. J. J. Cui, “Performance evaluation of home appliance industry enterprises based on efficiency coefficient method,” (in Chinese), Manag. Adm., vol. 447, no. 3, pp. 55–61, Mar. 2024. doi: 10.16517/j.cnki.cn12-1034/f.2024.03.009. [Google Scholar] [CrossRef]
Cite This Article
 Copyright © 2024 The Author(s). Published by Tech Science Press.
This work is licensed under a Creative Commons Attribution 4.0 International License , which permits unrestricted use, distribution, and reproduction in any medium, provided the original work is properly cited.
 Downloads
 Citation Tools