
 Submit a Paper
 Propose a Special lssue
 Open Access
ARTICLE

Itinerary-Dependent Degradation Analysis of a Lithium-Ion Battery Cell for E-Bike Applications in Rwanda
1 African Center of Excellence in Energy for Sustainable Development, College of Science and Technology, University of Rwanda, Kigali, P.O. Box 3900, Rwanda
2 Department of Electrical and Electronic Engineering, Imperial College London, London, SW7 2BX, UK
3 Departament d’Enginyeria Elèctrica, Universitat Politècnica de Catalunya, Barcelona, 08034, Spain
* Corresponding Author: Aimable Ngendahayo. Email:
(This article belongs to the Special Issue: Advanced Modelling, Operation, Management and Diagnosis of Lithium Batteries)
Energy Engineering 2024, 121(11), 3121-3131. https://doi.org/10.32604/ee.2024.053100
Received 24 April 2024; Accepted 12 July 2024; Issue published 21 October 2024
 View Full Text
 Download PDF
Abstract
There are obstacles to the widespread use of small electric vehicles (EVs) in Rwanda, including concerns regarding the battery range and lifespan. Lithium-ion batteries (LIBs) play an important role in EVs. However, their performance declines over time because of several factors. To optimize battery management systems and extend the range of EVs in Rwanda, it is essential to understand the influence of the driving profiles on lithium-ion battery degradation. This study analyzed the degradation patterns of a lithium-ion battery cell that propels an E-bike using various real-world E-bike driving cycles that represent Rwandan driving conditions under deep discharge (). By being aware of these variables, battery failure can be slowed and improved battery performance can be achieved to promote the transition to cleaner transportation in Rwanda for the productive use of energy. The analyzed parameters that affect battery performance are temperature, driving cycles, and state of charge. It was found that the higher the temperature, the higher was the rate of fading. On the other hand, the EVs that operate in the region with higher elevation (hilly region) combined with a flat surface where the riders use their physical forces to propel the E-bike and their batteries lose their capacity rapidly compared to those operating in regions where the energy from the lithium-ion battery assists for the entire mileage. By draining the battery to 10% and charging it to 90% of its initial capacity, the capacity fading decreased by 5%.Keywords
Rwanda is currently enhancing the use of green energy sources, particularly for transportation. Transportation is an inseparable component of human life. Because fuel prices throughout the world are increasing daily, especially in remote areas, there is an enormous need to search for alternatives to conserve these natural resources and facilitate easy transport of human beings. Renewable energy sources that power electric vehicles can help to solve the energy shortage problems in remote areas. Different researchers have shown the importance of electrical energy storage to encourage the use of electrical vehicles with renewable energy sources [1]. The utilization of small electronics, such as cellphones, tablets, and laptops, as well as large equipment, such as electric vehicles (EVs), which rely on LIBs as energy sources, is becoming more prevalent in Rwanda. There is a need to analyze storage systems that serve different energy-dependent systems. The storage system loses its capacity while in service, and through the degradation process, the storage system will ultimately lose its capacity and become so depleted that it is no longer usable. Sustainable battery efficiency is a crucial criterion for evaluating the economic, social, and environmental impact of electrified cars [2]. Moreover, frequent discharging and charging are harmful to battery life. In some extreme driving situations, the battery may be overcharged and discharged, which seriously reduces the battery life cycle and results in degradation of the internal circuit parameters of the batteries [3,4]. In such models, accurate determination of degradation is essential not only to realistically determine the business case but also to formulate intelligent strategies for charging and discharging plans for these batteries [5]. Based on the literature, battery capacity fading is modelled using different forms based on several aging mechanisms [6], such as empirical models, equivalent circuits or semi-empirical models, and electrochemical models [7]. Table 1 shows the different multiple aging processes that take part in the capacity and performance degradation of a lithium-ion battery. The degradation of LIBs is due to the different thermal, mechanical, and chemical processes that take place within the battery [8–10]. Therefore, a quantitative method to estimate EV battery degradation is required to evaluate the financial and technical feasibility of using electric bikes in the remote areas of Rwanda.

Battery degradation depends on parasitic physicochemical reactions that occur between various components of a battery cell, such as electrolytes, electrodes, additives, and current collectors. These mechanisms degrade the storable energy (capacity) and maximum power (impedance) of the batteries [11]. The total capacity fading of a battery is due to calendar aging (I = 0) and cycling (I ≠ 0) [12]. Lithium-ion batteries predominantly experience calendar aging through the development of a Solid Electrolyte Interface layer on the negative electrode. This process entails reduction of the electrolyte by lithium, which should be deposited within the graphite electrode [13]. The mechanism that best represents cycle aging is lithium plating on the negative electrode. This mechanism is characterized by the limitation of lithium insertion due to diffusion when the battery is charged at low temperatures or high current rates. In these situations, lithium is deposited on the negative electrode instead of being inserted into graphite [14]. Additionally, cycling aging process in LIBs are, for example, collector corrosion and particle cracking. Generally, this type of process occurs mainly under extreme use conditions at very deep discharges or very high current rates, and not under general use conditions [15]. Previous studies have focused on battery degradation. Most of them used an empirical formula with the help of experiments to determine inputs [16].
Reference [17] worked on modelling the battery of an EV from the electrical circuit representation to the thermal characterization, including the capacity fade description, 45 km per day was considered as the driving cycles. The total capacity loss over two years was found to be 2%–5% of the initial capacity, depending on the initial SOC of the battery. In [18], a technique for the aging analysis of a Li-ion cell due to the growth of a solid electrolyte interphase (SEI) layer driven by a solvent decomposition reaction at the electrode surface was presented. The model employs an iterative technique based on analytical solutions of the underlying conservation equations. This iterative method converged results within a few iterations, and the model was shown to agree well with results from past studies as well as a numerical simulation. According to [19], a model for quickly calculating battery lifetime was suggested. The Arrhenius formula, temperature-accelerated stress, and charge/discharge current-accelerated stress are used to forecast the battery capacity of the model. To calculate the rate of battery capacity fading as a function of the battery charge/discharge cycle numbers, they produced a fitted model. The battery lifetime was estimated using their model with a 40% relative inaccuracy. In [20], degradation analysis was carried out using the endurance driving cycle, which simulates the 4 WD electric vehicle with 450 V battery pack voltage, to examine the effects of cell cycle aging on its properties, such as voltage, capacity, and resistance fading. The cell’s health dropped to approximately 85% after being aged for 201 cycles in the lab. In [21], to reveal the aging mechanism during constant current cycling, operando electrochemical impedance spectroscopy, real-time temperature monitoring, and electrochemical cycling of both new and old batteries have been performed. According to the incremental capacity analysis (ICA) results, capacity fading during operation is primarily caused by polarization. Furthermore, the primary cause of electrode degradation is the creation of a solid-electrolyte interphase (SEI) and cathode-electrolyte interphase (CEI), according to a post-mortem study of the electrodes. Active materials are continuously lost because of the development and evolution of the interface during cycling, which include thickening and chemical changes. In [22], an enhanced lithium-ion battery degradation model that considered the influence of the cycle current and was based on the electrochemical mechanism of capacity decline was proposed. The starting values of the model parameters were determined using genetic methods. The outcomes confirmed the suitability of the suggested approach for HESS management as well as its accuracy and resilience.
This study focuses on the capacity fading analysis of lithium manganese oxide batteries (LMO) based on different real driving cycles of Rwanda to understand the different factors that influence battery capacity loss, utilizing combined calendar and cyclic aging profiles. By quantifying the magnitude of battery degradation due to different driving cycles from different itineraries, the influence of the load profile and temperature was considered. To obtain different current profiles, which are the inputs to the battery cell, driving cycles were generated using a WebPlotDigitizer [23]. It was considered that the E-bike riders used their forces at the flat surfaces and the hilly region energy from the battery to assist in climbing. MATLAB was used to post-process the Excel data generated by the WebPlotDigitizer. The cell, high power Kokam NMC (Nickel Manganese Cobalt) cell (18650), lithium-ion cells were utilized for this study due its high power, good cycling stability and highest thermal stability which is crucial issue for the safe operation of Li-ion batterie [24–26], Table 2 shows more details of the used cell. It has various applications [27], such as in E-bikes, medical devices, EVs, and industry.

To analyze battery degradation, a self-adaptive Li-ion battery aging model SLIDE (simulator for lithium-ion degradation), which is a code project mainly written in C++ to perform fast simulations of lithium-ion battery degradation [28], was used. The inputs to the model process included the cell nominal voltage (V_nom_cell), current profiles (i) that were found using cartographic data [29], and reasonable cell temperatures (T_cell). The methods used in this study are illustrated in Fig. 1. In the first time, the bike paths available in Rwanda were selected using Google Maps [29], which is generally believed to have driving patterns comparable to those of conventional bicycles currently in use. In the second time, the chosen itineraries were uploaded to WebPlotDigitizer, and the information about the duration of the journey, the time required to travel its distance, and the profile elevation is obtained from a map obtained from Google Maps. The generated data were in the form of comma-separated values (CSV). In the last time, mechanical dynamic modelling was performed using MATLAB to generate the driving cycle profile using the CSV-generated data as the input. To better express the concept of describing the mechanical dynamics of a bicycle for a comprehensive pedelec system model, different forces to overcome to propel the bicycle are considered [30]. A driving profile represents the daily use of an electric vehicle, for instance, home-to-work and then work-to-home, with a full charge at the end of the day [9]. A dynamic driving load profile was employed in this study. Finally, these driving cycles were entered into the SLIDE using the profile aging function to analyze the degradation. The generated current profile was applied to cycle the cell to analyze the behavior of the critical aging mechanisms and their impact on the capacity fade in a lithium-ion cell. The results did not consider the effect of chemical composition in this study.
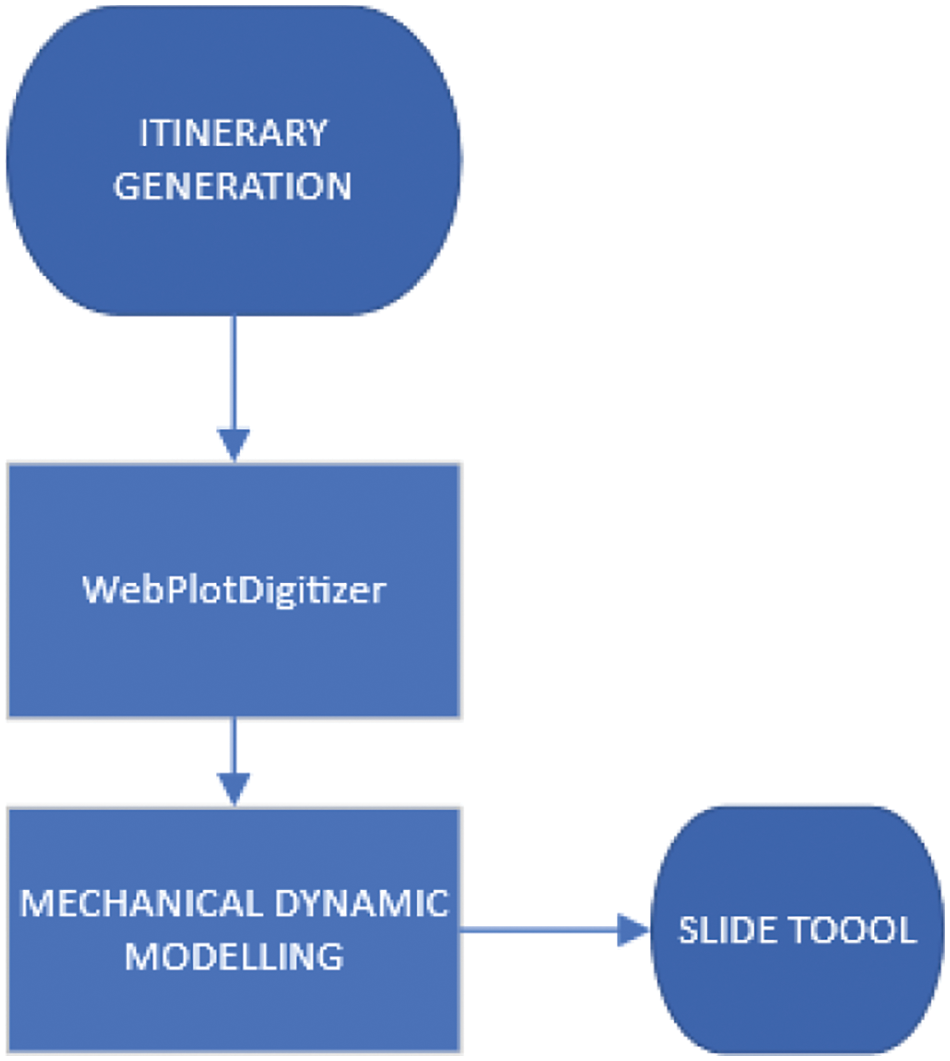
Figure 1: Flowchart showing used methodology
The current profiles used are shown in Fig. 2 along with the generated current profiles. As shown in Fig. 2a, the battery has sufficient time to relax; from 696 s to the end, the battery energy does not assist the rider. On the other side in Fig. 2b, the battery produces and consumes energy for the entire itinerary, for this Jali_Balayi route the battery current discharging is considerable compared to the KN206_Kigali route.
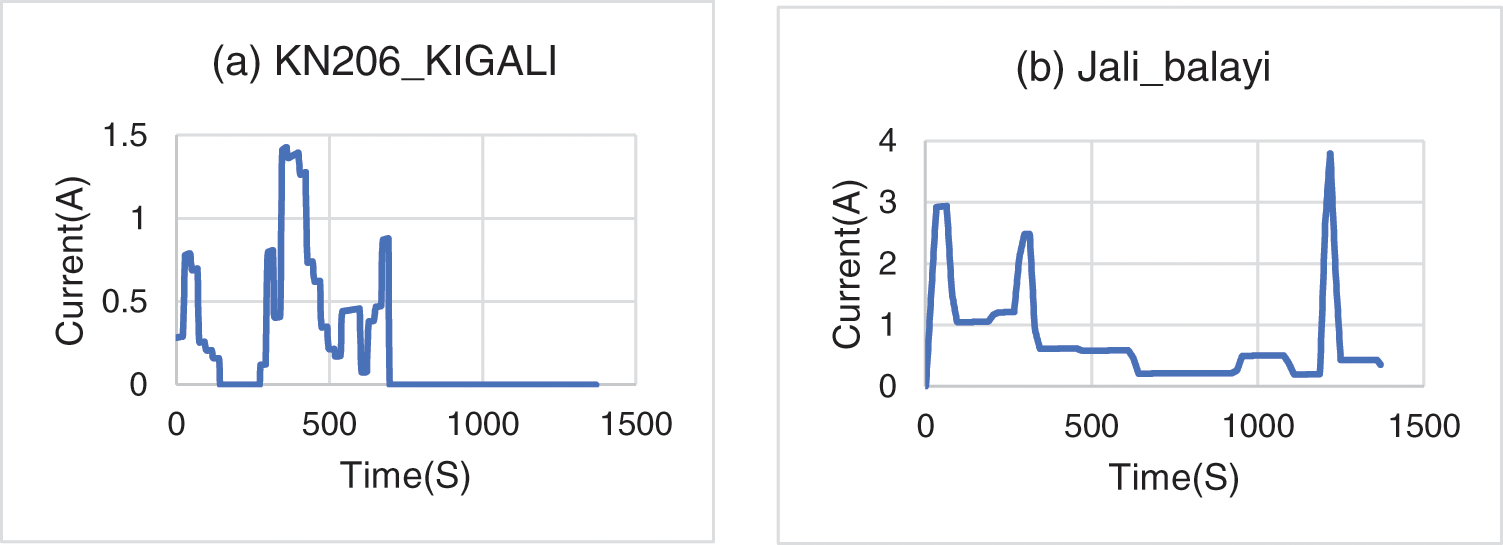
Figure 2: Current cycling profiles of selected itineraries
2 Discussion and Results Analysis
A simulation was performed to evaluate the degradation at constant current and voltage. The cell was discharged/charged at 1C CCCV using the generated driving cycles. This was evaluated under different conditions. For the first case, the state of charge (SoC) was between 0 and 100; 10 and 90 at 25°C, in the second case the SoC was between 0 and 100 at 45°C.
The results in Fig. 3 show that the thickness of the SEI layer increases rapidly in the early stages, which is the cause of an early time high rate of degradation, as shown in Figs. 4 and 5. The loss of lithium inventory increased rapidly in the early cycles, but the direct current (DC) resistance of the cell increased linearly, leading to an increase in the SEI. This led to an increase in the total DC resistance, which caused a decrease in the capacity of the cell. Consider the same temperature for Fig. 3b, at different states of charge (SoC).
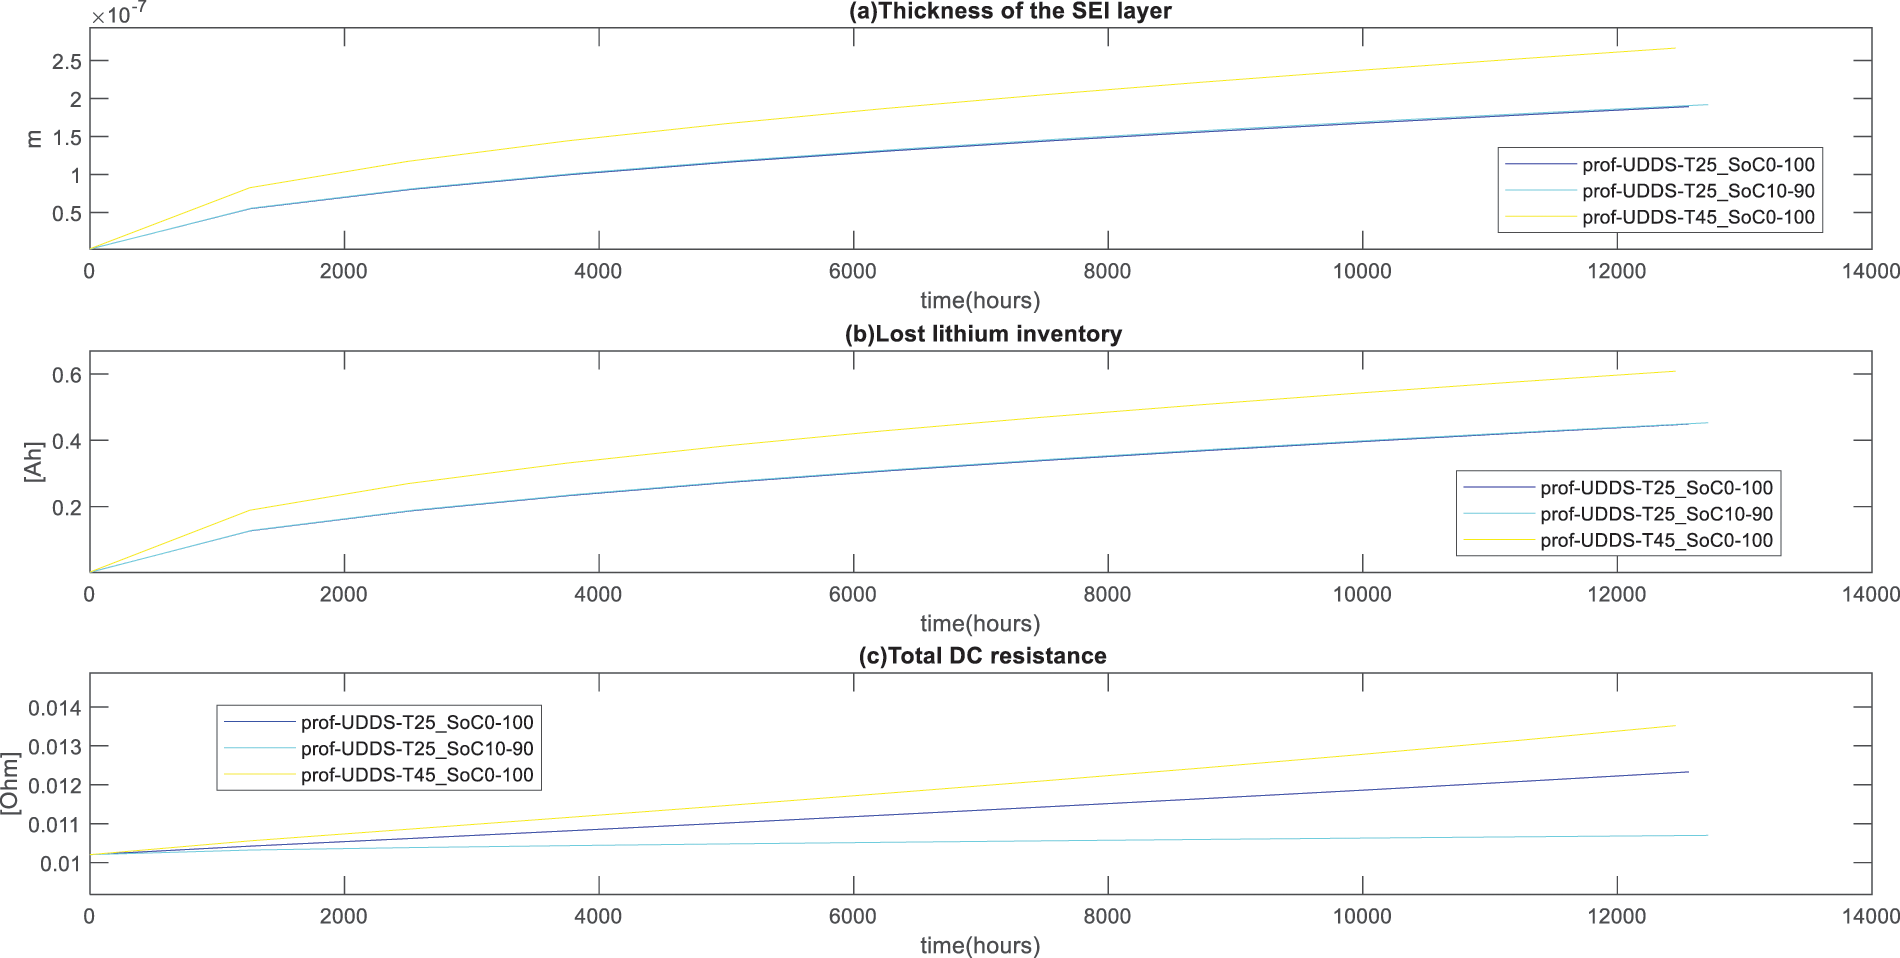
Figure 3: Thickness of the SEI layer, Lost lithium inventory and total DC resistance for route KN206
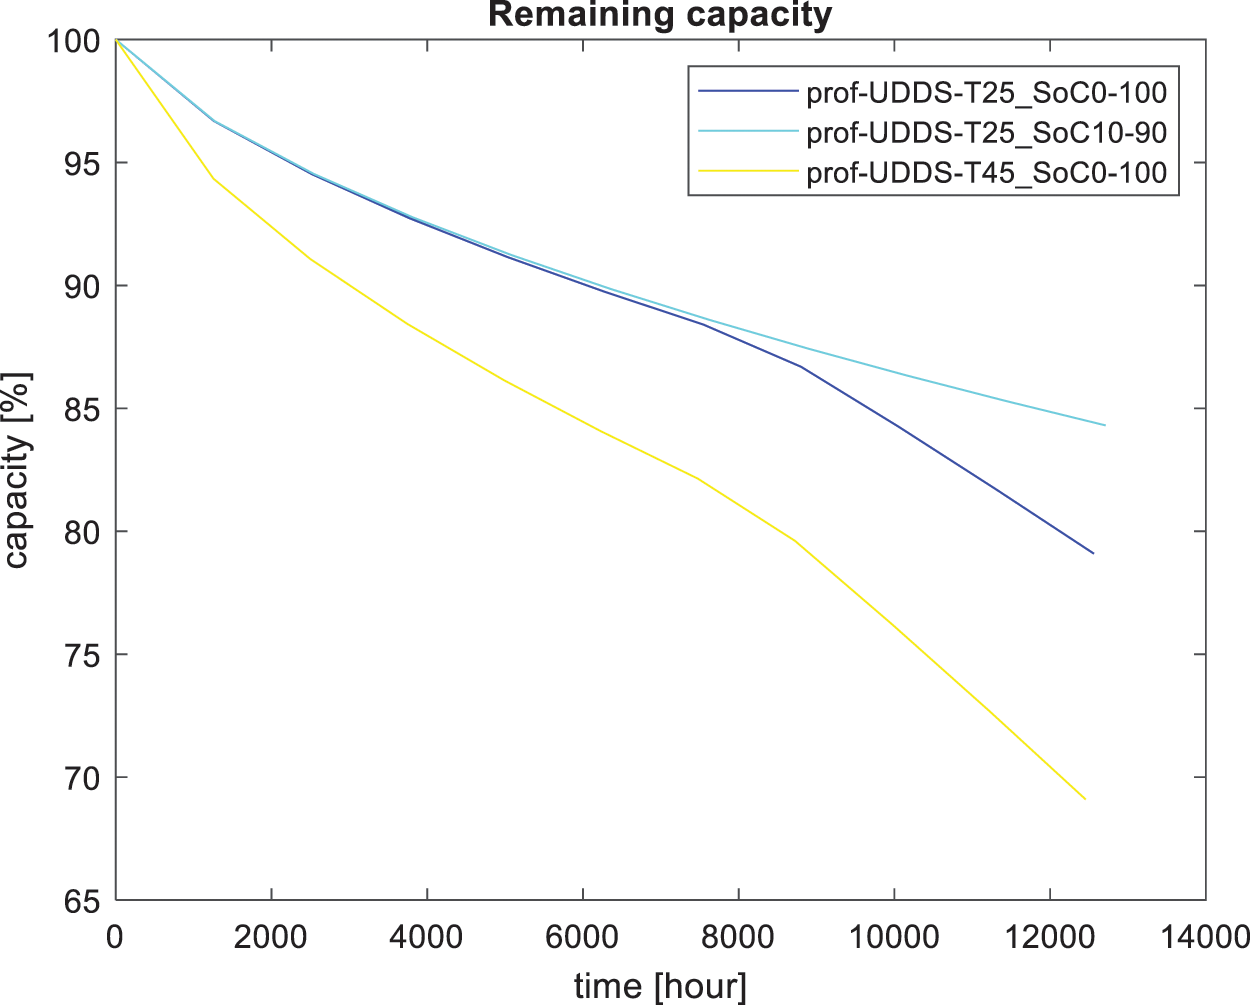
Figure 4: Capacity loss overtime for route KN 206 street Kigali
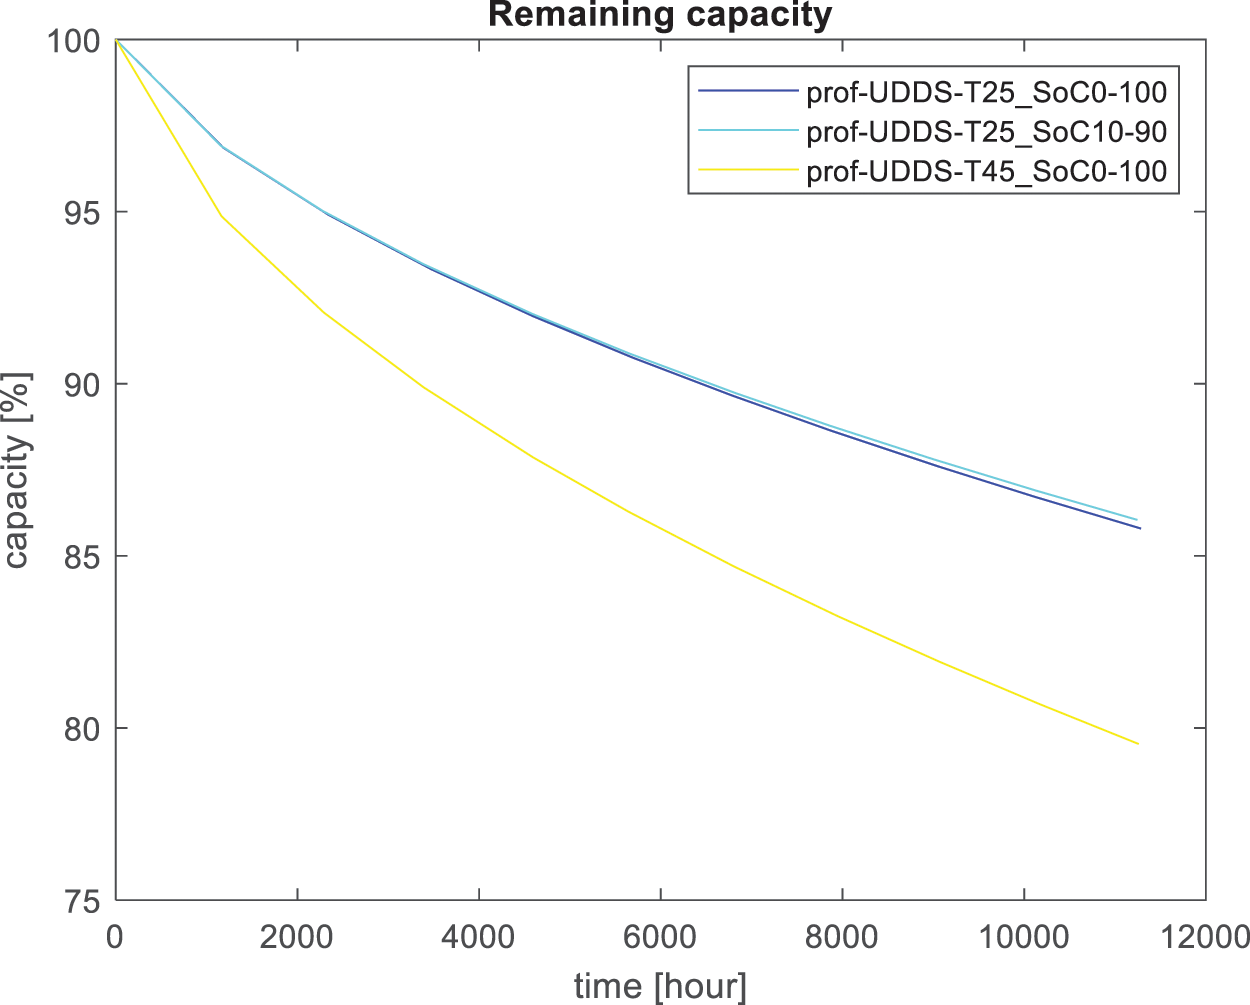
Figure 5: Capacity loss overtime for route Jali balayi
Fig. 3a describes the effect of the temperature and discharging and charging cycles on the battery performance of the E-bike. At the same discharging/charging cycle with the SoC ranging between 0% to 100%, the thickness of SEI layers reached to 2.66 × 10⁻⁷ m after 1245.1 h at 45°C while the one with the environment of 25°C reached 1.91 × 10⁻⁷ m after 127,122.6 h. It is clear that for the E-bike user who maintains the charge and discharge cycle between 10% and 90% at 45°C, the thickness of the SEI layers reached 1.89 × 10⁻⁷ m after 12,561.2 h. For the charging cycle, where the battery is fully discharged and fully charged (0%–100%), the lost lithium inventory reaches 0.608 Ah after 12,457.1 h. For the case, where the battery was drained to 10% and charged to 90%, lost lithium inventory reaches the 0.45 Ah after 12,712.6 h. For the same range of discharging and charging (0%–100%) at 45°C the lost lithium inventory recorded is 0.608 Ah after 12,457.1 h while the 0.45 Ah after 12,561.2 h was reached using the environment of 25°C. The change in the thickness of the SEI layers and the loss of lithium inventory have proportional effects on the internal resistance of lithium-ion batteries. Fig. 3c shows that at the same temperature of 25°C, 0.0123 Ω was recorded after 12,561.6 h for the charging cycle that used SoC ranging between 0% and 100%, while 0.0107 Ω was recorded for SoC ranging between 10 and 90. maintaining the same SoC ranging from 0 to 100, at 45°C, 0.0135 Ω was recorded after 12,457.1 h.
Based on these recorded data, it was found that the loss of lithium inventory and increase in total DC resistance in the lithium-ion cell depend on the itinerary elevation, state of charge, and temperature. SEI growth results in an increase in electrode impedance and, consequently, an overall capacity loss [18], as shown in Fig. 6, where the capacity loss changes with respect to both the SEI and the loss of lithium inventory. As shown in Figs. 4 and 5, the degradation rate was significantly higher during the early cycles than during the late cycles and then increased rapidly at the end of life (EoL). It is shown that temperature is one of the most crucial parameters to consider: the battery, which is used in an environment with high temperature, its capacity fades faster than that in an environment with low temperature.
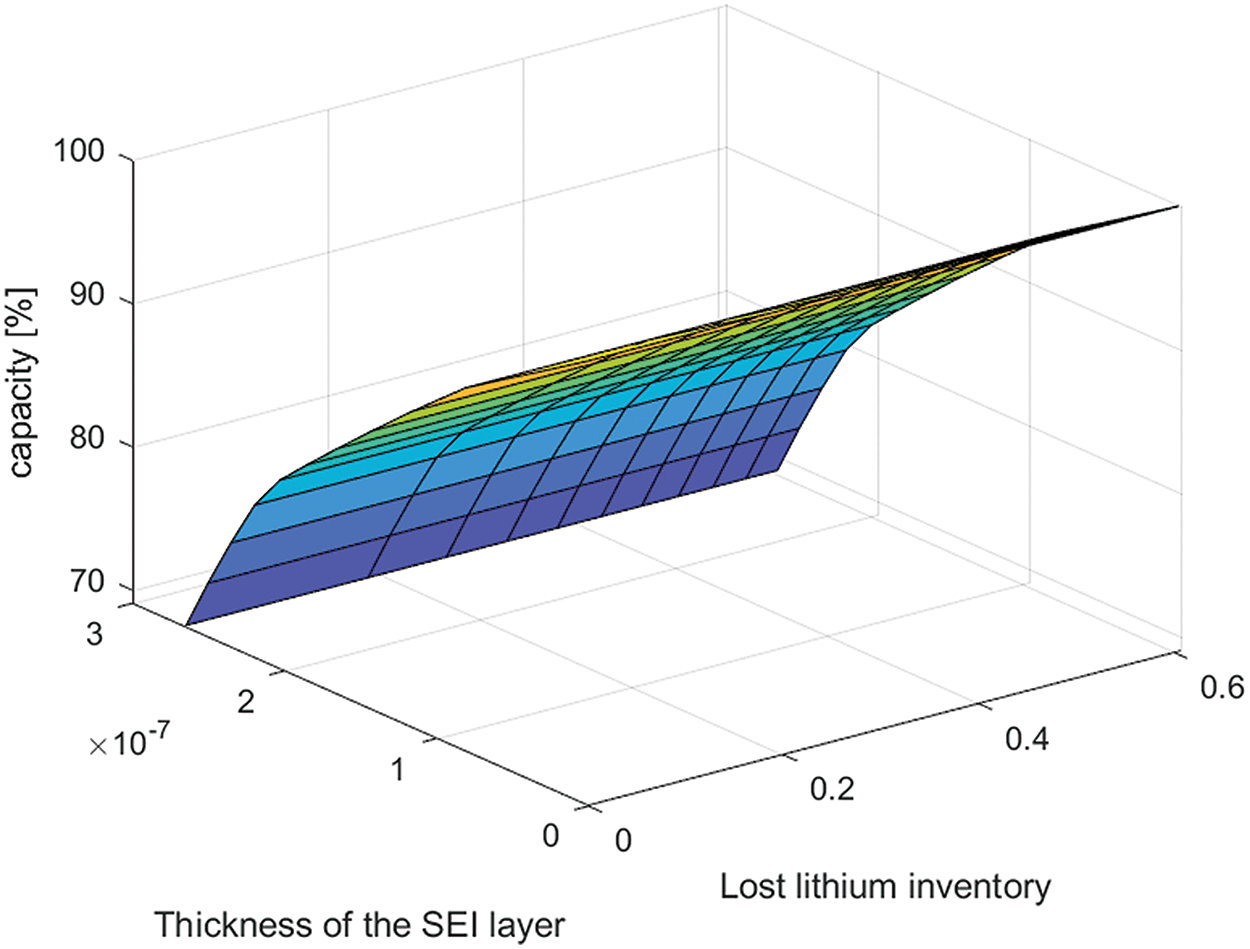
Figure 6: Capacity loss with respect to both SEI and loss of lithium inventory
For Fig. 4, considering the same temperature of 25°C, for the e-bike rider who was fully discharged and fully charged (0% to 100%), a capacity of 79.09% remain after 12,561.2 h while for the rider who drained the battery to 10 and charged to 90%, 84.30% remain after 12,712.6 h. Considering the same range of state of charge (0% to 100%), 69.09% remain after 12,457.1 h in the environment of 45°C.
In the case of the state of charge, it was discovered that fully discharging the battery negatively affected its life. Normally, the life of an EVs battery ends when the battery loses 20% of its nominal capacity [5]. Considering the environment at 45°C, in Fig. 4, the life loss to 80% capacity would be approximately 8723 h when using the itinerary of Jali balayi (Fig. 5). This critical point was reached in 11,261 h. For the Jali balayi route, it took a long time to lose 20% of the original value. For the driving cycle shown in Fig. 2a, more than half of the itinerary the E-bike rider uses human force to propel the E-bike, and the battery does not assist. it has a long distance where the battery is not in use, From at the second of 149 up to the second of 268 s and from the second of 696 up to the value of 1367 s, calendar aging (under storage) [2,6,31], Lithium-ion batteries slowly lose their storage capacity during calendar aging and cycling [12]. For this itinerary KN 206 Street Kigali, calendar aging has dominated cycling aging considerably, which is why the fading was faster than the E-bike that used the route of Jali balayi.
Considering the different cycling charging levels for KN 206 Street Kigali (Fig. 4), at 25°C, nearly 80% remains after 12,561.2 h using an SoC ranging between 0% and 100%. On the other side, using SoC ranging between 10% to 90%, nearly 85 % of initial capacity remains after 12,712.6 h. Considering the utilized driving cycles, it is clear that calendar aging has a considerable negative impact at a very high state of charge, as proven in [11]. For route Jali balayi (Fig. 5), nearly 86% of what remains after 11,285.5 h considering SoC ranging between 0% and 100%. For the case of the range between 10% and 90%, 86% of the initial capacity remains after 11,246 h.
The graph in Fig. 6 illustrates the loss of capacity as a result of both SEI (Solid Electrolyte Interphase) formation and lithium-ion loss. SEI formation leads to the formation of a thicker and more resistive layer, which in turn restricts the movement of lithium ions between the electrolyte and the electrode. Additionally, the loss of lithium ions signifies a reduction in potential charge storage capacity. As the number of lost lithium ions increased, fewer ions became available for cycling. This reduction in available ions ultimately result in a decrease in the capacity of the charging and discharging cycles.
This study aimed to contribute to the sustainable adoption of power-assisted bicycles in Rwanda for the productive use of energy by identifying the driving profiles that lead to accelerated degradation. In this study, a lithium-ion cell was subjected to a combination of calendar and cycling aging to understand its performance in electrical cycling energy storage. Based on real-world data from Rwanda, two driving cycles were generated using the WebPlotDigitizer. Using SLIDE and MATLAB, these driving cycles were utilized to analyze the life span of lithium-ion batteries at different temperatures. Environments of 45°C and 25°C were considered, and it was understood that the battery used in an environment with high temperatures would fade at a higher rate than those operating at low temperatures. Concerning the effect of itineraries, the route KN 206 Street Kigali where the energy from the battery does not assist to propel the E-bike for 58% of the mileage, has degraded at a high rate compared to the one that is being used in the region of Jali balayi route; considering the same environmental temperature of 45°C, the life loss to 80% capacity would be about 8723 h while using the itinerary of Jali balayi, this critical point will be reached in 11,261 h. Finally, it was discovered that by draining the battery to 10 and charging it to 90% of its initial capacity, capacity fading decreased by 5%. Therefore, E-bike riders are advised not to fully discharge their E-bike batteries. The used method is easy to apply and it is one of the methods that can be used by everyone considering the local real data. Future research can be conducted to model and analyze the battery degradation of the selected itineraries, as well as other routes, by considering the battery’s chemical composition of materials using the same procedures.
Acknowledgement: The authors of this paper would like to thank the Engineering and Physics Sciences Research Council (UK) under the Project “RENGA: Resilient Electricity Networks for a Productive Grid Architecture” from the Imperial College of London, UK for their support. Furthermore, the authors acknowledge important support from the African Center of Excellence Energy for Sustainable Development located at the University of Rwanda, College of Science and Technology (UR-CST). In addition, authors would like to thank the editors and anonymous reviewers for their constructive and insightful comments.
Funding Statement: This study was supported by the Global Challenges Research Fund (GCRF) through the Engineering and Physical Sciences Research Council UK under project RENGA (EP/R030235/1). It was also funded by the African Center of Excellence in Energy for Sustainable Development (ACE-ESD) under the University of Rwanda, College of Science and Technology.
Author Contributions: The authors confirm their contribution to the paper as follows: study conception and design: Adrià Junyent-Ferré, Aimable Ngendahayo; data collection: Aimable Ngendahayo, Adrià Junyent-Ferré; analysis and interpretation of results: Aimable Ngendahayo, Joan Marc Rodriguez Bernuz; methodology: Aimable Ngendahayo, Adrià Junyent-Ferré; software: Joan Marc Rodriguez Bernuz, Adrià Junyent-Ferré; draft manuscript preparation: Aimable Ngendahayo; supervision: Adrià Junyent-Ferré, Joan Marc Rodriguez Bernuz, Etienne Ntagwirumugara; project administration: Adrià Junyent-Ferré, Etienne Ntagwirumugara. All authors reviewed the results and approved the final version of the manuscript.
Availability of Data and Materials: The data used to support the findings of this study are available from the corresponding author upon request.
Ethics Approval: Not applicable.
Conflicts of Interest: The authors declare that they have no conflicts of interest to report regarding the present study.
References
1. I. J. Fernández, C. F. Calvillo, and J. Boal, “Capacity fade and aging models for electric batteries and optimal charging strategy for electric vehicles,” Energy, vol. 60, no. 12, pp. 35–43, 2013. doi: 10.1016/j.energy.2013.07.068. [Google Scholar] [CrossRef]
2. E. Paffumi and G. Martini, “Real-world mobility and environmental data for the assessment of in-vehicle battery capacity fade,” World Electr. Veh. J., vol. 12, no. 1, 2021, Art. no. 48. doi: 10.3390/wevj12010048. [Google Scholar] [CrossRef]
3. C. Zhang, D. Wang, B. Wang, and F. Tong, “Battery degradation minimization-oriented hybrid energy storage system for electric vehicles,” Energies, vol. 13, no. 1, 2020, Art. no. 246. doi: 10.3390/en13010246. [Google Scholar] [CrossRef]
4. S. Tamilselvi, N. Karuppiah, and R. R. Bobba, “Capacity fade modeling of li-ion battery using evolutionary algorithm,” E3S Web Conf., vol. 87, 2019, Art. no. 01026. doi: 10.1051/e3sconf/20198701026. [Google Scholar] [CrossRef]
5. A. Maheshwari, N. G. Paterakis, M. Santarelli, and M. Gibescu, “Optimizing the operation of energy storage using a non-linear lithium-ion battery degradation model,” Appl. Energy, vol. 261, 2020, Art. no. 114360. doi: 10.1016/j.apenergy.2019.114360. [Google Scholar] [CrossRef]
6. D. Wang, J. Coignard, T. Zeng, C. Zhang, and S. Saxena, “Quantifying electric vehicle battery degradation from driving vs. vehicle-to-grid services,” J. Power Sources, vol. 332, no. 6064, pp. 193–203, 2016. doi: 10.1016/j.jpowsour.2016.09.116. [Google Scholar] [CrossRef]
7. M. Lucu, I. Gandiaga, and H. Camblong, “Review article A critical review on self-adaptive Li-ion battery ageing models,” J. Power Sources, vol. 401, pp. 85–101, 2018. doi: 10.1016/j.jpowsour.2018.08.064. [Google Scholar] [CrossRef]
8. Y. Liu, C. Liu, Y. Liu, F. Sun, J. Qiao and T. Xu, “Review on degradation mechanism and health state estimation methods of lithium-ion batteries,” J. Traffic Transp. Eng. (English Ed.), vol. 10, no. 4, pp. 578–610, 2023. doi: 10.1016/j.jtte.2023.06.001. [Google Scholar] [CrossRef]
9. E. Vasta et al., “Models for battery health assessment: A comparative evaluation,” Energies, vol. 16, no. 2, pp. 1–34, 2023. doi: 10.3390/en16020632. [Google Scholar] [CrossRef]
10. K. Smith, Y. Shi, and S. Santhanagopalan, “Degradation mechanisms and lifetime prediction for lithium-ion batteries-A control perspective,” in Proc. Am. Control Conf., vol. 2015, pp. 728–730, 2015. doi: 10.1109/ACC.2015.7170820. [Google Scholar] [CrossRef]
11. A. C. Effects, “Modelling lithium-ion battery ageing in electric vehicle applications calendar and cycling,” Batteries, vol. 6, no. 1, pp. 1–18, 2020. doi: 10.3390/batteries6010014. [Google Scholar] [CrossRef]
12. S. Hosen, “iScience ll battery lifetime prediction and performance assessment of different modeling approaches,” iScience, vol. 24, no. 2, 2021, Art. no. 102060. doi: 10.1016/j.isci.2021.102060. [Google Scholar] [CrossRef]
13. J. Li, R. G. Landers, and J. Park, “A comprehensive single-particle-degradation model for battery state-of-health prediction,” J. Power Sources, vol. 456, 2020, Art. no. 227950. doi: 10.1016/j.jpowsour.2020.227950. [Google Scholar] [CrossRef]
14. J. S. Edge et al., “Lithium ion battery degradation: What you need to know,” Phys Chem. Chem. Phys., vol. 23, no. 14, pp. 8200–8221, 2021. doi: 10.1039/D1CP00359C. [Google Scholar] [PubMed] [CrossRef]
15. S. E. J. O’Kane et al., “Lithium-ion battery degradation: How to model it,” Phys Chem. Chem. Phys., vol. 24, no. 13, pp. 7909–7922, 2022. doi: 10.1039/D2CP00417H. [Google Scholar] [PubMed] [CrossRef]
16. Y. J. Lee et al., “Cycle life modeling and the capacity fading mechanisms in a graphite/LiNi0.6Co0.2Mn0.2O2 cell,” J. Appl. Electrochem., vol. 45, no. 5, pp. 419–426, 2015. doi: 10.1007/s10800-015-0811-6. [Google Scholar] [CrossRef]
17. L. Calearo, A. Thingvad, and M. Marinelli, “Modeling of battery electric vehicles for degradation studies,” in 2019 54th Int. Univ. Power Eng. Conf., vol. 10, pp. 1–6, 2019. doi: 10.1109/UPEC.2019.8893474. [Google Scholar] [CrossRef]
18. M. Parhizi, M. Pathak, J. K. Ostanek, and A. Jain, “An iterative analytical model for aging analysis of Li-ion cells,” J. Power Sources, vol. 517, no. 4, Jan. 2022, Art. no. 230667. doi: 10.1016/j.jpowsour.2021.230667. [Google Scholar] [CrossRef]
19. M. Zarei-Jelyani, M. Sarshar, M. Babaiee, and N. Tashakor, “Development of lifetime prediction model of lithium-ion battery based on minimizing prediction errors of cycling and operational time degradation using genetic algorithm,” J. Renew. Energy Environ. (JREE), vol. 5, no. 3, pp. 60–63, 2018. doi: 10.30501/jree.2018.93531. [Google Scholar] [CrossRef]
20. F. Salek, A. Azizi, S. Resalati, P. Henshall, and D. Morrey, “Mathematical modelling and simulation of second life battery pack with heterogeneous state of health,” Mathematics, vol. 10, no. 20, 2022, Art. no. 3843. doi: 10.3390/math10203843. [Google Scholar] [CrossRef]
21. J. Guo et al., “Unravelling and quantifying the aging processes of commercial Li(Ni0.5Co0.2Mn0.3)O2/graphite lithium-ion batteries under constant current cycling,” J. Mater. Chem. A, vol. 11, no. 1, pp. 41–52, 2022. doi: 10.1039/D2TA05960F. [Google Scholar] [CrossRef]
22. C. Liu, Y. Wang, and Z. Chen, “Degradation model and cycle life prediction for lithium-ion battery used in hybrid energy storage system,” Energy, vol. 166, no. 2, pp. 796–806, 2019. doi: 10.1016/j.energy.2018.10.131. [Google Scholar] [CrossRef]
23. D. Drevon, S. R. Fursa, and A. L. Malcolm, “Intercoder reliability and validity of WebPlotDigitizer in extracting graphed data,” Behav. Modif., vol. 41, no. 2, pp. 323–339, 2017. doi: 10.1177/0145445516673998. [Google Scholar] [PubMed] [CrossRef]
24. C. M. Julien, A. Mauger, K. Zaghib, and H. Groult, “Comparative issues of cathode materials for Li-ion batteries,” Inorganics, vol. 2, no. 1, pp. 132–154, 2014. doi: 10.3390/inorganics2010132. [Google Scholar] [CrossRef]
25. H. Sun and K. Zhao, “Electronic structure and comparative properties of LiNixMnyCozO2 cathode materials,” J. Phys. Chem., vol. 121, no. 11, pp. 6002–6010, 2017. doi: 10.1021/acs.jpcc.7b00810. [Google Scholar] [CrossRef]
26. J. M. Zheng, X. B. Wu, and Y. Yang, “A comparison of preparation method on the electrochemical performance of cathode material Li[Li0.2Mn0.54Ni0.13Co0.13]O2 for lithium ion battery,” Electrochim. Acta., vol. 56, no. 8, pp. 3071–3078, 2011. doi: 10.1016/j.electacta.2010.12.049. [Google Scholar] [CrossRef]
27. I. Buchmann,BU-205: Types of Lithium-ion-Battery University. 2019. Accessed: Mar. 29,2024. [Online]. Available: https://batteryuniversity.com/article/bu-205-types-of-lithium-ion#google_vignette [Google Scholar]
28. J. M. Reniers, G. Mulder, and D. A. Howey, “Review and performance comparison of mechanical-chemical degradation models for lithium-ion batteries,” J. Electrochem. Soc., vol. 166, no. 14, pp. A3189–A3200, 2019. doi: 10.1149/2.0281914jes. [Google Scholar] [CrossRef]
29. Z. M. Baqir, “E-bike load demand estimation for transport using cartographic data,” Comput. Inform., vol. 1, no. 1, pp. 26–35, 2021. doi: 10.62189/ci.1251621. [Google Scholar] [CrossRef]
30. G. Thejasree and R. Maniyeri, “E-bike system modeling and simulation,” in Proc. 2019 IEEE Int. Conf. Intell. Syst. Green Technol., ICISGT 2019, no. 1, pp. 9–14, 2019. doi: 10.1109/ICISGT44072.2019. [Google Scholar] [CrossRef]
31. J. Purewal et al., “Degradation of lithium ion batteries employing graphite negatives and nickel e cobalt e manganese oxide þ spinel manganese oxide positives: Part 1, aging mechanisms and life estimation,” J. Power Sources, vol. 269, no. 5, pp. 937–948, 2014. doi: 10.1016/j.jpowsour.2014.07.030. [Google Scholar] [CrossRef]
Cite This Article
 Copyright © 2024 The Author(s). Published by Tech Science Press.
This work is licensed under a Creative Commons Attribution 4.0 International License , which permits unrestricted use, distribution, and reproduction in any medium, provided the original work is properly cited.
 Downloads
 Citation Tools