
 Submit a Paper
 Propose a Special lssue
 Open Access
ARTICLE

Phase Transitions and Seepage Characteristics during the Depletion Development of Deep Condensate Gas Reservoirs
1 Exploration and Development Technology Research and Development Center of Ultra-Deep Complex Oil and Gas Reservoirs, Petro China Tarim Oilfield Company, Korla, 841000, China
2 School of Petroleum Engineering, China University of Petroleum (East China), Qingdao, 266580, China
* Corresponding Author: Yuliang Su. Email:
(This article belongs to the Special Issue: Integrated Geology-Engineering Simulation and Optimizationfor Unconventional Oil and Gas Reservoirs)
Energy Engineering 2024, 121(10), 2797-2823. https://doi.org/10.32604/ee.2024.052007
Received 20 March 2024; Accepted 21 June 2024; Issue published 11 September 2024
 View Full Text
 Download PDF
Abstract
Deep condensate gas reservoirs exhibit highly complex and variable phase behaviors, making it crucial to understand the relationship between fluid phase states and flow patterns. This study conducts a comprehensive analysis of the actual production process of the deep condensate gas well A1 in a certain oilfield in China. Combining phase behavior analysis and CMG software simulations, the study systematically investigates phase transitions, viscosity, and density changes in the gas and liquid phases under different pressure conditions, with a reservoir temperature of 165°C. The research covers three crucial depletion stages of the reservoir: single-phase flow, two-phase transition, and two-phase flow. The findings indicate that retrograde condensation occurs when the pressure falls below the dew point pressure, reaching maximum condensate liquid production at around 25 MPa. As pressure decreases, gas phase density and viscosity gradually decrease, while liquid phase density and viscosity show an increasing trend. In the initial single-phase flow stage, maintaining a consistent gas-oil ratio is observed when both bottom-hole and reservoir pressures are higher than the dew point pressure. However, a sudden drop in bottom-hole pressure below the dew point triggers the production of condensate oil, significantly reducing subsequent gas and oil production. In the transitional two-phase flow stage, as the bottom-hole pressure further decreases, the reservoir exhibits a complex flow regime with coexisting areas of gas and liquid. In the subsequent two-phase flow stage, when both bottom-hole and reservoir pressures are below the dew point pressure, a significant increase in the gas-oil ratio is observed. The reservoir manifests a two-phase flow regime, devoid of single-phase gas flow areas. For low-pressure conditions in deep condensate gas reservoirs, considerations include gas injection, gas lift, and cyclic gas injection and production in surrounding wells. Additionally, techniques such as hot nitrogen or CO2 injection can be employed to mitigate retrograde condensation damage. The implications of this study are crucial for developing targeted development strategies and enhancing the overall development of deep condensate gas reservoirs.Keywords
Condensate gas reservoir is a unique type of gas reservoir with high economic value, characterized by properties of both oil and gas reservoirs. During its development, complex phase behavior persists, presenting significant challenges to efficient exploitation [1]. Especially in the later stages of development, as reservoir pressure declines, retrograde condensation damage becomes increasingly severe. Therefore, studying the phase behavior and productivity of condensate gas is a fundamental task in this field. By examining the phase behavior and flow patterns of reservoir fluids in condensate gas fields and applying these findings to field development, while also proposing measures to mitigate retrograde condensation damage, it is crucial for the effective exploitation of condensate gas fields [2]. This research is crucial for devising rational development approaches, continuously elevating the development proficiency of condensate gas fields, and enhancing overall development benefits.
Accurate Pressure-Volume-Temperature (PVT) evaluation of condensate gas is the foundation for the development of condensate gas reservoirs [3]. In response to this, scholars have conducted a comprehensive review of China’s condensate gas reservoirs, elucidating relevant phase behavior characteristics. They assert that acquiring initial samples of condensate oil and oil-gas mixtures, along with accurate PVT experimental data, is fundamental to establishing fluid phase models. Additionally, they propose that a cyclic gas injection scheme is a key factor in effectively developing condensate gas reservoirs [4]. Guo et al. determined the dew point pressure of the target block fluid based on samples obtained from the field through experimental methods, and evaluated the maximum condensate volume of the formation fluid due to pressure reduction. Additionally, they combined the equation of state with compositional characterization methods to establish a corresponding thermodynamic model for simulating the phase behavior of the target fluid [5]. Qi et al. believed that interfacial phenomena and reservoir deformation do not exist during the development process of this type of gas reservoir, and such effects may be negligible [6]. Sun et al. conducted PVT tests on the target fluid and clarified the variation patterns of phase parameters with temperature and pressure. They concluded that an increase in temperature leads to a decrease in both dew point pressure and fluid compressibility [7]. For condensate gas reservoirs, non-equilibrium effects may occur when pressure changes or flow rates are below phase change or mass transfer rates. Based on this issue, some scholars have utilized numerical methods to simulate the relevant characteristics of reservoir fluids under these conditions in constant composition expansion (CCE) experiments. They believe that increasing the production pressure drawdown can, to some extent, enhance condensate recovery, mitigate reservoir damage, and improve gas well production rates [8]. Research on the phase equilibrium behavior during cyclic water injection in condensate gas reservoirs and gas storage processes has also been conducted [9–11]. Excessively low pressure during depletion development leads to substantial condensate deposition. This phenomenon not only reduces condensate recovery but also adversely affects the production rate of condensate gas [12]. Subsequent researchers have analyzed the production dynamics and flow patterns extensively [13,14], proposing strategies to improve the recovery of condensate gas reservoirs. Janiga et al. utilized machine learning algorithms to consider the phase behavior changes during the development of condensate gas reservoirs. They assessed the potential for enhanced recovery in the target gas reservoir and provided optimization measures for the next steps [15]. Some scholars have proposed analytical models to analyze production data of condensate oil and condensate gas under different conditions, further evaluating current reservoir properties [16,17]. Mokhtari et al. conducted an analysis of the actual production performance of the target condensate gas well before initiating their research. They concluded that the deposition of condensate near the wellbore could lead to unstable productivity following the decline phase in gas wells [18,19]. In summary, the precipitation of condensate oil results in multiphase flow conditions within the reservoir, impacting gas well productivity to a certain extent [20–22]. Given this phenomenon, it is particularly important to clarify the seepage characteristics of oil, gas, and water phases in underground environments [23]. Gao et al. [24] evaluated the flow characteristics of a deep condensate gas reservoir under high-temperature and high-pressure conditions based on production performance data. Zhang et al. [25] examined the impact of natural fractures on deep condensate gas reservoirs, studying changes in gas condensate composition and reservoir seepage behavior using finite element numerical simulations. Long et al. [26] conducted experimental studies on fluid seepage characteristics during underground gas cycling injection processes in condensate oil reservoirs with oil rims. Their work primarily focused on assessing fluid performance, gas-oil recovery rates, and the stability of underground gas storage [27]. Scholars have proposed a series of measures to address this issue. Sheydaeemehr et al. discovered through their research that altering wettability can enhance gas reservoir recovery, especially in a neutrally wet state. This finding provides a new approach for improving condensate gas reservoir recovery. By injecting modified surfactants to address condensate oil contamination in the formation, the gas production rates of wells can be increased. This method leverages the principle that modifying the surface interaction between the reservoir rock and the condensate can improve fluid flow and extraction efficiency, offering a practical solution to the challenges faced in the later stages of condensate gas reservoir development [28]. Simultaneously, based on reservoir characteristics, another method to improve the oil and gas recovery of condensate gas reservoirs is water injection. Research results indicate that water injection has a positive effect on condensate oil recovery [29]. Water injection development is more economically beneficial than cyclic gas injection [30]. Additionally, injecting dry gas into retrograde gas condensate reservoirs is an effective method for increasing production [31–33]. Meng et al. suggested that, compared to gas drive, high-rate throughput development is more favorable for the production of condensate oil/gas [34].
In summary, condensate gas reservoirs exhibit highly complex and variable phase behaviors. This complexity not only distinguishes them as a crucial type of reservoir different from others but also underscores the essential nature of studying these behaviors for the effective development of condensate gas reservoirs. Different from dry gas reservoirs, understanding the relationship between fluid phase behavior and mobility is crucial for accurate engineering calculations in condensate oil systems. For gas wells undergoing prolonged depletion, the trapped condensate oil in the formation, coupled with continuous pressure decline, results in unrecoverable losses. On the other hand, retrograde condensate can block some pore throats in the formation, reducing gas permeability, contaminating the formation, and decreasing gas well productivity. Therefore, this study employs numerical simulation methods, using fluid data from well A1 to construct a deep reservoir fluid phase and flow simulation model. First, the constructed phase model is used to analyze the variation patterns of fluid phase characteristics during depletion. Then, based on the actual development characteristics of condensate gas wells, the reservoir flow region is divided into a single-phase gas flow region, a gas-liquid coexistence transition zone, and a gas-liquid flow region, and the flow characteristics of each zone are analyzed. Finally, using the actual production data from different stages of well A1, the distribution patterns and flow characteristics of condensate and condensate gas in the reservoir were analyzed. This research provides a theoretical foundation for subsequent recovery enhancement measures for this well.
2 Phase Behavior Evolution in Deep Condensate Gas Reservoirs
The study of phase behavior in hydrocarbon gases has always been a crucial aspect of oil and gas field development. The composition and phase changes of condensate gas systems undergo constant alterations throughout the depletion process, making it imperative to unveil this complex permeation and flow phenomenon [35].
2.1 Establishment of Phase Behavior Model for Deep Condensate Gas
The Peng-Robinson (PR) equation of state is often used to describe the phase behavior of fluids within oil and gas reservoirs. Therefore, the theoretical foundation of the phase model in this study is based on the PR equation [36]. The selected deep condensate gas well A1 is located at a reservoir depth of 4300–4400 m. The reservoir temperature and pressure are 165°C and 42 MPa, respectively. Based on experiments and existing well fluid composition data (Table 1), as well as laboratory analysis data, suitable equations of state are chosen for hydrocarbon system phase equilibrium calculations. Methane and Cn heavy distillation components have significant impacts on phase equilibrium calculations. To improve calculation speed and accuracy, characterization of Cn is necessary to create an appropriate number of pseudo-components for the hydrocarbon system. Component splitting of C11+ is performed based on the well fluid composition data, as shown in Fig. 1. It is observed from Table 1 that unlike shallow condensate gas wells, the intermediate hydrocarbon components (C2–C6) in this deep condensate gas well account for 16.54 mol%, while the C7+ component constitutes 9.95 mol%, indicating higher concentrations of intermediate and heavy components. According to the research findings of Fang et al. [4], the fluid composition of this deep condensate gas well exhibits characteristics of near-critical state. Such fluids in the vicinity of the critical point are difficult to distinguish between gas and liquid phases in the single-phase region.
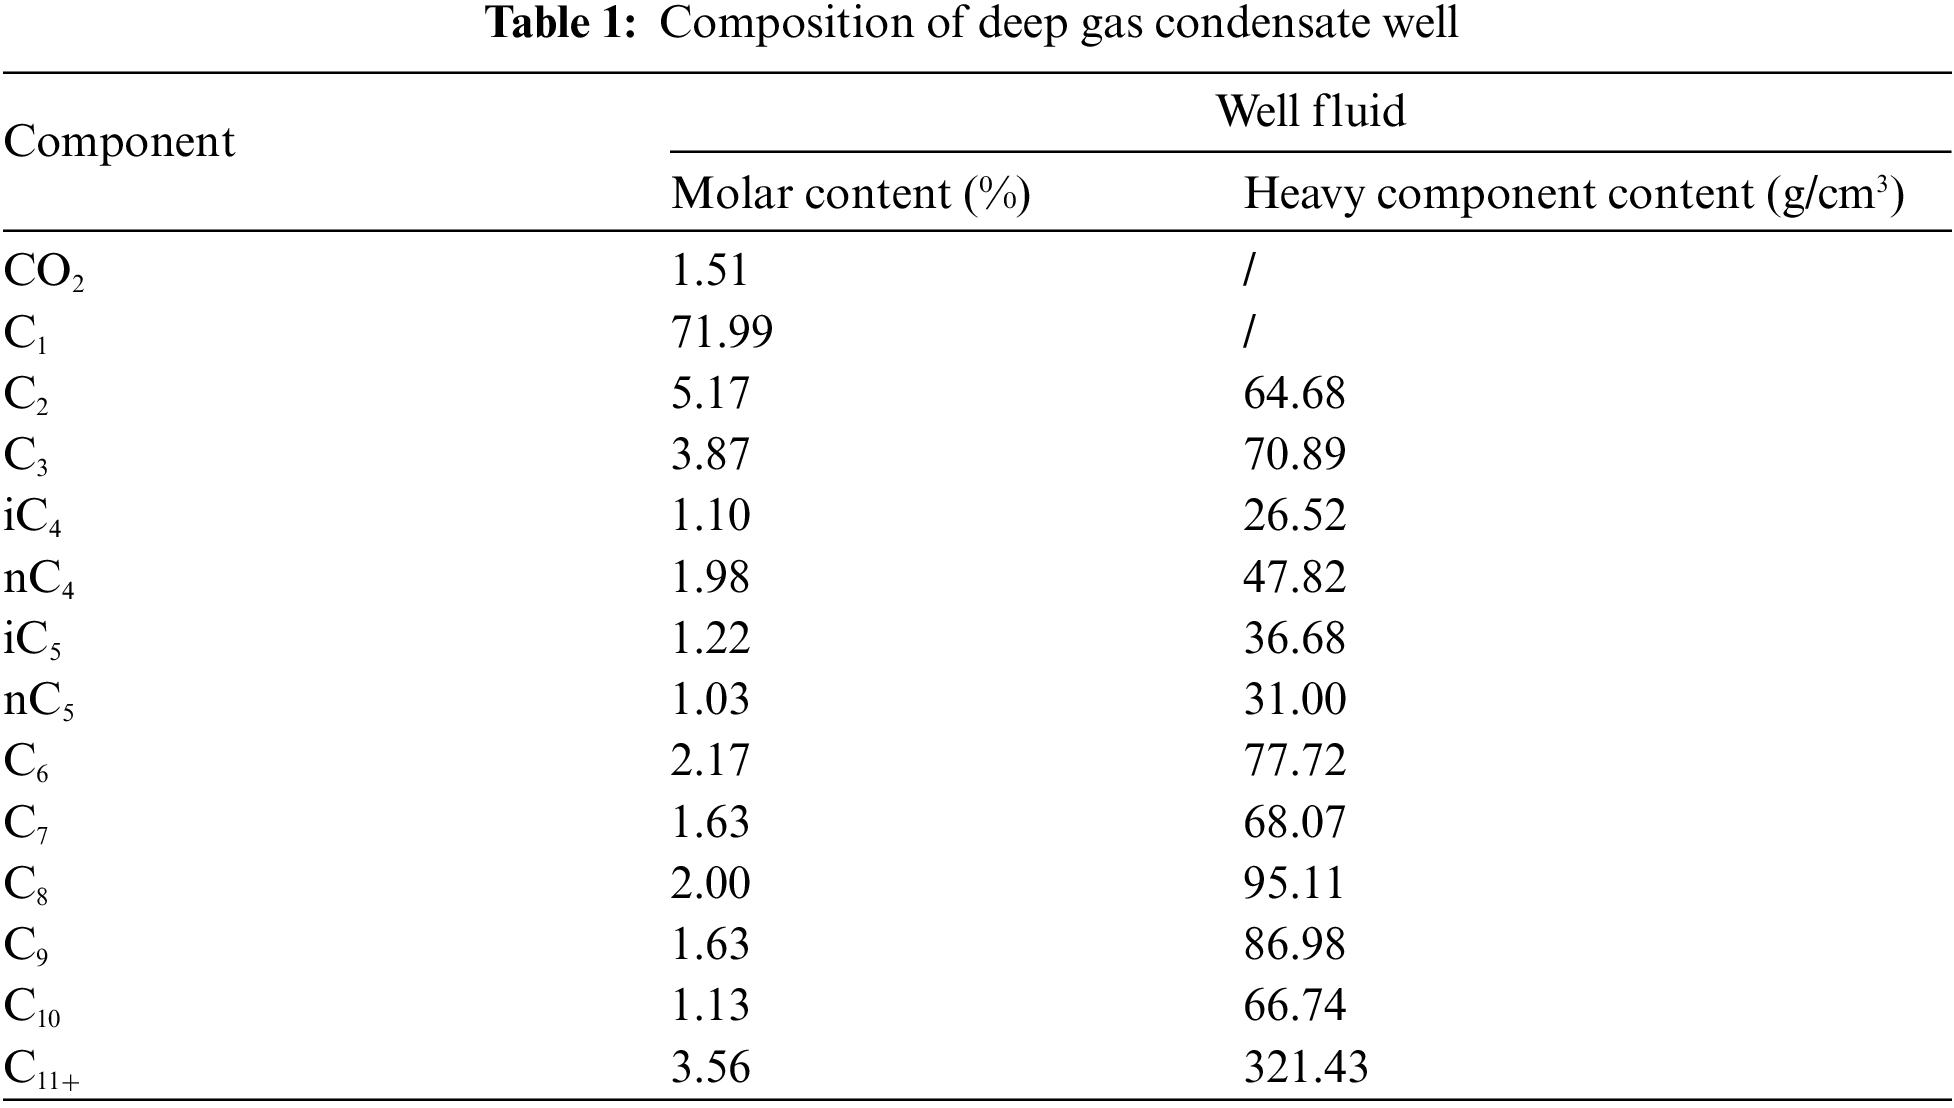
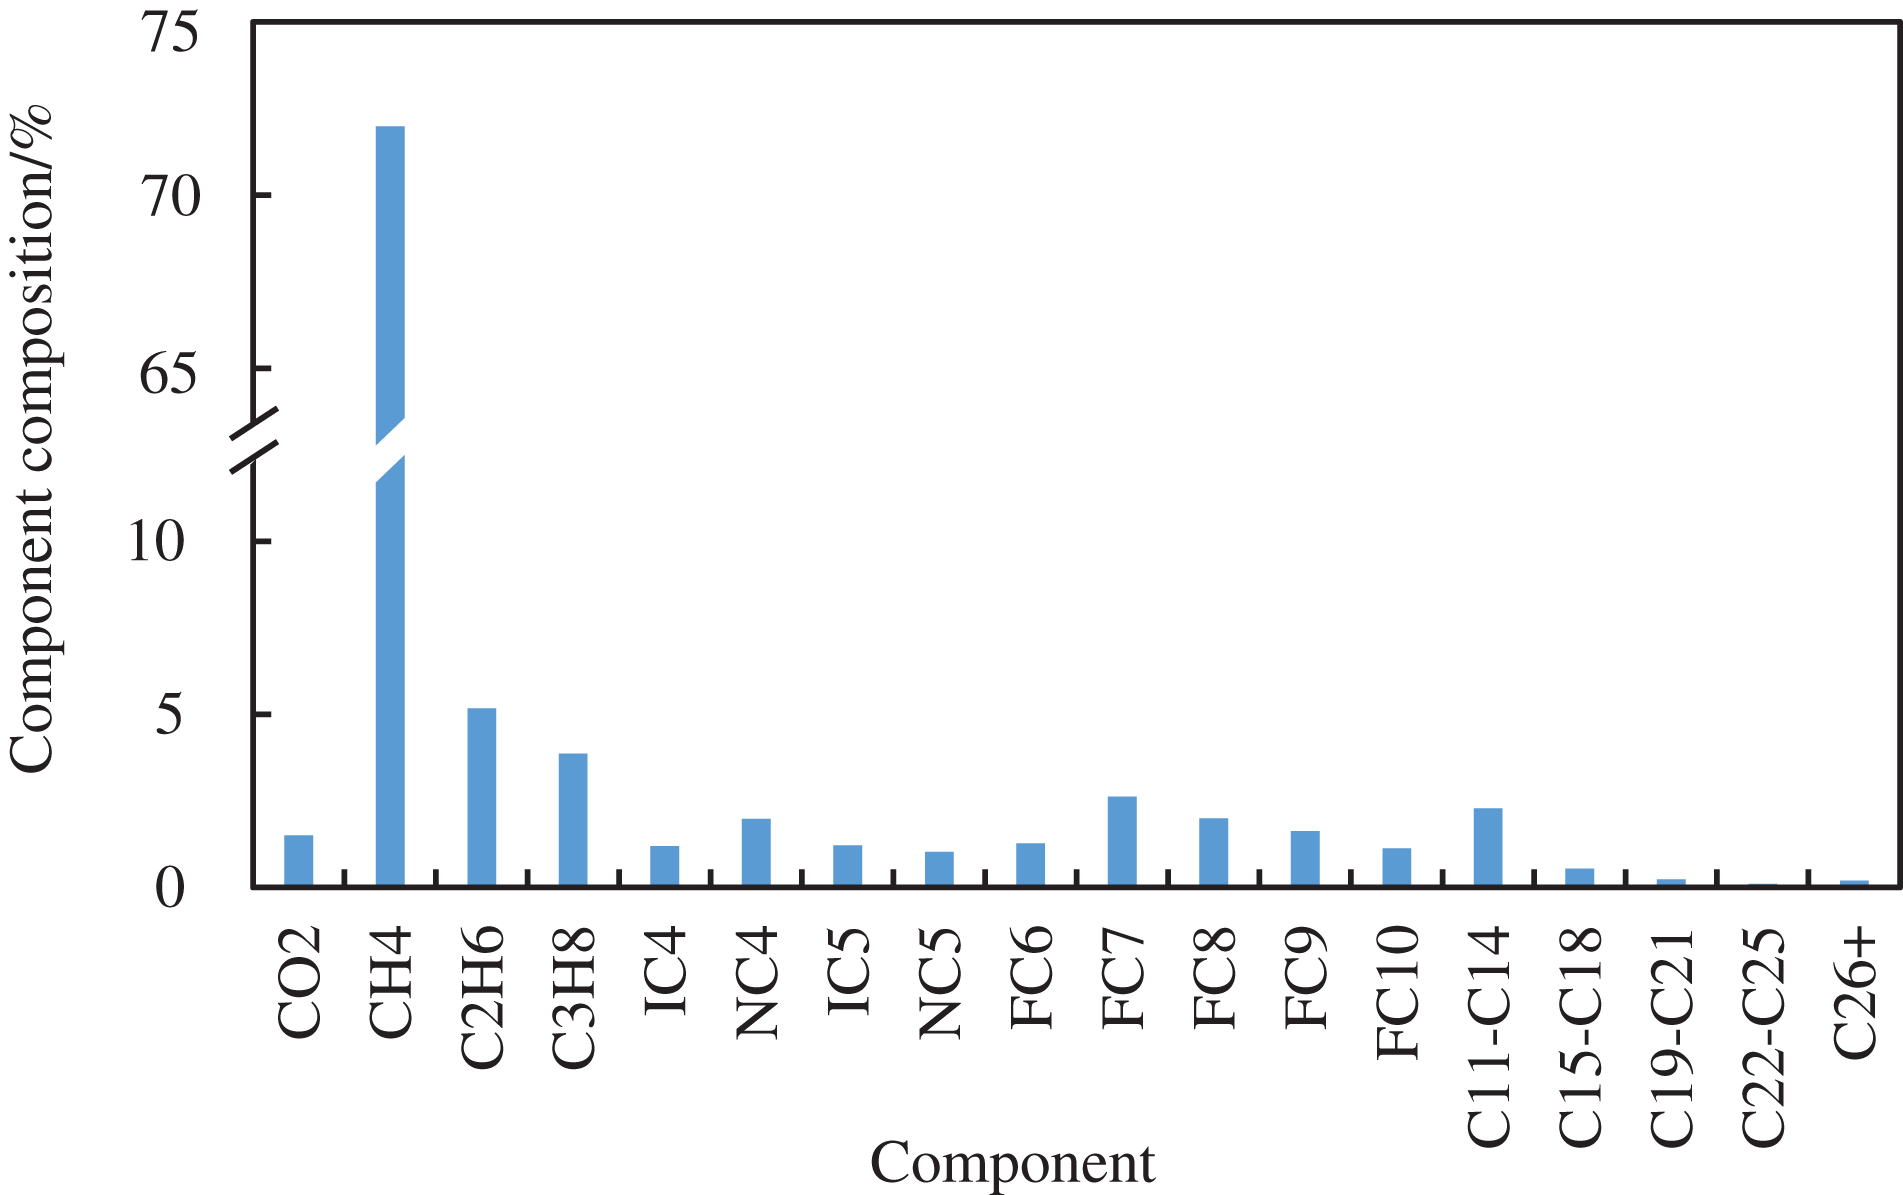
Figure 1: Component composition after splitting
Utilizing the Peng-Robinson (PR) state equation and a single-variable method, this study systematically simulated the influence of CH4, C2–C5, C7+, and CO2 components on the phase behavior of fluids in a typical condensate gas reservoir. The investigation revealed that an increase in CH4 content within the condensate gas reservoir resulted in an augmentation of fluid saturation pressure, accompanied by a simultaneous reduction in critical temperature and pressure. Conversely, an increase in C2–C5 content demonstrated minimal impact on critical points but significantly lowered fluid saturation pressure, offering novel insights into enhancing recovery rates in condensate gas reservoirs. Elevated C7+ content led to a decrease in saturation pressure, accompanied by a substantial rise in critical temperature and pressure, presenting challenges to the efficient exploitation of condensate gas reservoirs. Furthermore, an increased CO2 content not only reduced saturation pressure but also effectively lowered critical temperature and pressure, emphasizing its pivotal role in the development of condensate gas reservoirs. As illustrated in Fig. 2, a decrease in pressure correlated with a slight increase in C1 content in the condensate gas, reflecting retrograde condensation phenomena in the reservoir. In the later stages, lighter hydrocarbon components re-evaporated from the condensate oil, causing a gradual decline followed by an increase in C2–C5 molar fractions.
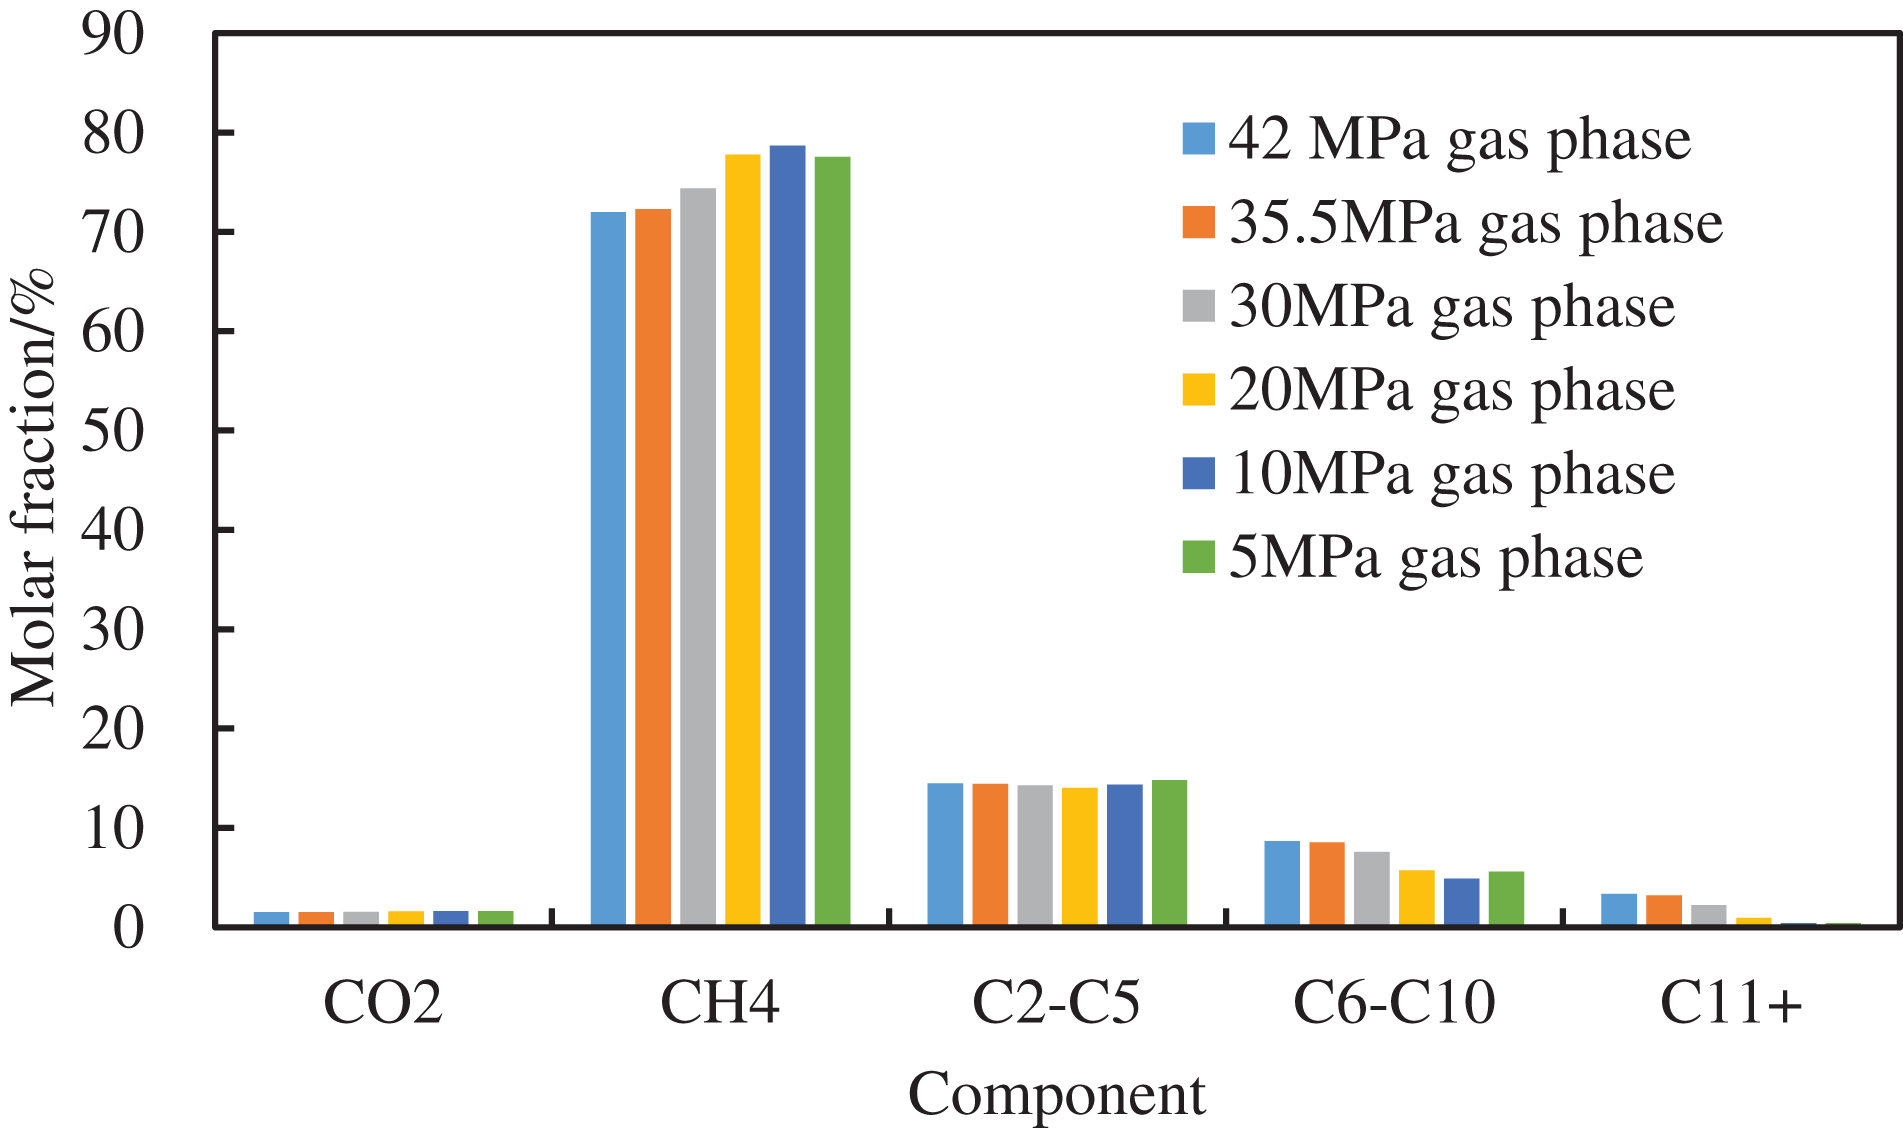
Figure 2: The molar fraction of condensate gas in the gas phase varies with pressure
2.2 Fitting and Validation of Deep Condensate Gas Phase Behavior Model
In this section, the deep condensate gas phase behavior model is fitted and validated through a comparison between simulated data from the phase behavior model and experimental data from constant-composition expansion and constant-volume depletion experiments. Additionally, it is crucial to assess the accuracy of simulating the Pressure-Temperature (P-T) phase diagram. The fitting results of constant-composition expansion and constant-volume depletion experiments are illustrated in Fig. 3. The small errors observed in the fitting between model simulation and experimental results indicate that the phase behavior model can effectively predict the volume of condensate gas and the quantity of condensate oil during the depletion development of deep condensate gas reservoirs. Furthermore, the accurate simulation of the P-T phase diagram adds significant value to the evaluation of the model’s predictive capabilities.
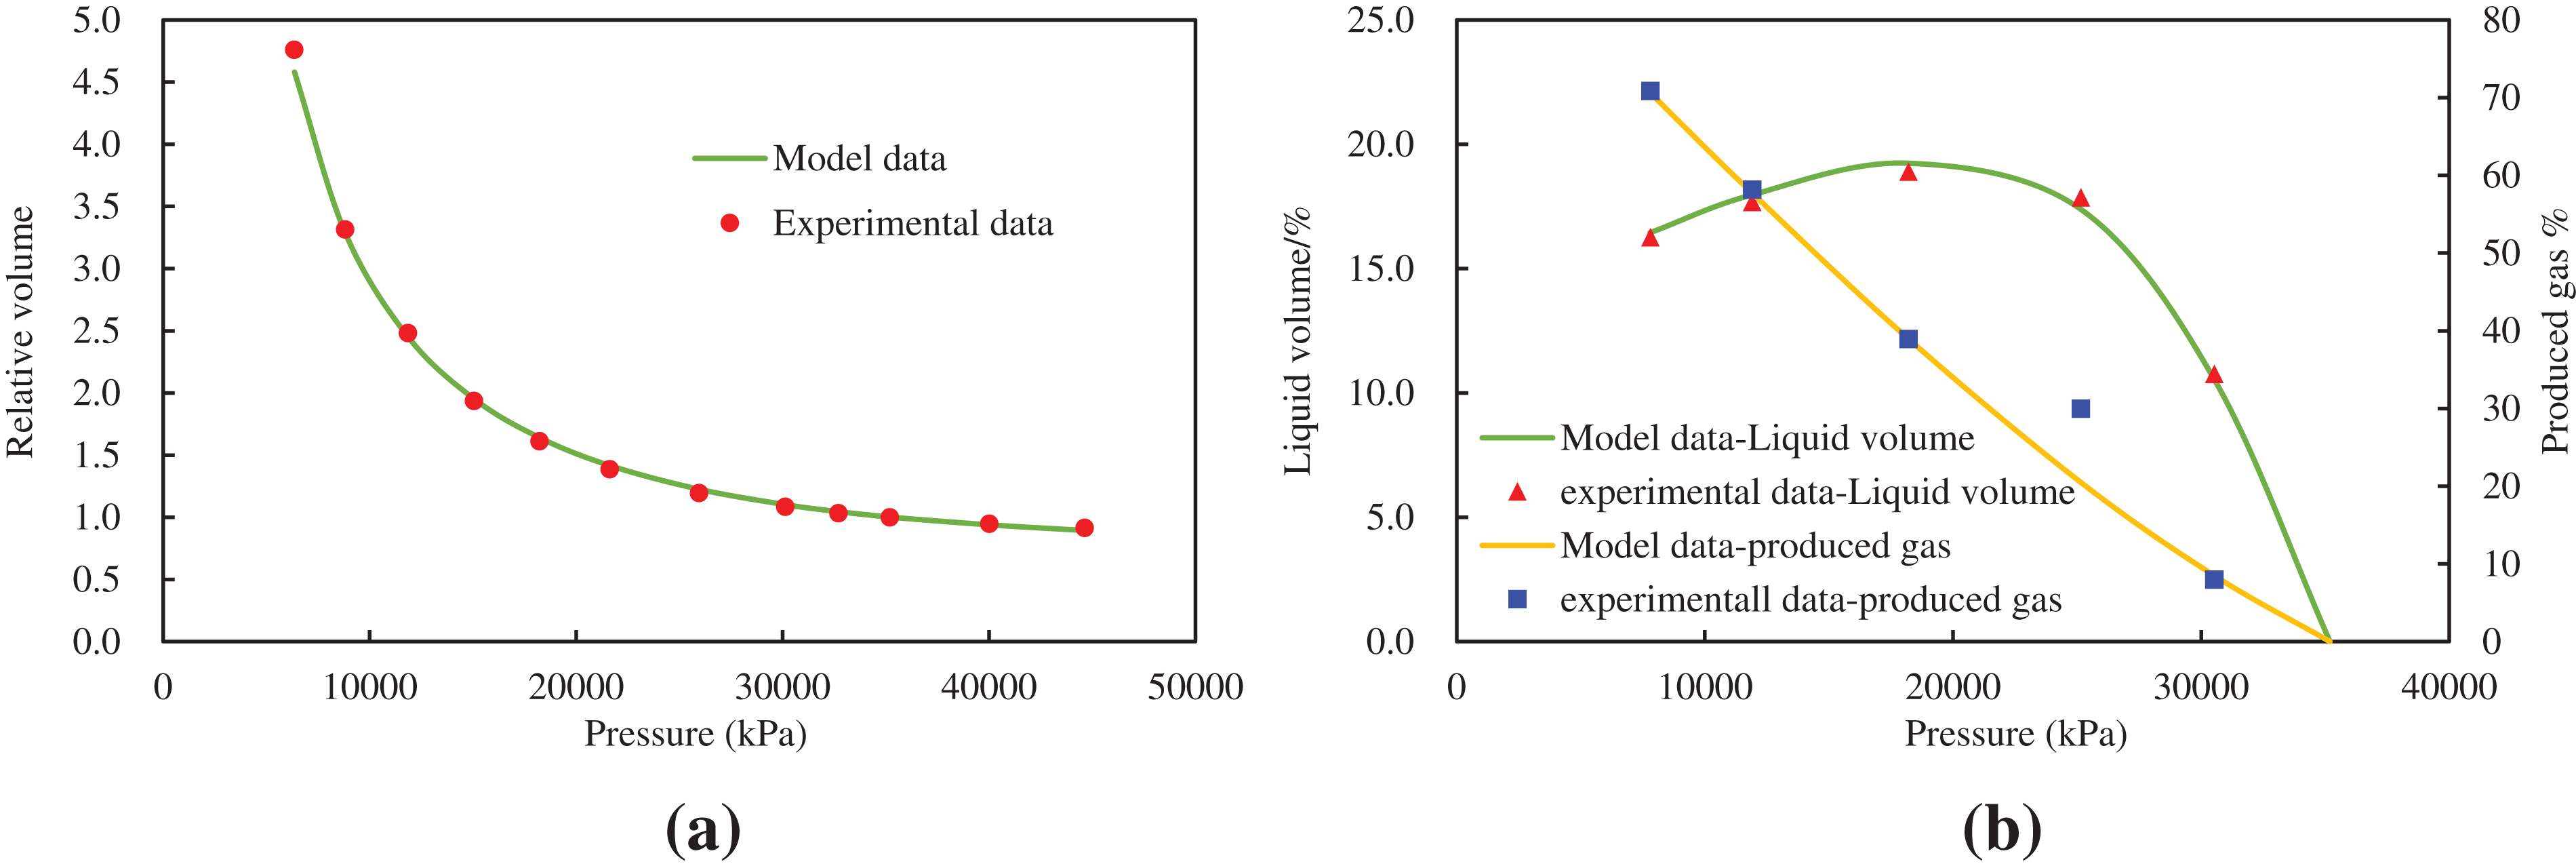
Figure 3: The fitting results of the experiment: (a) the fitting results of the constant mass expansion experiment; (b) fitting results of constant volume depletion experiment
In the development of condensate gas reservoirs, the dew point is a critical parameter with significant implications for the study of phase transitions and the selection of exploitation processes. Therefore, it is essential to enhance the predictive accuracy of the established phase behavior model for the P-T phase diagram. Fig. 4 presents a comparison between the simulated phase diagram and the experimental phase diagram generated by the model, demonstrating favorable predictive performance. The red line in the graph represents the dew point, the blue line represents the bubble point, and Pc denotes the critical point. Under constant temperature conditions, as the pressure in the condensate gas reservoir decreases from the gas phase pressure A to the upper dew point pressure B, the amount of retrograde condensate is minimal, and there is no significant change in fluid composition. Continuing the descent to point C, the system enters a two-phase region, leading to a sharp increase in retrograde condensate, accompanied by a notable change in fluid composition [37]. When the temperature exceeds the critical condensation temperature (Tc), the pressure’s influence on the amount of retrograde condensate and fluid composition becomes negligible. Compared to shallow condensate gases with lower contents of heavy components, deep condensate gases typically exhibit higher concentrations of heavy components, often characterized as high-condensate or near-critical condensate gases. Through the above discussion, it is evident that the fluid from this gas well presents characteristics of near-critical condensate gas. Therefore, the phase behavior is mainly manifested by the isotherms of the reservoir being near the system’s critical temperature, the saturation pressure being close to the critical pressure, and the original formation pressure also being close to the system’s critical pressure, with a difference of only 5.1 MPa. The fluid exhibits a rich condensate gas anti-condensation characteristic, making it difficult to distinguish between underground gas and liquid phases, which poses significant challenges for development.
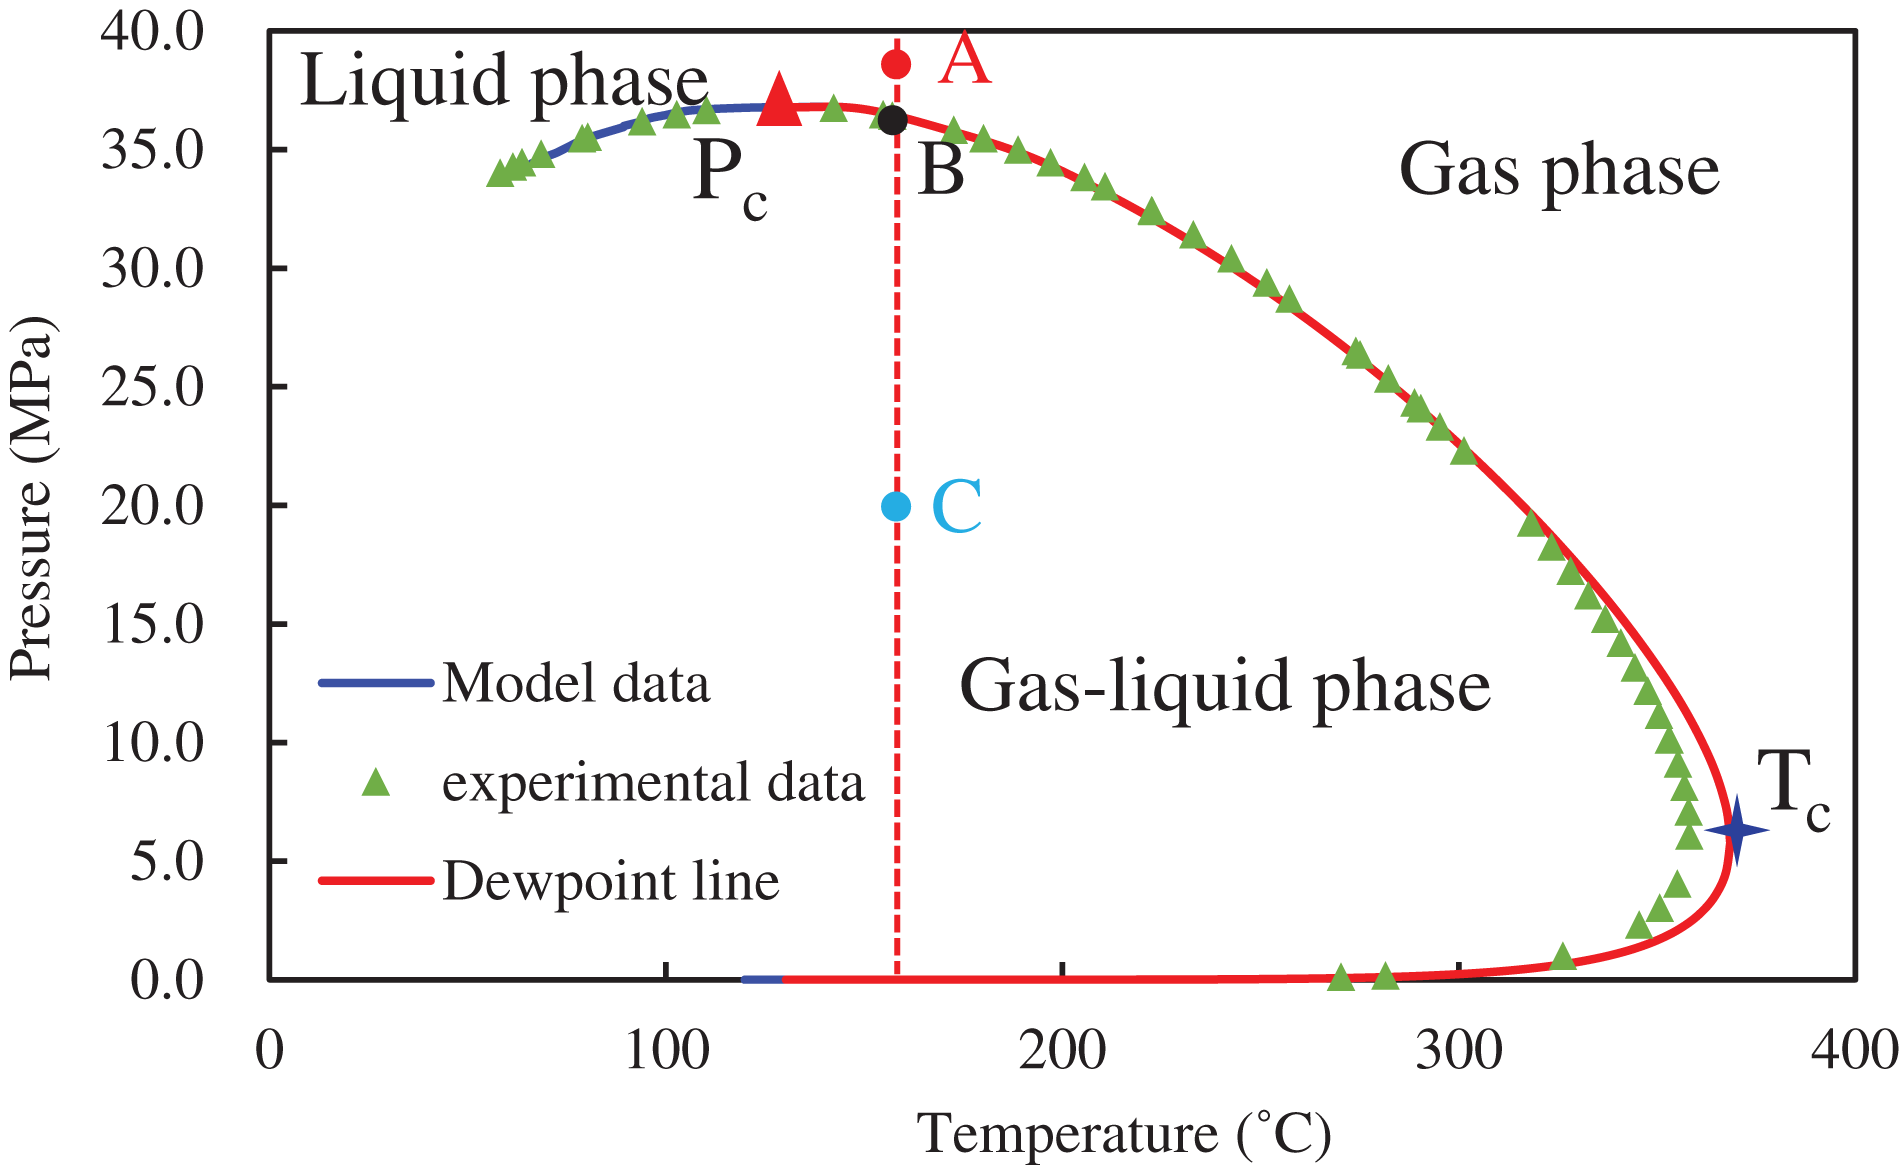
Figure 4: P-T phase diagram fitting results
2.3 Phase Parameters Characteristics in Deep Condensate Gas Reservoirs
A flash vaporization experiment was conducted to simulate and analyze the characteristics of phase parameter variations under different pressure conditions at 165°C. The variation characteristics of gas-liquid phase mole fractions under different pressures are depicted in Fig. 5. At a temperature of 165°C, the dew point pressure for the target block is 35.5 MPa. It is observed that the reservoir pressure is initially higher than the dew point pressure of the target reservoir. As development progresses and pressure decreases below the dew point pressure, heavier components in the condensate gas begin to condense, resulting in an increase in liquid phase mole fraction and a corresponding decrease in gas phase mole fraction. The pressure at which the liquid fraction reaches its maximum is approximately 25 MPa, corresponding to the point where the liquid phase mole fraction increases by 18%, intersecting with the 18% liquid line on the P-T phase diagram. Continued pressure reduction causes some condensate to re-evaporate into the gas phase. At 5 MPa pressure, the liquid phase mole fraction decreases by 51.1% compared to its peak. This phenomenon is due to decreasing intermolecular forces with decreasing pressure, which reduces the constraints between light and heavy hydrocarbon molecules, allowing heavy hydrocarbons to easily separate from light hydrocarbons and form liquid droplet deposits. As pressure continues to decrease, intermolecular attractions diminish further, leading to increased condensate production. Therefore, the phase behavior of condensate gas during production is complex, where significant condensate oil production can reduce condensate gas yield. Increasing production pressure differentials appropriately can utilize the re-evaporation of condensate oil to reduce damage to the reservoir and decrease the permeability resistance of condensate gas near wellbore regions.
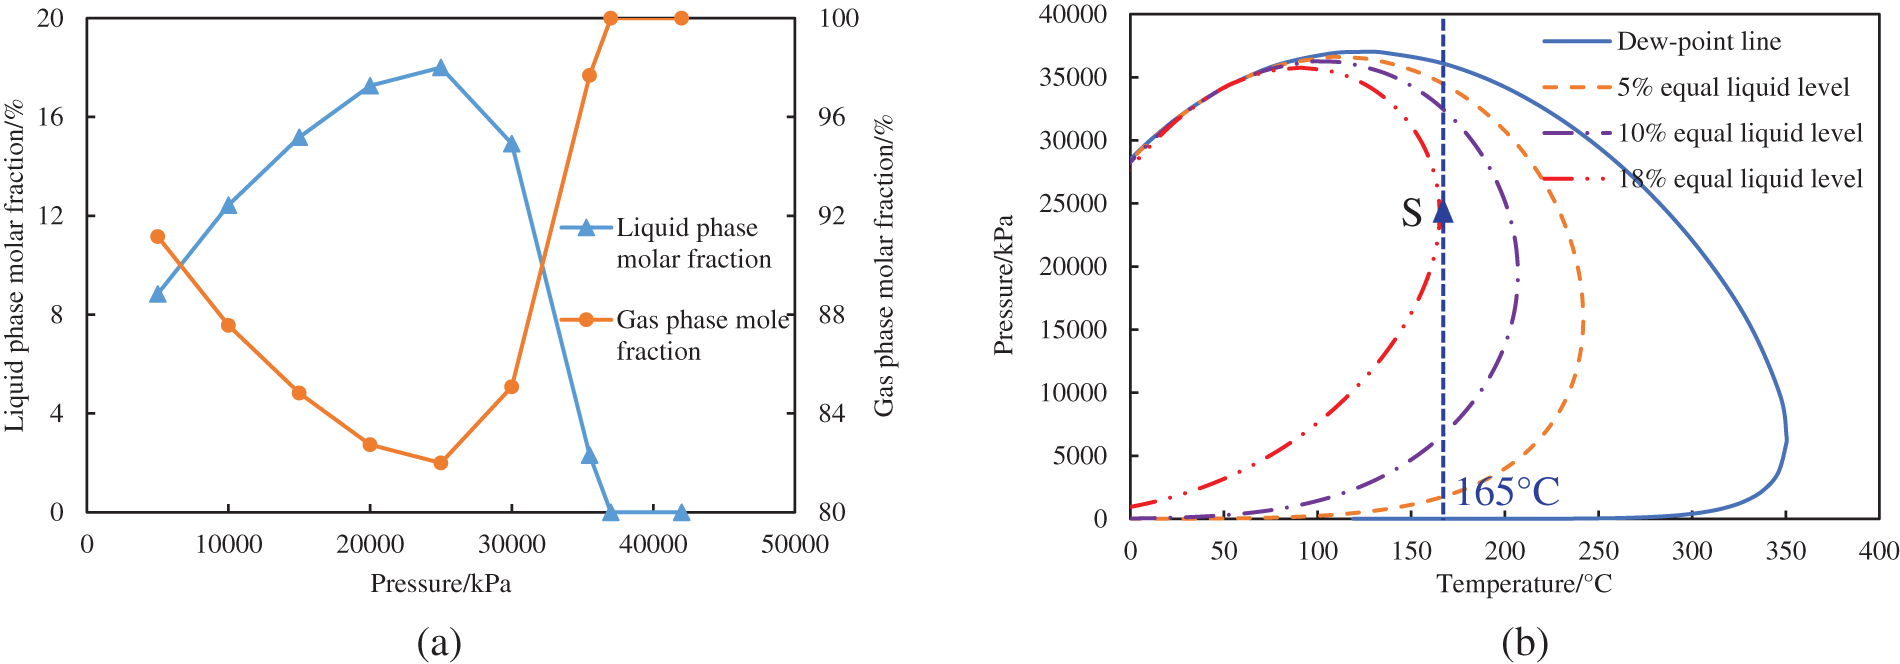
Figure 5: The phase parameters change under different temperature and pressure conditions: (a) the mole fractions of gas and liquid phases vary with pressure; (b) P-T phase diagram at different liquid volumes
The changes in gas-liquid two-phase viscosity and density under various pressures at 165°C are depicted in Fig. 6. It can be observed that as the development progresses, reservoir pressure decreases from 42 to 5 MPa (a pressure drop of 37 MPa). During this process, the density of the gas phase decreases by 89.2%, and its viscosity decreases by 69.7%. On the other hand, the density of the liquid phase increases by 31.2%, and its viscosity increases by 1.63 times. Particularly noticeable is the significant increase in liquid phase viscosity, which increases by 1.04 times from 20 to 5 MPa. This is primarily due to the re-evaporation of light hydrocarbon components from the condensate oil as pressure drops, leading to an increase in the proportion of heavier hydrocarbons in the liquid phase.
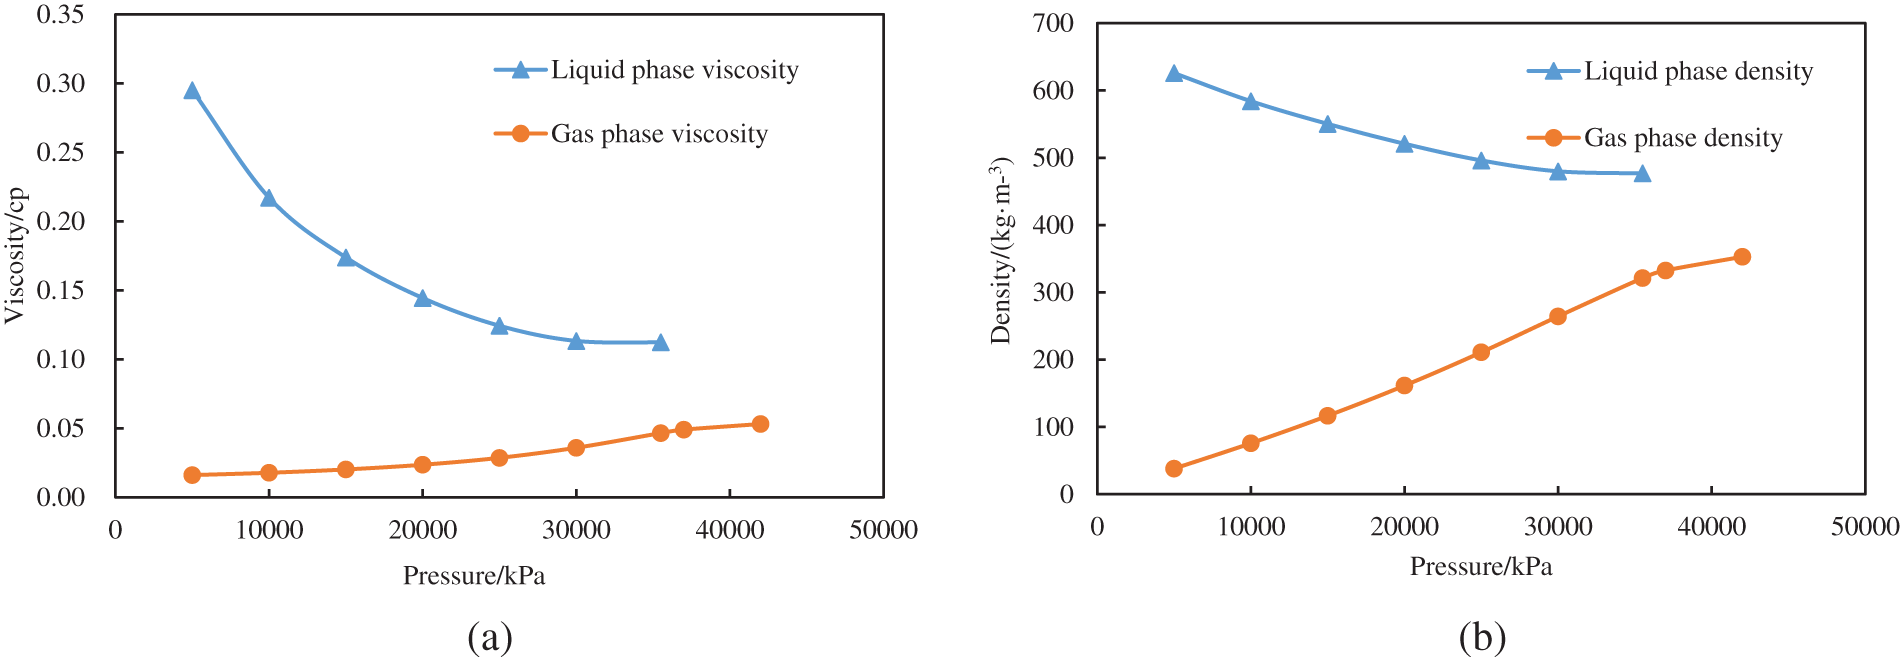
Figure 6: The variation of gas-liquid two-phase viscosity and density at different pressures: (a) gas-liquid two-phase viscosity; (b) gas-liquid two-phase density
Therefore, maintaining the production pressure slightly below the maximum retrograde condensation pressure point throughout the production process helps minimize the production of liquid phase, thereby increasing gas production to the maximum extent. Secondly, dynamic adjustment of production pressure differentials is essential. By controlling the pressure differential between the wellhead and the reservoir, the distribution of gas and liquid phases can be controlled to a certain extent. Increasing the production pressure differential can accelerate the re-evaporation process of the liquid phase, thereby reducing liquid saturation and increasing the relative gas production. Finally, a key measure is to establish a real-time monitoring system for reservoir state parameters. By monitoring parameters such as reservoir pressure, temperature, and production rate, production operations can be adjusted promptly to ensure that the production pressure remains in the optimal state. This also involves dynamic adjustments of parameters such as water/gas injection during the incremental production phase and the timing of energy supplementation.
3 Depletion Development and Reservoir Fluid Flow Patterns in Gas Condensate Reservoirs
3.1 Establishment and Validation of Deep Gas Condensate Reservoir Percolation Model
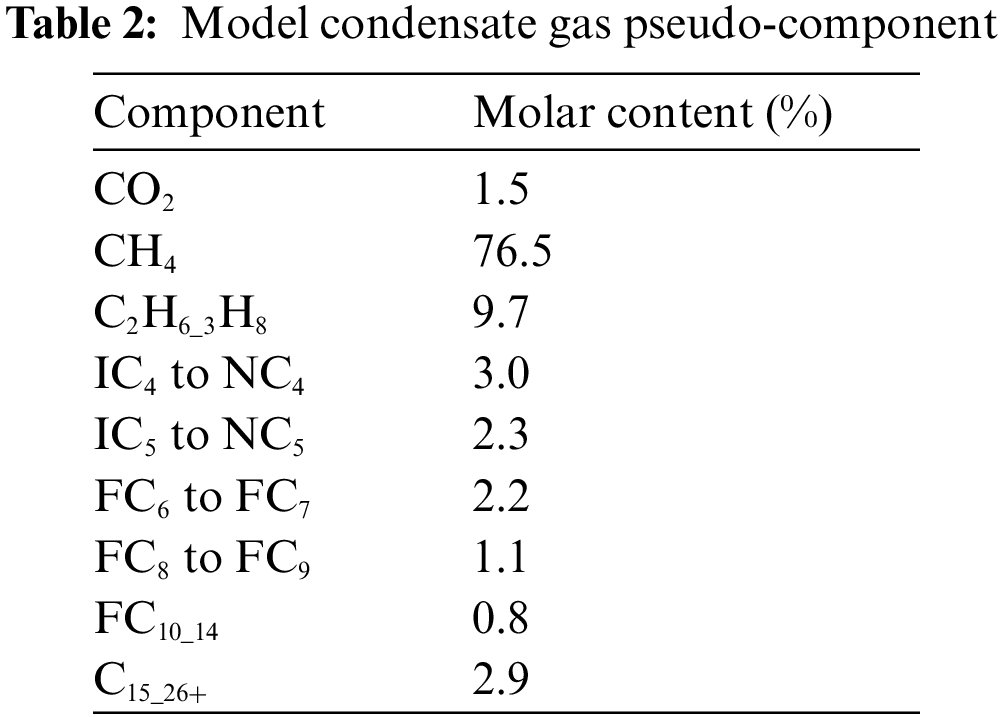
Building upon the previously established phase behavior model, a percolation model for single-well flow in deep gas condensate reservoirs is constructed using the CMG software’s GEM module. The phase behavior model is employed to regulate the deposition of condensate oil and the corresponding phase transformations during the percolation of gas condensate. In order to improve computational efficiency and convergence in numerical simulation, the components of the crude oil are merged into 9 pseudo-components. Having fewer components enhances computational efficiency. The merging principle is based on the similarity of component properties, and then the merged components are fitted using the aforementioned experiments. The characteristics and parameters of the final pseudo-components are presented in Table 2.
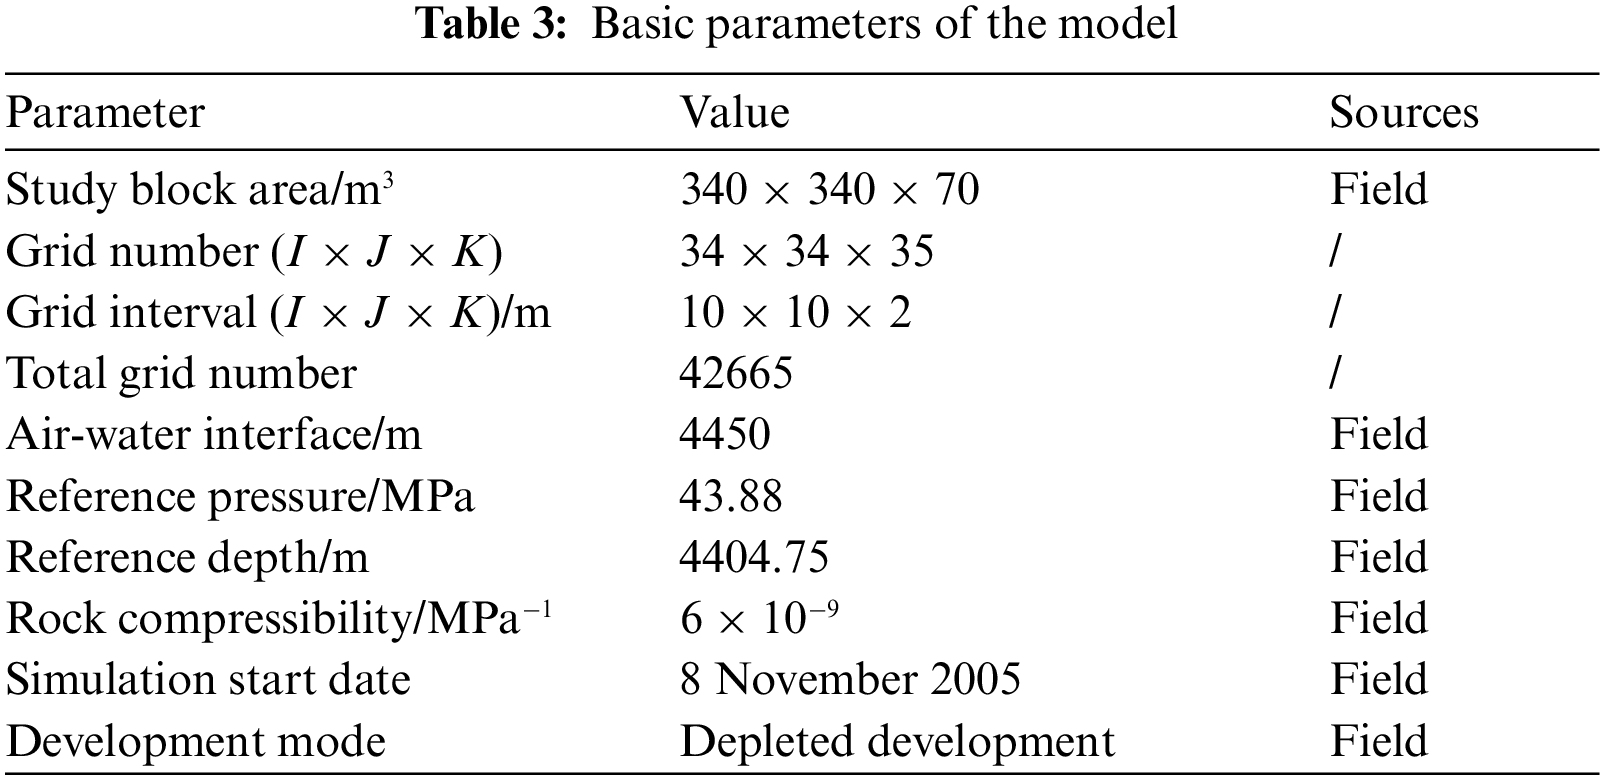
The seepage characteristics of oil, gas, and water under underground conditions are primarily reflected through the relative permeability curves of the three phases. The initial seepage phase curves are obtained from laboratory measurements. However, due to significant differences between laboratory conditions and reservoir conditions, and changes in rock pore-throat structure due to pressure variations, the phase seepage curves measured in the laboratory may not fully represent the actual underground seepage conditions. Therefore, minor adjustments were made to the phase seepage curves during the model validation process, resulting in the final phase seepage curves as shown in Fig. 7. In the figure, krw and krow represent the relative permeability of water and oil phases in the oil-water phase seepage curve, respectively, while krg and krl represent the relative permeability of gas and liquid phases in the gas-liquid phase seepage curve, respectively. Additionally, this model is derived from the segmentation of the actual geological model on-site, making parameters such as permeability, porosity, and gas saturation non-uniformly distributed. Other reservoir parameters used in constructing the model are shown in Table 3. Among them, the block area, gas-water interface, reservoir pressure, and rock compressibility in the model are all derived from actual field survey data. The simulation method and simulation date are set according to the actual production method and production date of the well. The model was coarse-gridded based on the number of grid cells in the geological model, considering factors such as the distribution of artificial fractures and the area of the study block. Finally, the grid cell sizes in the I, J, and K directions were determined to be 10, 10, and 2 m, respectively.
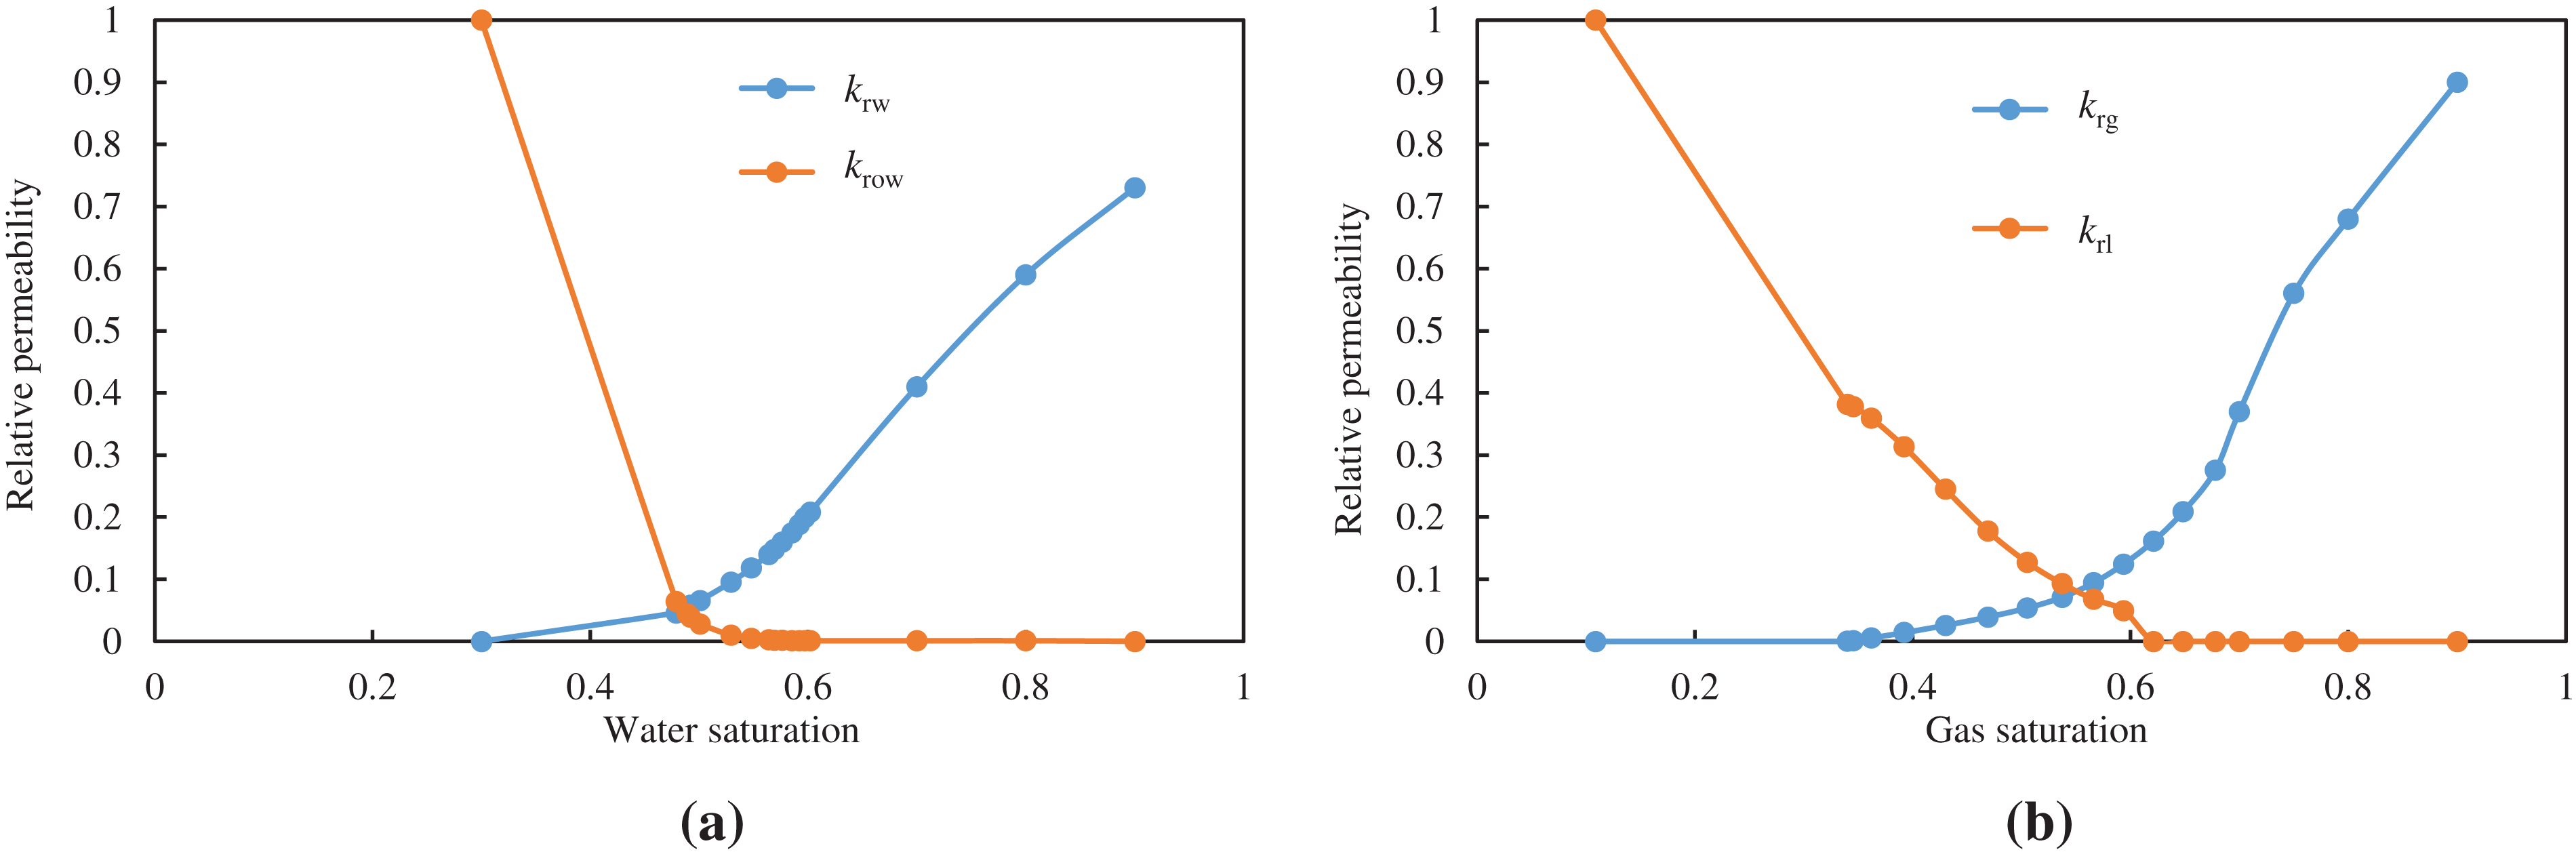
Figure 7: Phase permeability curve: (a) oil-water phase permeability curve; (b) gas-liquid permeability curve
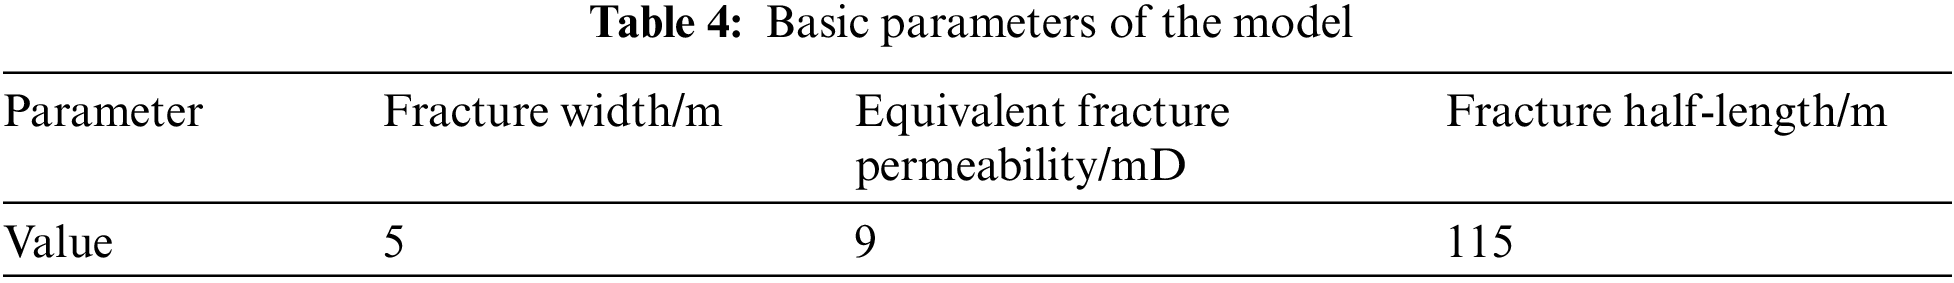
Upon on-site core sampling, it was revealed that the average permeability around well A1 is 3.2 mD, with an average porosity of 6.7%. To achieve industrial production, hydraulic fracturing measures are deemed necessary for the target well. In this model, a locally refined grid is employed to depict the fractures and variations in pressure fields resulting from the fracturing process. In the I and K directions, the grid remains unrefined, while in the J direction, the number of grids is refined to 3, with a non-uniform distribution of grid spacings of 2.5, 5, and 2.5 m, respectively. A fracture model was established based on the actual fracture data of the target well, as shown in Fig. 8. The simulation parameters for the hydraulic fracturing are presented in Table 4. It is worth noting that the actual half-length of the fractures on-site is 116.8 m; however, for simplification purposes, the fracture half-length is set to 115 m. Therefore, the artificial fractures will span across 23 grids in the I direction.
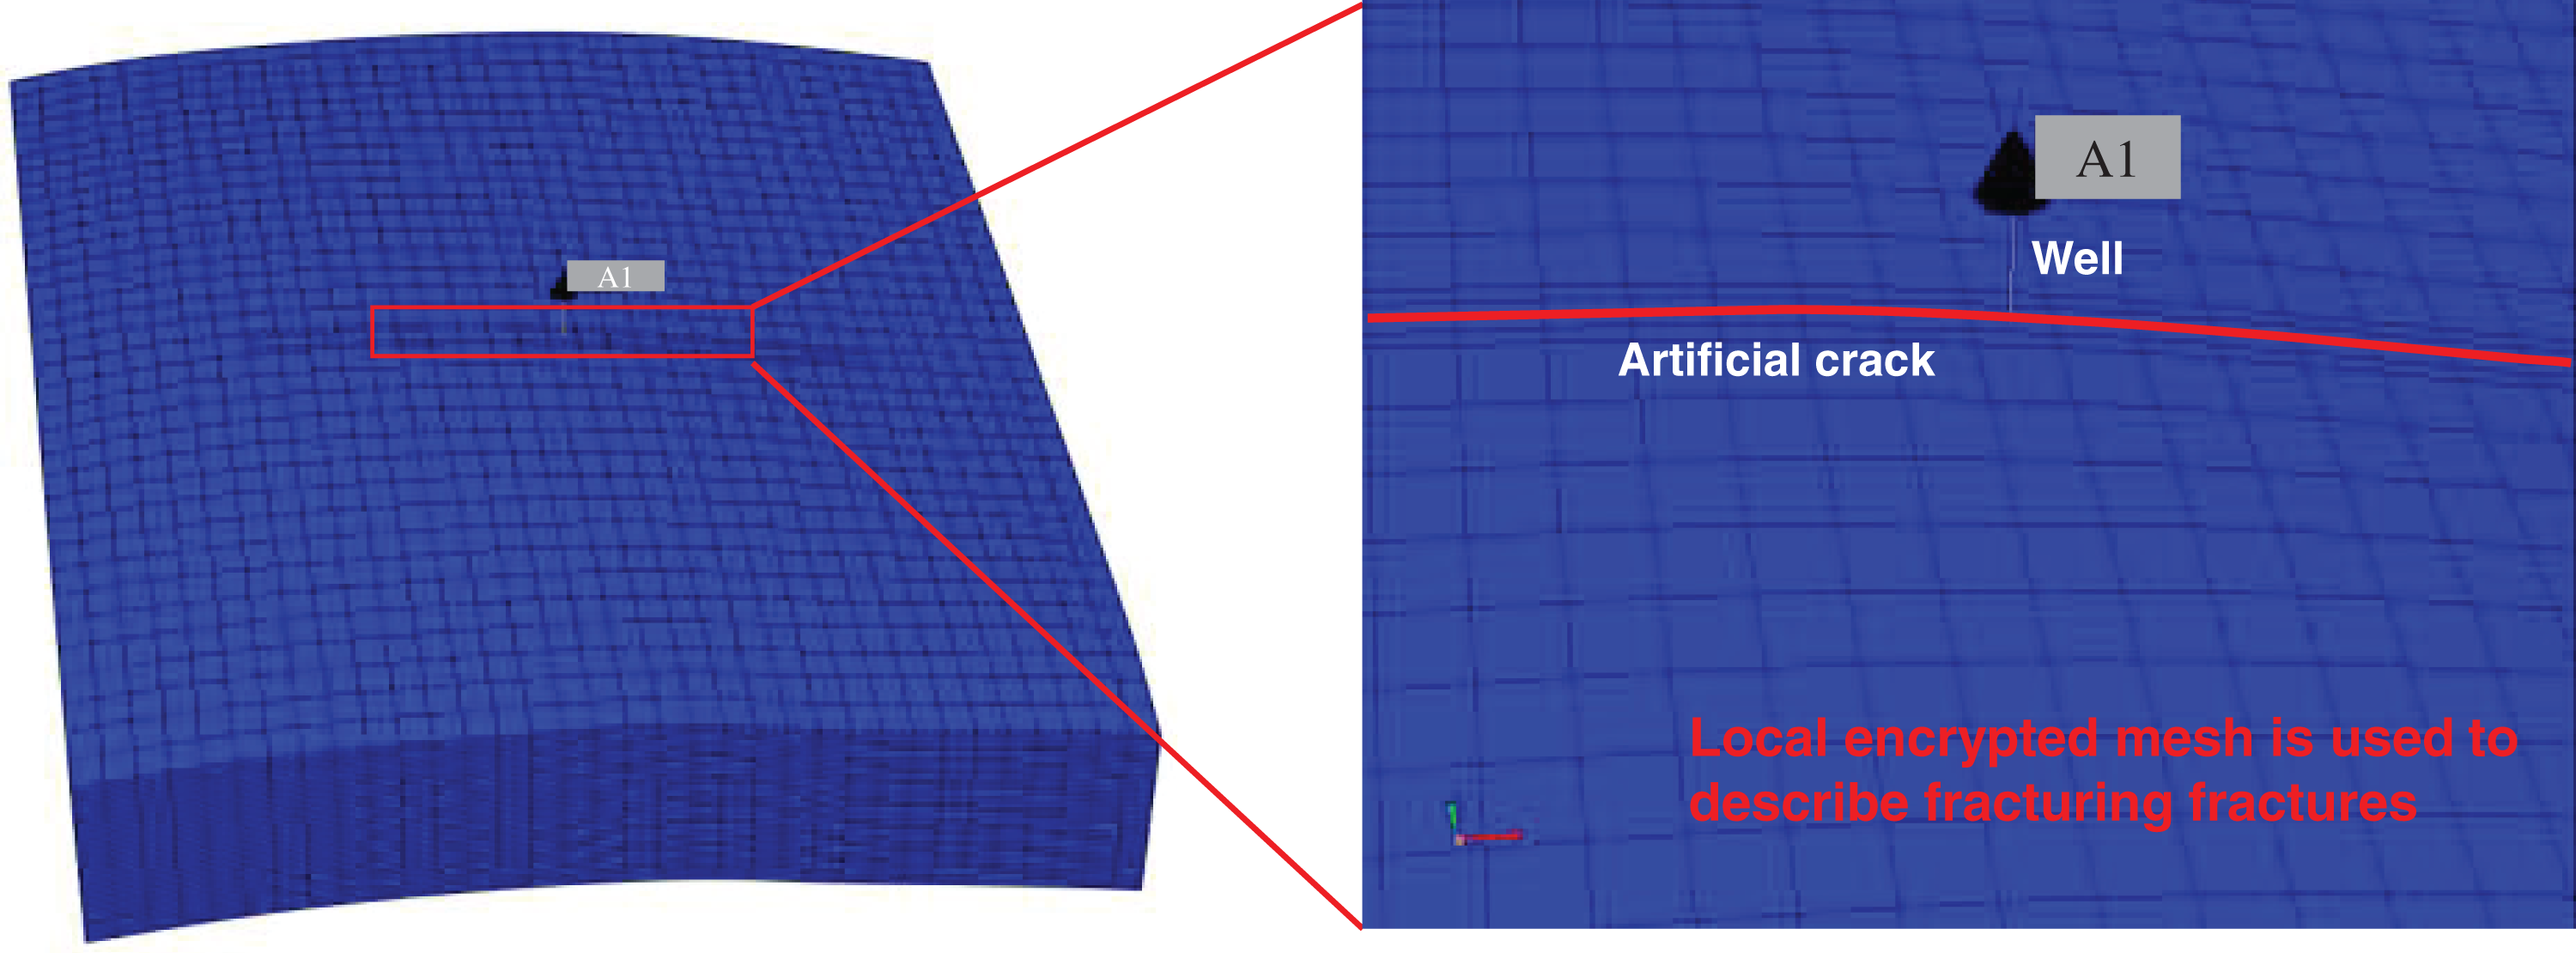
Figure 8: Establishment of fracturing model
Based on actual production data from the field, the model is calibrated to predict gas production rates. A comparison between the modeled daily oil production and actual daily oil production is presented in Fig. 9.
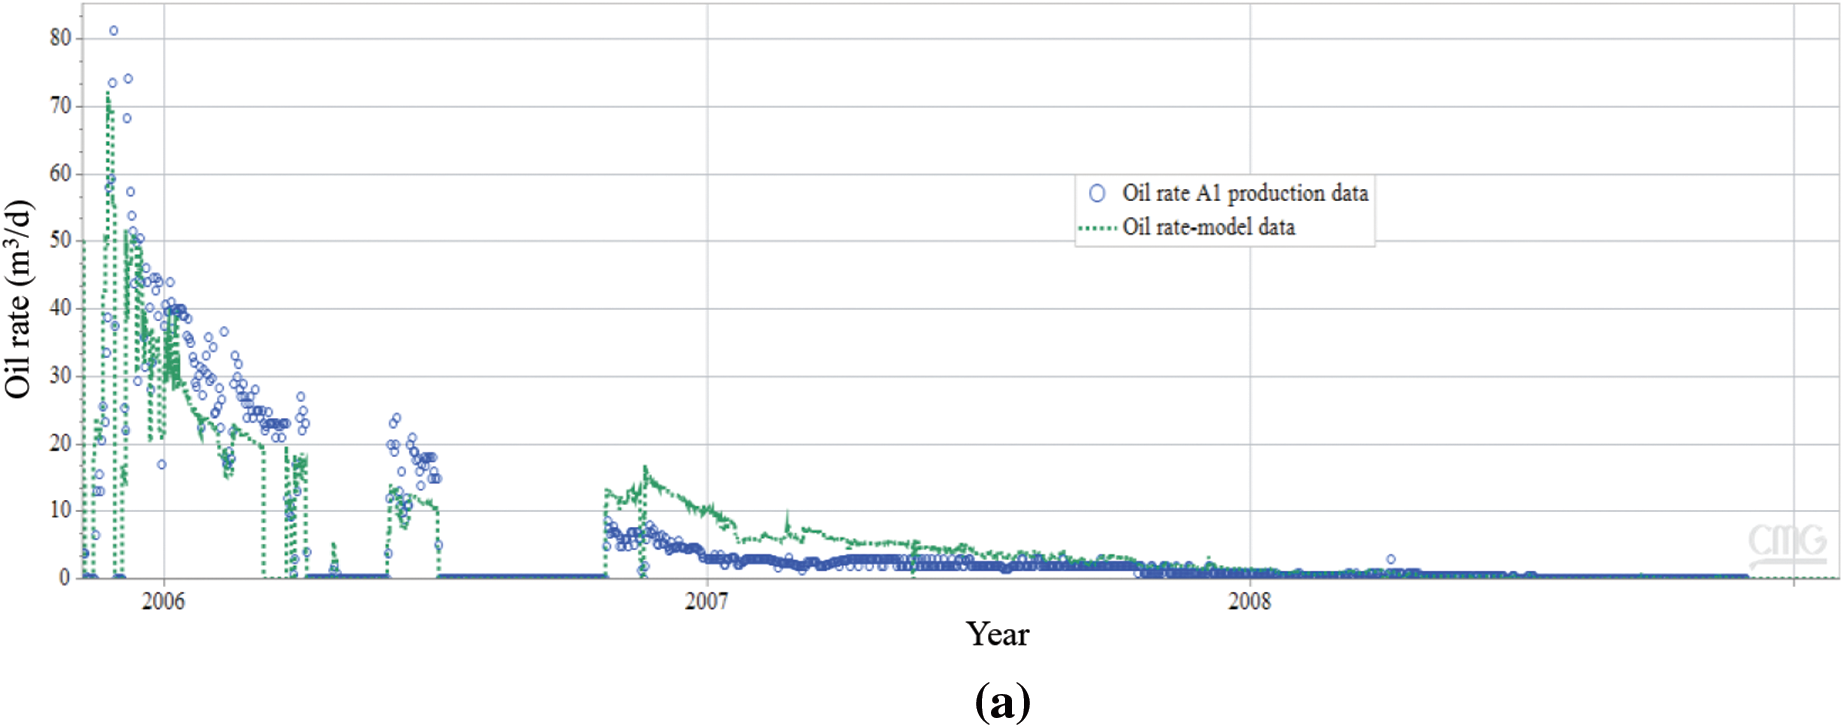
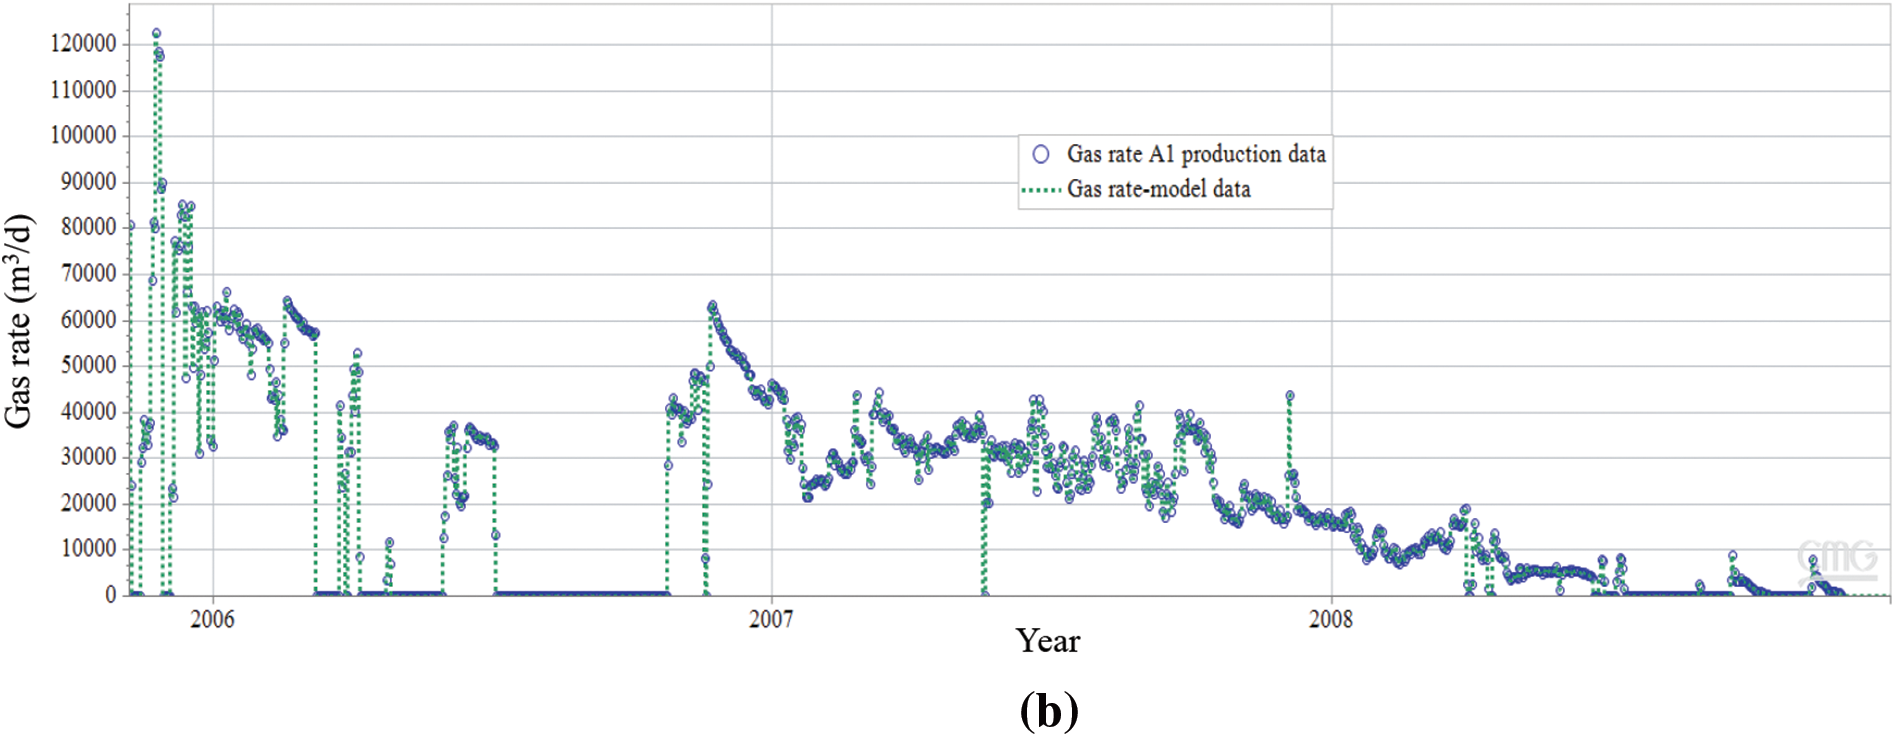
Figure 9: Model oil and gas production fitting diagram: (a) model validation results for daily oil production; (b) model validation results for daily gas production
Additionally, considering field information indicating a reservoir pressure drop to around 35 MPa when cumulative gas production reaches 6.5 million cubic meters, the model predicts a reservoir pressure of 33.8 MPa under the same gas production conditions, resulting in a discrepancy of 3.43%. The comparison of actual and modeled pressures at various time points is illustrated in Fig. 10.
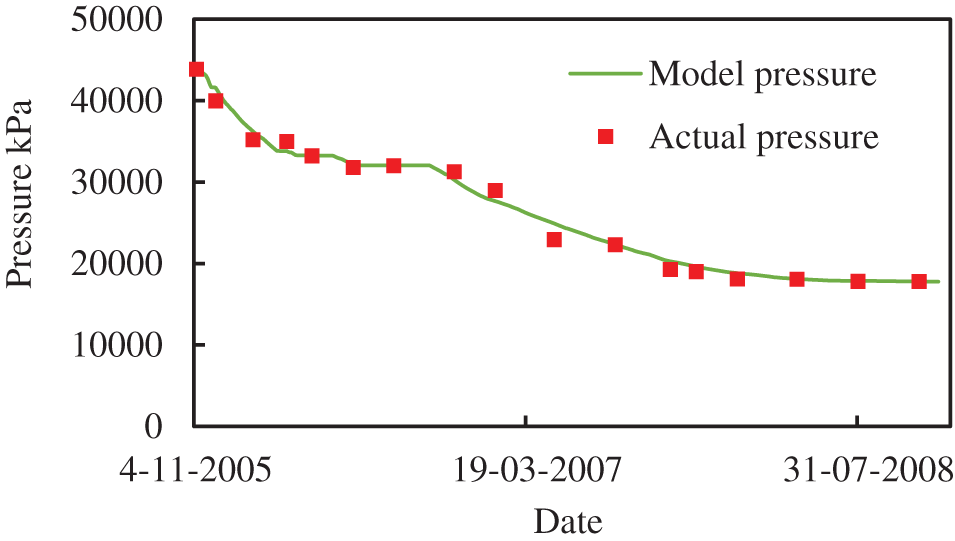
Figure 10: Comparison of model pressure and actual pressure measurement point
3.2 Reservoir Fluid Flow Patterns in Different Stages of Deep Condensate Gas Depletion
In the absence of mobile water in the reservoir, the development process of condensate gas can be roughly divided into three zones: the gas phase flow zone (Zone III), the transitional zone with coexistence of phases where only one phase flows (Zone II), and the gas-liquid two-phase flow zone (Zone I) [38]. In Zone III, the reservoir pressure is above the dew point pressure (Pd), and there is no condensate oil present; only gas flows. In Zone II, the reservoir pressure is slightly below Pd but still above the two-phase flow pressure (P*). Condensed condensate oil cannot flow yet, forming a transitional phase with coexistence of phases where only one phase flows. In Zone I, the reservoir pressure is below P*. Condensate oil can flow, and there is gas-liquid two-phase flow in the reservoir. Therefore, this section will analyze the permeability characteristics in these three stages. It is noteworthy that during the late stage of production, both the average reservoir pressure (Pr) and the bottom hole flowing pressure (Pwf) are below Pd, indicating severe condensation phenomena in the reservoir.
3.2.1 Fluid Flow Patterns in the Early Stage (Pwf > Pd; Pr > Pd)
Based on the conclusions drawn from phase analysis, it is understood that at a temperature of 438.15 K, the dew point pressure is 35.5 MPa. Assuming a bottom hole flowing pressure (Pwf) of 38 MPa for production, the variations in gas production, oil production, and gas-oil ratio are illustrated in Fig. 11. Due to the reduction in reservoir energy during depletion development, the gas and oil production rates of the gas well show a declining trend. At this stage, Pwf is greater than Pd, the gas-oil ratio remains essentially unchanged, and no condensate phenomenon occurs. The oil equivalent at this point is 4063 tons.
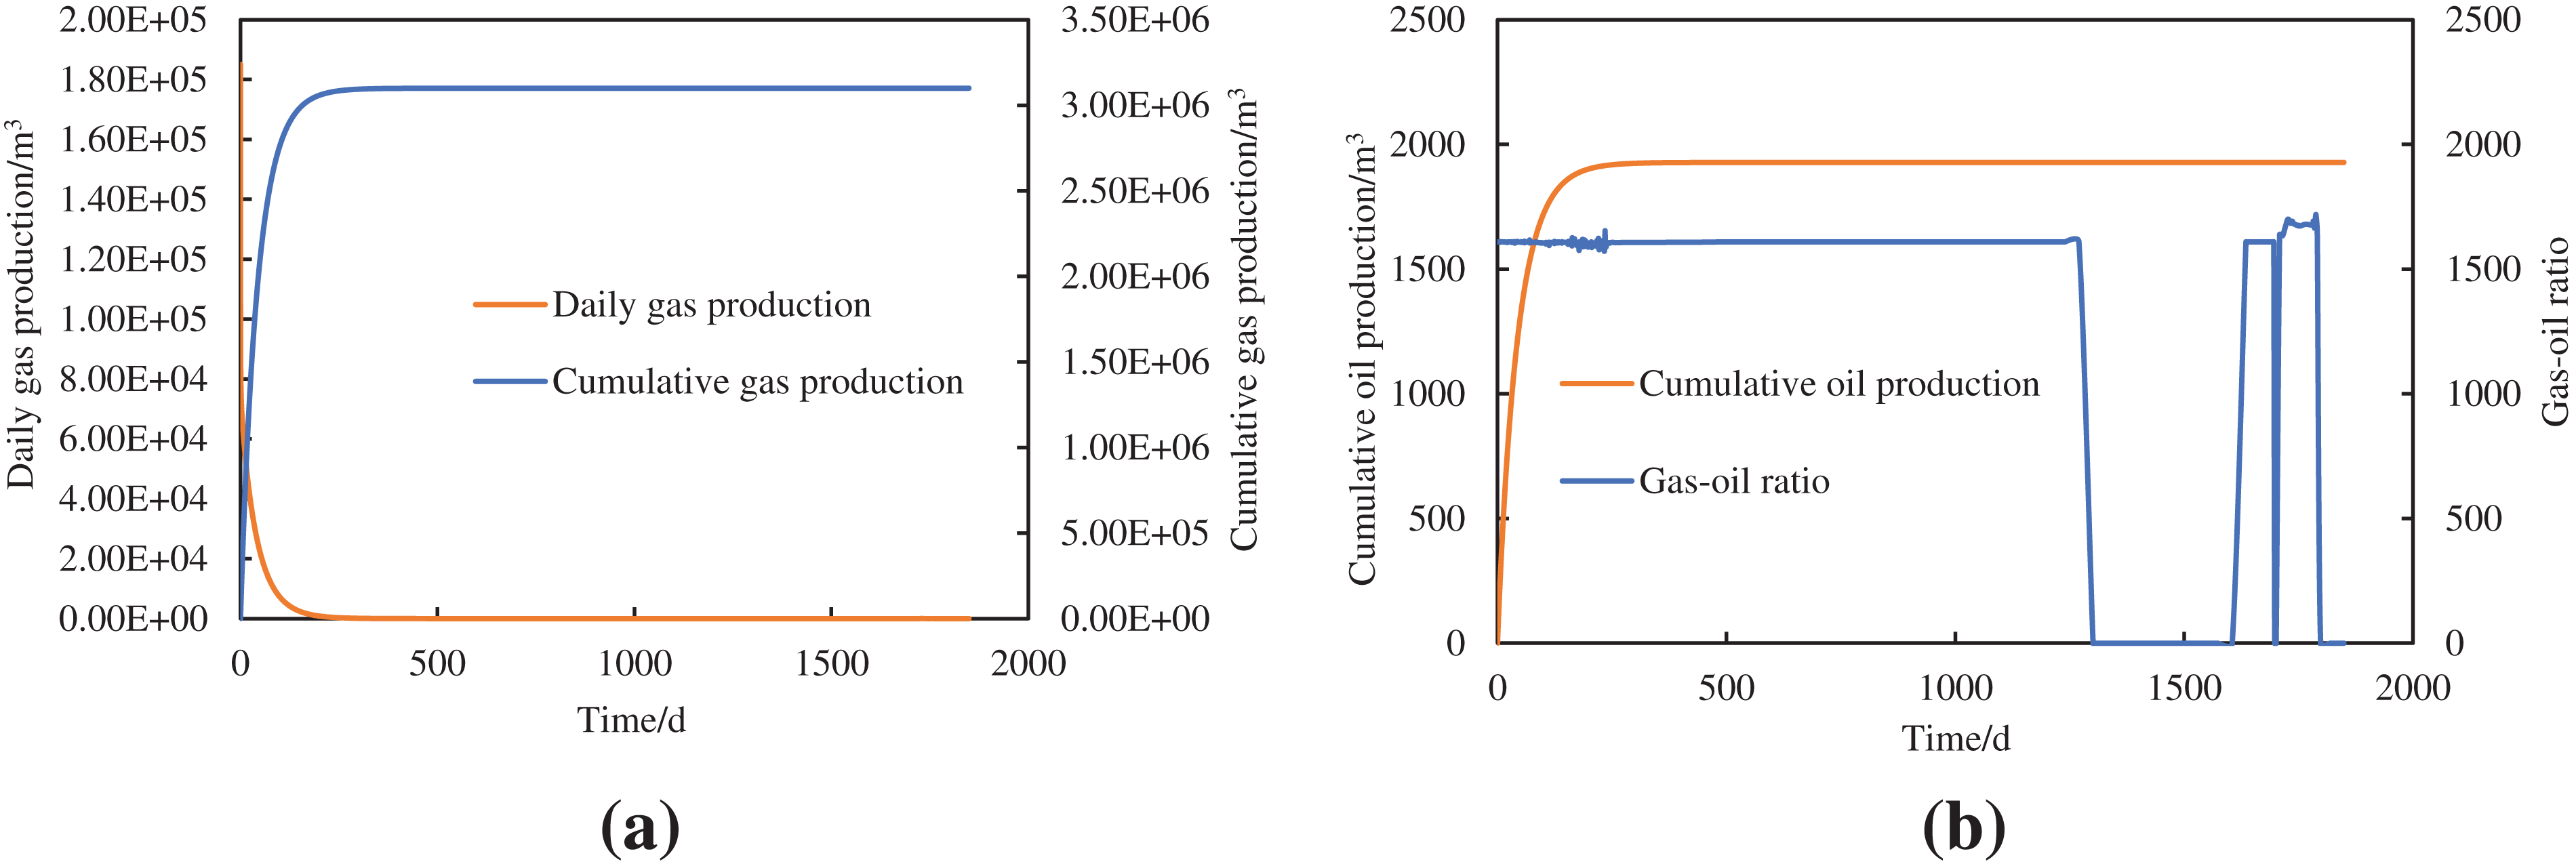
Figure 11: Dynamic data for depletion production with a bottom-hole flowing pressure of 38 MPa: (a) cumulative gas production and daily gas; (b) cumulative oil production and gas-oil ratio
During the initial stage of depletion production, with a bottom-hole flowing pressure exceeding the dew point pressure, the distribution of final reservoir pressure and oil saturation provides valuable insights. As illustrated in Fig. 12, the reservoir pressure exhibits a radial distribution, with higher pressures observed at greater distances from the production well. The permeability characteristics of deep condensate gas reservoirs are closely related to the distribution of reservoir pressure. In this stage, where the bottom-hole flowing pressure surpasses the dew point pressure, no condensate oil is precipitated, resulting in zero oil saturation across the grid. A longitudinal profile analysis, depicted in Fig. 13, further examines the vertical distribution of pressure and oil saturation at varying distances from the production well. The quantified data illustrates the pressure and condensate oil saturation within different lengths of the reservoir. It is evident that, during production with a bottom-hole flowing pressure exceeding the dew point pressure, the reservoir fluid remains within the single-phase gas flow region (Zone III). No condensate oil generation occurs, and the reservoir is devoid of two-phase flow.
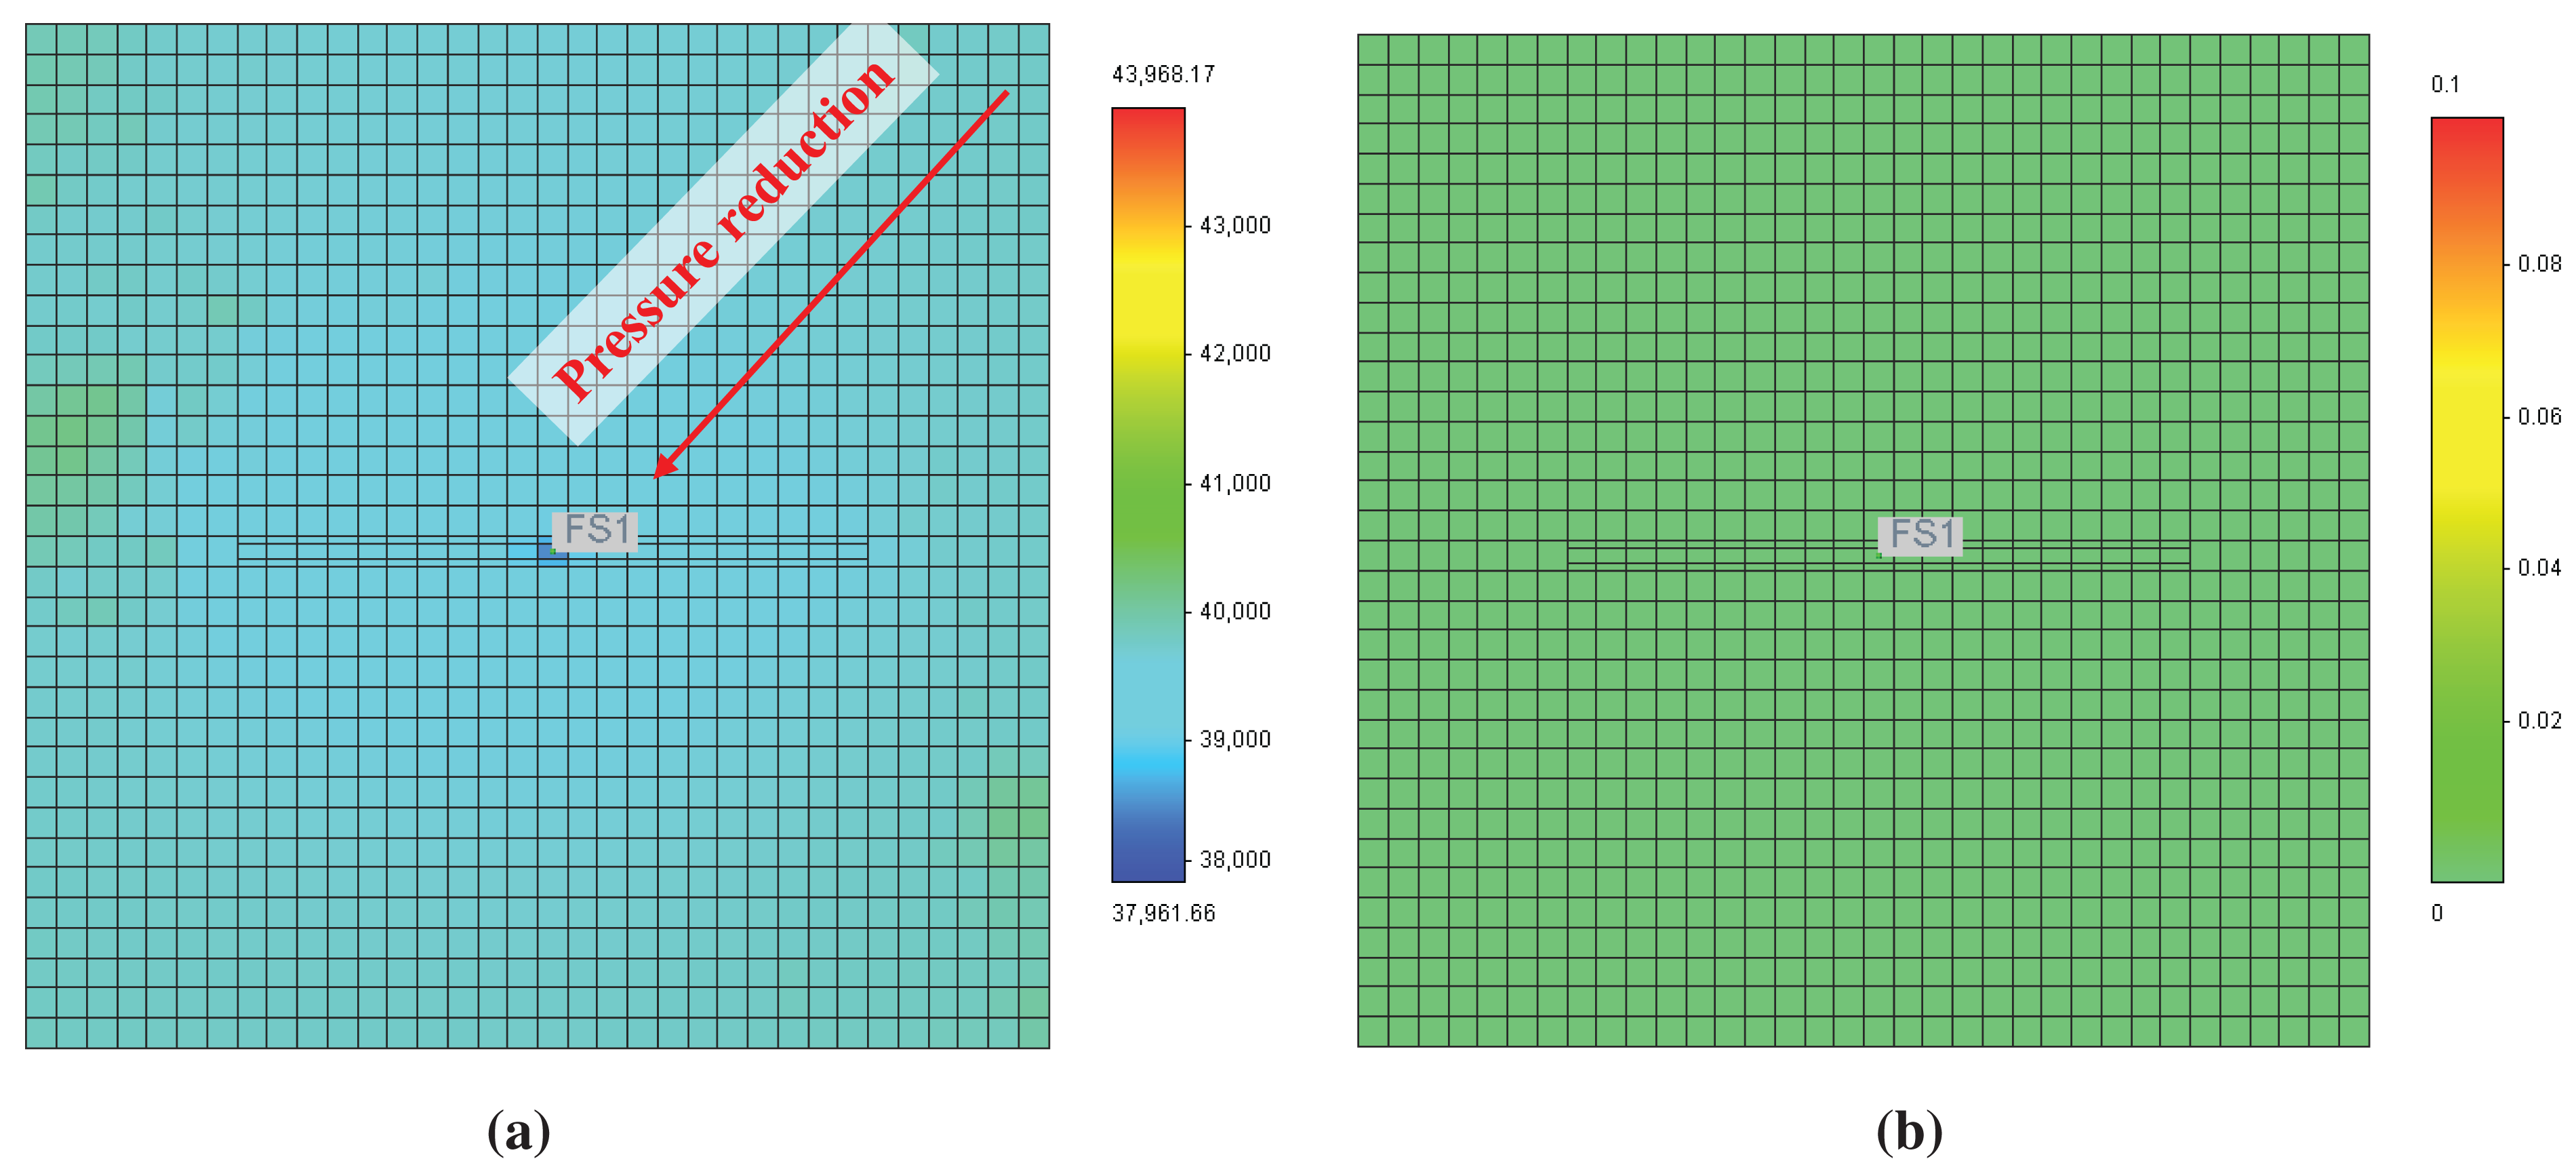
Figure 12: 38 MPa depletion development horizontal distribution of pressure and oil saturation: (a) pressure distribution; (b) oil saturation distribution
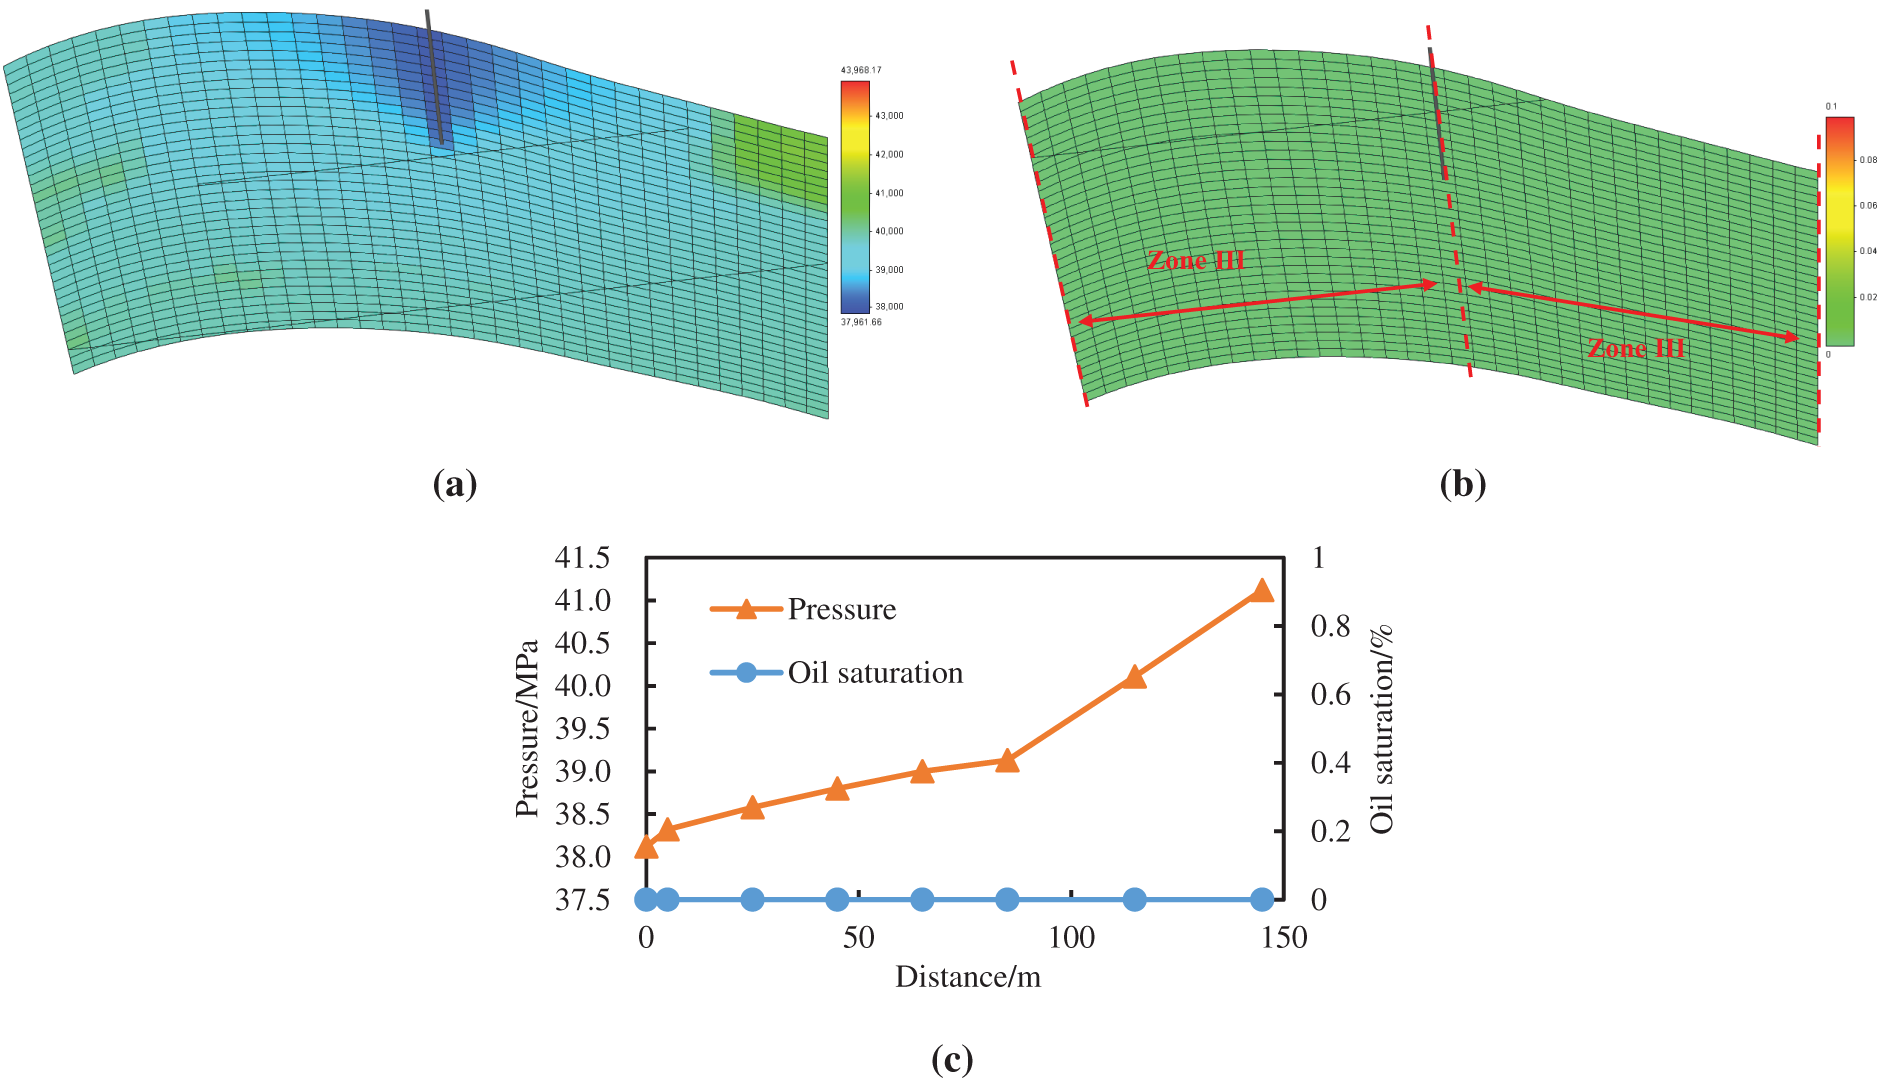
Figure 13: Longitudinal distribution of pressure and oil saturation: (a) pressure distribution; (b) oil saturation distribution; (c) distribution of pressure and oil saturation at different distances from producing wells
3.2.2 Reservoir Flow Characteristics during the Intermediate Stage (Pwf < Pd; Pr > Pd)
During the intermediate stage of depletion in deep condensate gas reservoirs, the initial bottom-hole pressure is insufficient to sustain normal production from the production well. Consequently, a pressure reduction is required. Setting the bottom-hole pressure slightly below the dew point pressure and with the average reservoir pressure above the dew point pressure, this section considers a bottom-hole flowing pressure of 33 MPa for depletion development. The variation curves of gas production, oil production, and gas-oil ratio are depicted in Fig. 14. In this production stage, C5+ condensate oil components first precipitate from the gas phase around the production well. However, due to the limited amount of condensate oil precipitation, the minimum saturation for condensate liquid flow is not yet reached, resulting in the formation of a transitional region with single-phase gas flow coexisting with oil in the reservoir. Compared to the initial gas production, the oil and gas equivalent during this stage is 8837 tons.
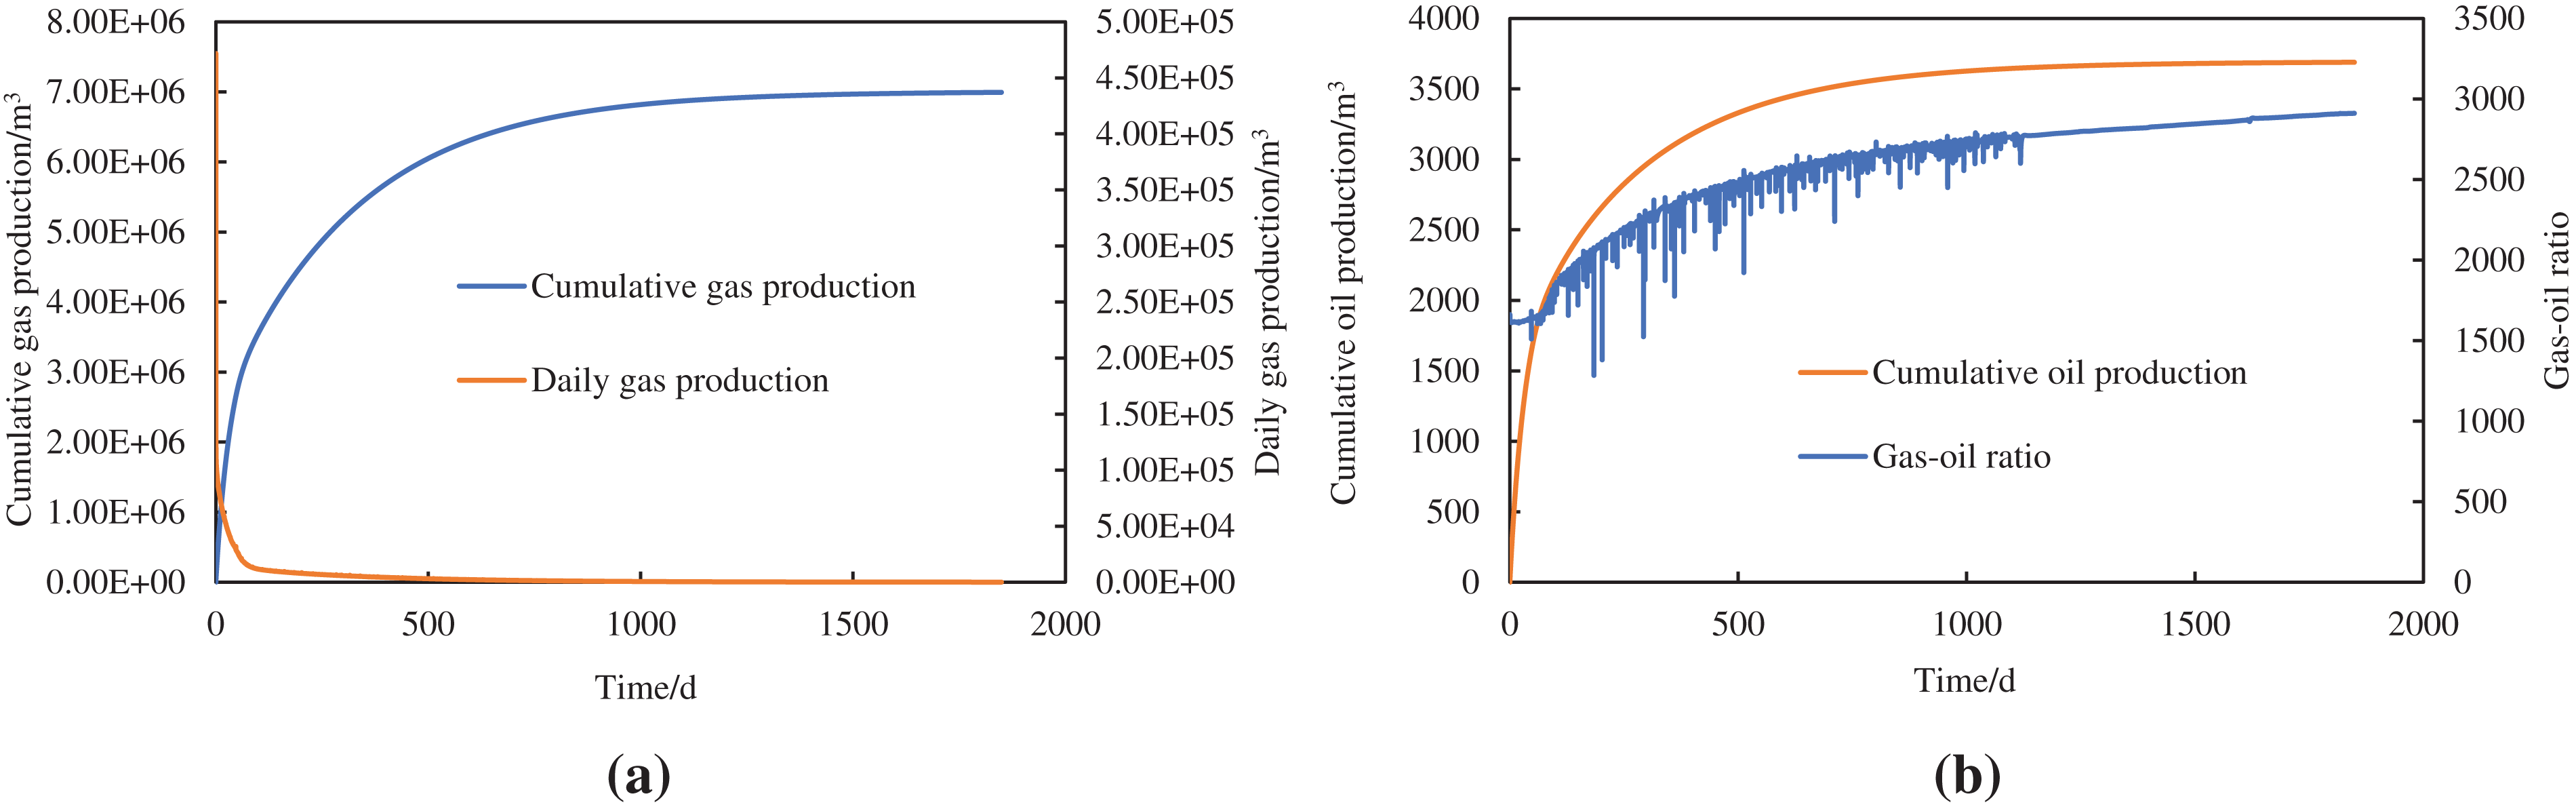
Figure 14: Dynamic data for depletion production with a bottom-hole flowing pressure of 33 MPa: (a) cumulative gas production and daily gas; (b) cumulative oil production and gas-oil ratio
During this process, the precipitation of condensate oil leads to a decrease in gas production. On the other hand, the deposited condensate oil may block the pore throats, causing a simultaneous decline in daily gas and oil production. Consequently, the gas-oil ratio exhibits a noticeable upward trend. This phenomenon is attributed to the partial precipitation of condensate oil in the reservoir, with the residual condensate oil remaining immobile in the pore throats, ultimately resulting in a gradual increase in the ratio of gas production to oil production over time.
In the intermediate stage of depletion, where the bottom-hole pressure is below the dew point pressure (Pd) and the average reservoir pressure (Pr) is above the dew point pressure, the distribution of reservoir pressure and condensate oil saturation is illustrated in Fig. 15. As the bottom-hole pressure drops below the dew point pressure during production, the reservoir pressure exhibits a radial decreasing distribution with proximity to the production well. Condensate oil precipitation initiates around the well, with higher oil saturation closer to the well, predominantly concentrated in the vicinity of the fractured area created by hydraulic fracturing. The pressure drop is more significant in the high-permeability zone of the hydraulic fractures, facilitating the flow of natural gas and condensate oil. However, this region may also become a condensate oil zone, impeding the flow of natural gas.
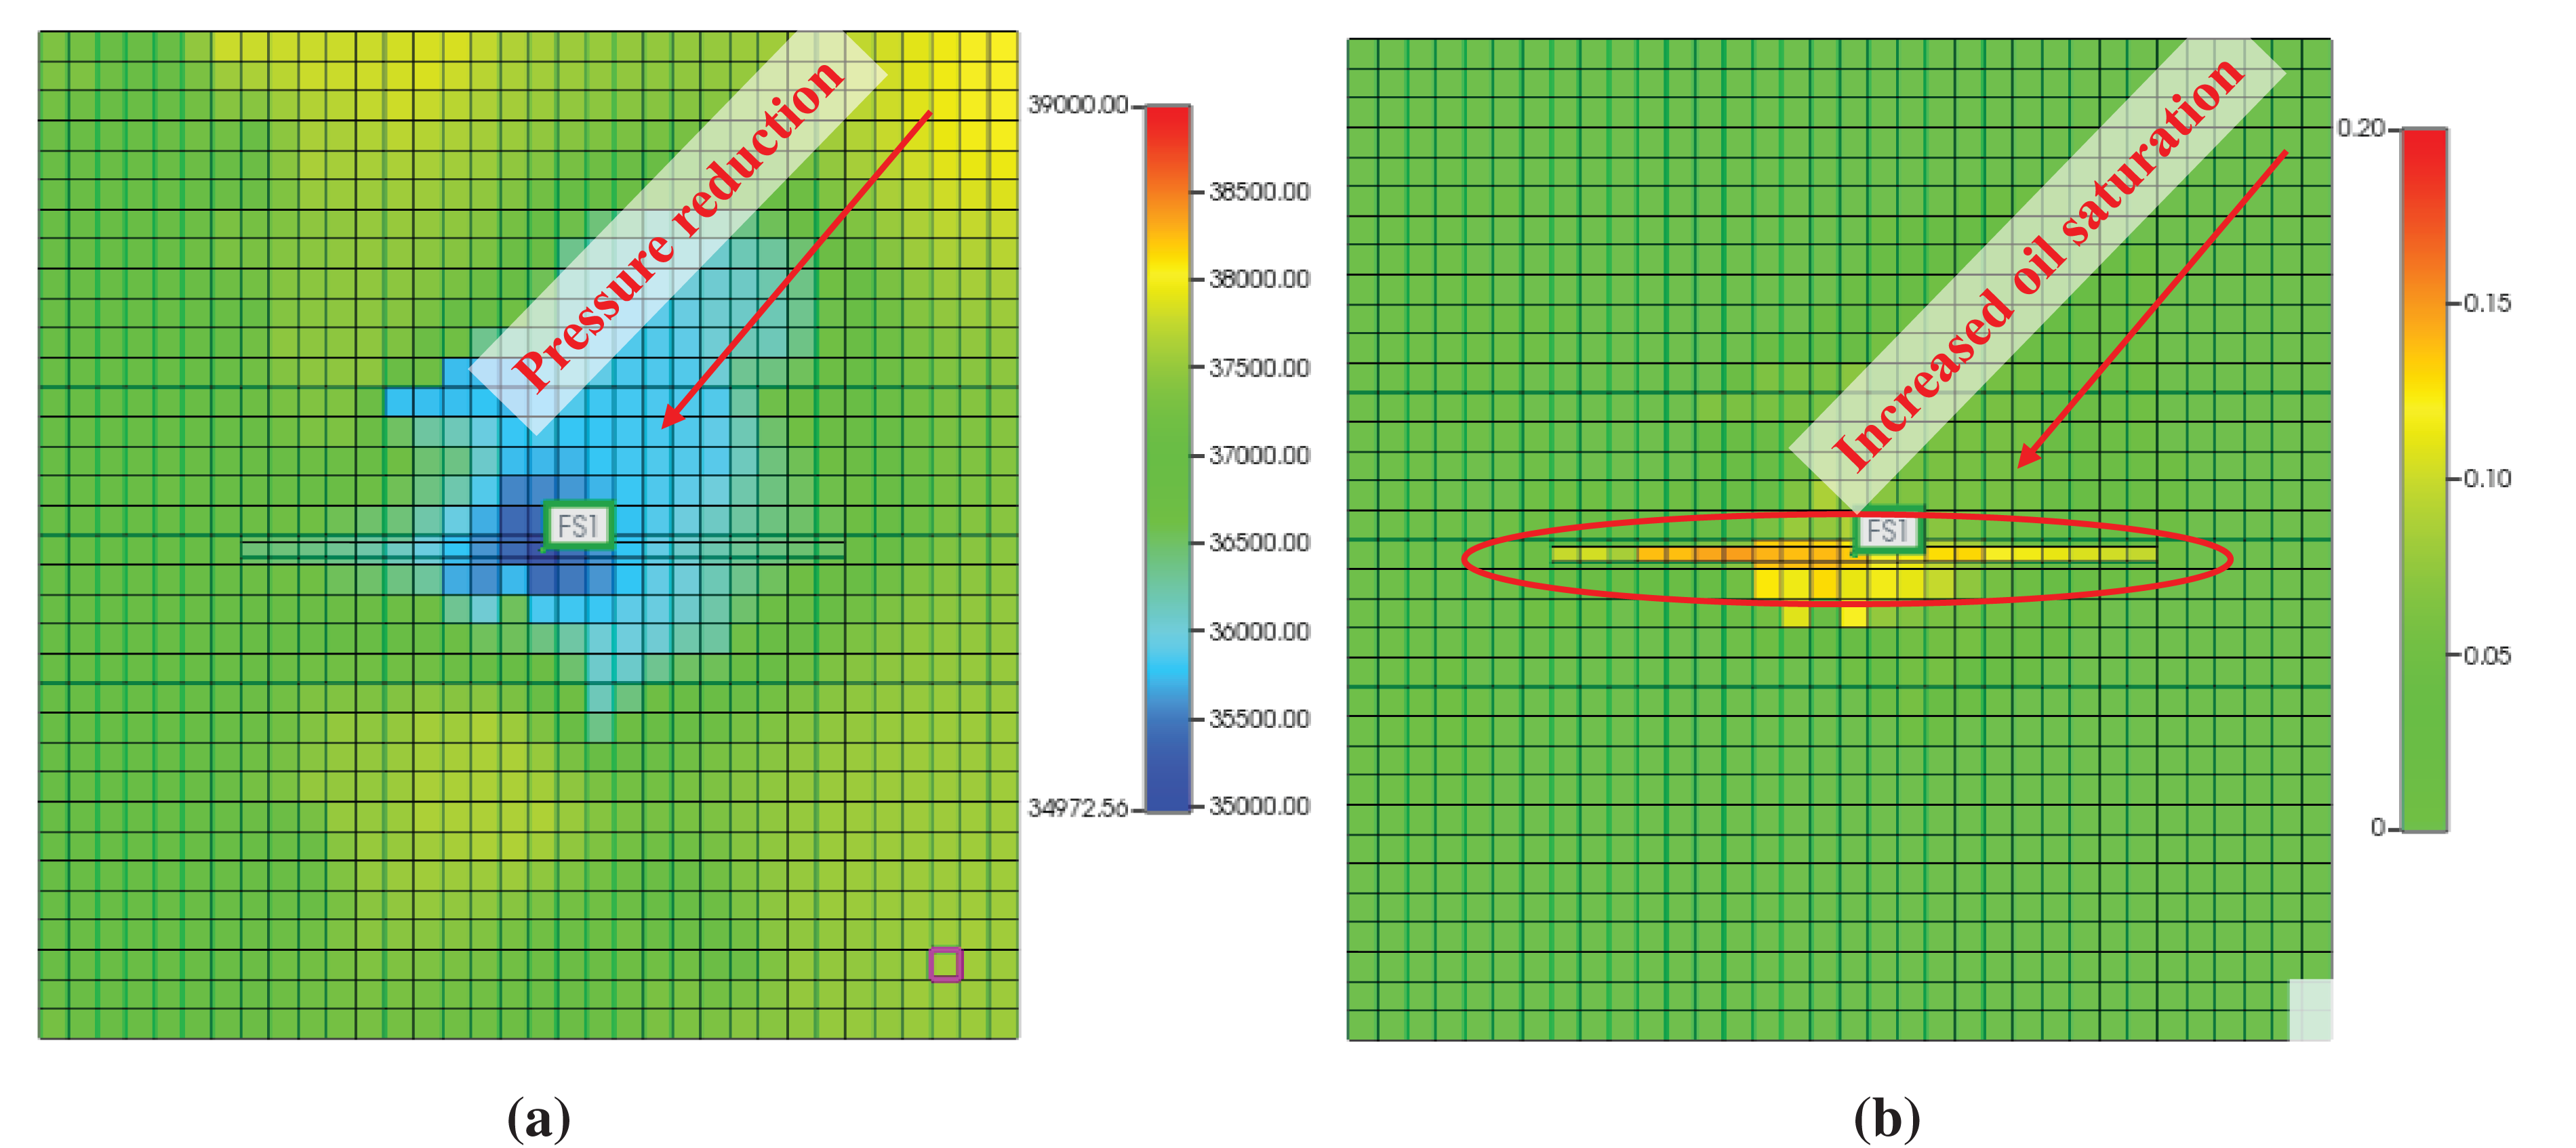
Figure 15: 33MPa depletion development horizontal distribution of pressure and oil saturation: (a) pressure distribution; (b) oil saturation distribution
The distribution of reservoir pressure and condensate oil saturation at varying distances from the production well is depicted in Fig. 16. In cases where the bottom-hole pressure is lower than the dew point pressure, and the reservoir pressure is higher than the dew point pressure during production, the reservoir fluid exhibits a coexistence of three regions. Generally, closer proximity to the production well results in higher condensate oil saturation. However, the rate of increase in condensate oil saturation diminishes. The highest condensate oil saturation occurs approximately 25 m from the well, potentially forming a condensate oil zone in the near-well region, causing condensate oil blockage and higher condensate oil content in the vicinity of the well.
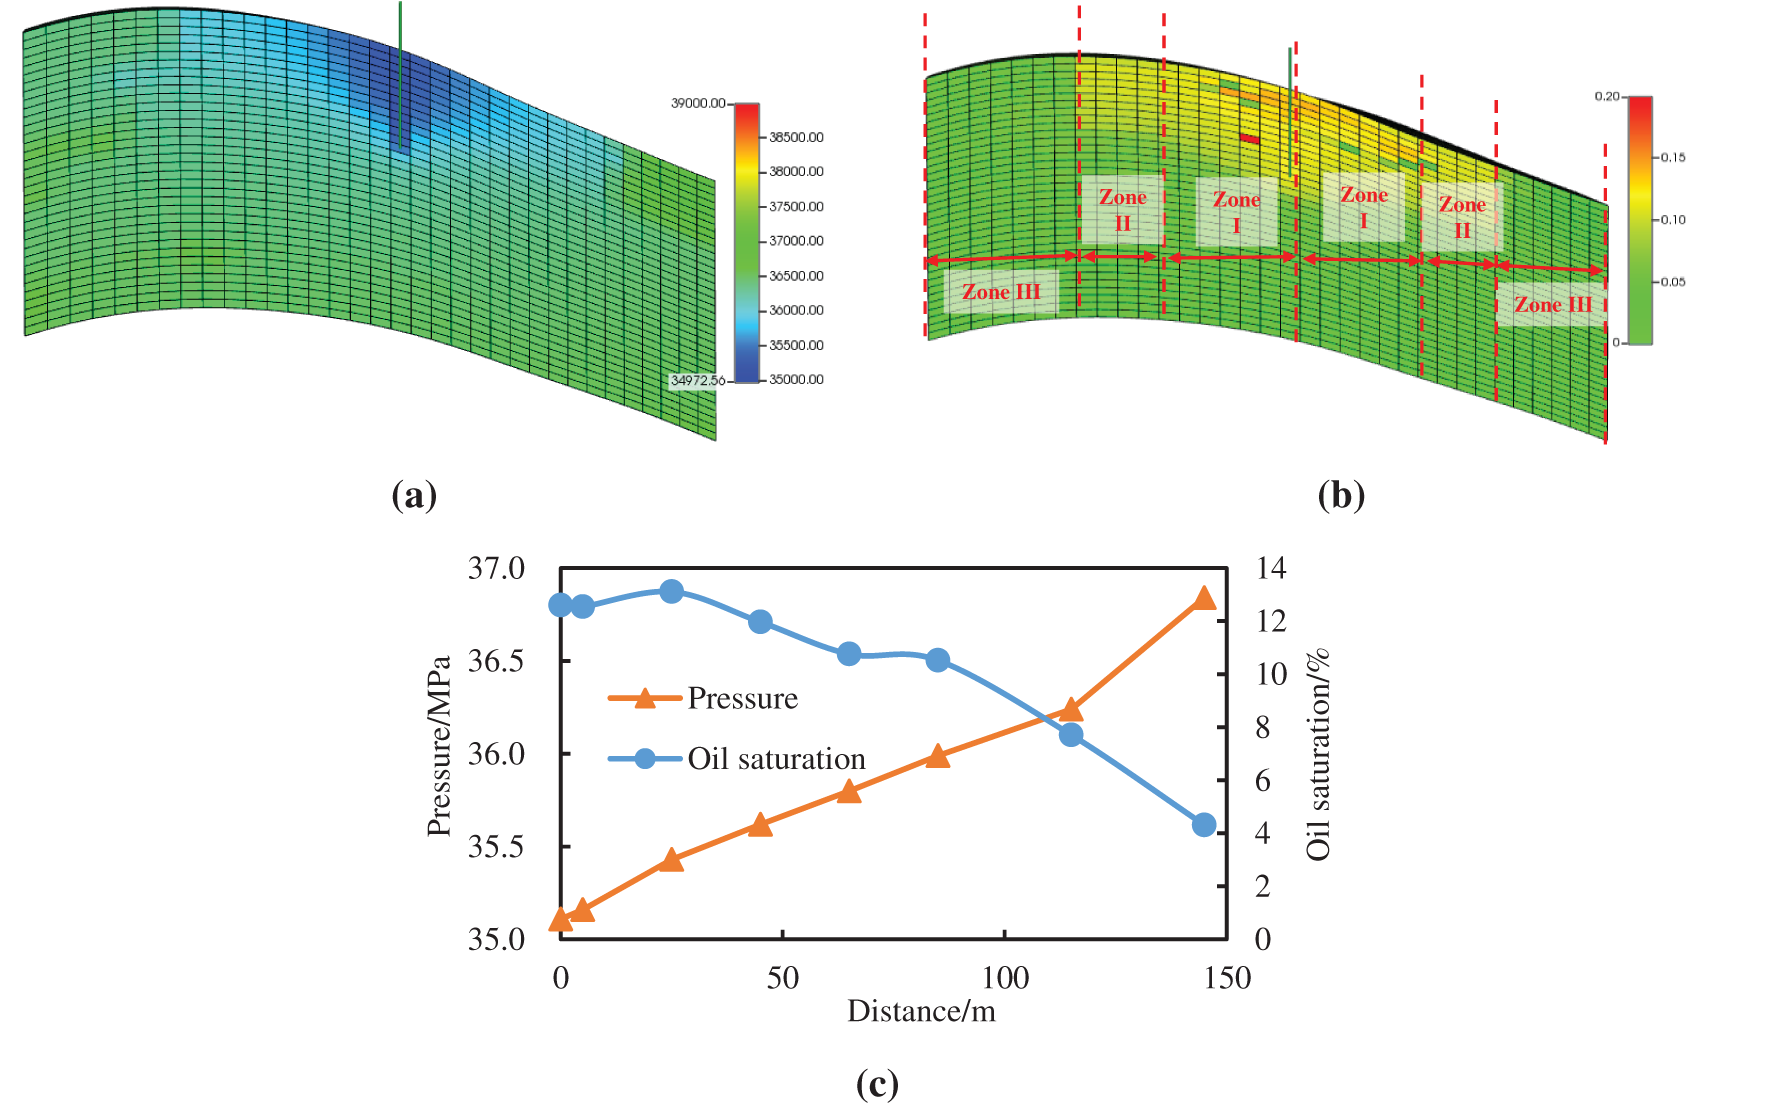
Figure 16: Longitudinal distribution of pressure and oil saturation: (a) pressure distribution; (b) oil saturation distribution; (c) distribution of pressure and oil saturation at different distances from producing wells
3.2.3 Reservoir Flow Characteristics during the Late Stage of Depletion (Pwf < Pd; Pr < Pd)
In the late stage of depletion, where the bottom-hole pressure (Pwf) is significantly lower than the dew point pressure (Pd), and the average reservoir pressure (Pr) has gradually fallen below the dew point pressure, the dynamic changes in gas production, oil production, and gas-oil ratio are depicted in Fig. 17. As both the reservoir pressure and bottom-hole pressure are below the dew point pressure, mixed fluid flow dominated by oil and gas coexists in the reservoir. During this production stage, as the reservoir pressure continues to decrease, a substantial amount of condensate oil precipitates. In comparison to the mid-term development, there is a notable increase in daily gas and oil production, leading to a sharp rise in the gas-oil ratio. At this stage, the oil and gas equivalent is 15,187 tons.
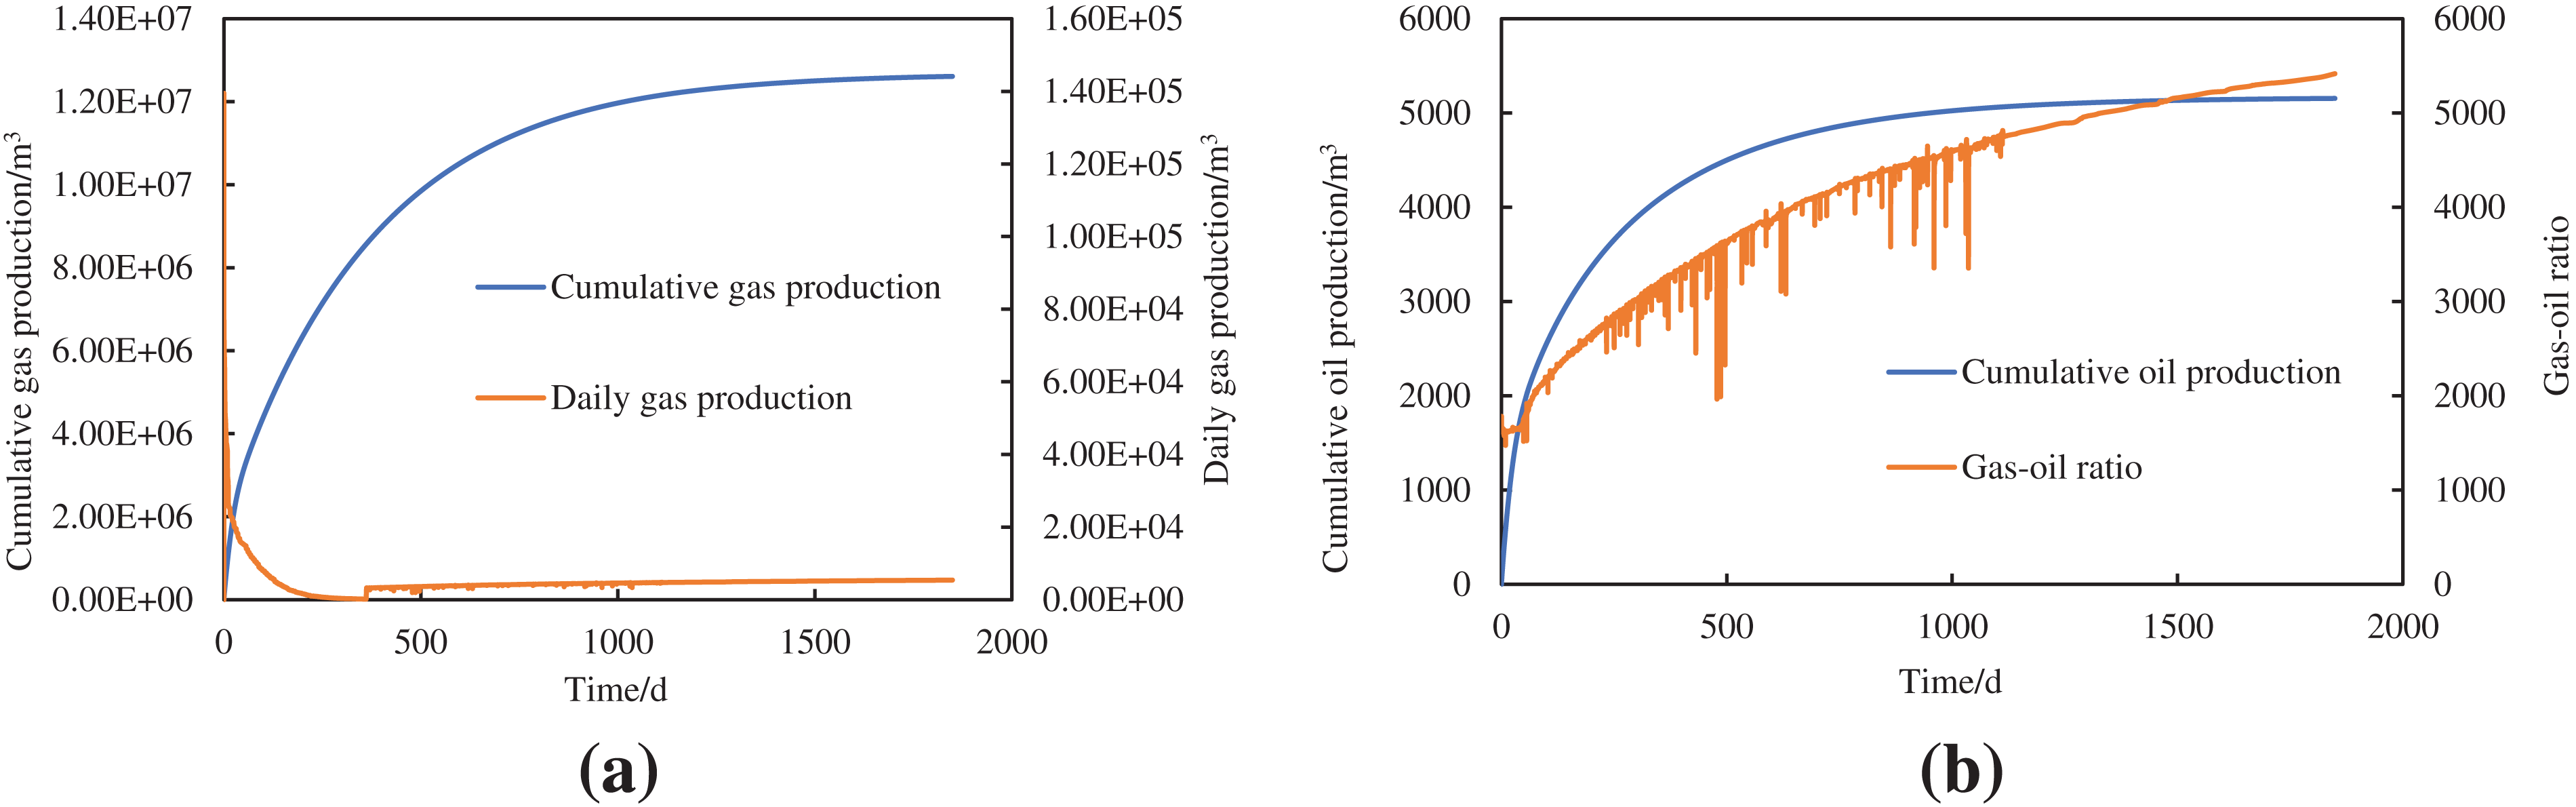
Figure 17: Dynamic data for depletion production with a bottom-hole flowing pressure of 25 MPa: (a) cumulative gas production and daily gas; (b) cumulative oil production and gas-oil ratio
During this pressure stage, the daily gas and oil production increases compared to the mid-term development. This is attributed to the continuous precipitation and accumulation of retrograde condensate, overcoming the resistance of the condensate oil blockage (Jamin effect resistance). Additionally, as the amount of condensate oil precipitation reaches the critical flow saturation, condensate oil begins to flow toward the wellbore. Due to the low interfacial tension between condensate oil and gas, the condensate gas efficiently transports the condensate oil film, leading to enhanced flow efficiency.
The distribution of pressure and oil saturation during this production stage is illustrated in Fig. 18. As the bottom-hole pressure and reservoir pressure are both below the dew point pressure, the closer the distance to the production well, the lower the pressure, with a more pronounced pressure drop in high-permeability zones compared to low-permeability zones. In areas where the bottom-hole pressure and reservoir pressure are below the dew point pressure, the condensate oil content in the reservoir is higher, mainly distributed in high-permeability zones, and mostly constitutes movable condensate oil.
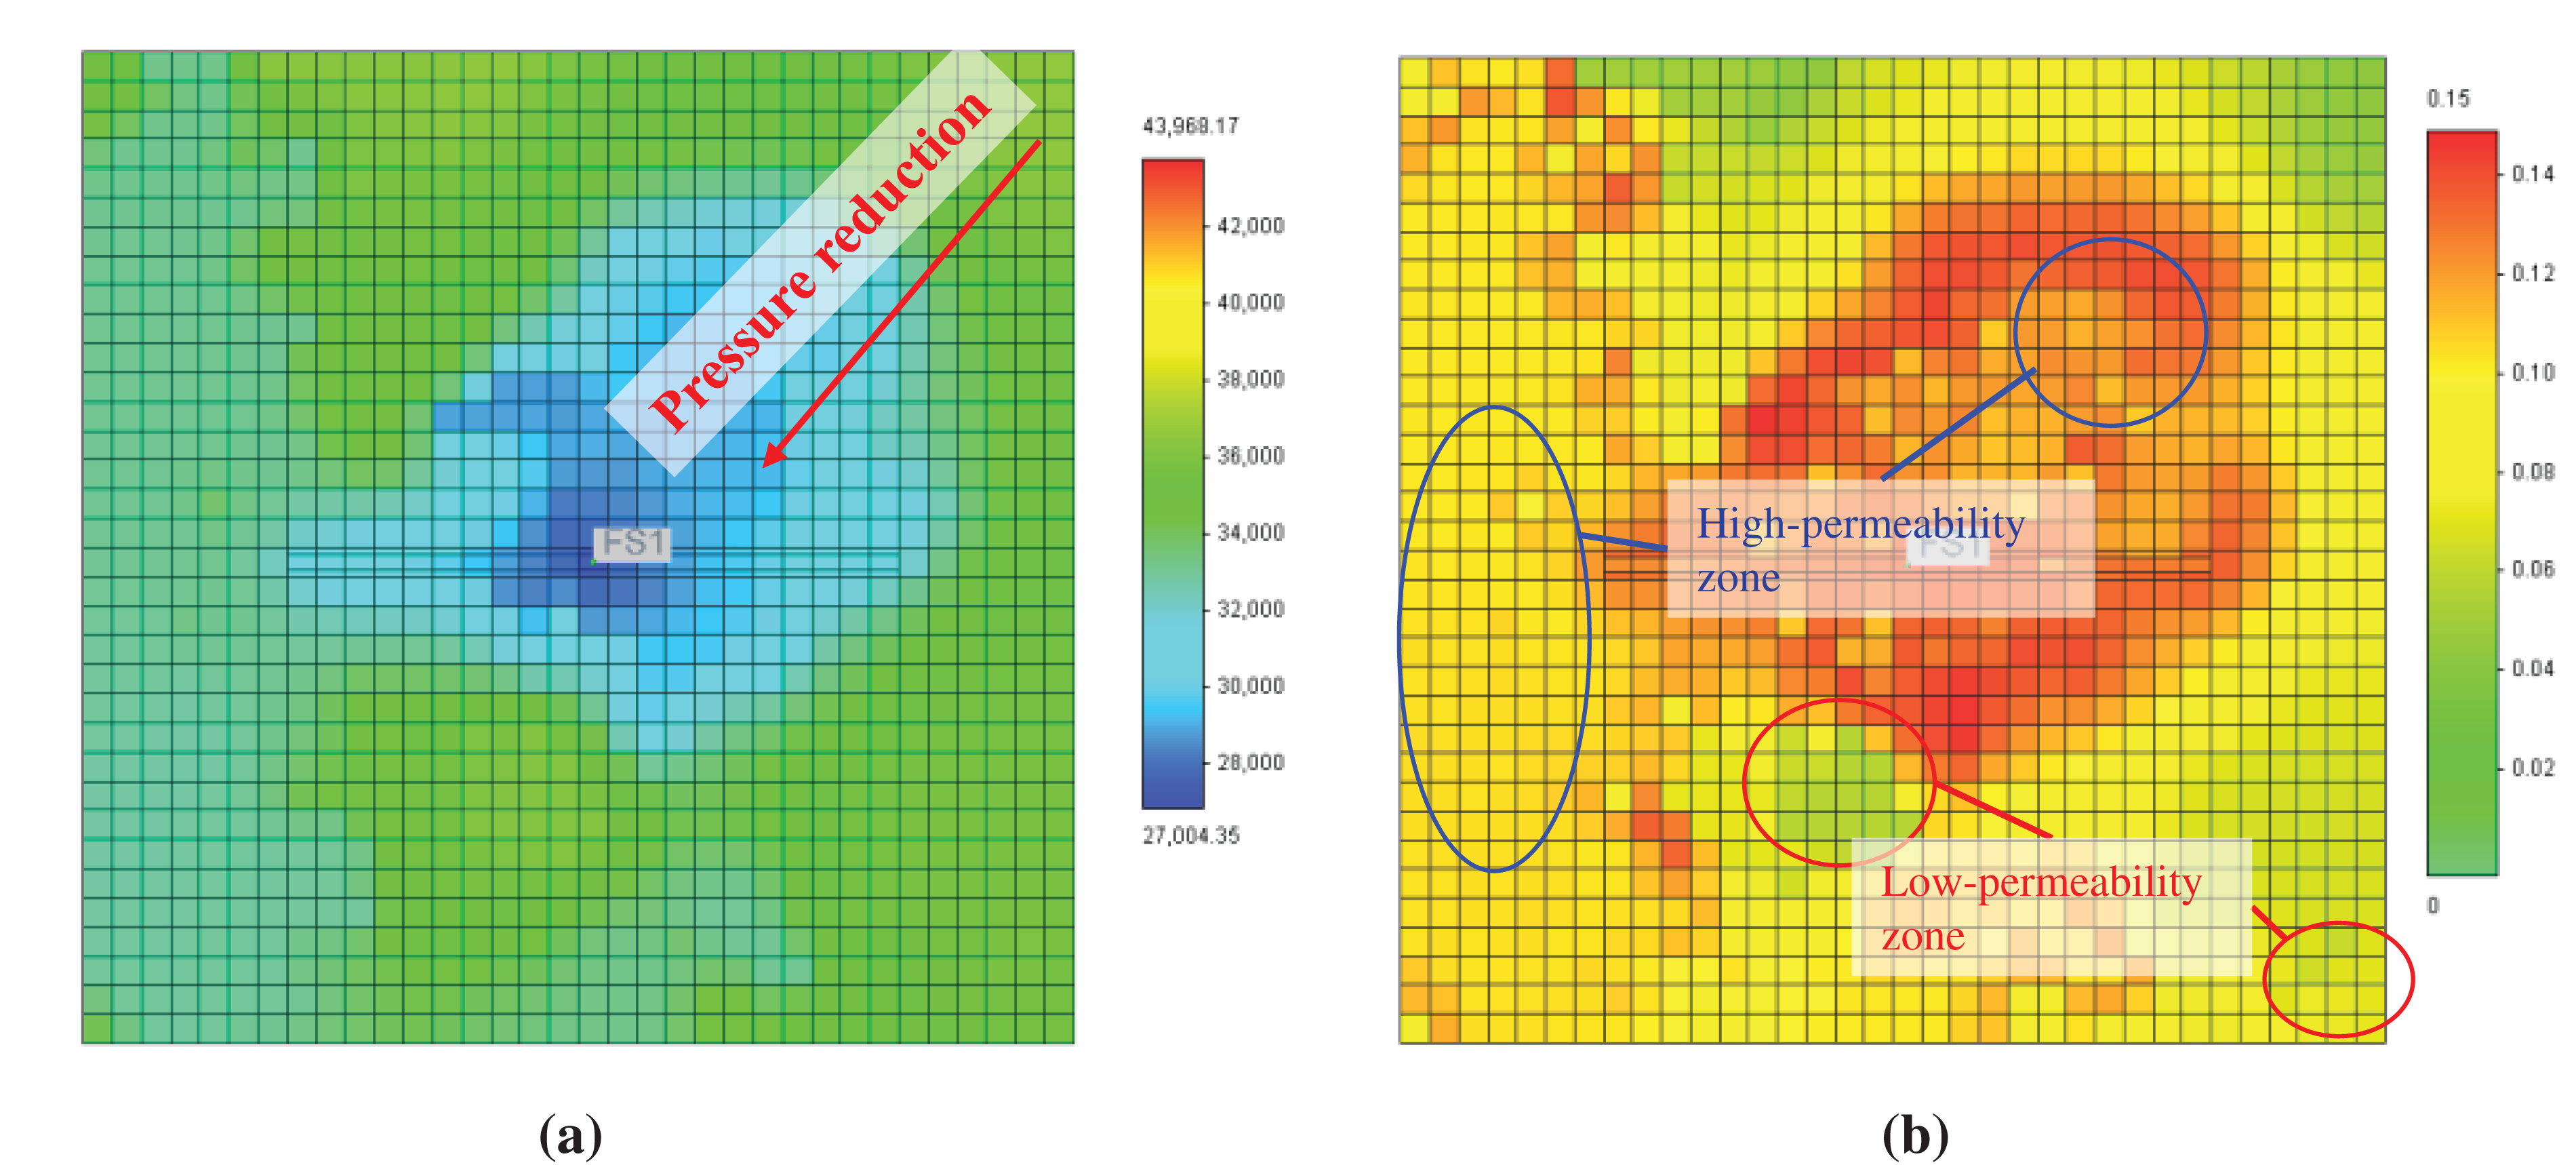
Figure 18: 25 MPa depletion development horizontal distribution of pressure and oil saturation: (a) pressure distribution; (b) oil saturation distribution
The distribution of reservoir pressure and condensate oil saturation at different distances from the production well (Fig. 19) reveals that when both bottom-hole pressure and reservoir pressure are below the dew point pressure during production, the reservoir fluid is predominantly in Zones II and I, with little presence of Zone III single-phase gas flow. Generally, closer proximity to the well results in higher condensate oil saturation. However, due to the rapid pressure drop in the near-well zone, there is a phenomenon of delayed condensate oil precipitation caused by the non-equilibrium phase change in condensate gas, leading to a decrease in condensate oil saturation in the near-well zone. Additionally, the increased gas flow velocity of the condensate gas induces non-Darcy flow, contributing to a certain degree of condensate liquid saturation. Consequently, the actual condensate oil saturation exhibits a complex and irregular pattern with varying distances from the well.
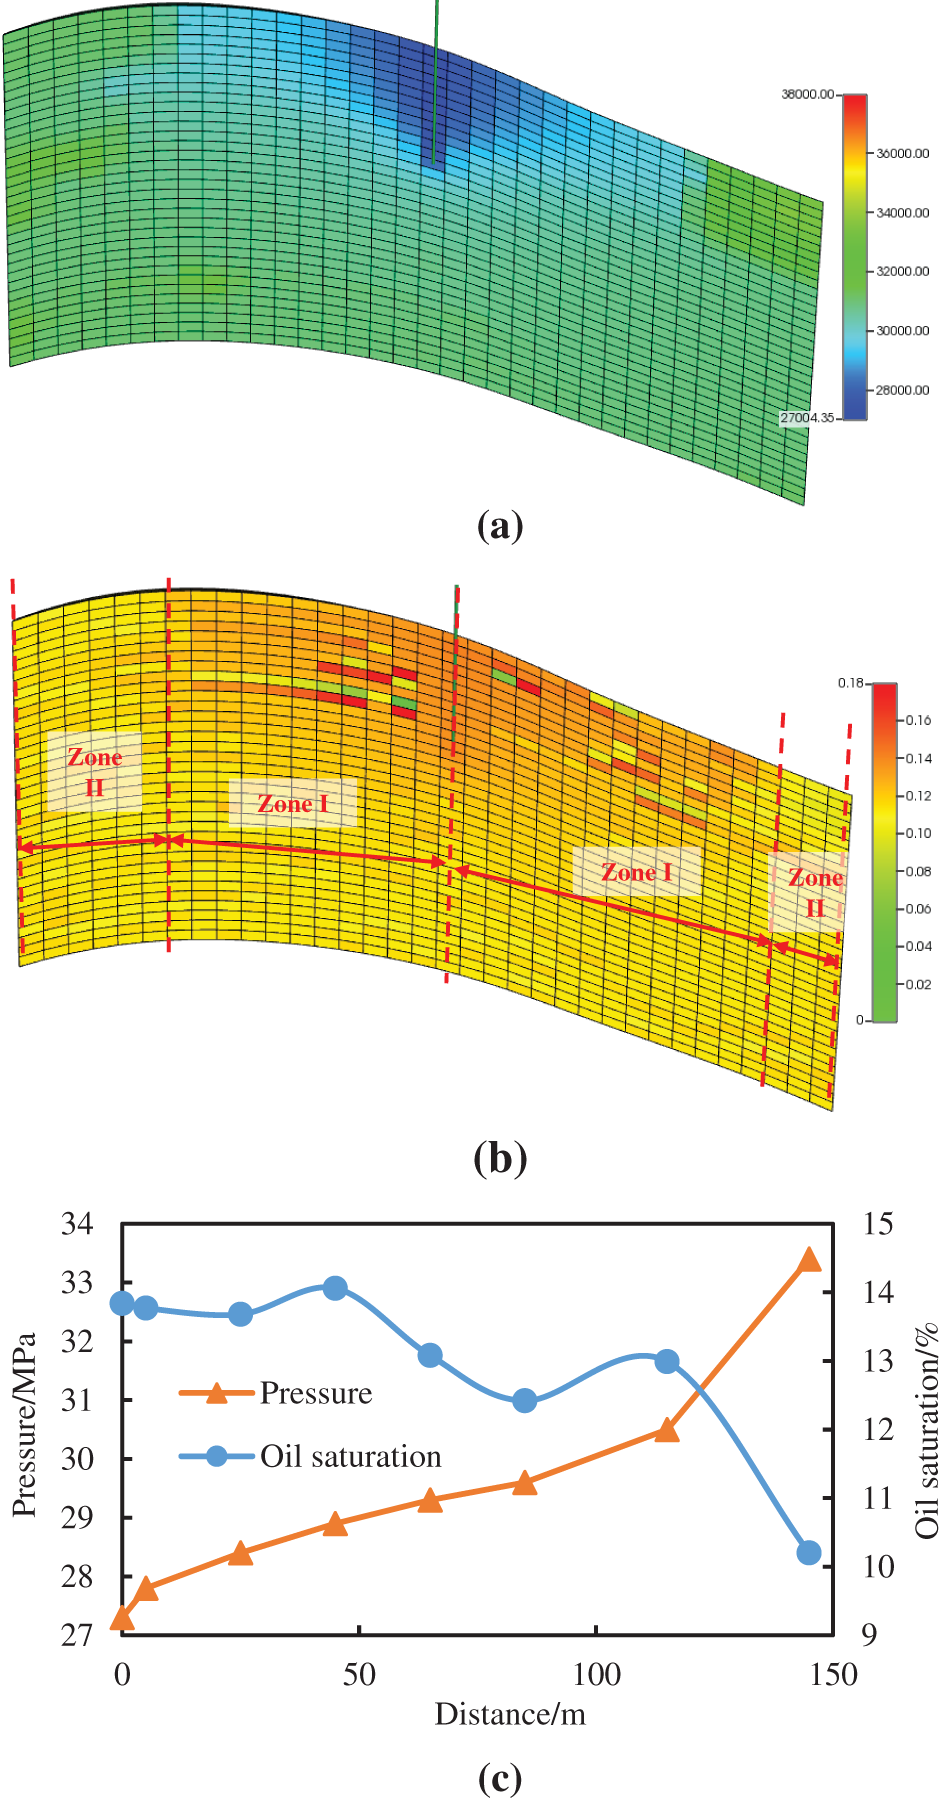
Figure 19: Longitudinal distribution of pressure and oil saturation: (a) pressure distribution; (b) oil saturation distribution; (c) distribution of pressure and oil saturation at different distances from producing wells
In summary, during the initial development of deep condensate gas reservoirs, the reservoir mainly remains in the gas flow region (Zone III). To maximize reservoir exploitation efficiency, it is necessary during production to adjust the choke size of gas wells or artificially increase production pressure to control the production rate of wells, ensuring it does not exceed the gas phase productivity of the reservoir to avoid liquid phase formation. Regular reservoir pressure testing should also be conducted to ensure that reservoir pressure remains above the dew point pressure. In the mid-term development phase, corresponding measures can be taken, such as water or high-pressure gas injection near gas wells [11,39], to delay the decline rate of reservoir pressure and mitigate condensation phenomena. The development mode of the Yaha Condensate Gas Field in China adopts a water injection followed by gas injection pattern. After 25 years of production, the ultimate condensate oil and natural gas recovery rates are estimated to be approximately 48.14% and 64.1%, respectively, representing a 25% increase compared to the depleted development method [40]. In the late-stage development phase, to counteract condensation phenomena and maintain stable production, increasing the bottom-hole flowing pressure of production wells can be considered to elevate reservoir pressure and delay condensation. Regular wellbore cleaning or artificial lifting operations should also be conducted to enhance productivity and prolong the effective production period of gas wells. The Ansell gas condensate field restored production from some gas wells through artificial lifting operations, resulting in a 50% increase in gas well production to 1.237 billion cubic feet [41]. Additionally, injecting appropriate chemicals into the wellbore can be employed to clean condensate deposits and restore well productivity.
4 Production Dynamics and Seepage Laws in Well A1
The well A1 is a deep condensate gas well in a certain oilfield in China. It was fully drilled in July 2001, with a reservoir depth ranging from 4316 to 4500 m. The average porosity is 6.7%, and the average permeability is 3.2 mD. The reservoir temperature at the middle part is 168°C, with a geothermal gradient of 3.58°C/100 m. The original reservoir pressure is 41.9 MPa, and the pressure coefficient is 1.03, representing a typical high-temperature and normal-pressure reservoir. The well began spontaneous production after hydraulic fracturing in November 2005. Initially, the oil nozzle size was 6 mm, with an oil pressure of 21 MPa, casing pressure of 6.6 MPa, daily gas production of 94,719 m3, daily oil production of 30 tons, and water content of 3.0%. With the passage of production time, the production rate declined rapidly. By May 2008, the oil pressure had decreased to 3.3 MPa, casing pressure to 4.8 MPa, daily gas production to 4101 m3, daily liquid production to 0.5 tons, and water content to 0.1%. During this period, the annual decrement rate of daily gas production was 35%, and that of daily oil production was 88%. Since 2009, the well has been in the shut-in phase for reservoir pressure restoration. Throughout the development process, well A1 underwent two shut-in periods for reservoir pressure restoration and foam injection stimulation, but the contribution to production was not significant. Therefore, analyzing the production history of this well and the reservoir fluid seepage characteristics at different development stages has significant reference value for implementing measures to increase oil recovery in the future.
The production dynamic data curve of well A1 is depicted in Fig. 20. In the initial stage of condensate gas production, oil and gas were co-produced, indicating a higher content of condensate oil in the reservoir. When the bottom-hole flowing pressure fell below the dew point pressure, retrograde condensation occurred, contaminating the near-wellbore zone and causing a decrease in gas and oil recovery efficiency, consistent with the results of phase analysis. Despite experiencing two shut-ins with a certain rise in reservoir pressure, rapid pressure decline and decreasing production rates were observed after re-opening the well.
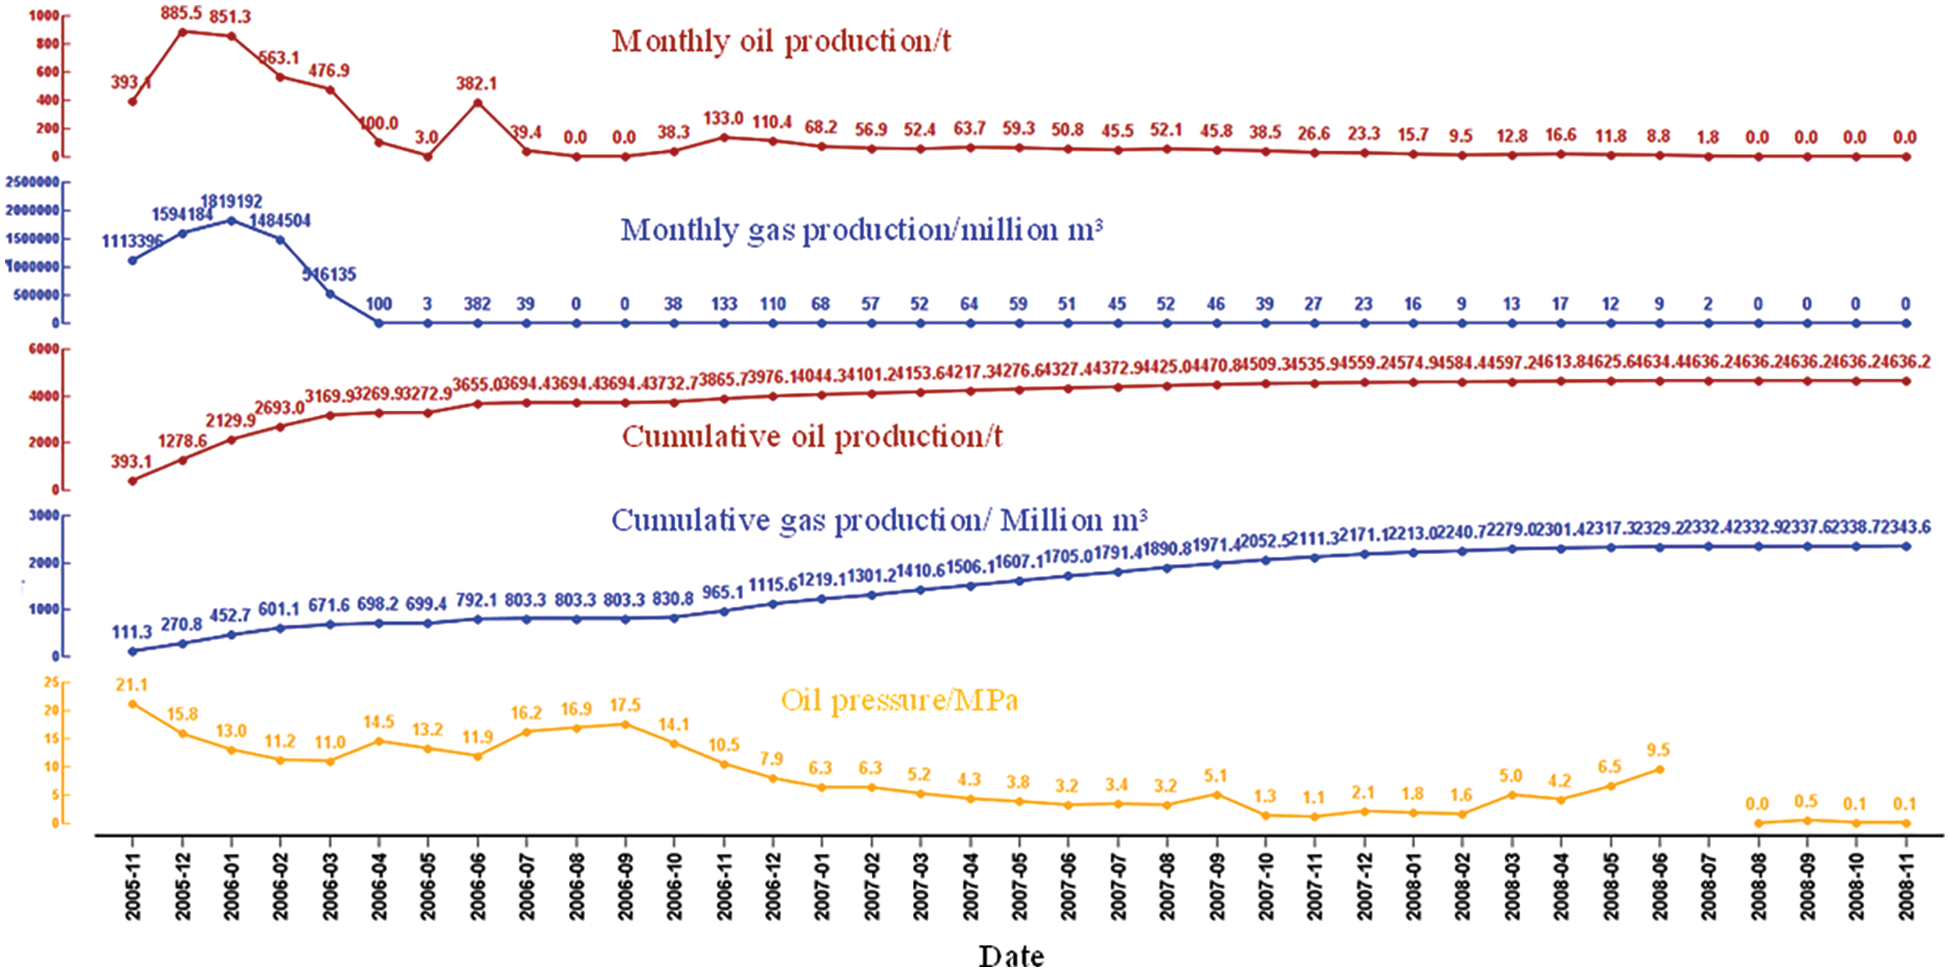
Figure 20: Production performance curve of well A1
4.1 The Single-Phase Flow Stage of Well A1 (Pwf > Pd; Pr > Pd)
During the actual production process of well A1, when the cumulative gas production reaches 1.3 million cubic meters, both the bottom-hole pressure and reservoir pressure of the production well exceed the dew point pressure. The variations in gas production, bottom-hole pressure, and gas-to-oil ratio during this period are illustrated in Fig. 21. The pressure differential between the reservoir and dew point is small, being only 8.68 MPa, with the bottom-hole pressure dropping near the dew point pressure. When the bottom-hole pressure is higher than the dew point pressure, the gas-to-oil ratio remains relatively constant. However, due to excessively high initial gas production rates, when the daily gas production reaches 120,000 cubic meters, the bottom-hole pressure abruptly drops below the dew point pressure, leading to a significant increase in the production of condensate oil in the reservoir and subsequent substantial reductions in daily gas and oil production. Although certain well shut-in measures were implemented subsequently, maintaining reservoir pressure above the dew point, the deposition of condensate oil near the wellbore resulted in a prolonged decrease in the productivity of the condensate gas well.
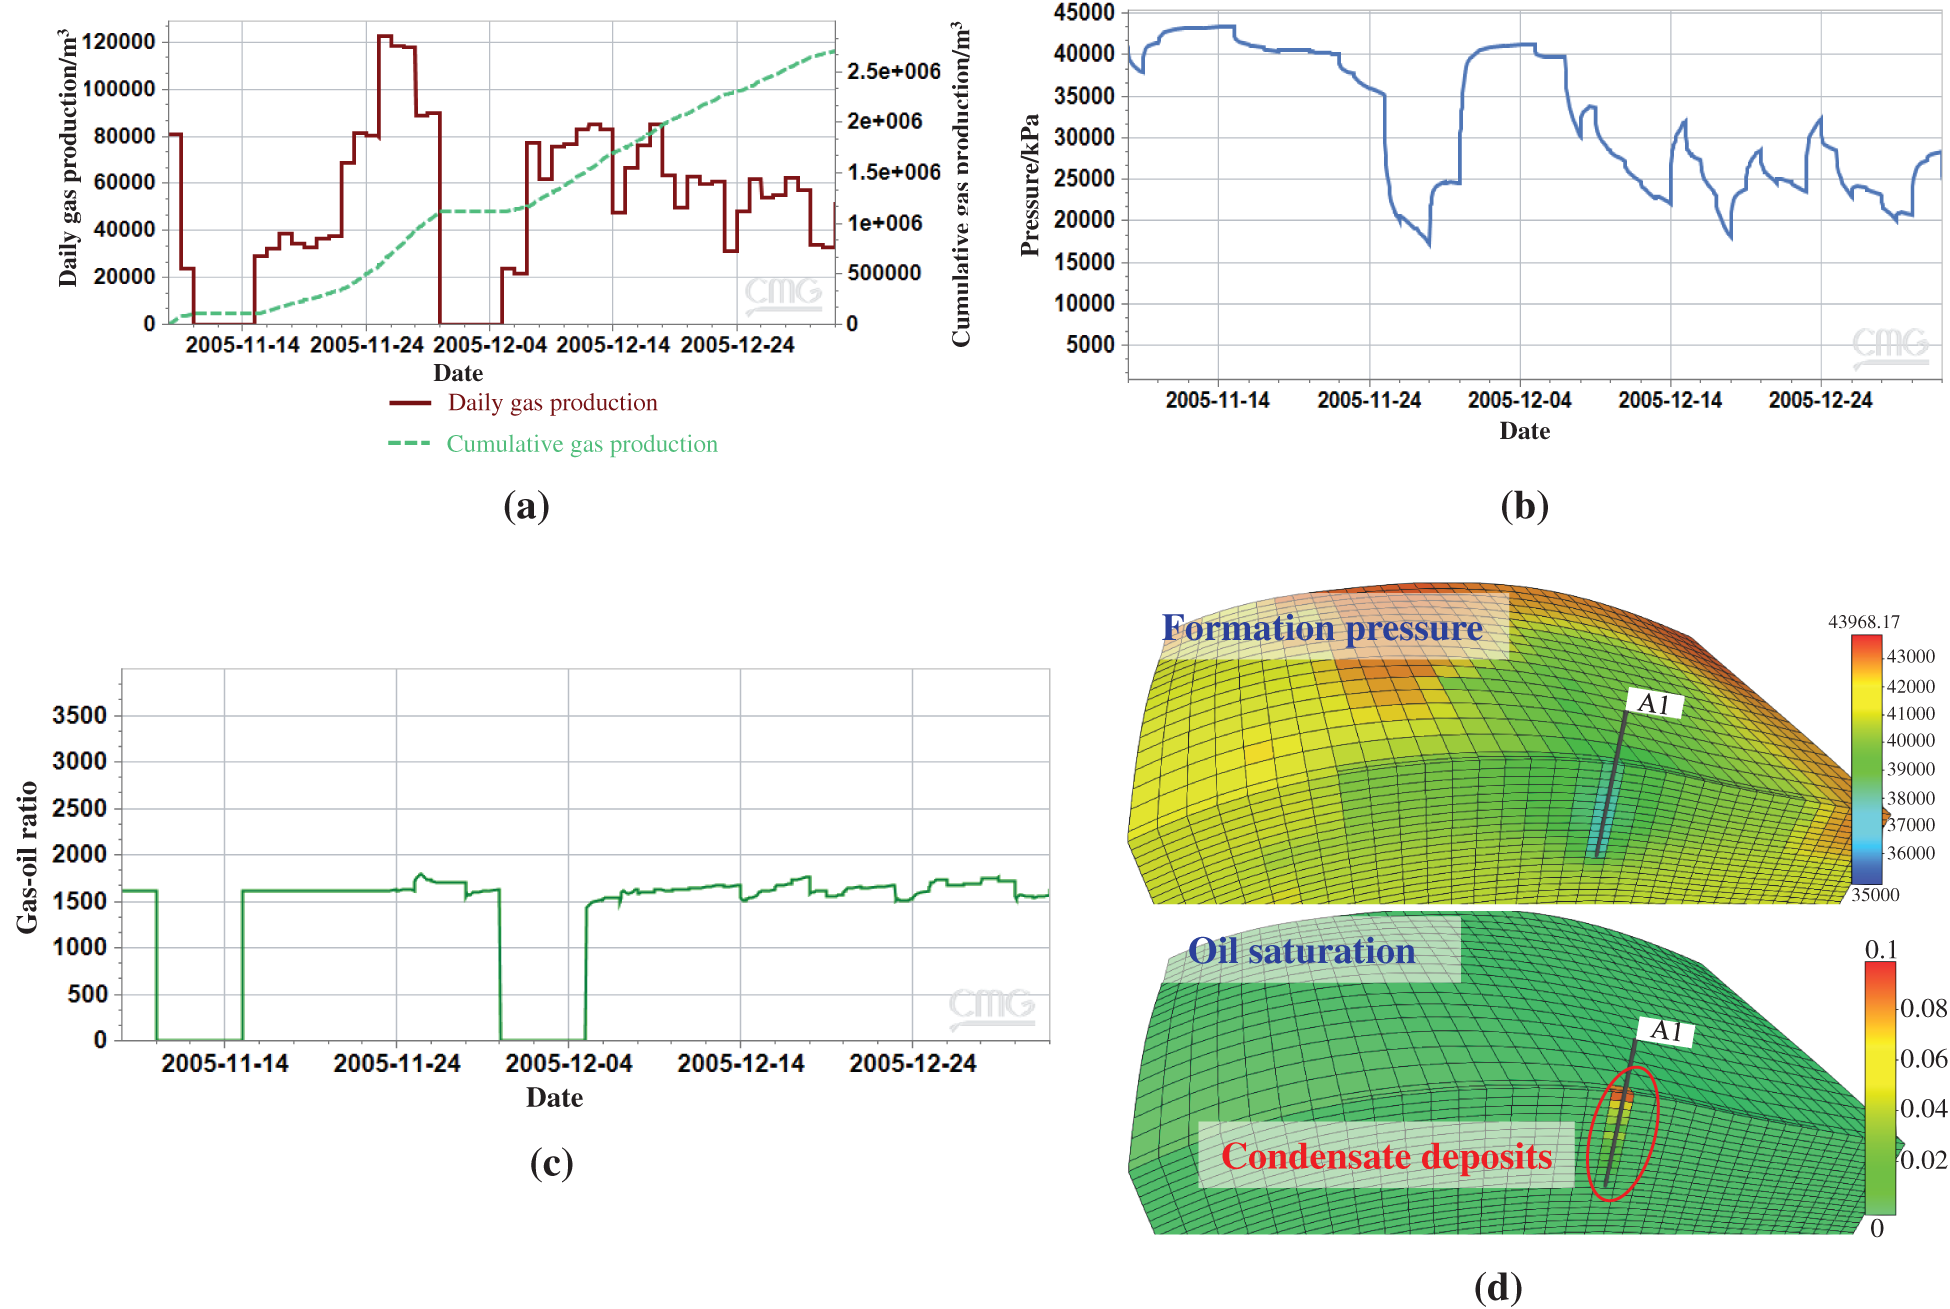
Figure 21: Production dynamic data and distribution of pressure and oil saturation in single-phase flow stage of well A1: (a) daily gas and cumulative gas production; (b) bottom hole pressure; (c) gas-oil ratio; (d) formation pressure and oil saturation distribution
4.2 Two-Phase Flow Transition Stage in Well A1 (Pwf
As the condensate gas well A1 continues its exploitation, the bottom-hole flowing pressure further decreases. When the bottom-hole flowing pressure of well A1 drops to around 28 MPa, with a cumulative gas production of 2.724 million cubic meters, the reservoir enters a transitional phase. During this period, the dynamic production data, pressure profiles, and oil saturation distribution of well A1 are depicted in Fig. 22. At a bottom-hole flowing pressure of approximately 28 MPa, pressures near the wellbore fall below the dew point pressure, leading to the onset of condensate oil precipitation. The permeation zone within the reservoir exhibits a coexistence of three zones. As the bottom-hole pressure approaches the dew point pressure, the gas-to-oil ratio gradually increases. When the bottom-hole pressure becomes lower than the dew point pressure, the condensate oil near the wellbore reaches its minimum flow saturation, allowing simultaneous flow of oil and gas.
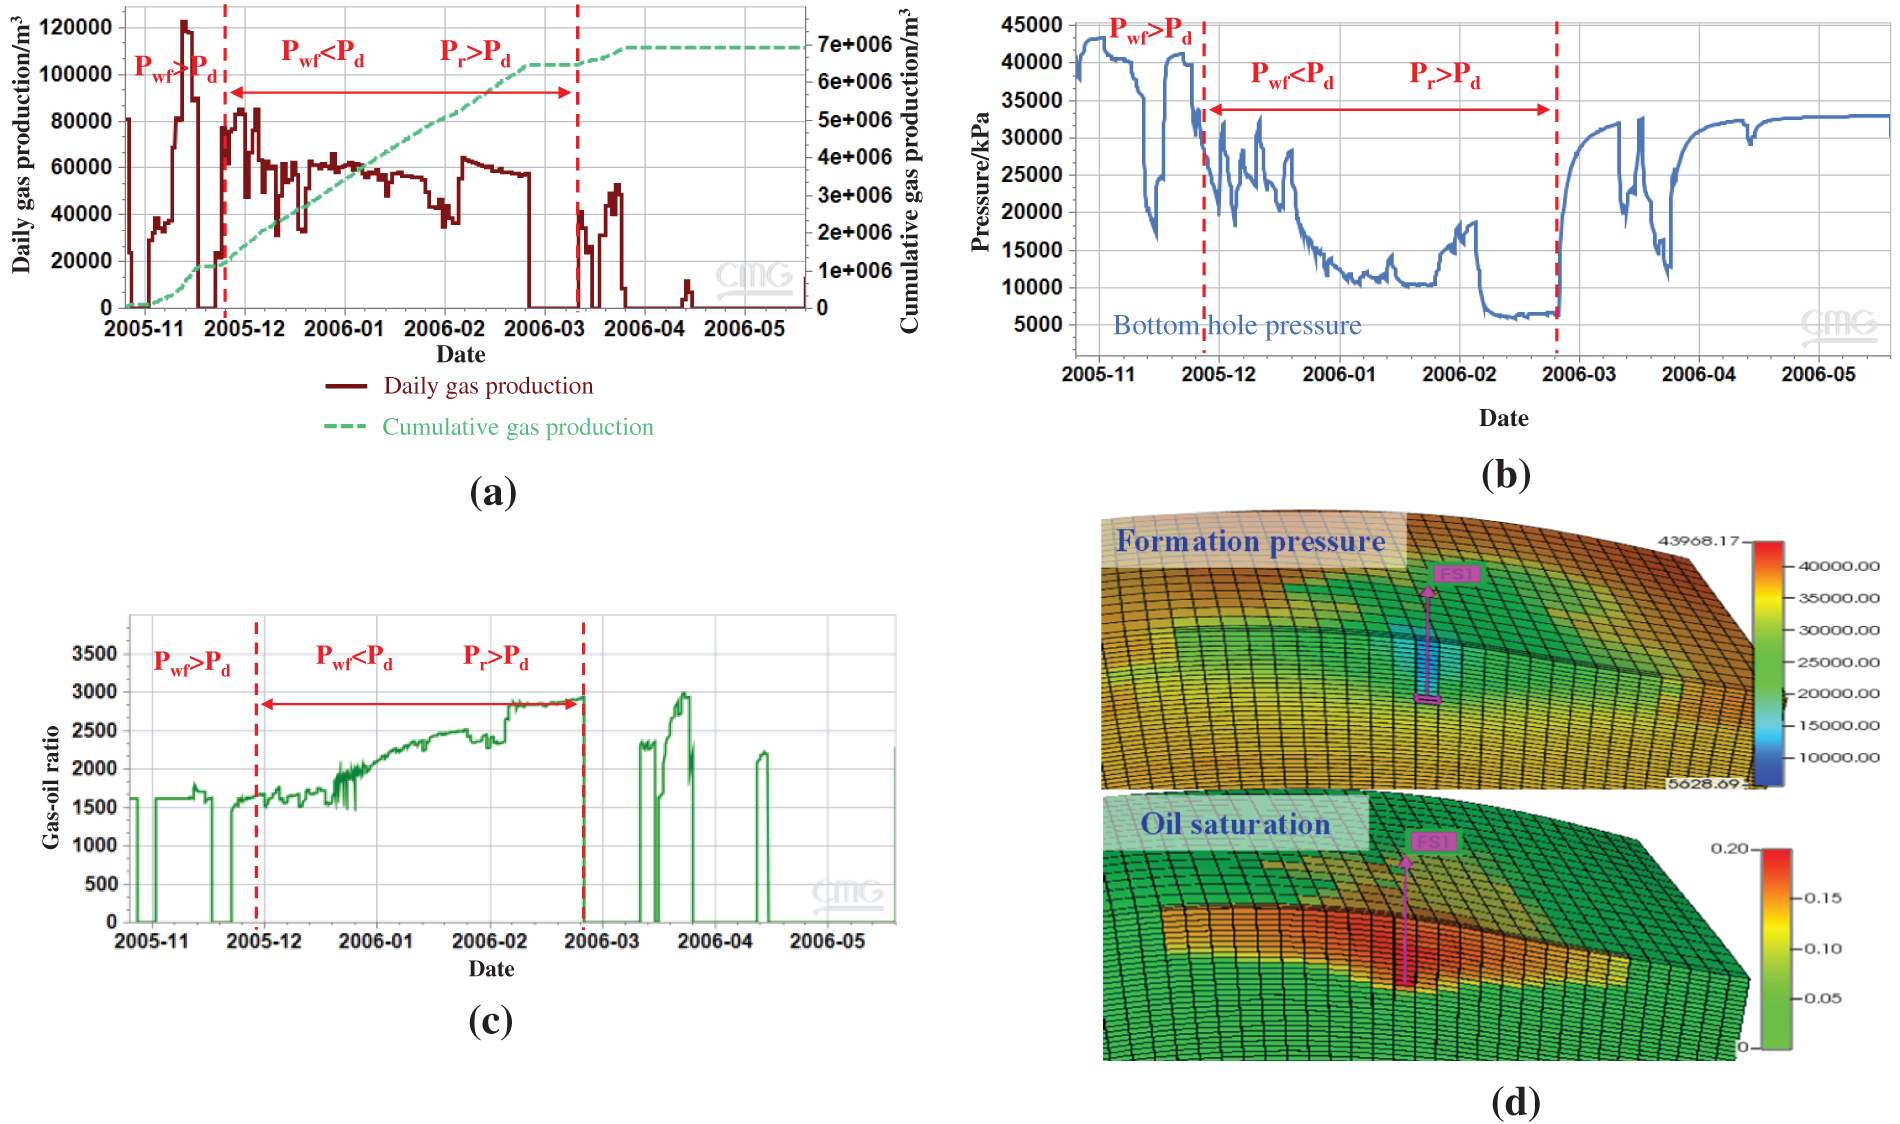
Figure 22: Production dynamic data and distribution of pressure and oil saturation in two-phase flow transition stage of well A1: (a) daily gas and cumulative gas production; (b) bottom hole pressure; (c) gas-oil ratio; (d) formation pressure and oil saturation distribution
Upon reaching a cumulative gas production of 2.724 million cubic meters, a small region about 80 m away from the wellbore exhibits immobile condensate oil, indicating the prevalence of Type II flow behavior. The extent of Type III flow covers a range of 91 m from the wellbore. The presented figures illustrate the intricate dynamics of the transitional phase, highlighting the evolving behavior of pressure and oil saturation distribution in the reservoir.
4.3 Two-Phase Flow Stage in Well A1 (Pwf
When the cumulative gas production reaches 15.01 million cubic meters, both the bottom-hole pressure and reservoir pressure in well A1 fall below the dew point pressure. During this period, the dynamic production data, pressure profiles, and condensate oil saturation distribution are illustrated in Fig. 23. As the bottom-hole pressure continues to decrease, the condensate oil precipitation region expands further. When the bottom-hole flowing pressure and reservoir pressure approach the dew point pressure, the gas-to-oil ratio experiences a sharp increase. Compared to the preceding two production stages, the increment in gas-to-oil ratio during this phase is notably larger. At this point, only Type II and Type I flow regions are present in the reservoir, with no occurrence of Type III flow areas.
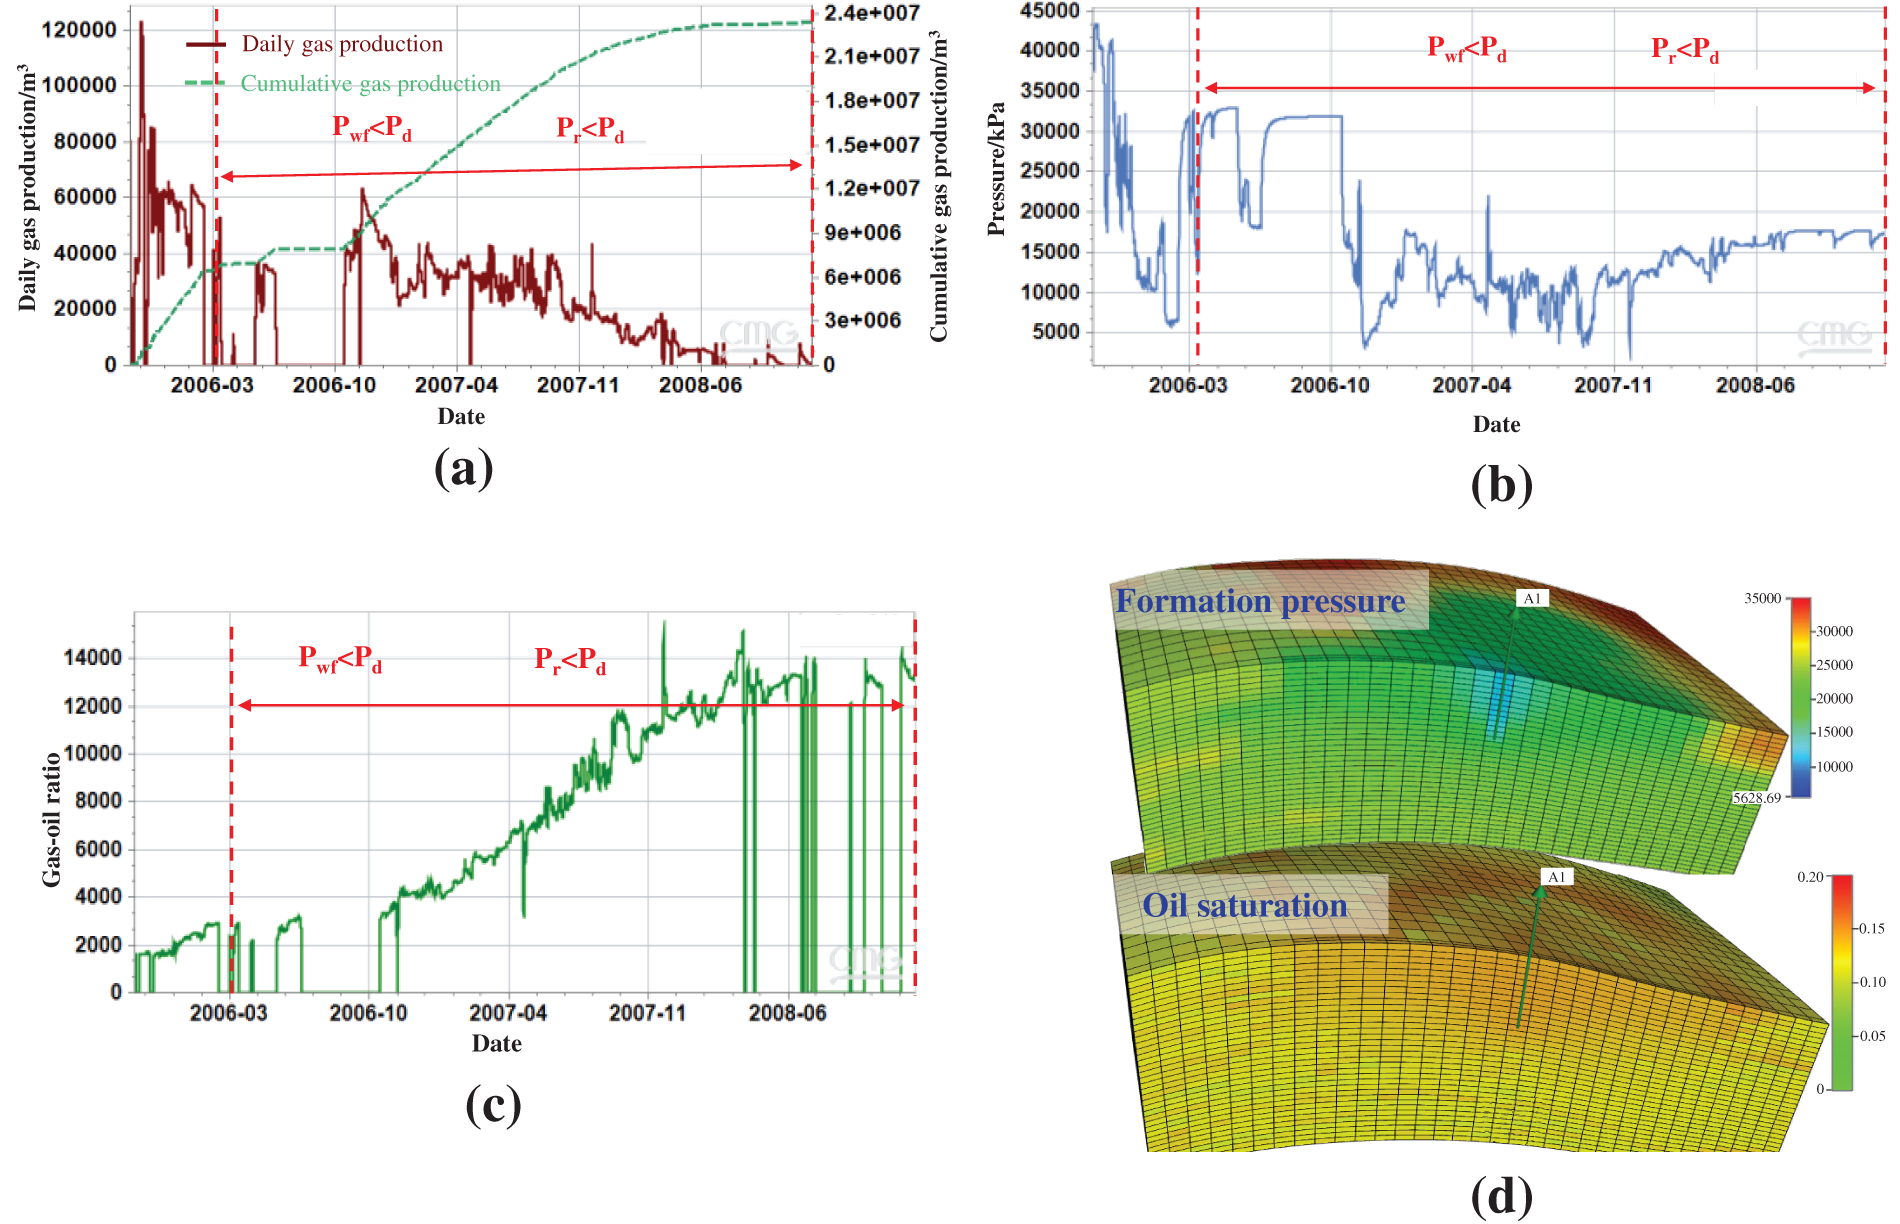
Figure 23: Production dynamic data and distribution of pressure and oil saturation in two-phase flow stage of well A1: (a) daily gas and cumulative gas production; (b) bottom hole pressure; (c) gas-oil ratio; (d) formation pressure and oil saturation distribution
The well has been in shut-in status since 2008, during which the reservoir pressure has partially recovered. However, the predicted current reservoir pressure remains below the dew point pressure. For the later reopening of the well, it is advisable to implement controlled-pressure production to optimize a reasonable production rate. Additionally, in the later stages of production, considering reservoir pressure depletion, measures such as gas injection or gas lift from surrounding wells can be employed. Another strategy could involve single-well cyclic gas injection and production in well A1. Due to the earlier depletion development, a substantial amount of condensate oil is present in the reservoir. For later-stage production, techniques like hot nitrogen or CO2 injection can be considered to alleviate retrograde condensation damage. Certainly, the initial investment required for implementing these measures is typically substantial. This includes the construction of surface injection facilities, corresponding facilities for injection fluid treatment, as well as monitoring and control systems. If CO2 injection is chosen, sufficient gas supply is necessary. Therefore, prior to adopting the aforementioned measures, a thorough study of the block’s potential recovery must be conducted to ensure that the expected natural gas production revenue exceeds the costs incurred. Additionally, reservoir characteristics such as permeability, porosity, fluid properties, and geological structures play a significant role in the successful implementation of enhanced recovery techniques. Hence, compatibility assessments of enhanced recovery technologies for the block should be conducted to ensure that the injection process is suitable for the specific reservoir conditions. On the other hand, if injected CO2 is not fully captured and stored within the reservoir, it may lead to greenhouse gas emissions. Moreover, the injection of fluids during the process may potentially impact surface water and groundwater. This includes the use of surface water resources during the injection process, as well as the risk of contaminating groundwater quality due to injected fluids. These highlight the necessity for comprehensive research and assessment prior to the implementation of measures to increase recovery rates on-site.
In summary, during the depletion development of condensate gas reservoirs, the main reason for the decrease in condensate oil and condensate gas production is the anti-condensation phenomenon in the reservoir. Due to the deeper burial depth, higher temperatures, and pressures of the gas reservoir, deep condensate gas reservoirs exhibit characteristics of high condensate oil content in fluid composition. The decline in production varies depending on the condensate oil content, with reservoirs containing higher condensate oil experiencing faster production declines compared to those with lower condensate oil content. Additionally, the abandonment pressure during the depletion development of condensate gas reservoirs is also related to the type and depth of the reservoir. Gas reservoirs with deeper burial depths face higher abandonment pressures. Under high-temperature and high-pressure conditions, hydrocarbon components in deep condensate gas reservoirs may exhibit more complex phase behaviors, making it difficult to distinguish between gas and liquid interfaces, thus complicating condensate production and separation. On the other hand, the development of deep condensate gas reservoirs requires production equipment that can withstand high-temperature and high-pressure conditions, as well as the adoption of production processes suitable for such conditions, to ensure process stability and safety. This may lead to increased development costs.
This study, based on data from the deep condensate gas well A1, provides a thorough analysis of the phase behavior and reservoir flow dynamics under different temperature and pressure conditions. The research offers critical insights into the behavior of deep condensate gas reservoirs at various development stages. The main conclusions drawn are as follows:
(1) The initial pressure of the condensate gas system is higher than the dew point pressure. Retrograde condensation occurs when the pressure falls below the dew point pressure. The maximum condensate liquid production is observed at pressures around 25 MPa.
(2) As pressure decreases, gas phase density and viscosity gradually decrease, while liquid phase density and viscosity tend to increase. The content of C1 in the condensate gas slightly increases, and heavier components decrease. In the later stages, light hydrocarbon components re-evaporate from the condensate oil, leading to a trend of gradual decline followed by an increase in C2–C5 molar fractions.
(3) When Pwf > Pd and Pr > Pd, the reservoir flow pattern is dominated by a single-phase gas flow area in Zone III. When Pwf < Pd and Pr > Pd, the reservoir fluid flow state exhibits a coexistence of three zones. When Pwf < Pd and Pr < Pd, the reservoir fluid is mostly in Zones II and I, with almost no Zone III single-phase gas flow.
(4) A sudden drop in bottom-hole pressure below the dew point pressure triggers the production of condensate oil, significantly reducing subsequent gas and oil production. Therefore, controlled-pressure production is recommended during the development of deep condensate gas.
(5) Currently, the reservoir pressure is relatively low. Consideration can be given to gas injection, gas lift, and cyclic gas injection and production in surrounding wells. Additionally, considering the substantial presence of condensate oil in the reservoir, late-stage production may involve hot nitrogen or CO2 injection to alleviate retrograde condensation damage.
Acknowledgement: I would like to thank CMG for providing the simulation environment and research tools.
Funding Statement: The authors received specific funding from the Key Research Project of Tarim Oilfield Company of Petrochina (671023060003) for this study.
Author Contributions: The authors confirm contribution to the paper as follows: study conception and design: Yuliang Su; data collection: Wendong Wang, Rujun Wang; model construction and calculation: Chong Sun, Meichun Yang; analysis and interpretation of results: Ying Shi, Yintao Zhang; draft manuscript preparation: Qiang Liu, Zheng Chen; manuscript revision: Yuliang Su. All authors reviewed the results and approved the final version of the manuscript.
Availability of Data and Materials: The data that support the findings of this study are available from the corresponding author, Yuliang Su, upon reasonable request.
Ethics Approval: Not applicable.
Conflicts of Interest: The authors declare that they have no conflicts of interest to report regarding the present study.
References
1. B. Bilotu Onoabhagbe, S. Rezaei Gomari, P. Russell, J. Ugwu, and B. T. Ubogu, “Phase change tracking approach to predict timing of condensate formation and its distance from the wellbore in gas condensate reservoirs,” Fluids, vol. 4, no. 2, pp. 71, Apr. 2019. doi: 10.3390/fluids4020071. [Google Scholar] [CrossRef]
2. S. Alafnan, M. Aljawad, F. Alismail, and A. Almajed, “Enhanced recovery from gas condensate reservoirs through renewable energy sources,” Energy Fuels, vol. 33, no. 10, pp. 10115–10122, Aug. 2019. doi: 10.1021/acs.energyfuels.9b01761. [Google Scholar] [CrossRef]
3. H. X. Vo and R. N. Horne, “Experimental study of composition variation during flow of gas-condensate,” presented at the SPE Annu. Tech. Conf. Exhibition, Houston, TX, USA, Sep. 28–30, 2015. SPE-175011-MS. [Google Scholar]
4. Y. S. Fang, B. Z. Li, Y. L. Hu, Z. D. Sun, and Y. X. Zhu, “Condensate gas phase behavior and development,” presented at the SPE Int. Oil Gas Conf. Exhib. China, Beijing, China, Nov. 2–6, 1998. SPE-50925-MS. [Google Scholar]
5. P. Guo et al., “The determination of phase behavior properties of high-temperature high-pressure and rich condensate gases,” Fuel, vol. 280, no. 1, pp. 118568, Nov. 2020. doi: 10.1016/j.fuel.2020.118568. [Google Scholar] [CrossRef]
6. Z. L. Qi, B. S. Liang, R. J. Deng, Z. M. Du, S. P. Wang and W. Zhao, “Phase behavior study in the deep gas-condensate reservoir with low permeability,” presented at the EUROPEC/EAGE Conf. Exhib., London, UK, Jun. 11, 2007. SPE-107315-MS. [Google Scholar]
7. C. Y. Sun, H. Liu, and K. L. Yan, “Experiments and modeling of volumetric properties and phase behavior for condensate gas under ultra-high-pressure conditions,” Indust. Eng. Chem. Res., vol. 51, no. 19, pp. 6916–6925, May 2012. doi: 10.1021/ie2025757. [Google Scholar] [CrossRef]
8. H. Tu, P. Guo, N. Jia, and Z. Wang, “Numerical evaluation of phase behavior properties for gas condensate under non-equilibrium conditions,” Fuel, vol. 226, no. 1, pp. 675–685, Aug. 2018. doi: 10.1016/j.fuel.2018.04.048. [Google Scholar] [CrossRef]
9. Z. Y. Abbasov and V. M. Fataliyev, “The effect of gas-condensate reservoir depletion stages on gas injection and the importance of the aerosol state of fluids in this process,” J. Nat. Gas Sci. Eng., vol. 31, no. 1, pp. 779–790, Apr. 2016. doi: 10.1016/j.jngse.2016.03.079. [Google Scholar] [CrossRef]
10. Y. Tang et al., “Change of phase state during multi-cycle injection and production process of condensate gas reservoir based underground gas storage,” Pet. Explor. Dev., vol. 48, no. 2, pp. 395–406, Apr. 2021. doi: 10.1016/S1876-3804(21)60031-9. [Google Scholar] [CrossRef]
11. A. G. Zhang, Z. F. Fan, and L. Zhao, “An investigation on phase behaviors and displacement mechanisms of gas injection in gas condensate reservoir,” Fuel, vol. 268, no. 2, pp. 117373, May 2020. doi: 10.1016/j.fuel.2020.117373. [Google Scholar] [CrossRef]
12. R. Barnum, F. Brinkman, T. Richardson, and A. Spillette, “Gas condensate reservoir behaviour: Productivity and recovery reduction due to condensation,” presented at the SPE Annu. Tech. Conf. Exhib., Dallas, TX, USA, Oct. 22–25, 1995. SPE-30767-MS. [Google Scholar]
13. P. Panja, R. Velasco, and M. Deo, “Understanding and modeling of gas-condensate flow in porous media,” Adv. Geo-Energy Res., vol. 4, no. 2, pp. 173–186, Apr. 2020. doi: 10.26804/ager.2020.02.06. [Google Scholar] [CrossRef]
14. Y. Yang, Z. Lun, R. Wang, M. Cui, and W. Hu, “A new model simulating the development of gas condensate reservoirs,” Energy Geosci., vol. 5, no. 1, pp. 100149, Jan. 2022. doi: 10.1016/j.engeos.2022.100149. [Google Scholar] [CrossRef]
15. D. Janiga, R. Czarnota, J. Stopa, P. Wojnarowski, and P. Kosowski, “Utilization of nature-inspired algorithms for gas condensate reservoir optimization,” Soft. Comput., vol. 23, no. 2019, pp. 5619–5631, May 2019. doi: 10.1007/s00500-018-3218-6. [Google Scholar] [CrossRef]
16. F. Alavi, D. Mowla, and F. Esmaeilzadeh, “Production performance analysis of Sarkhoon gas condensate reservoir,” J. Pet. Sci. Eng., vol. 75, no. 1–2, pp. 44–53, Dec. 2010. doi: 10.1016/j.petrol.2010.10.002. [Google Scholar] [CrossRef]
17. M. T. Sarvestani, F. Rashidi, and S. A. M. Dehghani, “A production data analysis model for gas/condensate reservoirs,” J. Pet. Sci. Eng., vol. 141, no. 2016, pp. 52–69, May 2016. doi: 10.1016/j.petrol.2016.01.016. [Google Scholar] [CrossRef]
18. R. Mokhtari, F. Varzandeh, and M. Rahimpour, “Well productivity in an Iranian gas-condensate reservoir: A case study,” J. Nat. Gas Sci. Eng., vol. 14, no. 2013, pp. 66–76, Sep. 2013. doi: 10.1016/j.jngse.2013.05.006. [Google Scholar] [CrossRef]
19. B. Moradi, J. Tangsirifard, M. R. Rasaei, A. M. Maklavani, and M. B. Bagheri, “Effect of gas recycling on the enhancement of condensate recovery in an Iranian fractured gas/condensate reservoir,” presented at the Trinidad and Tobago Energy Res. Conf., Port of Spain, Trinidad, Jun. 27–30, 2010. SPE-132840-MS. [Google Scholar]
20. A. Al-Shawaf, M. Kelkar, and M. Sharifi, “A new method to predict the performance of gas-condensate reservoirs,” SPE Reservoir Eval. Eng., vol. 17, no. 2, pp. 177–189, Jan. 2014. doi: 10.2118/161933-PA. [Google Scholar] [CrossRef]
21. M. Amani and N. T. Nguyen, “An overview of methods to mitigate condensate banking in retrograde gas reservoirs,” Adv. Pet. Explor. Dev., vol. 9, no. 2, pp. 1–6, Jun. 2015. doi: 10.3968/7023. [Google Scholar] [CrossRef]
22. H. Behmanesh, H. Hamdi, and C. R. Clarkson, “Production data analysis of tight gas condensate reservoirs,” J. Nat. Gas Sci. Eng., vol. 22, no. 2015, pp. 22–34, Jan. 2015. doi: 10.1016/j.jngse.2014.11.005. [Google Scholar] [CrossRef]
23. W. Liu, Y. Yang, C. Qiao, C. Liu, B. Lian and Q. Yuan, “Progress of seepage law and development technologies for shale condensate gas reservoirs,” Energies, vol. 16, no. 5, pp. 2446, Mar. 2023. doi: 10.3390/en16052446. [Google Scholar] [CrossRef]
24. Z. Gao, X. Luo, L. Zhang, Q. Cheng, and Y. He, “Numerical simulation of oil and gas two-phase flow in deep condensate gas reservoirs in bohai buried hills,” Open J. Appl. Sci., vol. 13, no. 11, pp. 2068–2079, Nov. 2023. doi: 10.4236/ojapps.2023.1311162. [Google Scholar] [CrossRef]
25. L. Zhang, W. Bu, N. Li, X. Tan, and Y. Liu, “Numerical simulation of multiarea seepage in deep condensate gas reservoirs with natural fractures,” Energies, vol. 16, no. 1, pp. 10, Dec. 2022. doi: 10.3390/en16010010. [Google Scholar] [CrossRef]
26. K. Long, Y. Tang, Y. He, Y. Wang, J. Qin and L. Tang, “Fluid phase behavior during multi-cycle injection and production of underground gas storage based on gas-condensate reservoirs with oil rim,” Geoenergy Sci. Eng., vol. 226, no. 2023, pp. 211769, Jul. 2023. doi: 10.1016/j.geoen.2023.211769. [Google Scholar] [CrossRef]
27. G. Gao et al., “Discussion on the reconstruction of medium/low-permeability gas reservoirs based on seepage characteristics,” Processes, vol. 10, no. 4, pp. 756, Apr. 2022. doi: 10.3390/pr10040756. [Google Scholar] [CrossRef]
28. M. Sheydaeemehr, B. Sedaeesola, and A. Vatani, “Gas-condensate production improvement using wettability alteration: A giant gas condensate field case study,” J. Nat. Gas Sci. Eng., vol. 21, no. 2014, pp. 201–208, Nov. 2014. doi: 10.1016/j.jngse.2014.07.011. [Google Scholar] [CrossRef]
29. G. D. Henderson, A. Danesh, and J. M. Peden, “An experimental investigation of waterflooding of gas condensate reservoirs and their subsequent blowdown,” J. Pet. Sci. Eng., vol. 8, no. 1, pp. 43–58, Jul. 1992. doi: 10.1016/0920-4105(92)90043-Z. [Google Scholar] [CrossRef]
30. T. Fishlock and C. Probert, “Waterflooding of gas-condensate reservoirs,” SPE Reserv. Eng., vol. 11, no. 4, pp. 245–251, Apr. 1996. doi: 10.2118/35370-PA. [Google Scholar] [CrossRef]
31. J. Narinesingh and D. Alexander, “CO2 enhanced gas recovery and geologic sequestration in condensate reservoir: A simulation study of the effects of injection pressure on condensate recovery from reservoir and CO2 storage efficiency,” Energy Proc., vol. 63, no. 2014, pp. 3107–3115, 2014. doi: 10.1016/j.egypro.2014.11.334. [Google Scholar] [CrossRef]
32. M. Nasiri Ghiri, H. R. Nasriani, M. Sinaei, S. H. Najibi, E. Nasriani and H. Parchami, “Gas injection for enhancement of condensate recovery in a gas condensate reservoir,” Energy Sour., Part A: Recov., Utilizat., Environ. Eff., vol. 37, no. 8, pp. 799–806, Mar. 2015. doi: 10.1080/15567036.2011.596901. [Google Scholar] [CrossRef]
33. Z. Su, Y. Tang, H. Ruan, Y. Wang, and X. Wei, “Experimental and modeling study of CO2-improved gas recovery in gas condensate reservoir,” Petroleum, vol. 3, no. 1, pp. 87–95, Mar. 2017. doi: 10.1016/j.petlm.2016.10.004. [Google Scholar] [CrossRef]
34. X. Meng, J. J. Sheng, and Y. Yu, “Experimental and numerical study of enhanced condensate recovery by gas injection in shale gas-condensate reservoirs,” SPE Reserv. Evaluat. Eng., vol. 20, no. 2, pp. 471–477, Jul. 2017. doi: 10.2118/183645-PA. [Google Scholar] [CrossRef]
35. E. Kostina, E. Iniakina, and V. Iniakin, “Phase transitions of gas-condensate systems with water availability under different conditions of experimental modeling,” in Tyumen 2019, Tyumen, Russia: European Association of Geoscientists & Engineers, vol. 2019, no. 1, pp. 1–6, Mar. 2019. doi: 10.3997/2214-4609.201900561. [Google Scholar] [CrossRef]
36. A. M. Elsharkawy, “Predicting the dew point pressure for gas condensate reservoirs: Empirical models and equations of state,” Fluid Phase Equilib., vol. 193, no. 1–2, pp. 147–165, Jan. 2002. doi: 10.1016/S0378-3812(01)00724-5. [Google Scholar] [CrossRef]
37. M. S. Abdallah, M. A. Al-Zawad, and M. L. FraimH, “Common misinterpretations of gas condensate reservoirs,” presented at the SPE Kingdom Saudi Arabia Annu. Tech. Symp. Exhib., Dammam, Saudi Arabia, Apr. 24–27, 2017. SPE-187995-MS. [Google Scholar]
38. X. L. Liu et al., “Study on characterization and distribution of four regions of tight sandstone condensate gas reservoirs in the depletion development process,” Fuel, vol. 358, no. 2024B, pp. 130267, Feb. 2024. doi: 10.1016/j.fuel.2023.130267. [Google Scholar] [CrossRef]
39. P. Ikpeka, N. Izuwa, and C. Omeh, “Compositional simulation of the effect of water injection on gas condensate reservoir performance,” J. Adv. Res. Petrol. Tech. Mgmt., vol. 5, no. 1, pp. 1–16, Jan. 2019. doi: 10.24321/2455.9180.201901. [Google Scholar] [CrossRef]
40. L. D. Sun, W. J. Song, and T. W. Jiang, “The development study on gas recycling injection in Yaha gas condensate field, Tarim Basin, China,” Sci. China Ser. D-Earth Sci., vol. 46, no. 1, pp. 561–568, Jun. 2003. doi: 10.1007/BF02984534. [Google Scholar] [CrossRef]
41. G. Coskuner and T. Strocen Bogdan, “Production optimization of liquid loading gas condensate wells: A case study,” J. Can. Pet. Technol., vol. 42, no. 11, pp. 11, Nov. 2003. doi: 10.2118/03-11-04. [Google Scholar] [CrossRef]
Cite This Article
 Copyright © 2024 The Author(s). Published by Tech Science Press.
This work is licensed under a Creative Commons Attribution 4.0 International License , which permits unrestricted use, distribution, and reproduction in any medium, provided the original work is properly cited.
 Downloads
 Citation Tools