
 Submit a Paper
 Propose a Special lssue
 Open Access
ARTICLE

Enhancing the Efficiency of Multi-Electrolyzer Clusters with Lye Mixer: Topology Design and Control Strategy
1 China Three Gorges Technology Co., Ltd., Beijing, 101199, China
2 Sichuan Energy Internet Research Institute, Tsinghua University, Chengdu, 610000, China
3 China Three Gorges Renewables (Group) Co., Ltd., Beijing, 101125, China
4 Ordos City Hanxia Renewables Co., Ltd., Ordos, 014300, China
* Corresponding Author: Huachi Xu. Email:
Energy Engineering 2024, 121(10), 3055-3074. https://doi.org/10.32604/ee.2024.051524
Received 07 March 2024; Accepted 16 May 2024; Issue published 11 September 2024
 View Full Text
 Download PDF
Abstract
The rise in hydrogen production powered by renewable energy is driving the field toward the adoption of systems comprising multiple alkaline water electrolyzers. These setups present various operational modes: independent operation and multi-electrolyzer parallelization, each with distinct advantages and challenges. This study introduces an innovative configuration that incorporates a mutual lye mixer among electrolyzers, establishing a weakly coupled system that combines the advantages of two modes. This approach enables efficient heat utilization for faster hot-startup and maintains heat conservation post-lye interconnection, while preserving the option for independent operation after decoupling. A specialized thermal exchange model is developed for this topology, according to the dynamics of the lye mixer. The study further details startup procedures and proposes optimized control strategies tailored to this structural design. Waste heat from the caustic fully heats up the multiple electrolyzers connected to the lye mixing system, enabling a rapid hot start to enhance the system’s ability to track renewable energy. A control strategy is established to reduce heat loss and increase startup speed, and the optimal valve openings of the diverter valve and the manifold valve are determined. Simulation results indicate a considerable enhancement in operational efficiency, marked by an 18.28% improvement in startup speed and a 6.11% reduction in startup energy consumption in multi-electrolyzer cluster systems, particularly when the systems are synchronized with photovoltaic energy sources. The findings represent a significant stride toward efficient and sustainable hydrogen production, offering a promising path for large-scale integration of renewable energy.Keywords
Nomenclature
| Heat generated by a stack over a unit time interval ( | |
| Heat required to heat the electrolyte, W | |
| Heat dissipation from the stack, W | |
| Thermal capacity of the stack, JK−1 | |
| Voltage of the stack, V | |
| Current of the stack, A | |
| Number of electrolytic cells, 1 | |
| Thermal neutralization voltage, V | |
| Ambient temperature, K | |
| Boltzmann constant, 1.38 × 10⁻²³m2 kg s−2K−1 | |
| Blackness, 1 | |
| Stack diameter, m | |
| Natural convection heat transfer coefficient, 1 | |
| Mass flow rate of lye, kgs−1 | |
| Specific heat capacity of lye, JK−1kg−1 | |
| Temperature of the lye input to the stack, K | |
| Heat brought by the electrolyte flowing through the cooler, W | |
| Heat taken away by the cooler, W | |
| Temperature of the mixed lye, K | |
| Temperature of the separator outlet, K | |
| Temperature of the lye flowing out of the mixer, K | |
| Flow rate of lye into the mixer, kgs−1 | |
| Flow rate of lye along the internal circulation, kgs−1 | |
| k | Opening degree of the divider valve, 1 |
| Heat brought in by the lye from each stack entering the mixer, W | |
| Heat dissipated by the mixer, W | |
| Heat taken away by the lye that flows out of the mixer to the stack, W | |
| Thermal resistance of mixer, KW−1 | |
| Heat brought in by the lye entering the separator, W | |
| Heat dissipated by the separator, W | |
| Heat carried away by the lye leaving the separator, W | |
| Heat carried away by the gas leaving the separator, W | |
| Heat required to heat up the supplied desalinated water, W | |
| Mass flow rate of H2, kgs−1 | |
| Mass flow rate of O2, kgs−1 | |
| Temperature of the desalination water, K | |
| Specific heat capacity of the desalination water, JK−1kg−1 | |
| Mass flow rate of water, kgs−1 | |
| ξ | The consumption of water electrolysis with a certain coefficient, 1 |
| Energy consumption when an electrolyzer is independently started, W | |
| Duration when an electrolyzer is independently started, min | |
| λ | Weighting factor of the startup time in the optimization target, 1 |
| Power of stack i, W | |
| Power supply by a photovoltaic (PV) source, W | |
| The first non-zero power point in the PV data, W |
In March 2022, the National Development and Reform Commission, along with the National Energy Administration of the People’s Republic of China, issued the “Medium and Long-Term Plan for the Development of the Hydrogen Energy Industry (2021–2035).” This plan delineates the strategic development of the hydrogen energy industry at a national level, setting a target to reach a renewable hydrogen production capacity of 100,000 to 200,000 tons annually by 2025 in China. By the first nine months of 2023, China had 57 green hydrogen projects operational, under construction, or awaiting approval [1]. Among these, notable successes include the successful trial runs of the Kuche Green Hydrogen Project by China Petrochemical Corporation and the Narisong Photovoltaic Hydrogen Demonstration Project by the China Three Gorges Corporation [2]. The current trend toward large-scale production of green hydrogen involves integrating water electrolyzers with renewable energy sources. However, this integration is limited by the fluctuating nature of renewable energy sources, necessitating advanced control strategies. Al-Sagheer et al. introduced a novel integration and control approach for water electrolyzers based on a model predictive control algorithm. This approach improves efficiency and hydrogen yield when directly coupled with renewable energy sources [3].
According to the current advancements in water electrolyzers, alkaline electrolysis stands out as the primary method for large-scale hydrogen production [4], owing to its maturity, cost-effectiveness, and operational stability [5]. The concept of clustered hydrogen production, utilizing multiple electrolyzers, is gaining prominence as a mainstream approach to overcome the limited production capacity of individual units [6].
Typically, a multi-electrolyzer cluster operates in two modes: stand-alone and integrated. The stand-alone mode is advantageous for its simplicity in equipment manufacturing and installation. The focus on cluster control strategies is to enhance operational performance within this structure. Various studies have contributed to this area: Shen et al. introduced a rotational control strategy to equalize electrolyzer usage, thereby extending lifespan and safety [7]. Fang et al. optimized start–stop cycles in alignment with wind power characteristics [8]. Varela et al. presented a mixed-integer linear scheduling model for operational efficiency [9]. Niu et al. enhanced electrolyzer array efficiency through segmented fuzzy control [10]. Qiu et al. dynamically adjusted startup, shutdown, and power distribution for improved photovoltaic (PV) and hydrogen production efficiency [11].
Compared with the stand-alone mode, the integrated operation mode of multi-electrolyzer clusters is increasingly preferred in the industry [12]. The choice of integration nodes significantly influences the operational performance of electrolyzers. Sharing hydrogen purification equipment, such as deoxidizer and dryer tanks, minimizes operational disruptions and reduces the balance of plant costs and footprint. However, despite this sharing, the internal environment of each electrolyzer system remains unchanged. Each system remains essentially independent and cannot further enhance cluster performance by utilizing the energy–matter interaction between cells. In contrast, a shared gas–liquid separator facilitates a strongly coupled operation mode, optimizing lye circulation for heat conservation. This setup offers advantages in scenarios such as startup phases and hot standby modes. Additionally, the gas production of a single unit can serve as a reference to ensure that the starting point of the overall hydrogen concentration in oxygen (HTO) is low. However, maintaining the pressure difference between the two sides of multiple slots through two valves when power fluctuates is challenging.
Both the strongly coupled and completely independent forms have their advantages and disadvantages. This paper presents a novel weakly coupled operation mode that requires minimal equipment modification. The transition between independent and coupled operations can be achieved through valve switching, enabling full utilization of energy–matter interaction while retaining the ability for decoupled and independent operation, thus combining the advantages of both forms. Moreover, it does not affect the pressure and liquid level of the separator equipped with the electrolyzer, ensuring efficient separator operation. A thermal model specific to this topology is established, and optimized startup procedures and control strategies are proposed. The system modeling and optimization solution for a three-stack system are completed, and the effects of topology and control strategy are verified.
2 Modeling and Application of Weakly Coupled Topology
The proposed weak coupling in the multi-electrolyzer cluster is achieved through the integration of a lye mixer connected to each electrolyzer. The addition of a lye mixer does not modify the original lye circulation system within individual electrolyzers, as illustrated in Fig. 1. The configuration of a single electrolyzer remains unchanged, encompassing the stack, separators, cooler, and piping. The lye mixing system comprises multiple divider valves, manifold valves, a mixer, and associated piping. The number of divider valves and confluence valves corresponds to the number of stacks, denoted as n. The lye exiting the separator is divided into two sections at the divider valve of the respective electrolyzer: one part enters the mixer, while the other continues through the pipe to the combiner valve. The lye from the mixer and the lye in the pipe are merged at the confluence valve before entering the cooler. Furthermore, the installation of lye pumps, crucial for maintaining the required lye flow rate and overcoming fluid resistance, is an essential consideration, although these pumps are not depicted in the provided figures.
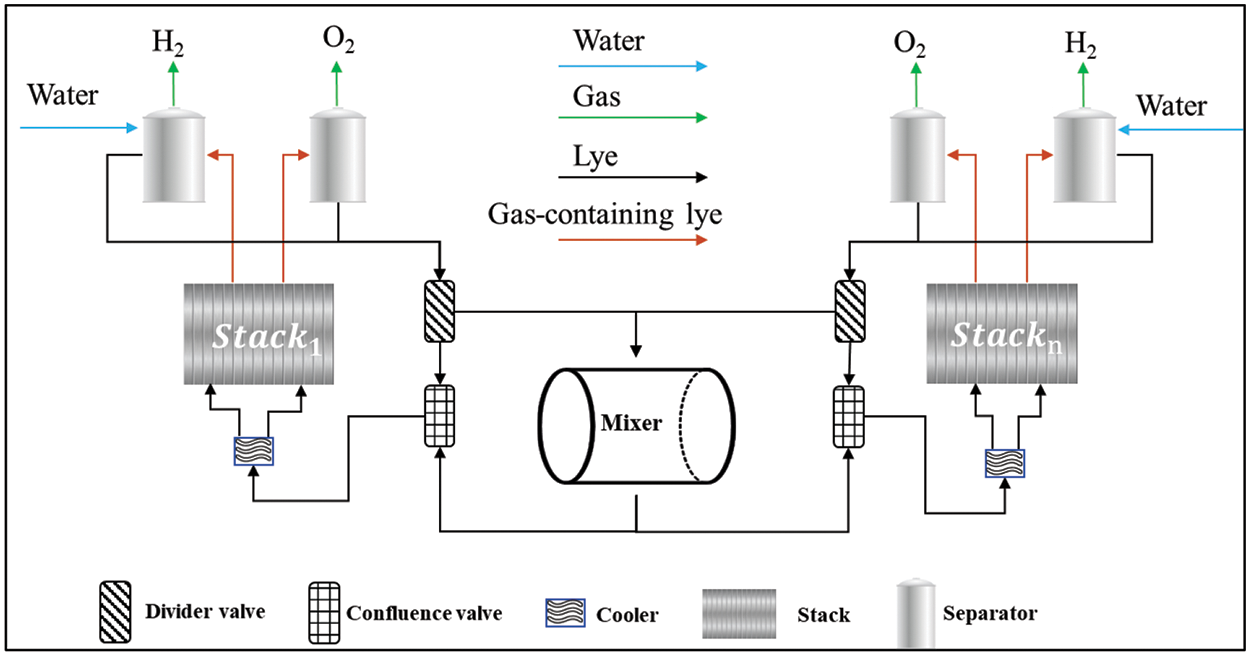
Figure 1: Weakly coupled topology considering lye mixer
The core of the lye mixing system is the mixer, which contains lye. Its volume needs to be designed according to the installed capacity and the amount of lye circulation; the larger the volume, the more lye reserves can be available for sharing. However, this also increases the demand for heat within the system.
2.2.1 Modeling of the Temperature Rise of the Stack
The temperature of the stack (
where
The formula for
where
where
The mass flow rate of lye, denoted by
2.2.2 Thermal Modeling of Cooler
With the assumption of no heat dissipation in the pipeline, the temperature at the outlet of the cooler is approximately
where
The
Eq. (7) presents the formula for calculating
where
2.2.3 Thermal Modeling of Lye Confluence
where
It is assumed that there is no heat loss in the pipeline from the separator outlet to the confluence valve. Thus,
where k represents the opening degree of the divider valve.
The flow rate of lye at the confluence value outlet should be equal to that of the separator outlet to maintain a constant volume of internal circulating lye within the stack. Therefore, the opening degree of the confluence valve varies with changes in the divider valve.
2.2.4 Thermal Modeling of Mixer
The temperature of the lye in the mixer,
where
The formula for calculating
The formula for calculating
where
The formula for calculating
2.2.5 Thermal Modeling of the Separator
The temperature of the lye at the outlet of the separator,
With the assumption that heat dissipation from the pipeline between the stack outlet and the separator is negligible and that the temperature of the lye at the inlet of the separator is still
The dissipation term
The formula for calculating
The formula for calculating
where
As water supplementation typically occurs in the separator on the hydrogen side,
The temperature of the desalination water is represented by
Water consumption primarily results from water electrolysis and the carrying away of water with the gas. This can be expressed by multiplying the consumption of water electrolysis by a certain coefficient ξ. The separator typically has upper and lower water level limits, and water supplementation is not continuous but initiated when the lower water level is reached. For simplicity, it is assumed that water supplementation occurs simultaneously with water consumption. Therefore, the mass flow rate of desalinated water is equivalent to the water consumption:
According to the given formulas, the temperature changes in major components can be calculated, as illustrated in Fig. 2. The temperature change of the stack is calculated in Section 2.2.1. Electrical energy that exceeds
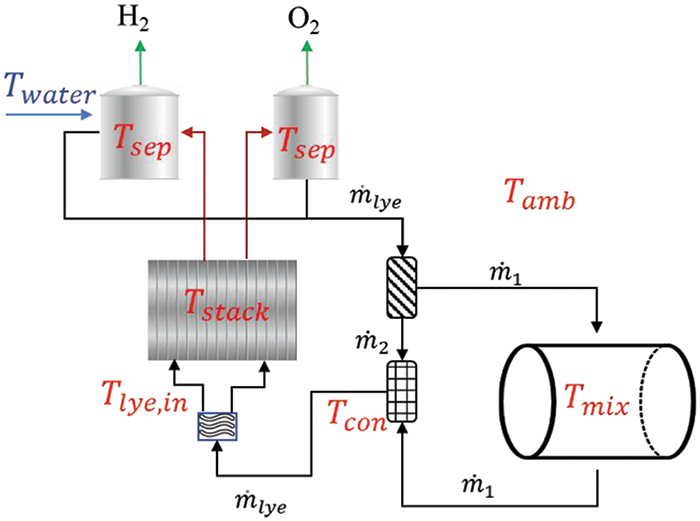
Figure 2: Schematic of the weakly coupled operation mode assisted by the lye mixer
Fig. 3 illustrates the startup process of a weakly coupled multi-electrolyzer cluster. Explanations for each step are provided below:
Step 1:
First, a stack with small capacity is chosen for the first startup to facilitate rapid heat generation and temperature rise. The flow directed to the mixer from stack a is regulated through the adjustment of the opening degrees of the divider and confluence valves. Considering that introducing the mixer lye into the internal circulation can reduce the heating rate of stack 1, valve adjustments are made in accordance with stack i’s startup requirements. Key startup goals for stack i include reaching the minimum operational load, ensuring output gas purity, attaining the minimum suitable temperature, reaching the rated gas production rate, achieving maximum rated power, and reaching optimal temperature. Further details are available in Section 4.1.
Step 2:
Assessing whether the operating pressure difference between stack i + 1 and the preset state of stack i meets the requirements is essential.
Step 3:
The heat quantity obtained from the mixer for stack i + 1 is determined by the opening degrees of its valve, calculated using the thermal models mentioned earlier. Stacks already in operation may increase or maintain power during this phase, to ensure their temperature does not drop below the levels prior to connection, while preheating stack i + 1.
Step 4:
The power of the operating stacks is adjusted according to temperature needs. If stack i + 1 is already operational (as per Step 2), its power is adjusted accordingly. If not, the valve is opened to a suitable degree to allow the mixer’s lye to heat stack i + 1 to the preset temperature and maintain insulation.
Step 5:
The initiation process for subsequent stacks depends on upstream power supply changes. Opening degree “k” and stack power “p” are used as control variables for optimal initiation sequencing.
Step 6:
To reduce the temperature of stacks at the upper operational limit, the circulation rate is increased to maximize the mixer lye’s cooling effect. If the temperature surpasses this limit, the electrolyzer’s cooling system is activated. Operational adjustments or shutdown of running stacks are executed based on demand. For complete process cessation, relevant valves are closed, and the stacks are disconnected from the mixer. In a hot standby state, the lye circulation rate and valve opening are adjusted to ensure the stack temperature remains within a predetermined range.
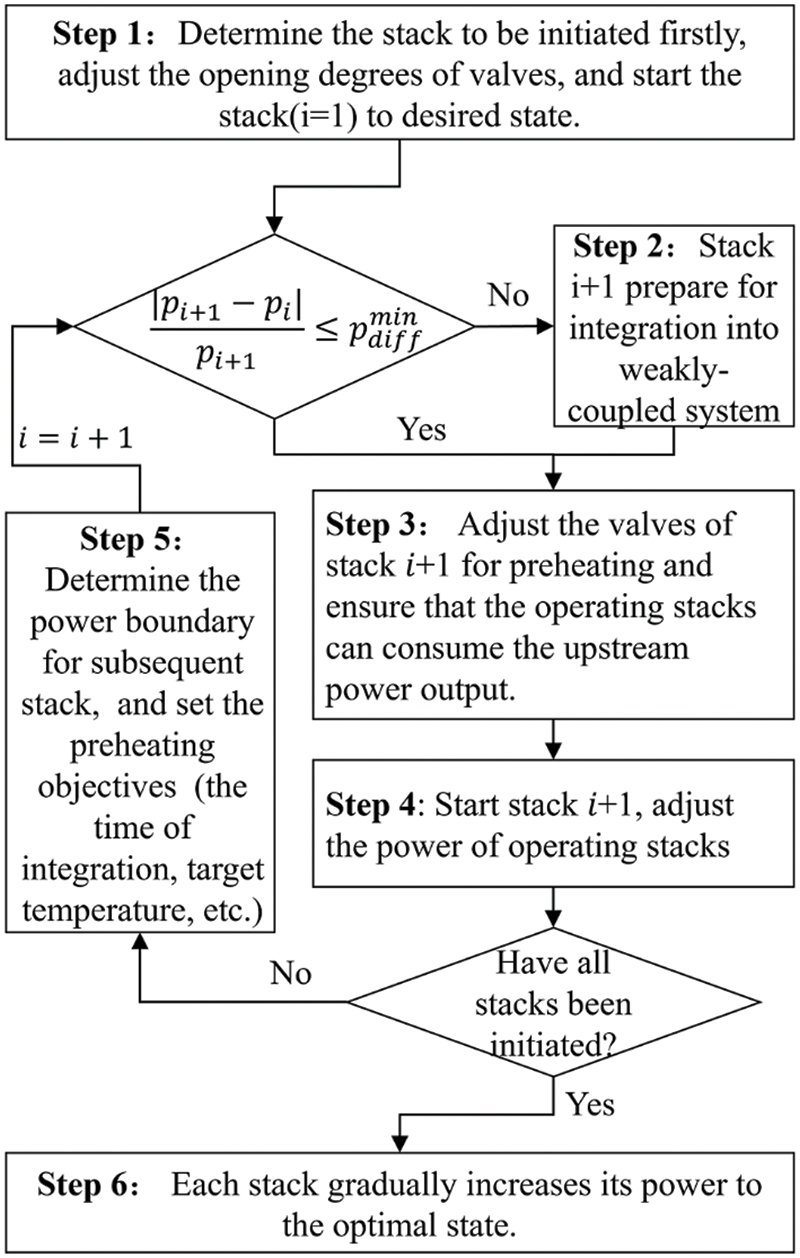
Figure 3: Startup process of multi-electrolyzer cluster
Efficiently managing heat consumption and enhancing the startup speed are pivotal for the optimal operation of a multi-electrolyzer cluster. However, efforts to minimize both startup energy consumption and the cumulative startup time can present conflicting objectives. To balance these goals, a specific function is defined:
Here,
System constraints include the following:
(1) Maximum temperature constraints:
At the upper temperature limit, control is exerted through heat exchange with the mixer and adjustment of the cooling water flow rate. In this state, k = 1 implies that the divider valve is fully open. If the temperature cannot be reduced below the limit,
(2) Power constraints:
where
(3) Energy constraints:
(4) Constraints on operational rationality:
These constraints prevent unfeasible solutions, such as sudden power reduction to zero in operational stacks or excessive heat sharing with other stacks, which are not permitted in practical scenarios.
Controlled variables in the simulation include valve openings and stack power:
where
Optimizing valve openings and power influences temperature variations as follows:
Here,
4.1 Electrolyzer Operational Characteristics
This subsection examines the operational characteristics of an alkaline electrolyzer under a constant voltage startup mode, as depicted in Fig. 4.
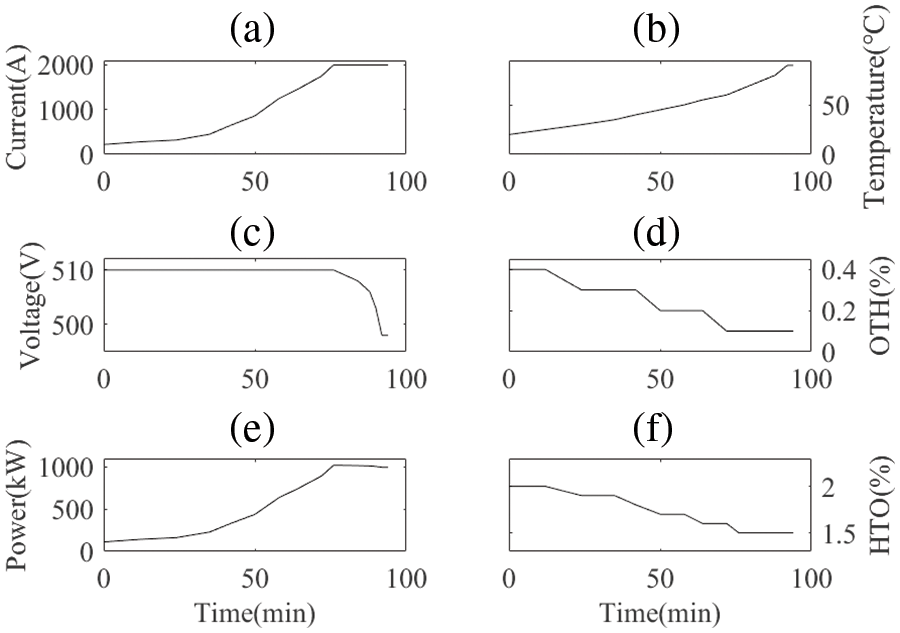
Figure 4: Data records of an electrolyzer during a practical startup process: (a) Current; (b) Temperature; (c) Voltage; (d) OTH; (e) Power; (f) HTO
Fig. 4 presents empirical data capturing key parameters during the startup phase of the electrolyzer, recorded at 5-min intervals. Initially, the electrolyzer operates under constant voltage, primarily utilizing electrical energy for heat generation. This leads to a progressive rise in lye temperature and a corresponding reduction in electrolyzer impedance. Once the desired lye temperature is reached, the power supply transitions from constant voltage to constant current mode. Notably, during startup, both hydrogen concentration in oxygen and oxygen concentration in hydrogen decrease in tandem with the increase in gas production.
The permissible current is restricted by the stack’s temperature. Exceeding this limit can lead to localized overheating and uneven thermal expansion, potentially resulting in thermal stress or damage to critical components. For instance, beyond a temperature threshold of 65°C, the recommended current is capped at 2000 A, which is the rated current of the electrolyzer. Fig. 5 reports actual test data from the manufacturer to illustrate this point. To derive recommended current values at other temperature points, a fifth-order polynomial curve fitting is employed.
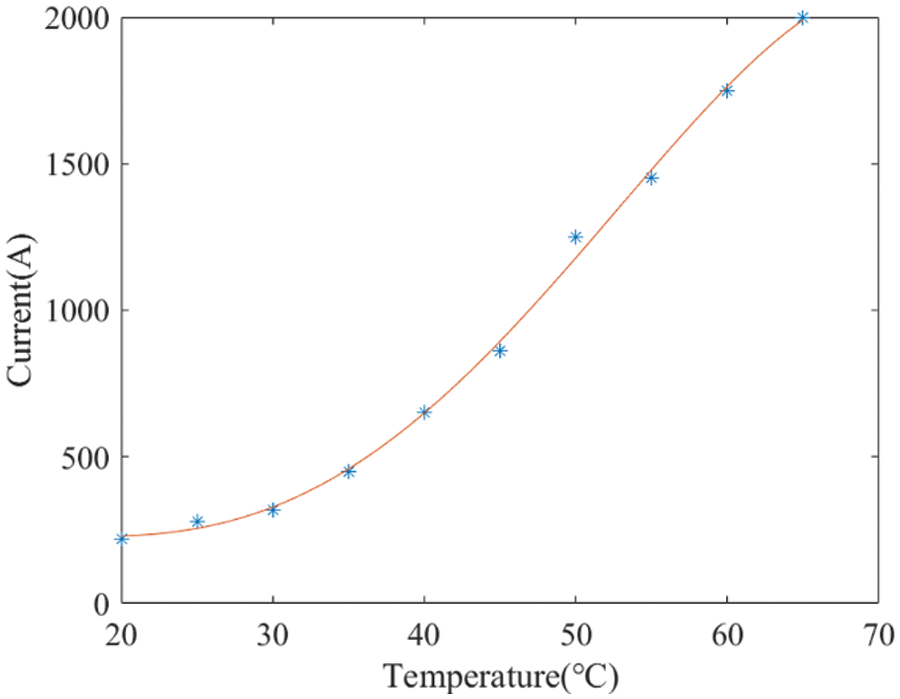
Figure 5: Relationship between the recommended current values and temperature
Furthermore, the stack’s resistance shows a strong correlation with temperature. As the stack temperature approaches the optimal level, a decrease in cell voltage is observed, leading to lower energy consumption [22]. This relationship is further elucidated in Fig. 6, which shows actual test data from the manufacturer. The operational power boundary of the stack at that temperature can be determined through the multiplication of the obtained voltage and current values at a given temperature.
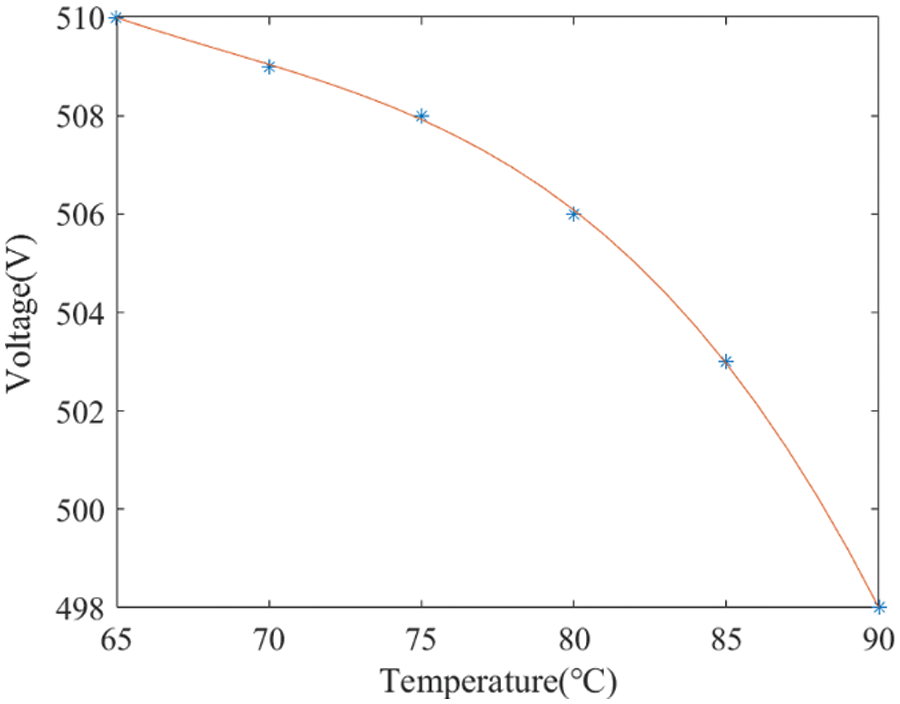
Figure 6: Relationship between the electrolyzer’s voltage and temperature
This subsection outlines the setup for a simulation scenario in a hydrogen production facility predominantly powered by PV sources, as illustrated in Fig. 7.
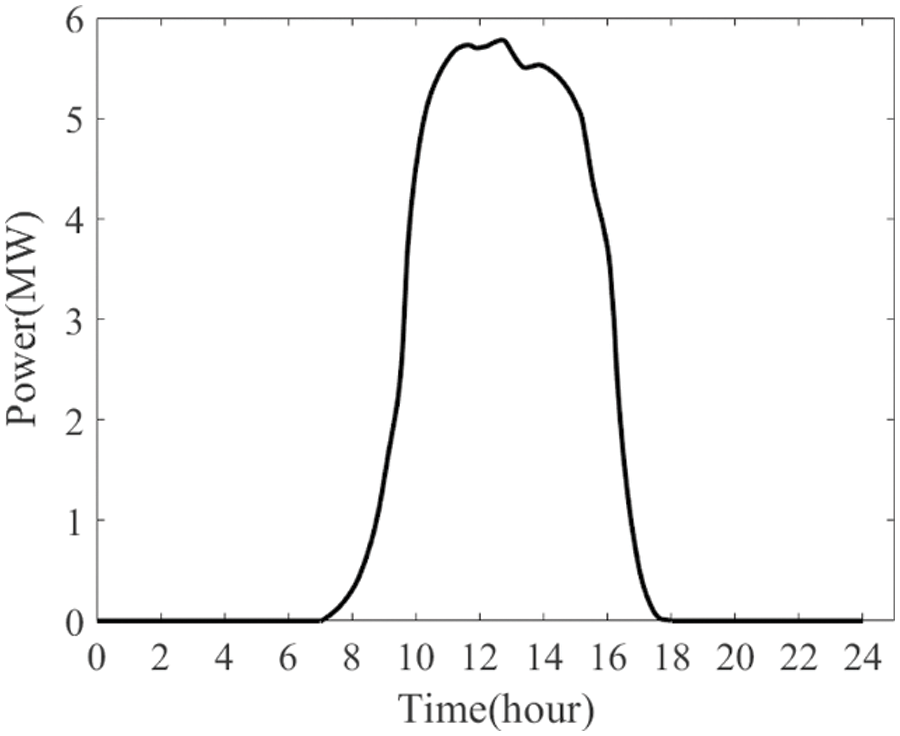
Figure 7: A typical PV profile throughout the day
Fig. 8 illustrates the gradual increase in PV power output during the morning hours. In the early morning, owing to limited PV power, simultaneously initiating multiple electrolyzers poses a challenge. The conventional method involves sequentially starting the electrolyzers in line with the increasing PV power. However, this approach has limitations: once the first stack (stack a) reaches its optimal operating temperature, any surplus heat is not fully utilized but rather dissipated via the cooling system. Additionally, the stacks that have not yet reached operating temperature are unable to handle sudden surges in input power, especially when the PV output increases sharply.
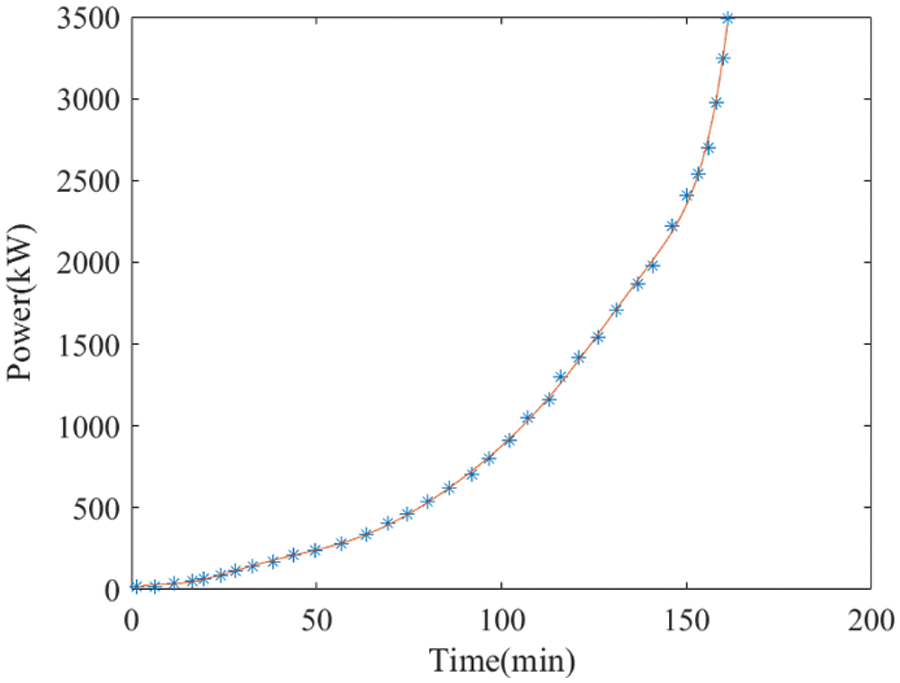
Figure 8: A typical PV profile in the morning
The objective of this case study is to effectively start up a multi-electrolyzer cluster in coordination with PV power dynamics. To achieve this, the parameter λ is set to 0.5, aiming to balance the reduction of cumulative startup duration and total energy consumption of the cluster. The simulation involves three electrolyzers, designated as stacks a, b, and c. Stack a initially warms the lye in the mixer using the generated heat. Subsequently, stack b is connected to the mixer for early preheating. Following successful startup, stacks a and b progressively increase their power in tandem with the rising PV output, concurrently facilitating the preheating of stack c. As the PV power output intensifies, all three stacks (a, b, and c) are configured to collectively track the PV variations.
The criterion for the successful startup of the multi-electrolyzer cluster is defined as the point where all stacks reach the optimal operational temperature of 90°C. This scenario aims to demonstrate the effectiveness of the proposed weakly coupled structure and control strategy in maximizing the use of available PV power while ensuring optimal operational conditions for each electrolyzer stack. Details about the parameters used in this simulation case are presented in Table 1.
The simulation’s initial conditions are set as follows:
All variable temperatures are initially set to
The simulation outcomes, showcasing temperature and power variations, are depicted in Figs. 9 and 10, following the sequence outlined in Fig. 3. The key stages of the process are:
1) Initialization: Both PV power input and stack a are initiated at minute 0.
2) Early Heating Phase (0–64 min): Stack a begins the startup process, simultaneously heating the lye mixer.
3) Connection of Stack b (64 min): At minute 64, stack b is linked to the mixer (indicated as Point A in Fig. 9).
4) Preheating of Stack b (64–101 min): During this interval, stack b absorbs heat from the mixer, gradually increasing its temperature.
5) Activation of Stack b (101 min): Stack b is activated at minute 101 (Point B in Fig. 9). The temperatures of stacks a and b are 56.3°C and 33.5°C, respectively.
6) Joint Heating Phase (101–129 min): Stacks a and b collectively utilize PV power to further heat the mixer.
7) Connection of Stack c (129 min): At minute 129, stack c is connected to the mixer (Point C in Fig. 9), with stacks a, b, and the mixer at 75.3°C, 61.9°C, and 63.9°C, respectively.
8) Ramping Up Power (129–141 min): Stacks a and b continue to follow PV input. Once the temperature of stack b exceeds 65°C, its power is maximized. Concurrently, stack c benefits from the mixer’s warmth.
9) Activation of Stack c (141 min): Stack c becomes operational at minute 141 (Point D in Fig. 9), as stacks a and b alone are insufficient for the rising PV power. At this point, temperatures are as follows: stacks a, b, c, and the mixer at 88.1°C, 71.12°C, 41.89°C, and 69.43°C, respectively.
10) Maximum Temperature of Stack a (144 min): At minute 144, stack a hits 90°C (Point E in Fig. 9). Valve adjustments are made to transfer excess heat to stack c, while stack a activates its cooling system.
11) Power Increase in Stack c (159 min): By minute 159, stack c’s temperature reaches 65°C (Point F in Fig. 9), allowing maximum power operation. All stacks consume PV power at peak capacity.
12) Optimal Temperature Achievement (168 min): At minute 168, stacks b and c attain the optimal temperature (Point G in Fig. 9), leading to the closure of valves and the activation of internal cooling systems for both stacks.
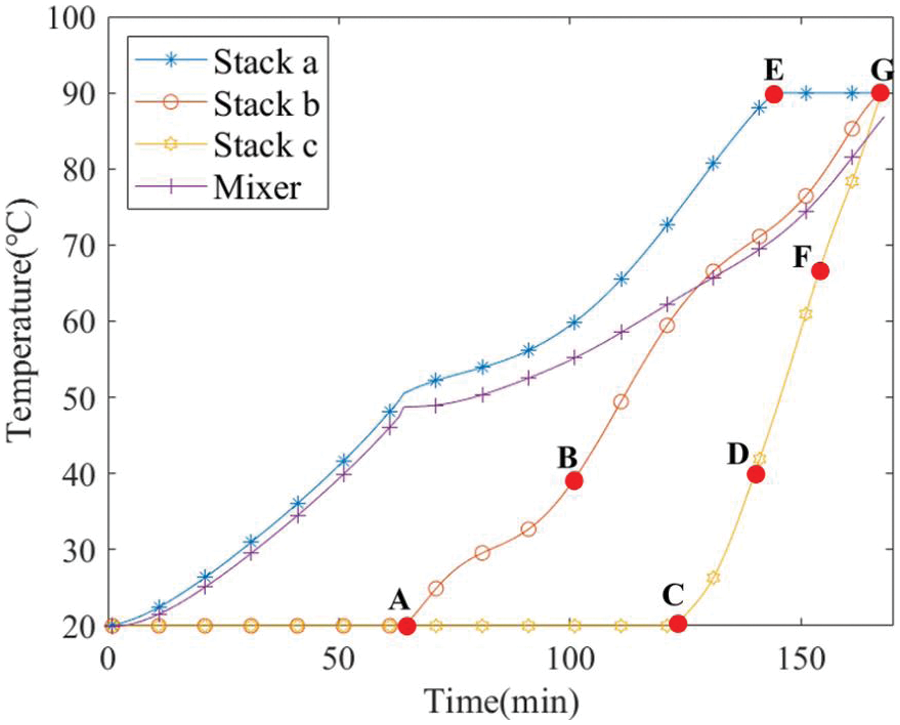
Figure 9: Temperature profiles for each stack and the mixer
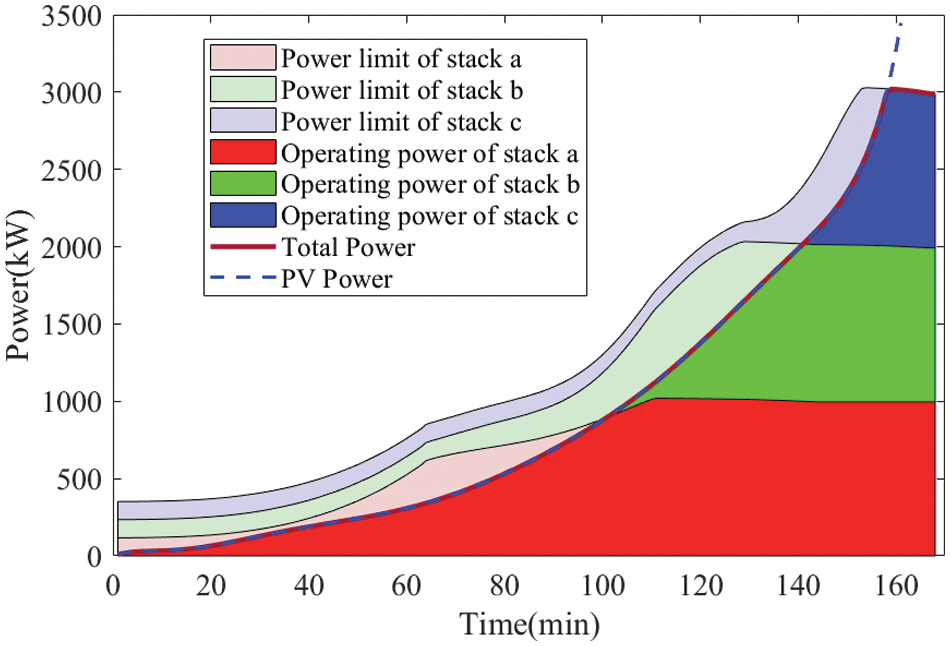
Figure 10: Power limitation boundaries and simulated operating powers for each stack under the new strategy
Each stack is preheated by the lye mixer, and the three electrolyzers begin heating up from their respective preheated temperatures (a = 20°C, b = 33.5°C, c = 41.89°C) to ensure that when the PV power increases rapidly, each electrolyzer can apply sufficient power within the temperature constraints.
For comparative analysis, the simulation was conducted using the topology of independent operation of multiple electrolyzers and the strategy of successive startup for each electrolyzer [25]. The result is shown in Fig. 11:
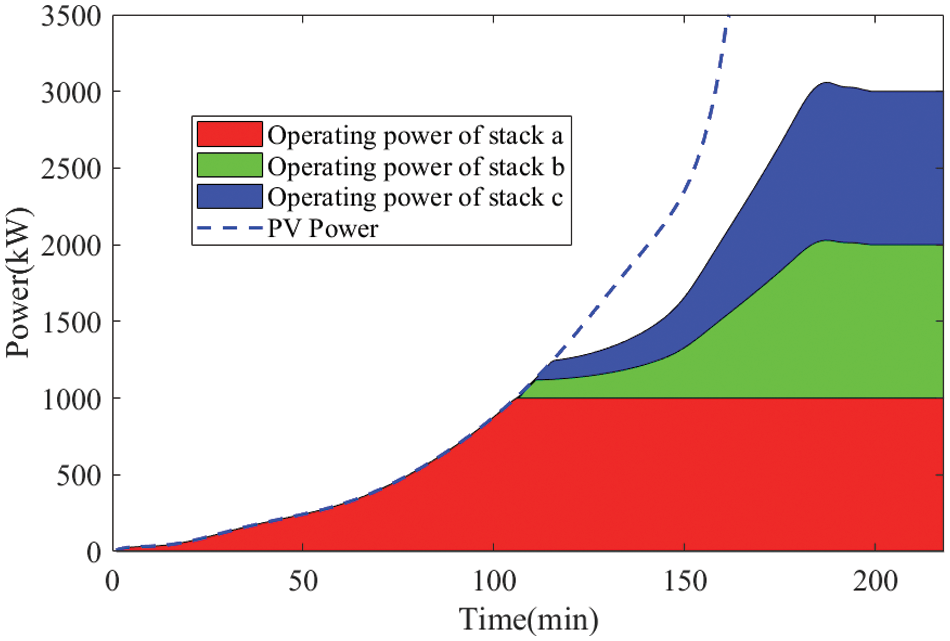
Figure 11: Simulated operating powers for each stack under the traditional strategy
Figs. 12 and 13 compare the energy consumption and cumulative startup time between the proposed new weakly coupled scheme and the traditional stand-alone startup approach. The weakly coupled method efficiently harnesses the modest and gradual PV power increase during the early morning hours to accumulate heat, facilitating the rapid startup of subsequent stacks. This strategy proves advantageous in adapting to swift PV power escalation. The simulation demonstrates that the proposed approach can reduce total energy consumption by 6.11% and shorten the cumulative startup time by 18.28%.
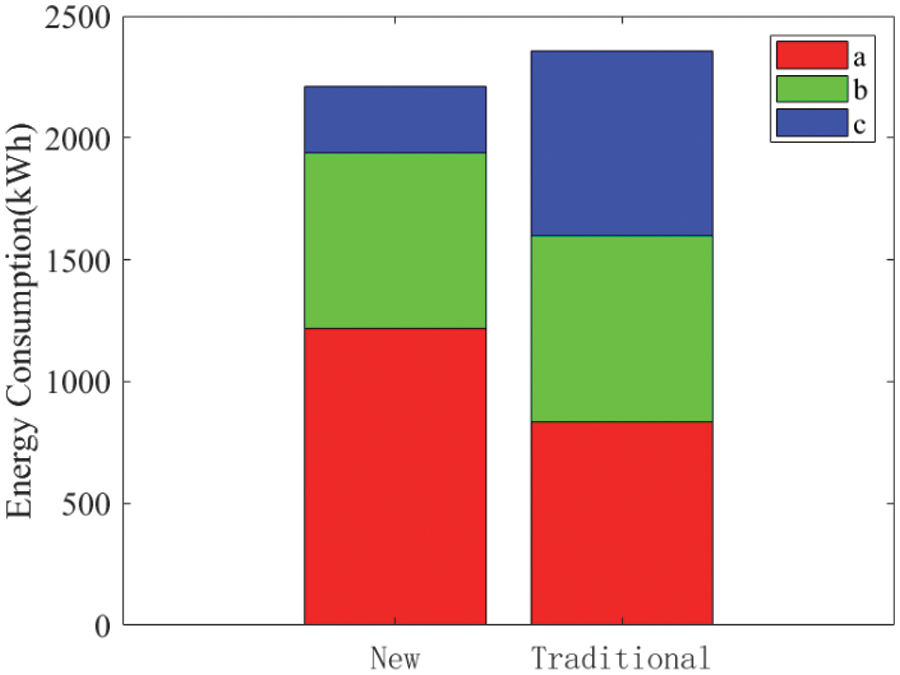
Figure 12: A comparison of energy consumption
Figure 13: A comparison of the cumulative startup time
Economic analysis and exergetic efficiency are important system performance indicators [26]. The exergetic efficiency of the startup process is defined as the ratio between the theoretical power consumption of effective hydrogen production and the power consumption of the entire startup process. According to the electrolyzer manufacturer’s operating manual, after the hydrogen-to-oxygen ratio is reduced to 1.8%, the hydrogen venting valve is closed, and the hydrogen is fed into the purification system, where effective hydrogen production is recorded. The test data show that for this electrolyzer, the minimum operating load that does not exceed the HTO constraint is 30%. The theoretical power consumption is 3.54 kWh/Nm3. The exergetic efficiency of independent startup is 62.38%. In the analyzed cases, stacks a, b, and c achieve efficiencies of 56.25%, 65.87%, and 73.33%, respectively, with an average of 65.15%. Stack a primarily relies on system heating during the initial stages of gradual PV power increase, maintaining a load below 30% for an extended period, resulting in lower exergetic efficiency. However, stacks b and c quickly exceed the minimum load requirement after preheating, leading to higher exergetic efficiency. Overall, by effectively utilizing waste heat from previously started stacks, subsequently started stacks can promptly produce effective hydrogen, contributing to an overall enhancement in system efficiency.
In terms of economy, transforming a 3-stack system into a weakly coupled topology requires adding three divider valves, three confluence valves, one mixer, and several pipelines, with an estimated material purchase and installation cost of $4800. Following installation, the fast startup advantage of the strategy outlined in this paper reduces the time for all three electrolyzers to reach the optimal operating temperature to 168 min, compared with the 199 min for the traditional sequential start–stop method. Within the 199-min timeframe after the PV system begins outputting, the effective hydrogen production capacity increases by 86.53 Nm3. This increase results from two factors: efficient power consumption due to effective PV tracking, and earlier closure of venting valves in stacks b and c to achieve effective hydrogen production. At a selling price of $0.3 per Nm3, the cost of the lye mixing system will be recovered after 186 days, with future hydrogen production yielding additional income.
Hydrogen production through multi-electrolyzer clusters is central to large-scale renewable energy hydrogen production, and the topology design and control of clusters are crucial. However, the traditional stand-alone operation does not fully utilize waste heat from previously started stacks, and sharing the separator increases challenges in safety and stability control. To address this, the paper undertakes the following initiatives:
1) Innovative Weakly Coupled Topology: A novel weakly coupled multi-electrolyzer topology that facilitates heat exchange among stacks via a lye mixer is introduced. The operational temperature of each stack is adjustable through the manipulation of the divider and confluence valves. Notably, this topology enables decoupled operation by closing these valves, thus isolating any malfunctioning stack without disrupting the overall functionality of the cluster.
2) Enhanced Startup Process: The proposed topology is optimized for rapid startup, achieved through strategic preheating and effective heat conservation. This approach significantly reduces total energy consumption and shortens the cumulative startup time for the multi-electrolyzer cluster.
3) Optimized Control Strategy and Thermal Model: An advanced control strategy, complemented by a thermal model that incorporates the dynamics of the lye mixer, is developed for the startup process. The validity and effectiveness of this model are demonstrated through simulations based on typical daily PV output power curves.
Despite the contributions of this paper, there are a few areas that need further investigation:
1) Optimization of Objective Function Weighting: Future research could focus on identifying the ideal weighting configuration for the objective function to accommodate diverse upstream power supplies effectively.
2) Adaptation to Diverse Operational Scenarios: Further research could focus on developing optimization strategies tailored to electrolyzer stacks with different manufacturers or operational characteristics, such as varying startup sequences and mixer capacities.
Acknowledgement: The authors acknowledge the reviewers for providing valuable comments and helpful suggestions to improve the manuscript. Special thanks to the manufacturer for providing the experimental electrolyzer, and to the operators of the Narisong hydrogen production test platform for their assistance during experimentation.
Funding Statement: This work was supported by the Key Technology Research and Application Demonstration Project for Large-Scale Multi-Scenario Water Electrolysis Hydrogen Production (CTGTC/2023-LQ-06).
Author Contributions: The authors contributed to the paper as follows: study conception and design: M. Chen, H. Xu; data collection: J. Jia, M. Ji, H. Xu, W. Wang, D. Li; analysis and interpretation of results: B. Zhang, L. Han, Z. Yu, J. Jia, M. Chen; drafting of the manuscript: M. Chen, J. Jun, B. Zhang, D. Li, W. Wang, Z. Yu. All authors reviewed the results and approved the final version of the manuscript.
Availability of Data and Materials: The data supporting the findings of this study are available from the corresponding author upon reasonable request.
Ethics Approval: Not applicable.
Conflicts of Interest: The authors declare that they have no conflicts of interest to report regarding the present study.
References
1. Global Times, “China’s green hydrogen investment tops 300 billion yuan in first nine months, leading the world,” 2023. Accessed: Mar. 30, 2024. [Online]. Available: https://www.globaltimes.cn/page/202311/1302162.shtml [Google Scholar]
2. S&P Global, “Two green hydrogen projects totaling 30,000 mt/year of capacity start up in China,” 2023. Accessed: Mar. 30, 2024. [Online]. Available: https://www.spglobal.com/commodityinsights/en/market-insights/latest-news/energy-transition/063023-two-green-hydrogen-projects-totaling-30000-mtyear-of-capacity-start-up-in-china [Google Scholar]
3. Y. Al-Sagheer and R. Steinberger-Wilckens, “Novel control approach for integrating water electrolyzers to renewable energy sources,” Fuel Cells, vol. 22, no. 6, pp. 290–300, 2022. doi: 10.1002/fuce.202200066. [Google Scholar] [CrossRef]
4. B. Melzi, N. Kefif, M. E. H. Assad, H. Delnava, and A. Hamid, “Modelling and optimal design of hybrid power system photovoltaic/solid oxide fuel cell for a mediterranean city,” Energy Eng., vol. 118, no. 6, pp. 1767–1781, 2021. doi: 10.32604/EE.2021.017270. [Google Scholar] [CrossRef]
5. J. Li et al., “Modeling of large-scale hydrogen storage system considering capacity attenuation and analysis of its efficiency characteristics,” Energy Eng., vol. 121, no. 2, pp. 291–313, Jan. 25, 2024. doi: 10.32604/ee.2023.027593. [Google Scholar] [CrossRef]
6. Y. Li et al., “Comprehensive review and prospect of the modeling of alkaline water electrolysis system for hydrogen production,” Auto. Eng., vol. 44, no. 4, pp. 567–582, Apr. 25, 2022. doi: 10.19562/j.chinasae.qcgc.2022.04.012. [Google Scholar] [CrossRef]
7. X. Shen, C. Nie, and H. Lü, “Coordination control strategy of wind power-hydrogen alkaline electrolyzer bank considering electrothermal characteristics,” (in Chinese), Trans. China Electrotechnical Soc., vol. 36, no. 3, pp. 463–472, 2021. doi: 10.19595/j.cnki.1000-6753.tces.200283. [Google Scholar] [CrossRef]
8. R. Fang and Y. Liang, “Control strategy of electrolyzer in a wind-hydrogen system considering the constraints of switching times,” Int. J. Hydrogen Energy, vol. 44, no. 46, pp. 25104–25111, Sep. 27, 2019. doi: 10.1016/j.ijhydene.2019.03.033. [Google Scholar] [CrossRef]
9. C. Varela, M. Mostafa, and E. Zondervan, “Modeling alkaline water electrolysis for power-to-x applications: A scheduling approach,” Int. J. Hydrogen Energy, vol. 46, no. 14, pp. 9303–9313, Feb. 24, 2021. doi: 10.1016/j.ijhydene.2020.12.111. [Google Scholar] [CrossRef]
10. M. Niu, Z. Hong, B. Li, and X. Li, “Optimal control strategy of wind power to hydrogen system considering electrolyzer efficiency improvement,” (in Chinese), Acta Energiae Solaris Sinica, vol. 44, no. 9, pp. 366–376, 2023. doi: 10.19912/j.0254-0096.tynxb.2022-0751. [Google Scholar] [CrossRef]
11. Y. Qiu, C. Wu, T. Zang, B. Zhou, Y. Zhou and J. Zhu, “Optimal scheduling of multi-electrolyzer power-to-hydrogen clusters considering the temporal uncertainty of photovoltaic power,” Electric Power Construction, vol. 44, no. 9, pp. 108–117, 2023. doi: 10.12204/j.issn.1000-7229.2023.09.010. [Google Scholar] [CrossRef]
12. C. Yang, J. Ma, G. Li, X. Zhao, and Y. Gu, “Application and practice of many-to-one large-scale alkaline water electrolysis hydrogen production equipment,” (in Chinese), Sol. Energy, vol. 5, pp. 103–114, 2022. [Google Scholar]
13. Z. Ren, J. Wang, Z. Yu, C. Zhang, S. Gao and P. Wang, “Experimental studies and modeling of a 250-kW alkaline water electrolyzer for hydrogen production,” J. Power Sources, vol. 544, pp. 231886, 2022. doi: 10.1016/j.jpowsour.2022.231886. [Google Scholar] [CrossRef]
14. R. Qi et al., “Thermal modeling and controller design of an alkaline electrolysis system under dynamic operating conditions,” Appl. Energy, vol. 332, pp. 120551, Feb. 15, 2023. doi: 10.1016/j.apenergy.2022.120551. [Google Scholar] [CrossRef]
15. H. Kojima, T. Matsuda, H. Matsumoto, and T. Tsujimura, “Development of dynamic simulator of alkaline water electrolyzer for optimizing renewable energy systems,” J. Int. Counc. Electr. Eng., vol. 8, no. 1, pp. 19–24, 2018. doi: 10.1080/22348972.2018.1436931. [Google Scholar] [CrossRef]
16. T. Adibi, A. Sojoudi, and S. Saha, “Modeling of thermal performance of a commercial alkaline electrolyzer supplied with various electrical currents,” Int. J. Thermofluids, vol. 13, pp. 100126, 2021. doi: 10.1016/j.ijft.2021.100126 [Google Scholar] [CrossRef]
17. P. M. Dieguez, A. Ursua, P. Sanchis, C. Sopena, L. M. Gandia and E. Guelbenzu, “Thermal performance of a commercial alkaline water electrolyzer: Experimental study and mathematical modeling,” Int. J. Hydrogen Energy, vol. 33, no. 24, pp. 7338–7354, Dec. 15, 2008. doi: 10.1016/j.ijhydene.2008.09.051. [Google Scholar] [CrossRef]
18. S. Ding et al., “Experimental and modeling study on energy flow of 250 kW alkaline water electrolysis system under steady state conditions and cold start process,” Fuel, vol. 350, pp. 128799, 2023. doi: 10.1016/j.fuel.2023.128799. [Google Scholar] [CrossRef]
19. M. Rizwan, V. Alstad, and J. Jäschke, “Design considerations for industrial water electrolyzer plants,” Int. J. Hydrogen Energy, vol. 46, no. 75, pp. 37120–37136, Oct. 29, 2021. doi: 10.1016/j.ijhydene.2021.09.018. [Google Scholar] [CrossRef]
20. R. Qi et al., “Design of the PID temperature controller for an alkaline electrolysis system with time delays,” Int. J. Hydrogen Energy, vol. 48, no. 50, pp. 19008–19021, 2023. doi: 10.1016/j.ijhydene.2023.01.356. [Google Scholar] [CrossRef]
21. W. Xiao et al., “State of health estimation framework of li-on battery based on improved gaussian process regression for real car data,” IOP Conf. Ser.: Mater. Sci. Eng., vol. 793, no. 1, pp. 012063, Mar. 01, 2020. doi: 10.1088/1757-899X/793/1/012063. [Google Scholar] [CrossRef]
22. Z. Abdin, C. J. Webb, and E. M. Gray, “Modelling and simulation of an alkaline electrolyser cell,” Energy, vol. 138, pp. 316–331, Nov. 01, 2017. doi: 10.1016/j.energy.2017.07.053. [Google Scholar] [CrossRef]
23. S. Hu et al., “A comprehensive review of alkaline water electrolysis mathematical modeling,” Appl. Energy, vol. 327, pp. 120099, Dec. 01, 2022. doi: 10.1016/j.apenergy.2022.120099. [Google Scholar] [CrossRef]
24. X. Qiu et al., “Dynamic parameter estimation of the alkaline electrolysis system combining Bayesian inference and adaptive polynomial surrogate models,” Appl. Energy, vol. 348, pp. 121533, Oct. 2023. doi: 10.1016/j.apenergy.2023.121533. [Google Scholar] [CrossRef]
25. T. Zhang, L. Song, F. Yang, and Y. Li, “Study on configuration and control strategy of electrolyzers in off-grid wind hydrogen system,” in Proc. 10th Hydrogen Technol. Convent., Singapore, Springer Nature, 2024, vol. 1, pp. 364–369. [Google Scholar]
26. H. Qi et al., “Conceptual design and comprehensive analysis for novel municipal sludge gasification-based hydrogen production via plasma gasifier,” Energy Convers. Manag., vol. 245, pp. 114635, Oct. 01, 2021. doi: 10.1016/j.enconman.2021.114635. [Google Scholar] [CrossRef]
Cite This Article
 Copyright © 2024 The Author(s). Published by Tech Science Press.
This work is licensed under a Creative Commons Attribution 4.0 International License , which permits unrestricted use, distribution, and reproduction in any medium, provided the original work is properly cited.
 Downloads
 Citation Tools