
 Submit a Paper
 Propose a Special lssue
 Open Access
ARTICLE

EV Charging Station Load Prediction in Coupled Urban Transportation and Distribution Networks
School of Electrical Engineering, Northeast Electric Power University, Jilin, 132012, China
* Corresponding Author: Benxin Li. Email:
Energy Engineering 2024, 121(10), 3001-3018. https://doi.org/10.32604/ee.2024.051332
Received 02 March 2024; Accepted 13 May 2024; Issue published 11 September 2024
 View Full Text
 Download PDF
Abstract
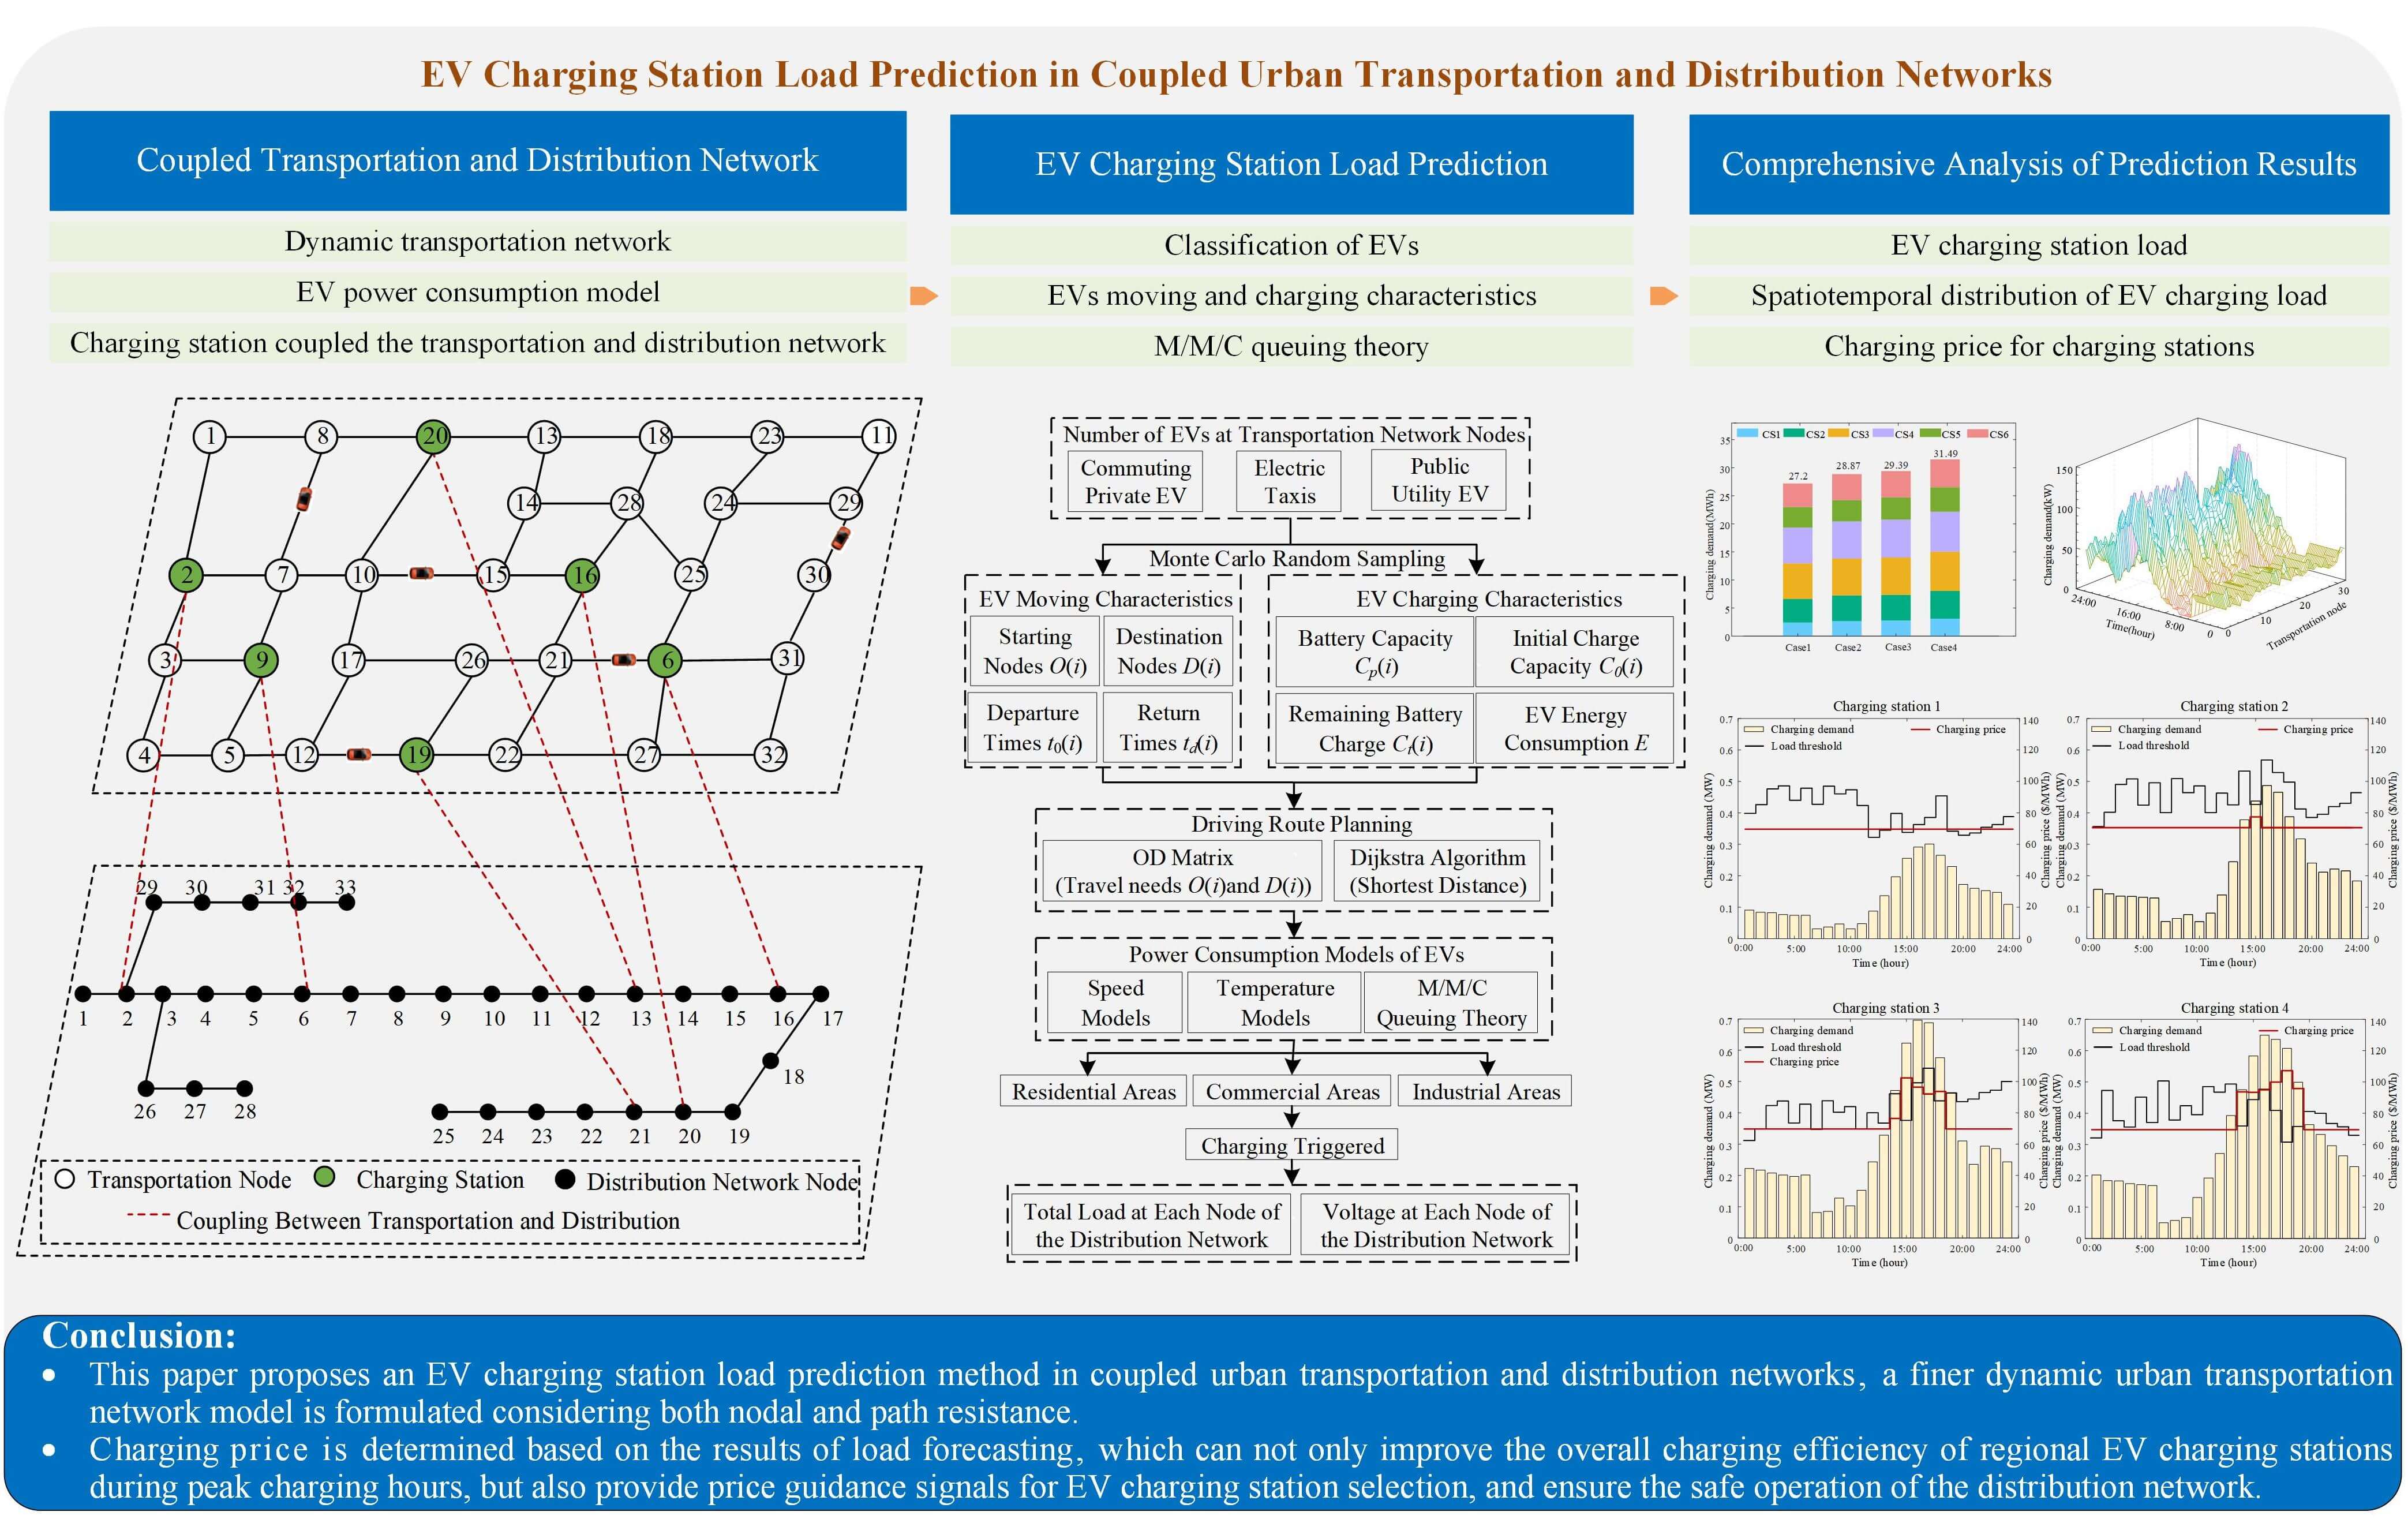
The increasingly large number of electric vehicles (EVs) has resulted in a growing concern for EV charging station load prediction for the purpose of comprehensively evaluating the influence of the charging load on distribution networks. To address this issue, an EV charging station load prediction method is proposed in coupled urban transportation and distribution networks. Firstly, a finer dynamic urban transportation network model is formulated considering both nodal and path resistance. Then, a finer EV power consumption model is proposed by considering the influence of traffic congestion and ambient temperature. Thirdly, the Monte Carlo method is applied to predict the distribution of EV charging station load based on the proposed dynamic urban transportation network model and finer EV power consumption model. Moreover, a dynamic charging pricing scheme for EVs is devised based on the EV charging station load requirements and the maximum thresholds to ensure the security operation of distribution networks. Finally, the validity of the proposed dynamic urban transportation model was verified by accurately estimating five sets of test data on travel time by contrast with the BPR model. The five groups of travel time prediction results showed that the average absolute percentage errors could be improved from 32.87% to 37.21% compared to the BPR model. Additionally, the effectiveness of the proposed EV charging station load prediction method was demonstrated by four case studies in which the prediction of EV charging load was improved from 27.2 to 31.49 MWh by considering the influence of ambient temperature and speed on power energy consumption.Graphic Abstract
Keywords
Nomenclature
| G | Transportation network |
| N, L | Set of nodes and links in the transportation network |
| W | Set of weights for links |
| H | Set of time intervals |
| Ci(t), Rij(t) | Nodal and link resistance in the transportation network |
| Free-flow travel time for link nij without congestion | |
| Sij | Saturation of link nij |
| α, β | The coefficient of resistance model |
| c | Signal period of each intersection in the transportation network |
| λ | Green time rate of each intersection in the transportation network |
| q | Vehicles arrival rate |
| Charging load of ith vehicle at node n | |
| rk | Number of EVs at node k |
| Charging load for the kth charging station at time t | |
| v0 | Free-flow speed of vehicles |
| Cij | Capacity of the link nij |
| qij(t) | Transportation flow of link nij at time t |
| χ | Empirical coefficient |
| a, b, γ | The coefficients for different link levels |
| Heating and cooling temperature threshold to commit the air conditioner | |
| WR, WL | Heating and cooling power of the air conditioner |
| E | Power consumption per kilometer |
| FTp | Power consumption per kilometer at ambient temperature of Tp |
| Lij | Length of link nij |
| Ltd | Distance from the current location to the destination |
| Battery capacity of the ith EV | |
| αt, βt | Gamma distribution parameters |
| to(i), td(i) | Departure and return time of the ith vehicle |
| O(i), D(i) | Origin and destination of the ith vehicle |
| LOD | Length of O-D pairs |
| Ct(i), Cl(i), C0(i) | Remaining, capacity and initial battery charge of the ith vehicle |
| Tf (i) | End time of charging for ith vehicle |
| ψ, μ | Number of EVs receiving charging service and customers per unit time |
| g | Number of chargers in the charging station |
| ρ | Service intensity of the charger |
| ε | Number of EVs going to the charging station for service per unit time |
| The threshold of charging station k at time t | |
| n(k) | Distribution network node coupled with charging station k |
| ζn | Normal charging price |
| η | The penalty coefficient of charging price |
With the large integration of wind and photovoltaic power generations into power systems, the adoption of EVs is growing substantially to reduce environmental pollution and carbon dioxide emissions in transportation systems. By the end of 2023, the stock of EVs in China has reached 20.4 million [1], and the gradual replacement of traditional gasoline vehicles by EVs will become an irreversible trend [2]. As a mobile power load [3,4], the widespread promotion of EVs will have a significant influence on the operation of the distribution network along with the urban transportation network [5–7]. If EVs are charging at fast charging stations without coordination, it will not only invoke security problems such as voltage deviation or line thermal stability damage issues but also easily cause transportation network congestion. In addition, EVs can be dispatched and guided through charging price signals as flexible resources [8,9]. To mitigate the negative impact of EVs on the operation of urban distribution networks and transportation networks, it is urgently necessary to accurately predict the spatiotemporal distribution of EV charging demand for designing fast charging stations [10] and optimizing charging price strategy to ensure the safe operation of the distribution network.
The increasing adoption of EVs has attracted a growing concern for EV charging load prediction. In [11], the load of the EV charging station is calculated based on the probability distribution with statistical data. In [12], the EV charging station load is predicted based on the copula function. In [13], the EV charging load prediction method is developed to coexist with slow charging mode, fast charging mode, and battery exchange mode. However, the above literatures leave the coupled transportation and distribution network out of consideration, and it is difficult to obtain the spatial distribution of the EV charging load. To describe the dynamic characteristic of EVs in transportation networks, the Markov chain is utilized to estimate EV travel time on routings in [14]. In [15], the dynamic moving behavior of EVs is characterized based on random trip chains and Markov decision processes, and the spatiotemporal distribution of EV charging load is simulated using a coupled transportation and distribution network model. Literature [16] applies the BPR speed-flow model to formulate the dynamic characteristics of transportation networks. However, it fails to consider the delay effects caused by urban nodal resistance in traffic light intersections. Literature [17] predicts EV charging station load distribution based on information such as trip distance, vehicle speed, charging waiting time, nodal load deviation, etc. However, it does not consider the effect of vehicle speed on the power consumption. To address this issue, literature [18] estimates the vehicle speed and power consumption under a given trip based on Monte Carlo simulation and mathematical statistical analysis methods. In [19], the influences of EV charging willingness and moving characteristics on power consumption and charging load are considered to predict the spatiotemporal distribution of EV charging load. Literature [20] proposes a spatiotemporal distribution model for EV charging loads considering urban functional areas and the effects of temperature. The above literatures mainly focus on private EVs and lack a comprehensive study of the charging behaviors of other groups, such as taxis and other public utility EVs.
To assess the impact of EV type and the dynamic nature of transportation networks on charging station loads, this paper proposes an EV charging station load prediction method in coupled urban transportation and distribution networks. Firstly, a finer dynamic urban transportation network model is formulated by considering nodal and path resistance. Then, the O-D pairs and Dijkstra algorithm are introduced to allocate initial distribution and optimal routing policy for EVs. Moreover, the finer EV power energy consumption model is formulated by taking the influence of traffic congestion and ambient temperature into consideration. The Monte Carlo method is applied to predict the distribution of EV charging demands, together with EV charging station load, through the coupled transportation and distribution networks. Finally, a dynamic charging pricing scheme for EVs is devised based on the charging station demand requirements and the maximum thresholds to ensure the security operation of distribution networks.
The major contributions of this paper are given as follows:
1) An EV charging station load prediction method is proposed with the finer coupled dynamic transportation network and distribution network.
2) The influence of traffic congestion and environment temperature on EV power consumption is comprehensively formulated which significantly improves the accuracy of the charging station load prediction in urban transportation and distribution networks.
3) A dynamic pricing strategy for EVs is developed by comparing charging demand requirements and the maximum thresholds to ensure the security operation of the distribution network and guide the orderly charging of EVs.
The rest of the paper is organized as follows. Section 2 describes the coupling model of vehicles, transportation and distribution networks. Section 3 proposes the model for nodal charging demand estimation. A dynamic pricing strategy is provided in Section 4. Section 5 illustrates the validity and accuracy of the proposed method through case studies. The conclusion drawn from the study is provided in Section 6.
2 Formulation of Coupled Transportation and Distribution Networks
EVs can be used as transportation means in transportation network and mobile electric loads in distribution network. The optimal routing policy between Origin-Destination (O-D) pairs depends on transportation network topology and traffic congestion, which in turn affects the selection of charging stations for EVs. Similarly, the selection of charging stations will affect the power load distribution, which could invoke security issues such as the bus voltage and line power flow exceeding the allowable values, security, and the economic operation of the distribution network. To accurately predict the spatial-temporal distribution of EV charging load, the coupling model of vehicles, transportation and distribution networks is formulated. The schematic diagram of the vehicles-transportation-distribution coupling network is illustrated in Fig. 1.
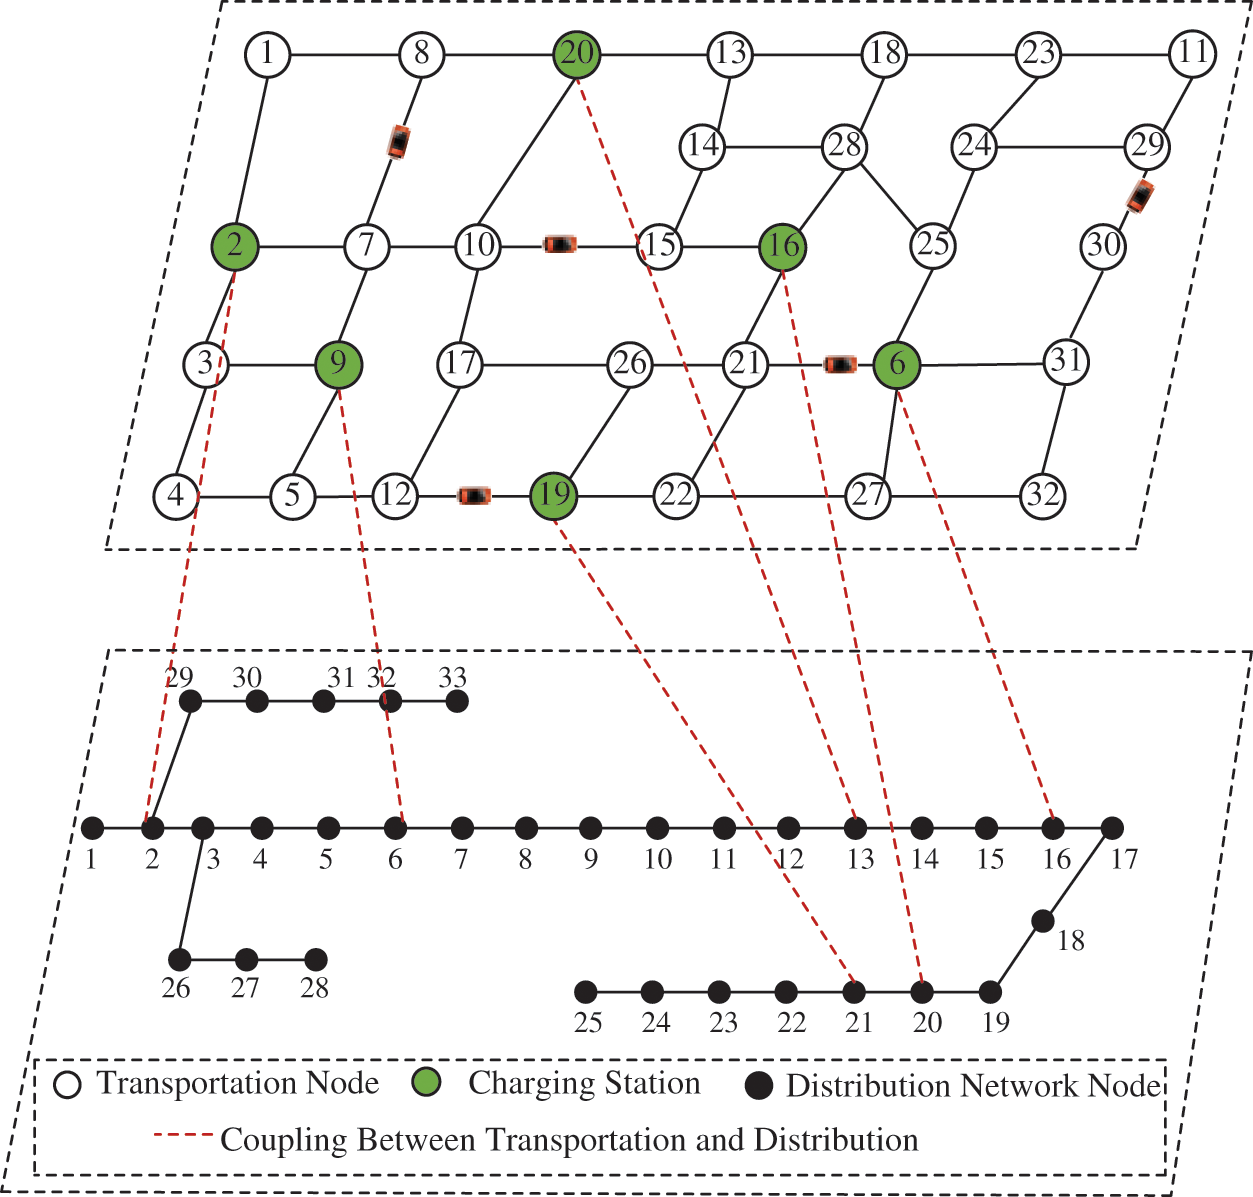
Figure 1: Schematic diagram of vehicles-transportation-distribution coupling network
2.1 Dynamic Transportation Network Model
Fig. 2 illustrates the schematic diagram of the transportation network topology. With the assumption that all links are bidirectional, the model of transportation network topology can be formulated as Eq. (1).
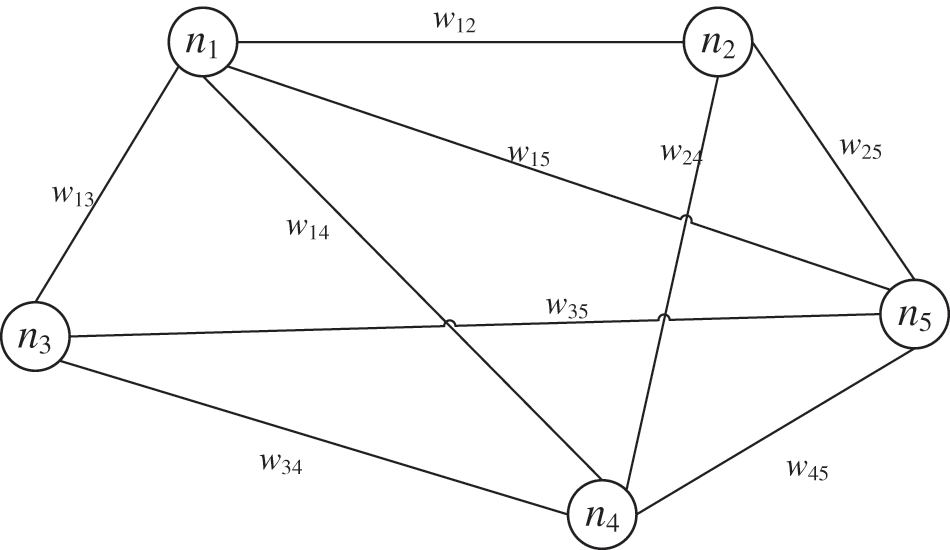
Figure 2: Schematic diagram of the transportation network topology
For purpose of accurately quantifying the trip cost of EVs between O-D pairs in urban transportation network, we use the nodal resistance and link resistance to formulate dynamic urban transportation network model.
As shown in Fig. 3, the trip time of EVs is influenced both by the link congestion (generally represented as link resistance) and by the time delays caused by traffic light controls at intersections (typically represented as nodal resistance). Therefore, the trip resistance composed of link impedance and nodal resistance can be formulated as Eq. (2).
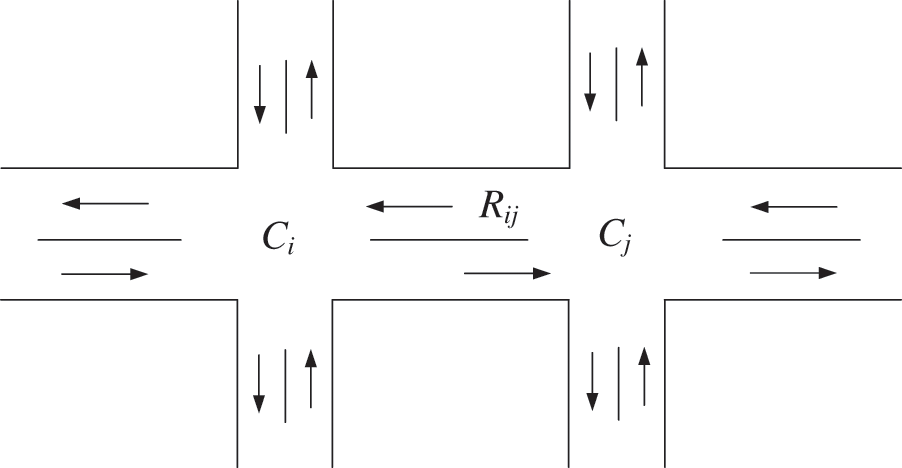
Figure 3: Schematic diagram of urban route resistance
Referring to the literature [21], we divide the condition of links into four levels based on the link saturation degree: unimpeded (0 < Sij ≤ 0.6), slow-moving (0.6 < Sij ≤ 0.8), congested (0.8 < Sij ≤ 1), and severely congested (1 < Sij ≤ 2). The values of nodal resistance and link resistance corresponding to different saturation levels are shown in Eqs. (3) and (4):
Combining the Eqs. (3) and (4), we can get the trip resistance as Eq. (5):
2.2 EV Charging Station Model Coupled the Transportation and Distribution Networks
The urban distribution network and transportation network are physically coupled through EV charging stations. For EV charging station k which is coupled with node n(k) in distribution network, its charging load can be expressed as Eq. (6):
3 Methodology of EV Charging Station Load Prediction
To accurately predict the charging demand requirements of EVs, this section firstly constructs a power consumption model accounting for the influences of ambient temperature and vehicle speed, and then formulates the EV moving and charging models. Moreover, the charging waiting time is also calculated based on the M/M/C queuing theory.
3.1 EV Power Consumption Model Considering Ambient Temperature and Vehicle Speed
The EV power consumption per kilometer which depends on the vehicle speed and ambient temperature has a direct impact on the battery’s state of charge and the magnitude of the EV charging load distribution.
In general, researchers assume that the vehicle speed and ambient temperature are invariable during the trip. This assumption neglects the impact of vehicle speed and air conditioning status on power consumption per kilometer and charging demand of EVs. As a result, a significant deviation of the EV’s power consumption from real values occurs. For instance, an EV power consumption could increase by more than 25% in idle state, the commitment of air conditioning could cause increase power energy consumption by more than 20%.
To assess EV power consumption accurately, referring to [22], a vehicle speed-flow practical model is firstly constructed based on real time traffic flow as Eq. (7):
Based on Eq. (7), the EV power consumption model considering environmental temperature and speed can be represented as Eqs. (8)–(10):
3.2 EV Moving and Charging Characteristics
To accurately depict the moving and charging characteristics of EVs, this paper categorizes EVs into three types based on their travel and charging characteristics: commuter private cars, taxis, and other public utility vehicles. The specific charging and travel characteristics of each type are as follows:
1) Commuting private EV: These vehicles mainly travel between residential and work locations with relatively fixed paths; they have a relatively long charging durations and fixed charging stations.
2) Electric taxis: The O-D pairs of this type EVs are stochastic. The trip time and the number of O-D pairs are more than other type EVs. As a result, taxis need fast charging and have flexible charging station selections.
3) Public utility EV: This category includes official private vehicles, business vehicles, and functional vehicles (such as logistics and sanitation vehicles). The O-D pairs of these EVs are variable with multiple trips. The charging duration is long and the choice of charging station is not fixed.
It should be noted that the charging characteristic of urban buses are almost unaffected by traffic flow for urban buses have specific O-D pairs and charging stations. Therefore, urban buses are not considered in this paper.
3.2.1 Driving Route Planning for EVs
For purpose of depicting the optimal trajectory for ith EV, this paper initially assigns O-D pairs. Then the Dijkstra algorithm is utilized to search the optimal routing policy. The objective is to select the shortest trajectory distance between O-D pairs as depicted in Eq. (11). As illustrated in Eq. (12), when the link nij is included in the optimal trajectory di(i), the value of xij is set to 1 and 0 otherwise.
3.2.2 EVs Charging Characteristics
According to the statistical results of different type of EVs, the battery capacity of different types of EVs conform to a gamma distribution as depicted in Eq. (13):
Referring to [23], the initial state of charge (SOC) of EVs follows a normal distribution N (0.5, 0.1). To prevent negative influence of overcharging, the value of SOC after charging is set to be 80% to 90% of the battery capacity. The specific charging characteristics of each type are as follows:
1) Commuting private EV: These vehicles typically travel between residential and work locations. The charging demand is triggered when the remaining SOC is insufficient for the next trip. The trigger condition for charging can be described as Eq. (14):
2) Electric taxis: This category of vehicles tends to have random trip patterns and primarily relies on fast charging. Therefore, the action of charging is triggered when Ct(i) falls below a specific threshold value Cl(i) as described as Eq. (15), in which the value of τ ranges from 0.15 to 0.35. For taxis, when the charging action is triggered, the Dijkstra algorithm is used to search nearest EV charging station immediately.
3) Public utility EV: Considering the frequent trips of these vehicles, if the remaining SOC is insufficient to arrive at the destination, if Eq. (14) is satisfied, these vehicles would go to the nearest EV charging station for charging. Otherwise, destination slow charging would be triggered.
Finally, the charging duration and the charging end time for EV can be represented by Eqs. (16) and (17), respectively.
For the number of piles at charging station is limited, EVs may need to wait for charging. Therefore, the M/M/C queuing theory is applied to quantify the waiting time for EVs.
On the assumption that the number of EVs arriving at EV charging stations follows Poisson distribution, the average system queue waiting time Tw can be formulated as Eqs. (18) and (19) based on the M/M/C queuing theory.
3.4 Procedures of EV Charging Station Load Prediction
The schematic diagram of EV charging station load prediction in this paper is illustrated in Fig. 4. The detailed procedures of EV charging station load prediction are described as follows:
1) Construct the coupled urban transportation and distribution network model and allocate different types of EVs at transportation network nodes based on the given proportion.
2) Calculate corresponding moving and charging parameters for EVs based on the Monte Carlo random sampling method.
3) Search for the shortest paths for O-D pairs based on dynamic Dijkstra’s algorithm.
4) Calculate the power consumption of different types of EVs according to the speed-flow model, temperature-speed based power consumption model, and M/M/C queuing theory.
5) Determine whether EVs charging demand is trigged. When the conditions for charge is satisfied, EVs would go to the nearest charging station to plug in distribution network. Finally, EV charging station load is obtained by aggregating all the EV charging load at station.
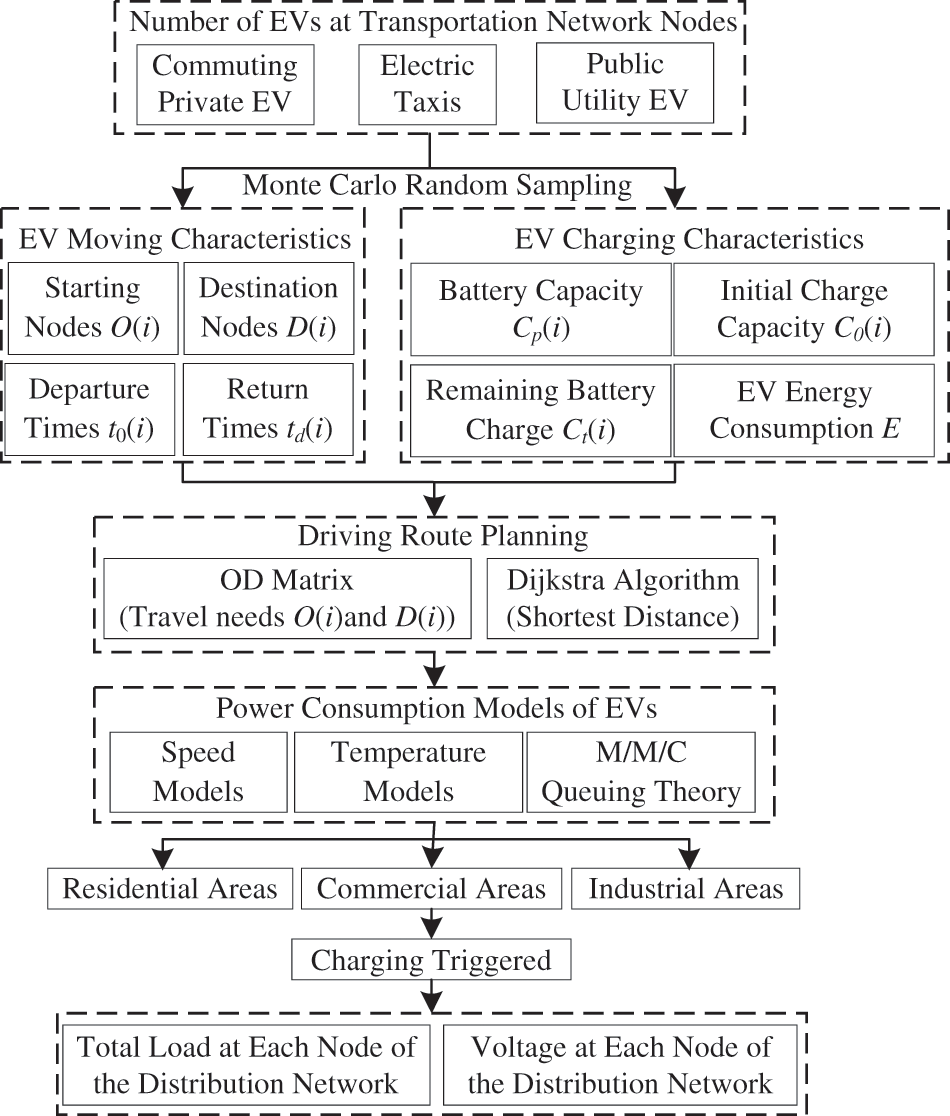
Figure 4: Schematic diagram of EV charging station load prediction
4 Dynamic Pricing Policy for Optimizing EV Charging Load Distribution
To obtain the dynamic pricing strategy for EV charging stations based on the charging demand requirement and threshold, this section firstly calculates the maximum charging load threshold of each charging station based on the security-constrained optimal power flow as depicted in Eq. (20):
where Z is the feasible region set constrained by DistFlow equation [24] and security constraints such as nodal voltage constraints, line thermal stability constraints, charging station capacity constraints, etc.
If
The proposed dynamic pricing model not only improve the economy and efficiency of charging station operation, but also encourage EVs to adjust the charging time based on the pricing signal, thus promoting the safe operation of the distribution network.
In this section, the validity of the proposed method is verified by using a coupled system of the IEEE 33 bus power distribution network and a 32 node transportation network.
The topology structure of the transportation network is depicted as Fig. 5, which includes 32 nodes and 53 links, with an average length of 2.18 km. The lengths corresponding to links are shown in Table 1. Six EV charging stations are located at node 1, 23, 16, 31, 25 and 18, respectively. The parameters of transportation network are set as c = 30 s, λ = 0.7, q = 0.8, and ζn = 70 $/MWh. Each node is equipped with sufficient AC 220 V slow charging piles with a rated power of 7 kW, and every fast charging station has five 120 kW dual-gun charging piles, which can simultaneously provide charging service for ten EVs.
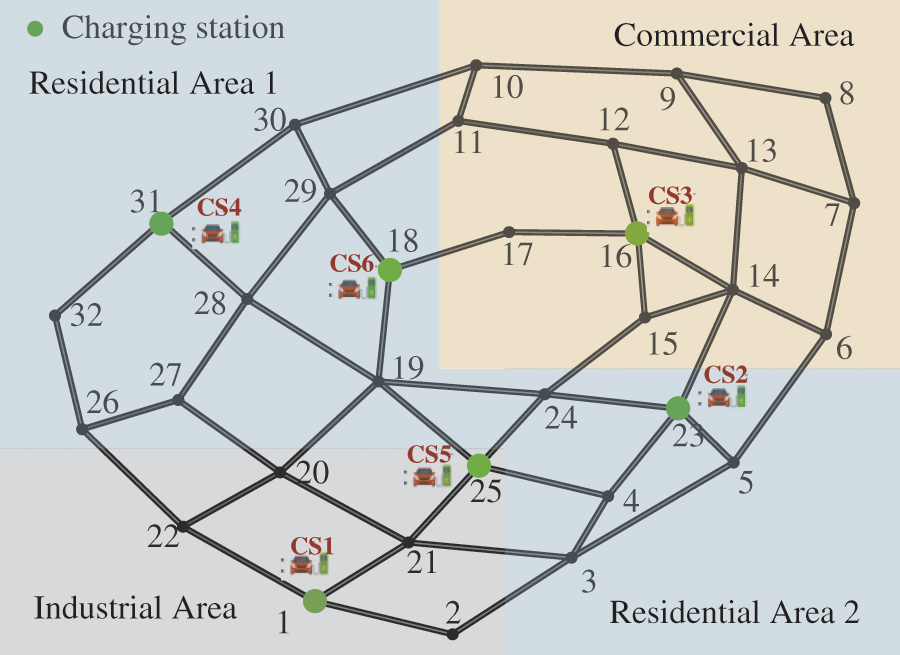
Figure 5: Structure of transportation network topology

The IEEE 33 bus power distribution network is shown in Fig. 6. Six charging stations in transportation network are coupled with the node 6, 8, 17, 18, 22, and 28 in distribution network, respectively.
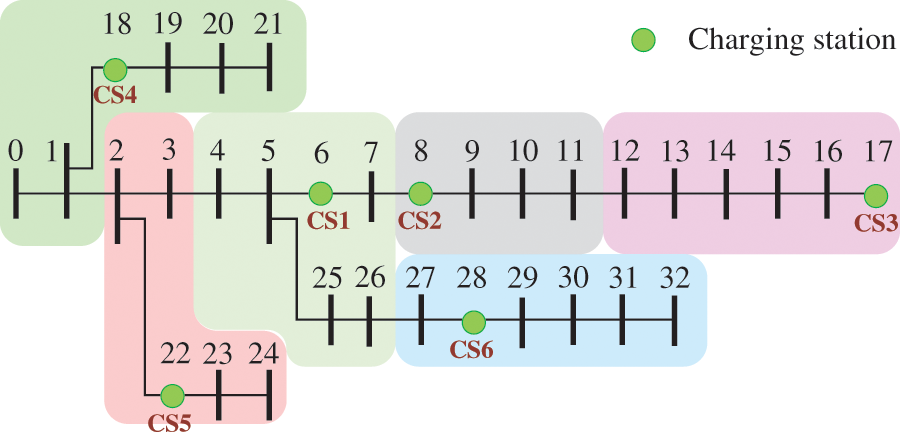
Figure 6: Diagram of IEEE 33 bus system
Some necessary instructions of the case study are given below:
1) Due to data limitations and the complexity of urban transportation network, we just focus on the main links to simplify the modeling of the transportation network and reduce simulation time, highlighting the impact of traffic network constraints on the spatiotemporal characteristics of EV station charging load.
2) The line thermal stability limits have been adjusted appropriately to match the load distribution of the test area based on the standard data of IEEE 33 bus distribution network.
3) The links in transportation network are categorized into two levels. For level I, the values of a, b, and γ are set to 1.726, 3.15, and 3, respectively. For level II, the corresponding values are set to be 2.076, 2.870, and 3, respectively.
The number of total EVs in this paper is set to be 3500, with the proportions of commuting private EV, electric taxis, and public utility EV being 45%, 30%, and 25%, respectively. The initial distribution of these three types of vehicles on a typical workday is illustrated in Fig. 7.
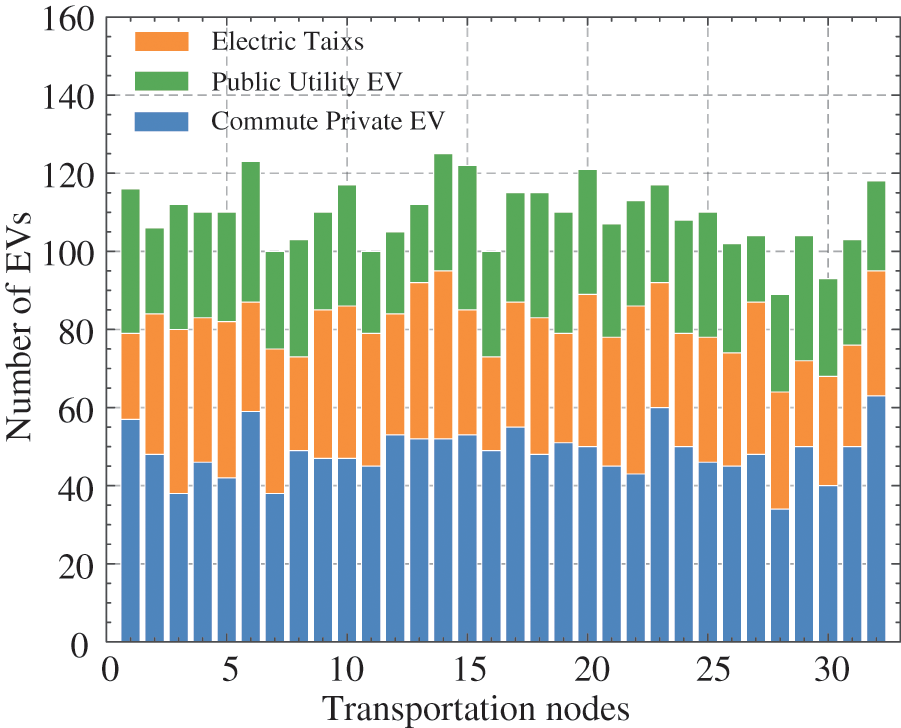
Figure 7: Initial EV distribution in the transportation network
5.2 Dynamic Transportation Network Model Testing
To evaluate the effectiveness of the dynamic urban transportation network model including nodal resistance in predicting EV charging station load, two cases are presented for detailed comparative analysis.
Case 1: The Time-flow model in the BPR function model [25] is considered without nodal resistance.
Case 2: The proposed transportation model in this paper considers the effects of nodal resistance and link resistance.
To predict travel time of each trajectory with different number of nodes, 100 testing experiments are conducted, respectively. The average travel time in the two cases is shown in Fig. 8. The results show that the travel time deviation of case 1 and case 2 expands continuously with the increase of the number of nodes passed by. In this regard, the deviation gradually increases from 6.05 min when passing through the trajectory with 3 nodes to 16.32 min when passing through the trajectory with 7 nodes, and the relative deviation increases from 32.87% at the minimum to 37.21% at the maximum. It can be concluded that due to the large number of intersections in urban transportation network, the nodal resistance has a great impact on the trip time, which will then affect the driving route planning of EVs, and finally have an impact on the spatiotemporal distribution of charging station load. The dynamic transportation model considering nodal resistance adopted in this paper can accurately simulate the driving characteristics of EVs, and improve the prediction accuracy of the spatiotemporal distribution of EV charging load by optimizing the routing selection of EVs.
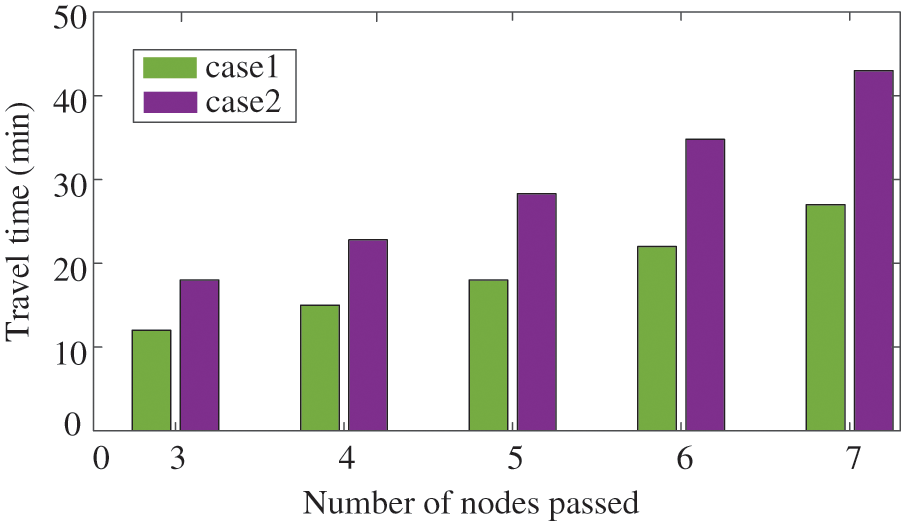
Figure 8: Comparison of the travel time in different cases
5.3 The Validity Analysis of the Proposed EV Charging Station Load Prediction Method
To comprehensively evaluate the effectiveness of the EV charging station load prediction model proposed in this paper, four cases are illustrated for comparative analysis.
Case 1: EV charging station load prediction model that does not take the influence of ambient temperature and speed on power energy consumption into consideration.
Case 2: EV charging station load prediction model that considers the effect of ambient temperature on EV energy consumption but does not account for vehicle speed influence.
Case 3: EV charging station load prediction model that considers the influence of vehicle speed on EV energy consumption but does not account for ambient temperature influence.
Case 4: The proposed method in this paper.
The EV charging station load in four cases is illustrated in Fig. 9.
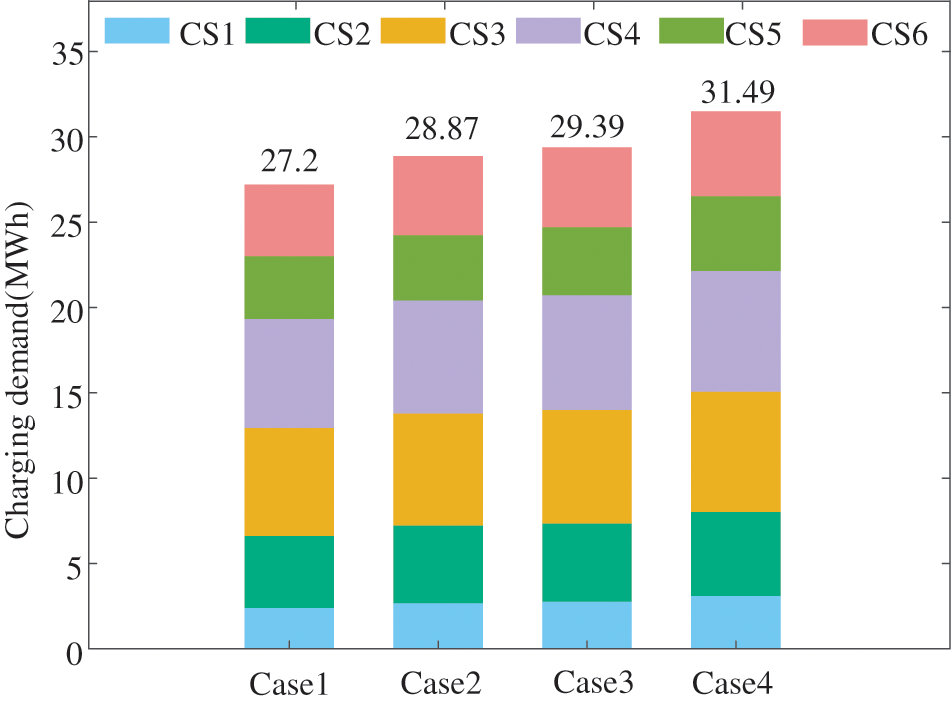
Figure 9: Comparison of EV charging station load in four cases
The total charging load energy of the regional charging stations over 24 h is 27.2 MWh in case 1. When considering the influence of ambient temperature on EV power consumption in case 2, the total charging load energy increases to 28.87 MWh with an increase of approximately 6.14% compared to case 1. The increased charging load energy is attributed to the operation of EV air conditioning in case 2 due to ambient temperature influences.
By comparing the results of case 1 and case 3, the total charging load of regional charging stations increases from 27.2 to 29.39 MWh with an increase of 2.19 MWh, or about 8.05%. The reason is that when EVs are moving in urban transportation network, EVs may work at idle speed or frequently startup and shutdown due to traffic congestion, resulting in an increase in power consumption, which in turn increases the total charging load demand of EV charging stations.
In case 4, considering the influence of temperature and vehicle speed on the charging load demand, the charging load of the six charging stations in the region becomes 31.49 MWh, which increases by 4.29 MWh relative to case 1. It can be observed that the incremental charging load is greater than the sum of that in case 2 and case 3 relative to case 1. The reason is that idle state not only increases the power consumption per unit mileage, but also increases the travel time, and the power consumption of air conditioning further increases compared with case 3. Consequently, the charging load increment predicted by case 4 relative to case 1 is greater than the sum of the charging load increment considering the influence of temperature and speed alone.
Fig. 10 shows the spatiotemporal distribution of EV charging load in transportation network. It can be observed that the peak value of overall charging demand occurs from 14:00–18:00. As can be seen from the Fig. 10, the charging load is mainly concentrated in nodes 4, 13, 17, 28, etc. The above nodes mainly correspond to the residential and commercial centers of the traffic nodes, and presents a “double peak” type charging demand. It should be noted that some electric taxis also choose to charge at night after finishing their daytime operations, and the charging load during 0:00–8:00 is relatively flat and are composed of electric taxis and commuting private EVs.
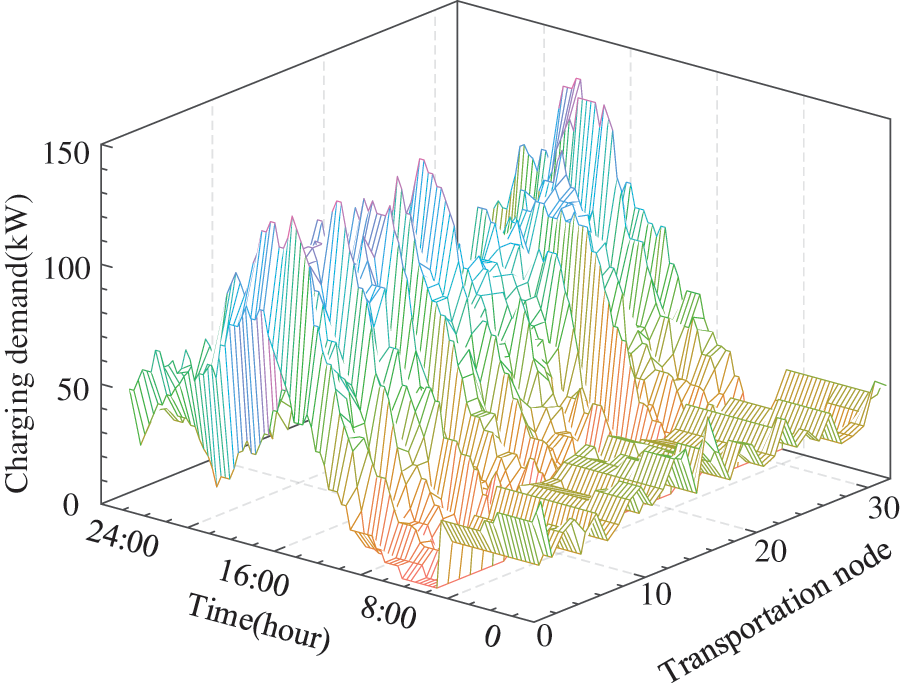
Figure 10: Spatiotemporal distribution of EV charging load
5.4 Analysis of Dynamic Charging Price
The charging load, maximum charging load threshold, and dynamic charging price of each EV charging station are shown in Fig. 11.
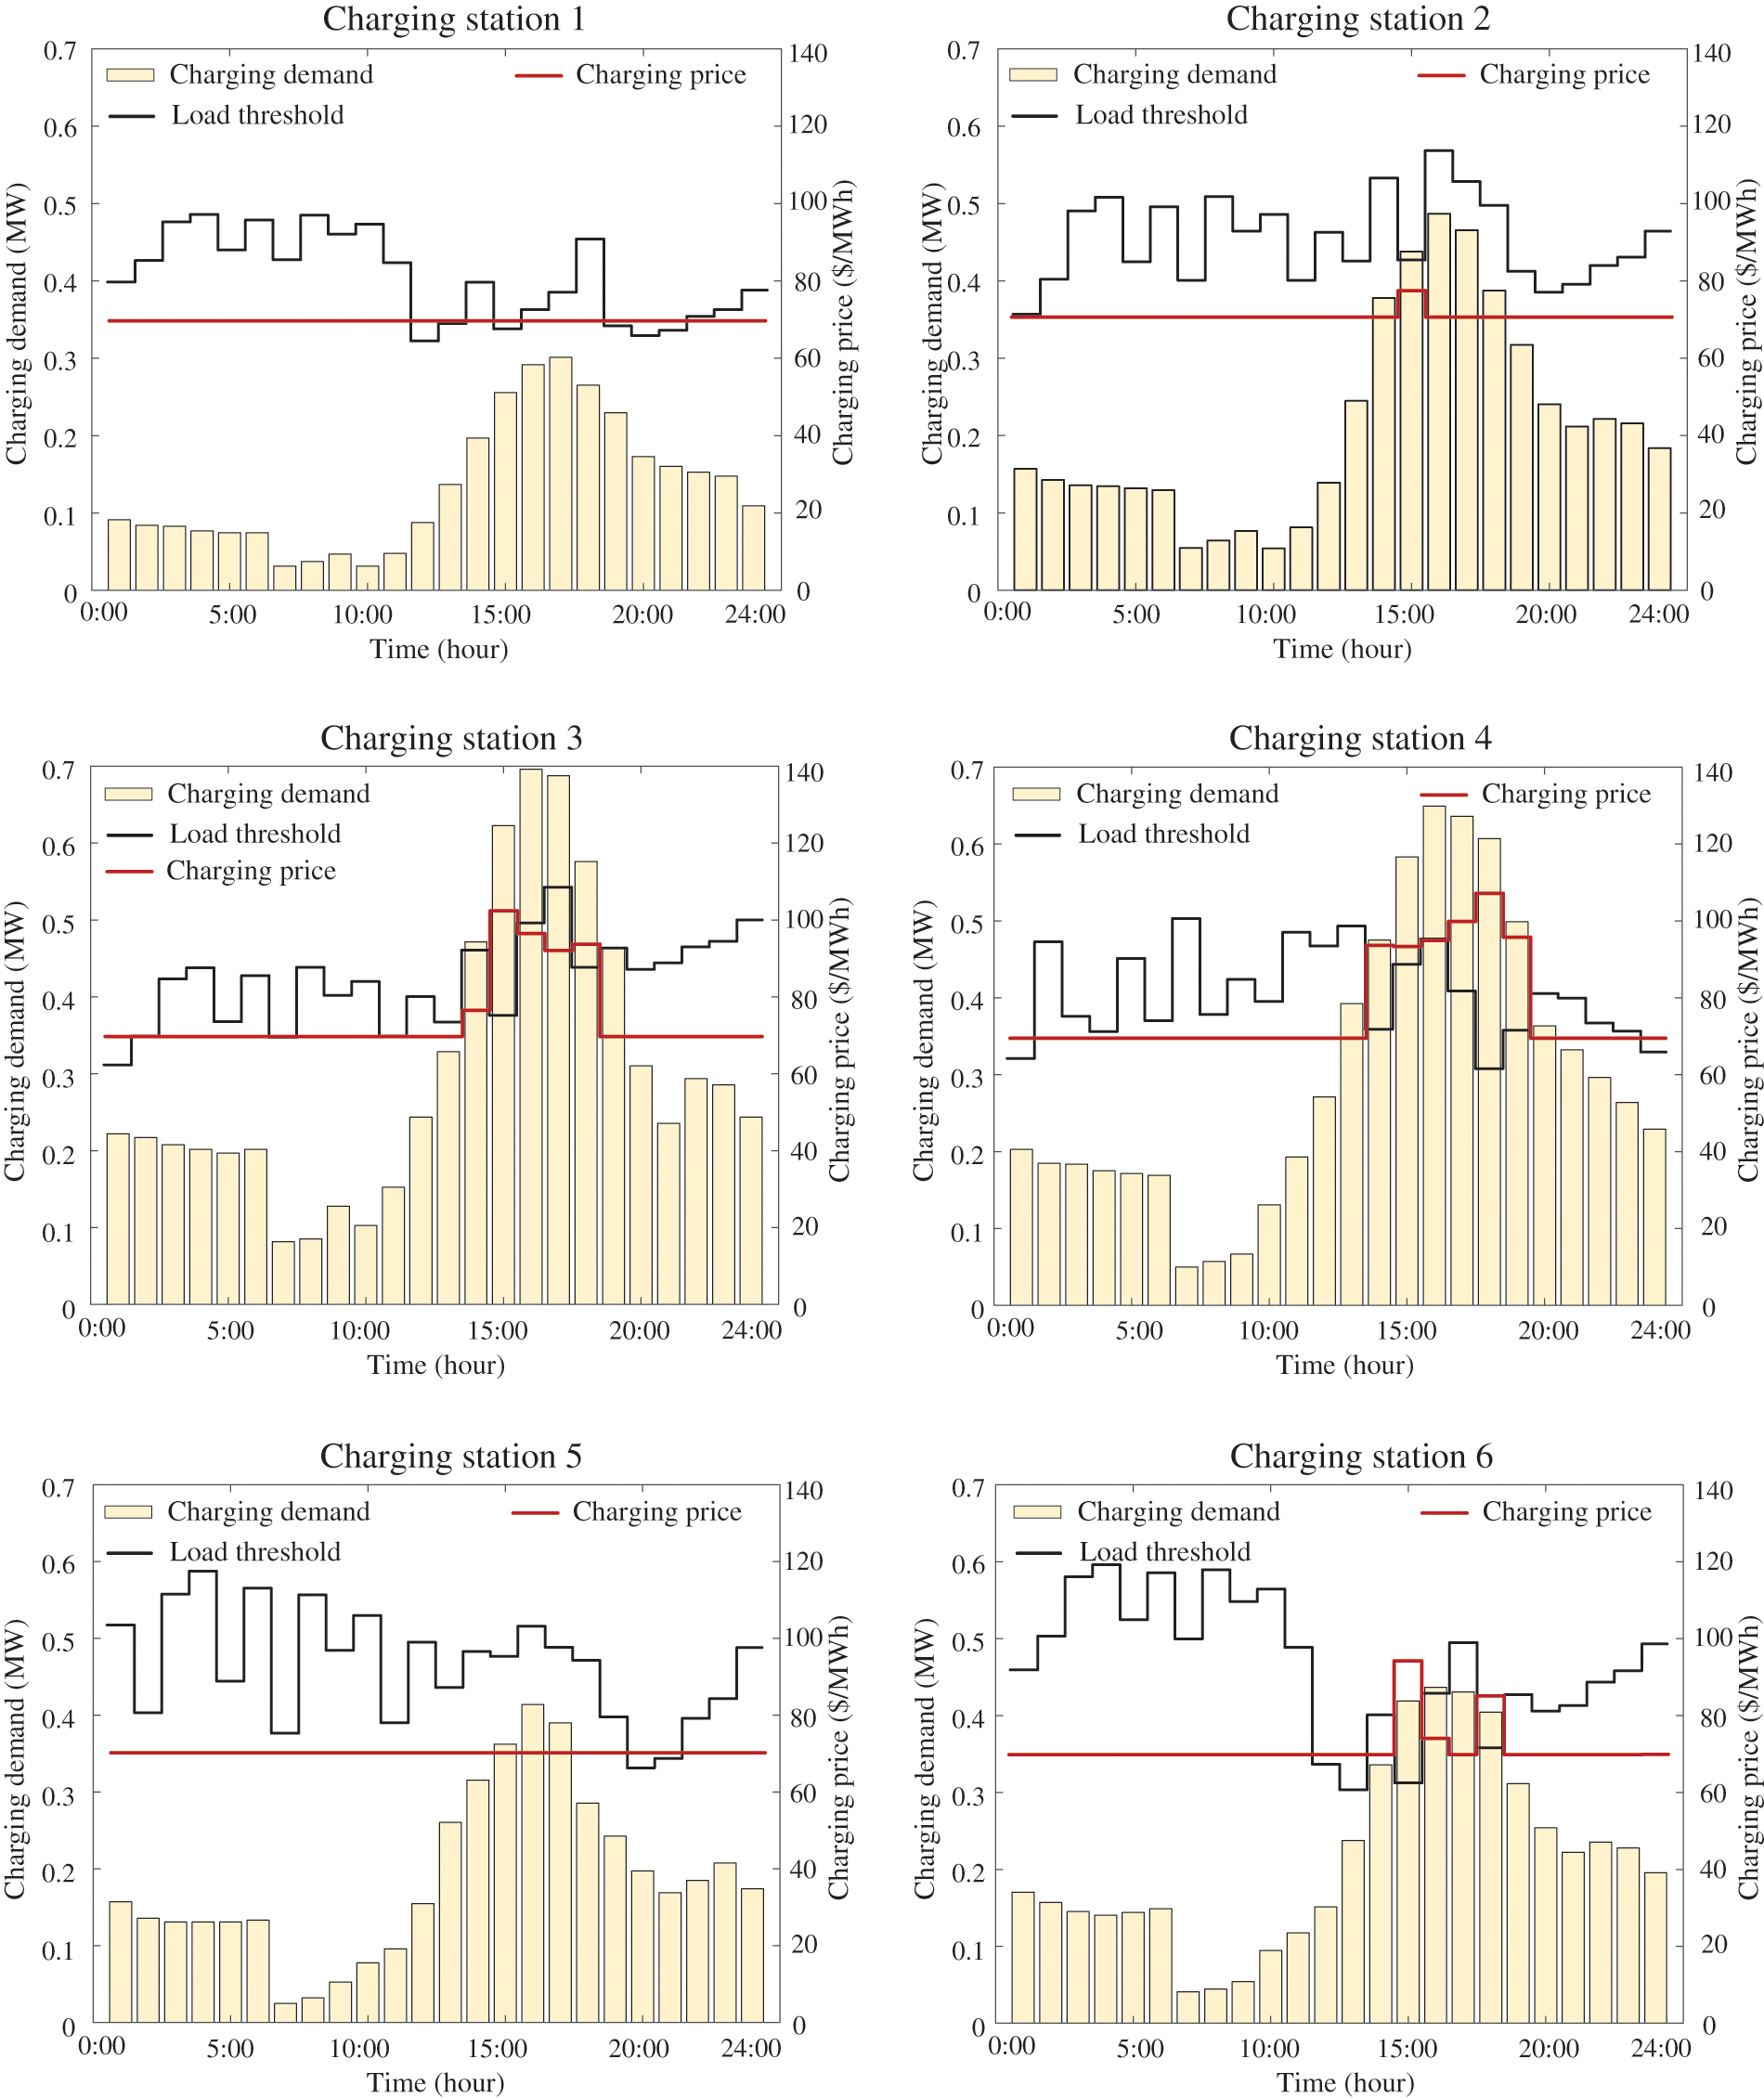
Figure 11: Distribution of charging load demand, threshold and price for EV charging stations
It can be found that charging prices are all 70 $/MWh during periods when the charging demand is less than the threshold for EV charging stations. However, during the periods 14:00–19:00, the charging demand at EV charging stations are relatively higher than other periods. Consequently, the charging demand requirement at hours 15:00 for station 2 surpasses the threshold, and the charging demand requirement during period 14:00–18:00 for station 3, along with the charging demand requirement during period 14:00–19:00 for station 4 and the charging demand requirement at hours 15:00, 16:00 and 18:00 exceed their threshold, respectively. As can be seen from Fig. 11, the charging price for hours when the charging load exceed the threshold are adjusted based on the dynamic pricing model and the more excess, the higher the price. With the dynamic charging price strategy, we can guide the EV drivers to charge at charging stations 1, 2 and 5 instead of charging at stations 3, 4 and 6 during peak charging hours or charging at off-peak hours to save the cost.
This paper proposes an EV charging station load prediction method in coupled urban transportation and distribution networks. The effectiveness of the proposed model is validated through case studies on a coupled IEEE 33 bus power distribution network and a 32-node transportation network. The conclusions are as follows:
1) The dynamic transportation network model adopted in this paper takes the influence of path congestion and intersection traffic lights on vehicle movement into consideration. The five groups of travel time prediction results for a trajectory with 3, 4, 5, 6, and 7 nodes showed that the average absolute percentage errors could be improved from 32.87% to 37.21% compared to the BRP model.
2) The EV power consumption model applied in this paper takes the influence of traffic congestion and environment temperature into consideration. As a result, the prediction of EVs charging load was improved from 27.2 to 31.49 MWh through the comparative analysis of the four cases, which significantly improves the accuracy of the charging station load prediction and provides reliable support for determining charging price policy in urban transportation and distribution networks.
3) Based on the predicted EV charging station loads and the thresholds, the dynamic charging price function is used to formulate a charging price strategy, which can not only improve the overall charging efficiency of regional EV charging stations during peak charging hours, but also provide price guidance signals for EV charging station selection, and ensure the safe operation of the distribution network.
The charging stations are key coupling elements with vehicles, transportation and distribution networks, the strategic placement and capacity of charging stations are crucial for urban development with the growing large number of EVs in transportation and distribution networks. Therefore, future research will focus on optimized planning of charging stations based on the proposed EV charging station load prediction method.
Acknowledgement: The authors acknowledge Northeast Electric Power University for facilitating and supporting the research work.
Funding Statement: This project is supported by the National Natural Science Foundation of China (No. U22B20105).
Author Contributions: The authors confirm contribution to the paper as follows: study conception and design: Benxin Li, Xuanming Chang; project administration: Xuanming Chang; analysis and interpretation of results: Benxin Li; draft manuscript preparation: Benxin Li, Xuanming Chang. All authors reviewed the results and approved the final version of the manuscript.
Availability of Data and Materials: The original contributions presented in the study are included in the article, further inquiries can be directed to the corresponding author.
Ethics Approval: Not applicable.
Conflicts of Interest: The authors declare that they have no conflicts of interest to report regarding the present study.
References
1. Monika, “China has 20.41 million new energy vehicles running on roads by end of 2023,” Accessed: Jan. 15, 2024. [Online]. Available: https://autonews.gasgoo.com/china_news/70030708.html [Google Scholar]
2. I. Veza, M. Z. Asy’ari, M. Idris, and V. Epin, “Electric vehicle (EV) and driving towards sustainability: Comparison between EV, HEV, PHEV, and ICE vehicles to achieve net zero emissions by 2050 from EV,” Alex. Eng. J., vol. 82, no. 1, pp. 459–467, Nov. 2023. doi: 10.1016/j.aej.2023.10.020. [Google Scholar] [CrossRef]
3. Z. Y. Ji and X. L. Huang, “Plug-in electric vehicle charging infrastructure deployment of China towards 2020: Policies, methodologies, and challenges,” Renew. Sust. Energy Rev., vol. 90, pp. 710–727, Jul. 2023. doi: 10.1016/j.rser/2018.04.011. [Google Scholar] [CrossRef]
4. L. B. Buzna et al., “An ensemble methodology for hierarchical probabilistic electric vehicle load forecasting at regular charging stations,” Appl. Energ., vol. 283, pp. 116337, Feb. 2021. doi: 10.1016/j.apenergy.2020.116337. [Google Scholar] [CrossRef]
5. Q. Dang and Y. Huo, “Flexibility scheduling for microgrids with electric vehicle (EV) penetration,” in Proc. ECCE, Portland, OR, USA, 2018, pp. 1078–1083. doi: 10.1109/ECCE.2018.8558242. [Google Scholar] [CrossRef]
6. J. Y. Du, M. G. Ouyang, and J. F. Chen, “Prospects for Chinese electric vehicle technologies in 2016–2020: Ambition and rationality,” Energy, vol. 120, no. 1, pp. 584–596, Feb. 2017. doi: 10.1016/j.energy.2016.11.114. [Google Scholar] [CrossRef]
7. Y. Cheng, Z. Zhang, J. C. Yu, W. Feng, C. X. Zhou and Y. M. Han, “Research on operation and management multi-node of megacity energy internet,” Glob. Energy Interconnect., vol. 1, no. 2, pp. 130–136, Apr. 2018. doi: 10.14171/j.2096-5117.gei.2018.02.004. [Google Scholar] [CrossRef]
8. V. Torrisi, M. Ignaccolo, and G. Inturri, “Analysis of road urban transport network capacity through a dynamic assignment model: Validation of different measurement methods,” Trans. Res. Procedia., vol. 27, pp. 1026–1033, Apr. 2017. doi: 10.1016/j.trpro.2017.12.135. [Google Scholar] [CrossRef]
9. M. Mousavi and M. Wu, “A DSO framework for market participation of DER aggregators in unbalanced distribution networks,” IEEE Trans. Power Syst., vol. 37, no. 3, pp. 2247–2258, May 2022. doi: 10.1109/TPWRS.2021.3117571. [Google Scholar] [CrossRef]
10. S. Mohammad and G. M. Ali, “Electric vehicle fast charging station design by considering probabilistic model of renewable energy source and demand response,” Energy, vol. 267, pp. 126545, Mar. 2023. doi: 10.1016/j.energy.2022.126545. [Google Scholar] [CrossRef]
11. S. Mohammad and G. M. Ali, “Fast-charging station for electric vehicles, challenges and issues: A comprehensive review,” J. Energy Storage, vol. 49, pp. 104136, May 2022. doi: 10.1016/j.est.2022.104136. [Google Scholar] [CrossRef]
12. V. T. Bina and D. Ahmadi, “Stochastic modeling for scheduling the charging demand of EV in distribution systems using copulas,” Int. J. Electr. Power Energy Syst., vol. 71, pp. 15–25, Oct. 2015. doi: 10.1016/j.ijepes.2015.02.001. [Google Scholar] [CrossRef]
13. Y. Zhao, X. He, Y. Yao, and J. J. Huang, “Plug-in electric vehicle charging management via a distributed neurodynamic algorithm,” Appl. Soft. Comput., vol. 80, pp. 557–566, Jul. 2019. doi: 10.1016/j.asoc.2019.01.053. [Google Scholar] [CrossRef]
14. J. J. Tang, J. H. Hu, W. Hao, X. Q. Chen, and Y. Qi, “Markov Chains based route travel time estimation considering link spatio-temporal correlation,” Phys. A: Stat. Mech. Appl., vol. 545, no. 1, pp. 123759, May 2020. doi: 10.1016/j.physa.2019.123759. [Google Scholar] [CrossRef]
15. D. F. Tang and P. Wang, “Probabilistic modeling of nodal charging demand based on spatial-temporal dynamics of moving electric vehicles,” IEEE Trans. Smart Grid, vol. 7, no. 2, pp. 627–636, Mar. 2016. doi: 10.1109/TSG.2015.2437415. [Google Scholar] [CrossRef]
16. J. Mei and C. Gao, “Considerations of traffic characteristics in research of grid integration of electric vehicles,” (in Chinese), Power Syst. Tech., vol. 39, no. 12, pp. 3549–3555, Dec. 2015. doi: 10.13335/j.1000-3673.pst.2015.12.032. [Google Scholar] [CrossRef]
17. Y. G. Luo, T. Zhu, S. Wan, S. W. Zhang, and K. Q. Li, “Optimal charging scheduling for large-scale EV (electric vehicle) deployment based on the interaction of the smart-grid and intelligent-transport systems,” Energy, vol. 97, no. 15, pp. 359–368, Feb. 2016. doi: 10.1016/j.energy.2015.12.140. [Google Scholar] [CrossRef]
18. H. R. Shen et al., “Electric vehicle velocity and energy consumption predictions using transformer and Markov-Chain Monte Carlo,” IEEE Trans. Transp. Electrific., vol. 8, no. 3, pp. 3836–3847, Sep. 2022. doi: 10.1109/TTE.2022.3157652. [Google Scholar] [CrossRef]
19. Y. Xiang, Z. Z. Jiang, C. H. Gu, F. Teng, X. Y. Wei and Y. Wang, “Electric vehicle charging in smart grid: A spatial-temporal simulation method,” Energy, vol. 189, no. 15, pp. 116221, Dec. 2019. doi: 10.1016/j.energy.2019.116221. [Google Scholar] [CrossRef]
20. T. Yi, C. Zhang, T. Y. Lin, and J. P. Liu, “Research on the spatial-temporal distribution of electric vehicle charging load demand: A case study in China,” J. Clean. Prod., vol. 242, no. 1, pp. 118457, Jan. 2020. doi: 10.1016/j.jclepro.2019.118457. [Google Scholar] [CrossRef]
21. A. Mejdoubi, H. Fouchal, O. Zytoune, and M. Ouadou, “A distributed predictive road traffic management system in urban VANETs,” in Proc. 2019 15th Int. Wirel. Commun. Mob. Comput. Conf. (IWCMC), Tangier, Morocco, 2019, pp. 37–42. doi: 10.1109/IWCMC.2019.8766717. [Google Scholar] [CrossRef]
22. T. Yu and J. X. Ma, “A review of the link traffic time estimation of urban traffic,” in Proc. 2016 IEEE Int. Conf. Intell. Transp. Eng. (ICITE), Singapore, 2016, pp. 123–127. doi: 10.1109/ICITE.2016.7581319. [Google Scholar] [CrossRef]
23. Y. F. Mu, J. Z. Wu, N. Jenkins, H. G. Jia, and C. S. Wang, “A spatial-temporal model for grid impact analysis of plug-in electric vehicles,” Appl. Energ., vol. 114, pp. 456–465, Feb. 2014. doi: 10.1016/j.apenergy.2013.10.006. [Google Scholar] [CrossRef]
24. M. Baran and F. F. Wu, “Optimal sizing of capacitors placed on a radial distribution system,” IEEE Trans. Power Deliver., vol. 4, no. 1, pp. 735–743, Jan. 1989. doi: 10.1109/61.19266. [Google Scholar] [CrossRef]
25. B. Wang, B. Hu, C. Qiu, P. Chu, and R. Gadh, “EV charging algorithm implementation with user price preference,” in Proc. 2015 IEEE Power Energy Society Innov. Smart Grid Technol. Conf. (ISGT), Washington DC, USA, 2015, pp. 1–5. doi: 10.1109/ISGT.2015.7131895. [Google Scholar] [CrossRef]
Cite This Article
 Copyright © 2024 The Author(s). Published by Tech Science Press.
This work is licensed under a Creative Commons Attribution 4.0 International License , which permits unrestricted use, distribution, and reproduction in any medium, provided the original work is properly cited.
 Downloads
 Citation Tools