
 Submit a Paper
 Propose a Special lssue
 Open Access
ARTICLE

eQUEST Based Building Energy Modeling Analysis for Energy Efficiency of Buildings
1 Regional Mechanical Field, Amazon Web Services, Herndon, VA 20170, USA
2 Industrial and Management Systems Engineering, West Virginia University, Morgantown, WV 26505, USA
3 Industrial and Production Engineering, JSS Science & Technology University, Mysuru, 570006, India
* Corresponding Author: Bhaskaran Gopalakrishnan. Email:
Energy Engineering 2024, 121(10), 2743-2767. https://doi.org/10.32604/ee.2024.051035
Received 26 February 2024; Accepted 26 July 2024; Issue published 11 September 2024
 View Full Text
 Download PDF
Abstract
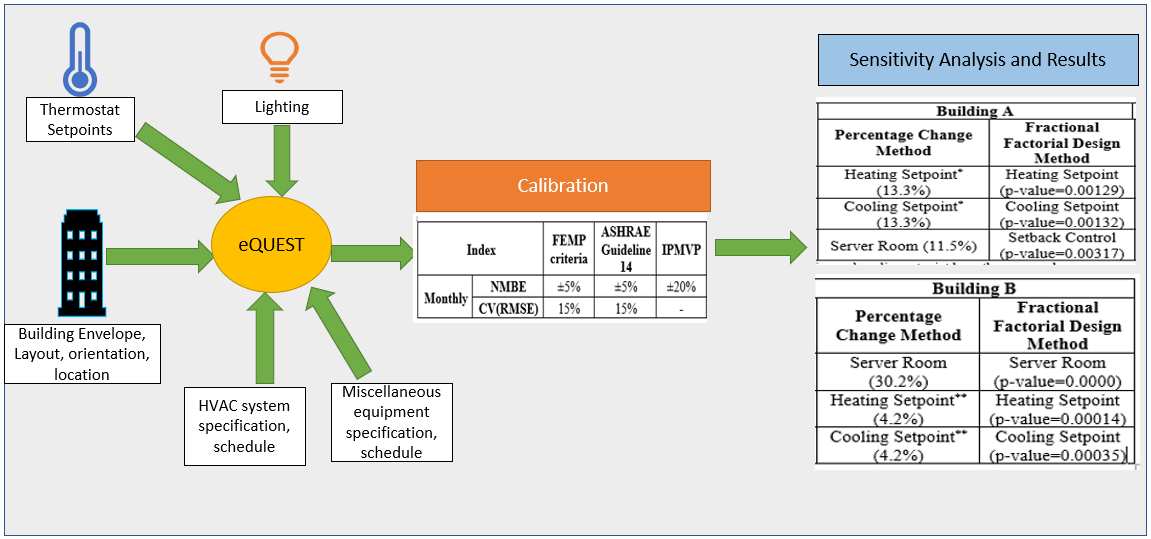
Building energy performance is a function of numerous building parameters. In this study, sensitivity analysis on twenty parameters is performed to determine the top three parameters that have the most significant impact on the energy performance of buildings. Actual data from two fully operational commercial buildings were collected and used to develop a building energy model in the Quick Energy Simulation Tool (eQUEST). The model is calibrated using the Normalized Mean Bias Error (NMBE) and Coefficient of Variation of Root Mean Square Error (CV(RMSE)) method. The model satisfies the NMBE and CV(RMSE) criteria set by the American Society of Heating, Refrigeration, and Air-Conditioning (ASHRAE) Guideline 14, Federal Energy Management Program (FEMP), and International Performance Measurement and Verification Protocol (IPMVP) for building energy model calibration. The values of the parameters are varied in two levels, and then the percentage change in output is calculated. Fractional factorial analysis on eight parameters with the highest percentage change in energy performance is performed at two levels in a statistical software JMP. For building A, the top 3 parameters from the percentage change method are: Heating setpoint, cooling setpoint and server room. From fractional factorial design, the top 3 parameters are: heating setpoint (p-value = 0.00129), cooling setpoint (p-value = 0.00133), and setback control (p-value = 0.00317). For building B, the top 3 parameters from both methods are: Server room (p-value = 0.0000), heating setpoint (p-value = 0.00014), and cooling setpoint (p-value = 0.00035). If the best values for all top three parameters are taken simultaneously, energy efficiency improves by 29% for building A and 35% for building B.Graphic Abstract
Keywords
Nomenclature
| ASHRAE | American Society of Heating, Refrigerating and Air-Conditioning Engineers |
| Btu | British Thermal Unit |
| CAV | Constant Air Volume |
| cfm | Cubic Feet per Minute |
| cm | Centimeter |
| CT | Current Transducer |
| CV(RMSE) | Coefficient of Variation of Root Mean Square Error |
| DCV | Demand Controlled Ventilation |
| DOE | Department of Energy |
| EER | Energy Efficiency Ratio |
| eQUEST | Quick Energy Simulation Tool |
| FEMP | Federal Energy Management Program |
| ft | Feet |
| HVAC | Heating, ventilation, and Air Conditioning |
| IPMVP | International Performance Measurement and Verification Protocol |
| kW | Kilowatt |
| kWh | Kilowatt-Hour |
| m | Meter |
| NMBE | Normalized Mean Bias Error |
| OECD | Organization for Economic Co-Operation and Development |
| PF | Power Factor |
| RTU | Roof Top Unit |
| SHGC | Solar Heat Gain Coefficient |
| Sq. | Square |
| VAV | Variable Air Volume |
| W | Watt |
Residential and commercial buildings are major contributors to global energy consumption, accounting for 20% of global energy usage and 40% of annual energy consumption in the U.S. The electricity consumption in the building sector has significantly increased over the years, reaching 76% in the U.S. by 2012. The U.S. Energy Information Administration projects that global building energy consumption will continue to rise, particularly in non-OECD countries. Therefore, improving energy efficiency in the building sector is crucial for reducing energy costs, greenhouse gas emissions, and operating expenses. The development of passive and net-zero buildings has introduced highly efficient and energy-balanced concepts. Enhancing energy efficiency in buildings presents significant opportunities for energy savings and sustainability [1,2].
Three approaches to energy modelling include physics-based (white box), empirical (black box), and hybrid (Gray box) methods [3]. Calibrated simulation is another approach where the model is adjusted to match actual energy usage [3]. Popular software tools for energy modelling include eQUEST [4], EnergyPlus [4], TRACE 700, and TRNSYS. Each software has its strengths and weaknesses, with eQUEST being user-friendly, EnergyPlus providing accurate results, TRACE 700 focused on HVAC calculations, and TRNSYS offering a range of simulations [4]. Overall, eQUEST and EnergyPlus are commonly used, with eQUEST offering ease of use and EnergyPlus providing higher accuracy [4].
1.1 eQUEST and Modeling Capability
eQUEST (Quick Energy Simulation Tool) was designed to allow the user to perform detailed analysis of today’s state-of-the-art building design technologies using the most sophisticated building energy use simulation techniques but without requiring extensive experience in building performance modeling. It is an energy modeling software that utilizes the U.S. DOE’s simulation tool DOE-2. It has three input wizards: schematic design wizard, design development wizard, and energy efficiency wizard. The schematic design wizard is used in the earliest stages of the design, while the detailed development wizard requires more specific information. The energy efficiency measure wizard allows users to analyze multiple scenarios for the design model. eQUEST has enhanced DOE-2, wizards and graphics.
eQUEST models can be highly effective for buildings with a maximum of three-season profiles, simple building envelope construction, limited window, and door types, single HVAC system per zone, and location where exact weather profile is available in .bin format. If the building consists of a simple roof and wall structure with less than six construction layers, eQUEST can effectively model the envelope. Simple flat roofs or pitched roofs can be effectively modeled in eQUEST. There are various options for window and door types. Three types of windows and doors can be specified per shell in eQUEST. Also, various shading controls like overhangs, fins, and drapes can be effectively modeled. Various glazing options are available. In double or triple-pane windows, insulating materials like air or argon can be modeled. A building with limited windows and doors, common frame types, and insulating inert gases can be effectively modeled in eQUEST.
Various HVAC systems like direct expansion (DX) coils, chilled water coils, evaporative coolers, furnaces, electric resistance heating, hot water coils can effectively be modeled in eQUEST. The operation can be based on schedule, demand, standby, or sub-hour cycle for chilled water and hot water loops and hot water loops. Various preconditioning and preheating can be effectively modeled. Energy recovery wheels based on counter flow, cross flow, parallel flow, and mixed flow can be modeled. eQUEST is most effective if the schedule of the equipment, occupancy, and HVAC system remains steady on an hourly basis. Under lighting systems, fluorescent, metal halide, high-pressure sodium, and incandescent lamps can be modeled. There are options to specify if the lamps are suspended or recesses and vented or not vented. Under lighting controls, daylighting and sky lighting can be modeled. Daylighting can be effectively modeled if the maximum number of daylight sensors in a zone is not more than two. eQUEST can also effectively model photovoltaic arrays, engine generators, gas turbine generators, and steam turbine generators. Thus, eQUEST allows for extensive and complex building energy simulations.
1.2 Major Drivers of Energy Consumption in Buildings
The building envelope is a boundary between the interior and exterior of a building, including the walls, roofs, base, windows, and doors. The type of material and insulation in the walls, roofs, and foundation of the building affects the heat transfer between the building’s interior and exterior, directly affecting its energy consumption. Single pane glass windows and doors add more heating and cooling load to the building than double or triple-pane glass windows and doors with glazing and low emissivity coatings. The efficiency of windows and doors is affected by Solar Heat Gain Coefficients (SHGC) and U-value. The thermostat set point can affect the thermal comfort level, ventilation requirements, and HVAC system’s energy consumption.
For example, setting a heating setpoint to a high temperature increases the heating load in the building, so the HVAC system consumes more energy to bring the space to the setpoint temperature. The thermostat setpoint temperature can be adjusted to achieve energy savings but must be made without impacting people’s thermal comfort levels. Zone control allows multiple spaces or zones to have their own independent thermostat setpoint, increasing energy efficiency. Occupancy directly affects the energy consumption of a building, so many modern buildings have occupancy sensors to turn the lights off when the space is unoccupied and programmable thermostats and demand-controlled ventilation (DCV) to adjust ventilation requirements according to the occupancy level. People give off energy to the surroundings through their skins in sensible heat and latent heat.
The efficiency of energy use decreases with use over time, so replacing old and inefficient equipment with new and efficient equipment can increase the building’s overall energy performance. Building size, orientation, and weather profile also affect energy consumption. Human beings are thermally comfortable in the temperature range of 68°F to 72°F, and the relative humidity range of 40% to 60%. A building that experiences mild climatic conditions throughout the year has to expend less energy to condition the space to meet the human thermal comfort level than a building that experiences extreme climatic conditions.
The research mainly aims to evaluate the energy performance for the degraded and upgraded building parameters compared to the base case. The research will help building owners identify the major building parameters to prioritize and focus their resources on to improve the building energy performance. Maintenance and operation practices in a building can impact its energy performance as much as the design parameters over the long term. There is a plethora of parameters that affect a building’s energy consumption, such as envelope insulation, HVAC capacity, lighting power density, thermostat setpoint, fenestration, infiltration, and many more. Without considering these factors, energy models will not give an accurate prediction of existing building energy performance.
Furthermore, by implementing findings from this study, the market penetration of energy savings achieved in buildings can be evaluated. There were 5.9 million commercial buildings in the U.S. in 2018 [5] and 140.8 million residential buildings in 2020. However, only 36,000 buildings achieved the Energy Star® rating by the end of 2019 [6], and only 67,200 buildings had received Leadership in Energy and Environmental Design (LEED) certification at the end of 2018. Energy Star is awarded to those buildings whose energy performance is better than 75% of buildings nationwide. This shows that many buildings in the U.S. still have low energy efficiency. According to a report published by the National Association of the Home Builders, 1.2 million new homes are built every year in U.S., and it is estimated that at the stated rate of new homes construction, 45% of the total homes would still consist of housings built before 1970 in 2037 [7].
The research objectives of this study are multifaceted and aimed at understanding the energy consumption of commercial buildings and the influence of various building parameters. The objective is to develop eQUEST models for two commercial buildings using the actual building parameters obtained during the assessment phase. These models will serve as accurate representations of the buildings for further analysis. Secondly, simulations will be performed to determine the annual energy consumption of the buildings and compare the results with the actual utility bills, validating the accuracy of the models.
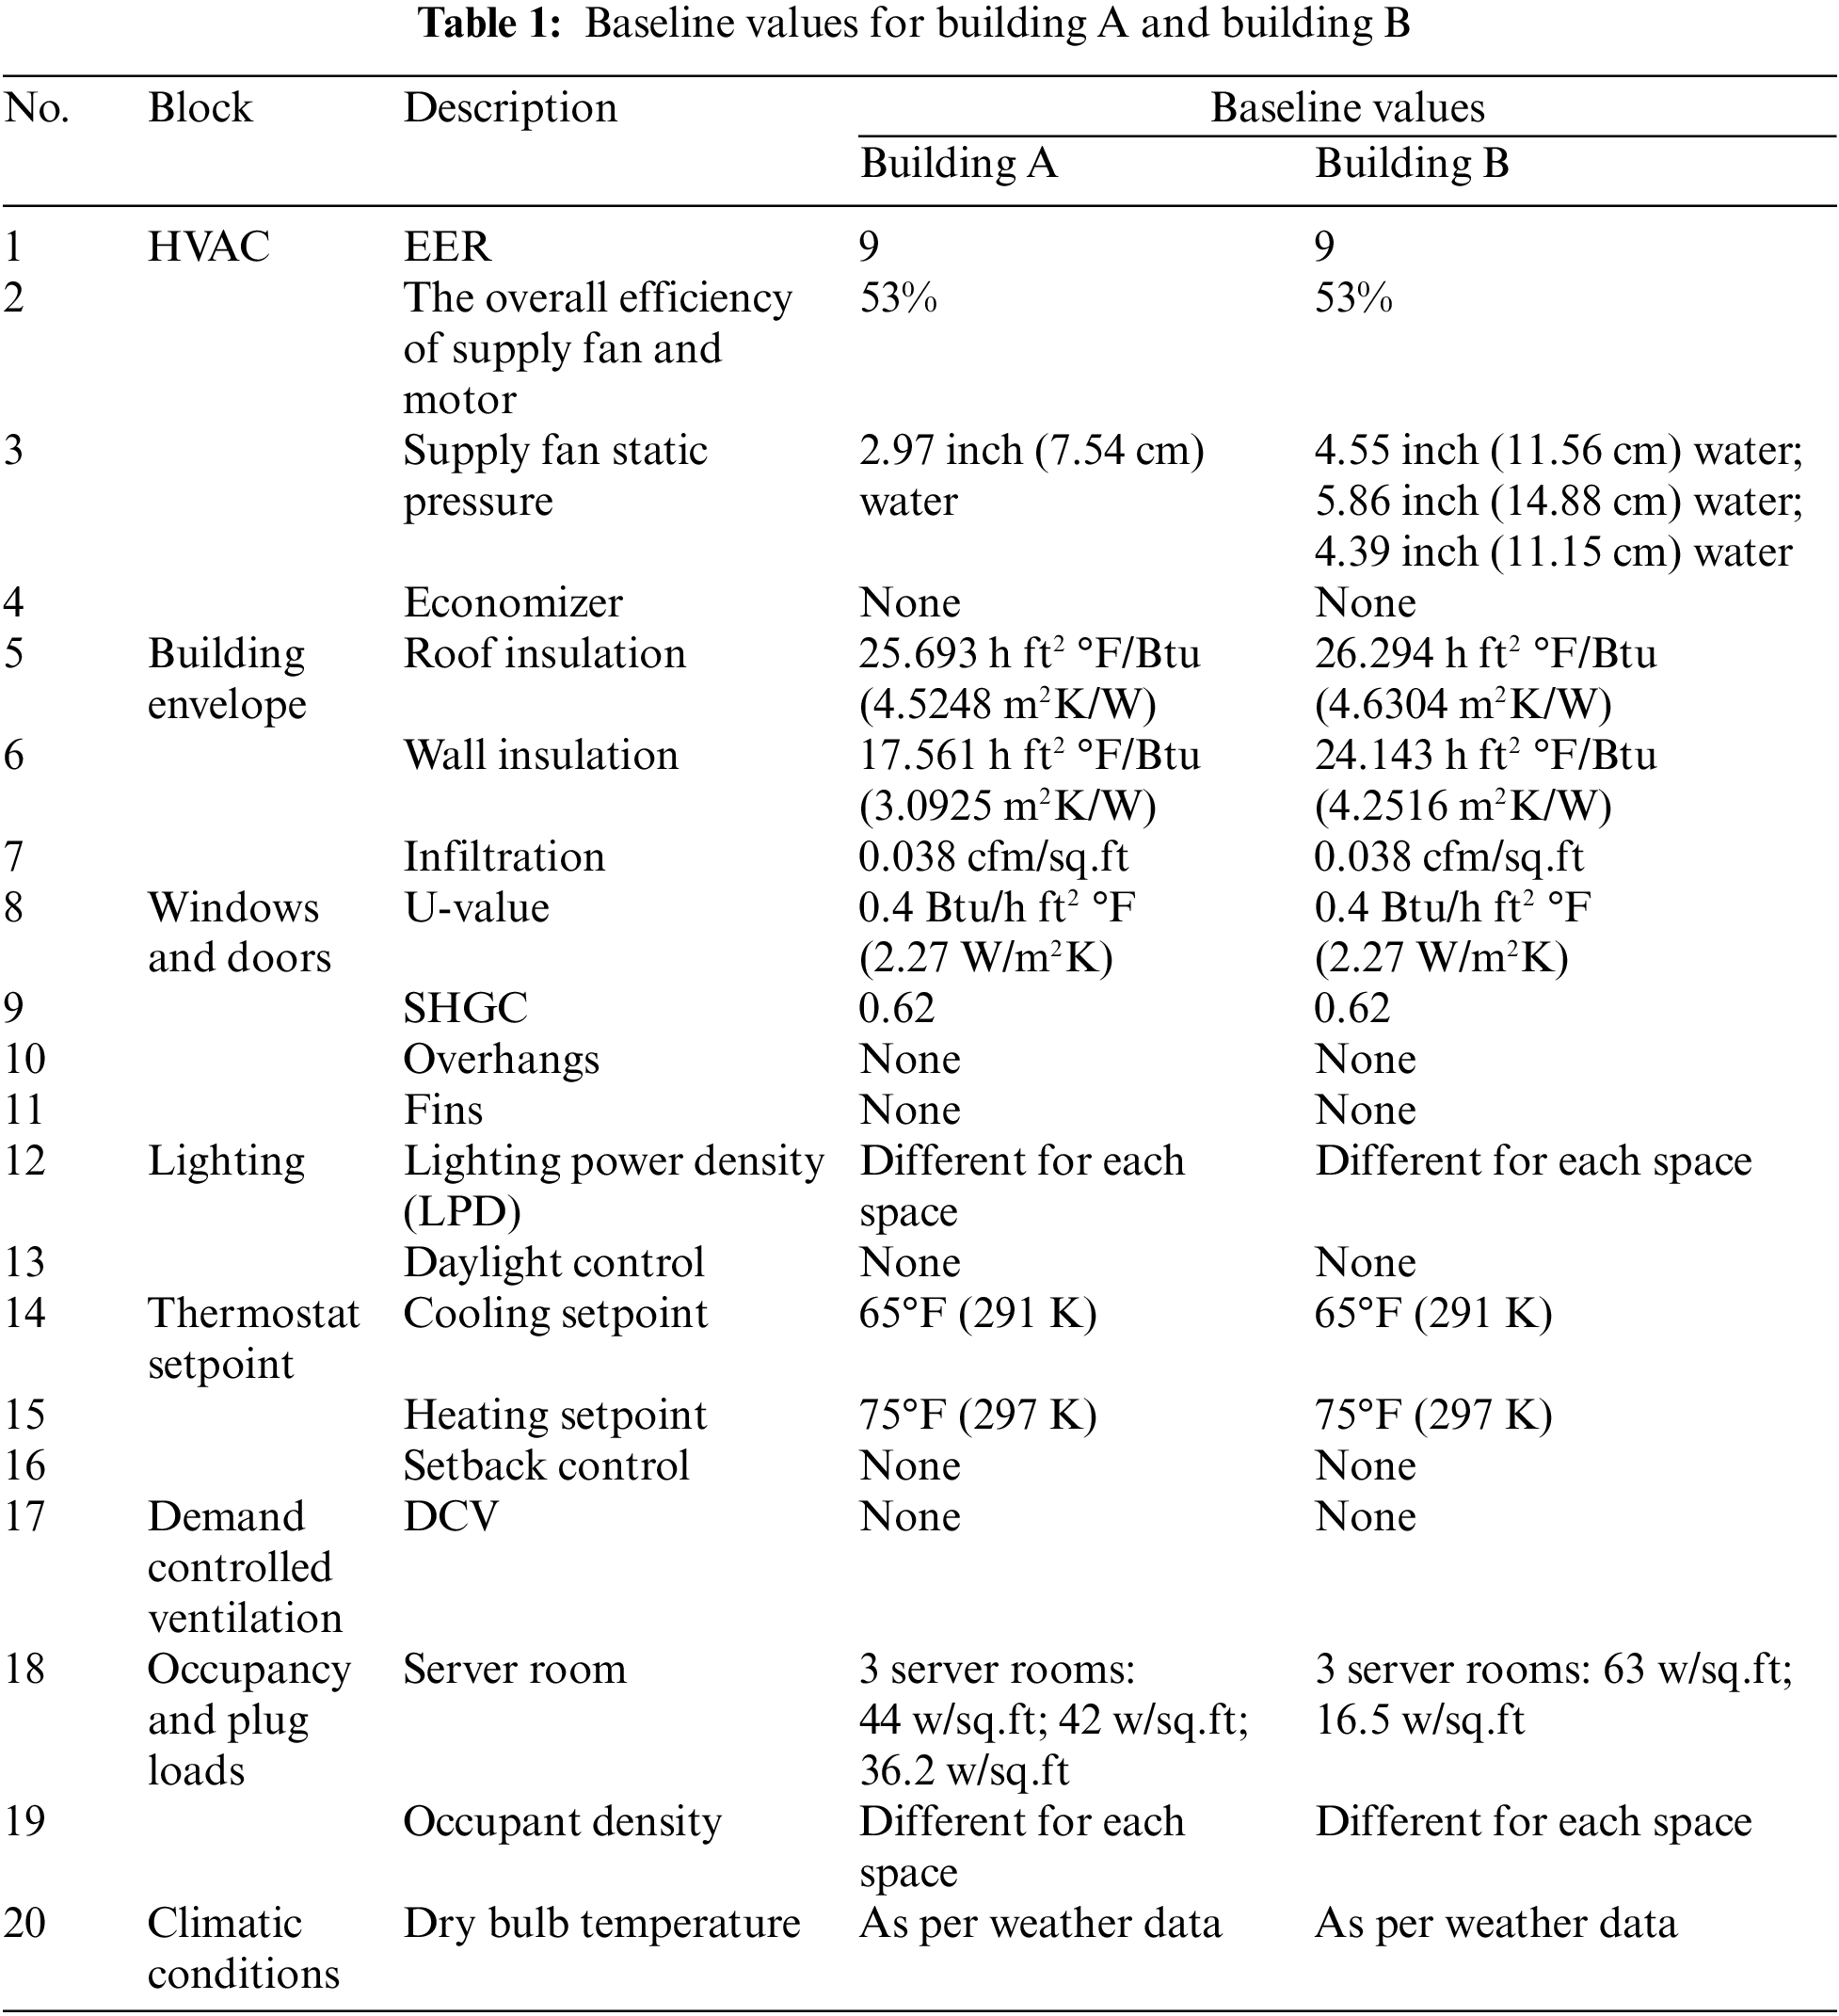
Furthermore, the study aims to investigate the impact of diverse building parameters on energy consumption. Specific parameters to be analyzed include the HVAC system (EER, motor efficiency, static fan pressure, and economizer), building envelope and infiltration (roof and wall insulation, infiltration rate), windows and doors (U-value, SHGC, overhangs, and fins), the lighting system (Lighting Power Density (LPD), daylight control), thermostat setpoint controls (cooling and heating setpoints, setback control), demand-controlled ventilation, occupancy and plug load, building orientation, and climatic conditions (dry bulb temperature). The parameters will be evaluated for the base case, low performance, and high performance.
Lastly, a sensitivity analysis will be conducted to identify the top three building parameters that significantly impact building energy performance. This analysis will provide valuable insights into prioritizing resources and implementing energy-efficient measures in buildings. The outcomes of this research will contribute to a better understanding of energy consumption patterns in commercial buildings and inform strategies for improving energy efficiency.
Occupant-based HVAC setpoint intervention has also been studied using eQUEST. Ardiyanto et al. [8] examined the energy consumption of a commercial building in Virginia and achieved up to 14.58% HVAC electricity savings by adjusting the setpoint based on occupants’ thermal comfort. Incorporating occupancy information further increased the savings by 8.79%. Programmable thermostats and occupancy sensors can automate setpoint adjustments, enabling more precise control and energy savings during occupied and unoccupied periods.
In addition to thermostat setpoints, other building parameters such as the HVAC system, building envelope, windows and doors, lighting system, occupancy, and plug load, among others, influence energy consumption. Mininni et al. [9] found that energy savings were more significant when occupied and was occupied and replacing inefficient equipment with Energy Star-rated appliances resulted in savings of approximately 10% of total miscellaneous equipment electricity usage. The study also revealed that replacing a constant air volume (CAV) HVAC system with a variable air volume (VAV) system can yield up to 22.6% energy savings. However, the impact of VAV systems varies based on climatic conditions, with energy savings observed in humid climates but increased energy consumption in dry climates due to re-heating demands and fan energy.
The building envelope, particularly windows, is crucial in heat ingress. Dilshad et al. [10] investigated the energy performance of a commercial building using eQUEST. They found that adding insulation to exterior walls, replacing single-paned windows with double-paned windows, and installing daylight controls can result in energy savings of up to 3.75%, 1.69%, and 2.84%, respectively. Shading devices such as overhangs and fins can reduce solar heat gain, saving energy. Javad Dehghani et al. [11] demonstrated that installing overhangs and fins in an office building in Ohio resulted in a 1.3% reduction in energy consumption.
Lighting systems also significantly contribute to overall energy consumption. Jiafang Song et al. [12] determined a linear relationship between annual power consumption and lighting power density, with a 10% increase in lighting power density corresponding to a 10% increase in energy consumption. Using daylight controls and efficient lighting fixtures can achieve energy savings of up to 2.83% and 31%, respectively [10,13].
Sensitivity analysis helps identify the most influential building parameters. Ye et al. [14] conducted a sensitivity analysis of retrofit projects in different climatic regions. They found that replacing windows, lighting fixtures, and office equipment with more efficient alternatives had the highest sensitivity ratios in most climatic zones. However, the impact of parameters varied by climate, with insulation and cooling system efficiency being more sensitive in cold and hot temperatures, respectively.
The ASHRAE 90.1 standard provides guidelines for assigning thermal zones in a building, allowing for combining HVAC zones into thermal blocks under certain conditions. These conditions include consistent space usage classification within the thermal block, the similar orientation of zones adjacent to glazed exterior walls and using the same HVAC system or type [15]. HVAC systems play a crucial role in the energy consumption of residential and commercial buildings. The design, operation, and maintenance parameters of HVAC systems significantly influence the overall energy performance of a building. One parameter that directly affects HVAC energy consumption is the thermostat setpoint. Raftery et al. [16] conducted a study to assess the impact of HVAC setpoint adjustment on energy savings and peak load reduction in buildings under different weather conditions. The results showed that increasing the setpoint above the base-case temperature (70°F) during specific outdoor temperature ranges led to energy savings and peak demand reduction. However, no energy savings or peak demand reductions were observed when the outdoor temperature was lower than the base-case setpoint. Energy modeling software like eQUEST allows for quick investigation of the impact of setpoint adjustments on building energy performance.
Standards such as ASHRAE Guideline 14, the International Performance Measurement and Verification Protocol (IPMVP), and the Federal Energy Management Program (FEMP) define the boundaries for calibrating simulation models. However, no standard methodology for calibration exists. ASHRAE Guideline 14 suggests a whole-building calibrated simulation approach using commercially available hourly computer simulation programs. The model is calibrated against actual measured data and used to predict post-retrofit conditions [16].
Accurate utility bill matching is crucial in building energy modeling. Annual matching provides a more precise energy performance prediction while allowing slight variations in monthly bills due to modeling limitations [9]. Validation studies use statistical tests such as t-tests, Pearson correlation coefficients, mean absolute error, and coefficients of variance of root mean square error (CV(RMSE)) to compare actual and simulated energy consumption data. The International Performance Measurement and Verification Protocol (IPMVP) Option D is commonly used to verify simulation results [13,17,18].
Comparisons between different software tools can provide insights into differences in load calculations. For example, a study comparing TRNSYS and eQUEST for heating and cooling load calculations found slight variations attributed to differences in load calculation methods. TRNSYS calculates loads precisely to maintain temperature setpoints, while eQUEST uses standard equipment assumptions. Other parameters, such as infiltration rate, building orientation, and window area, yielded similar results in both programs [19].
Studies have evaluated the effectiveness of energy codes in reducing energy consumption and carbon emissions. Adopting ASHRAE 90.1-2007 resulted in energy savings, reduced costs, and lower emissions in states that still needed to implement this code. However, compared to older versions of ASHRAE 90.1, ASHRAE 90.1-2007 did not consistently improve energy efficiency due to less stringent rules. Leadership in Energy and Environmental Design (LEED) rating systems were more efficient than ASHRAE 90.1-2004 [20,21]. Adopting ASHRAE 90.1-2022 resulted in average site energy savings upto 14% compared to ASHRAE 90.1-2019 [22].
Commissioning is essential for ensuring optimal building performance. Retro-commissioning applies to existing buildings, while re-commissioning is performed periodically to maintain performance. Studies have shown that retro-commissioning can result in 5% to 20% energy savings with payback periods of 2 years or less. Regular re-commissioning is recommended to maintain savings over time [23–25].
Components of buildings degrade over time, affecting their energy performance. Studies have examined the degradation of HVAC systems, insulation, lighting, doors, and windows. Age, maintenance practices, and climatic conditions influence degradation rates. Regular maintenance and replacement of degraded components can improve energy efficiency [26–28].
where
Thermal mass and its effect on energy performance have been studied. The mass of building envelopes and interior equipment impacts heating and cooling delays, energy storage, and temperature control strategies. Heavyweight construction with high specific heat capacity can dampen transient heat flows. The influence of thermal mass on energy consumption varies based on climate and design characteristics such as insulation and window properties [29,30].
This chapter discusses the prevalence of research works in building energy modeling using simulation software. It is noted that most of the prevailing research focuses on design parameters only, and very few have evaluated operating parameters’ impact. Additionally, the quality of building components degrades or fails over time, and retro-commissioning and re-commissioning can enhance the energy efficiency of existing buildings. However, more research is needed to identify the main parameters affecting the building energy performance using sensitivity analysis and simulation tool eQUEST. This research has been addressed by evaluating the impact of various building parameters on whole-building energy performance to identify the top three building parameters affecting building energy performance.
The research aims to identify the top three building parameters that impact building energy performance the most. For this purpose, data collected from two fully functional commercial buildings in Fairmont, West Virginia (WV), has been used to generate a baseline simulation model in eQUEST. The baseline model is tuned and validated with the actual utility bill over a year. To evaluate the impact of various building parameters on the building’s energy performance, baseline values of parameters to be studied are varied to two levels: Low values and High values. The top three parameters with the highest impact on building energy performance are identified. The overview of the research methodology is shown in Fig. 1.
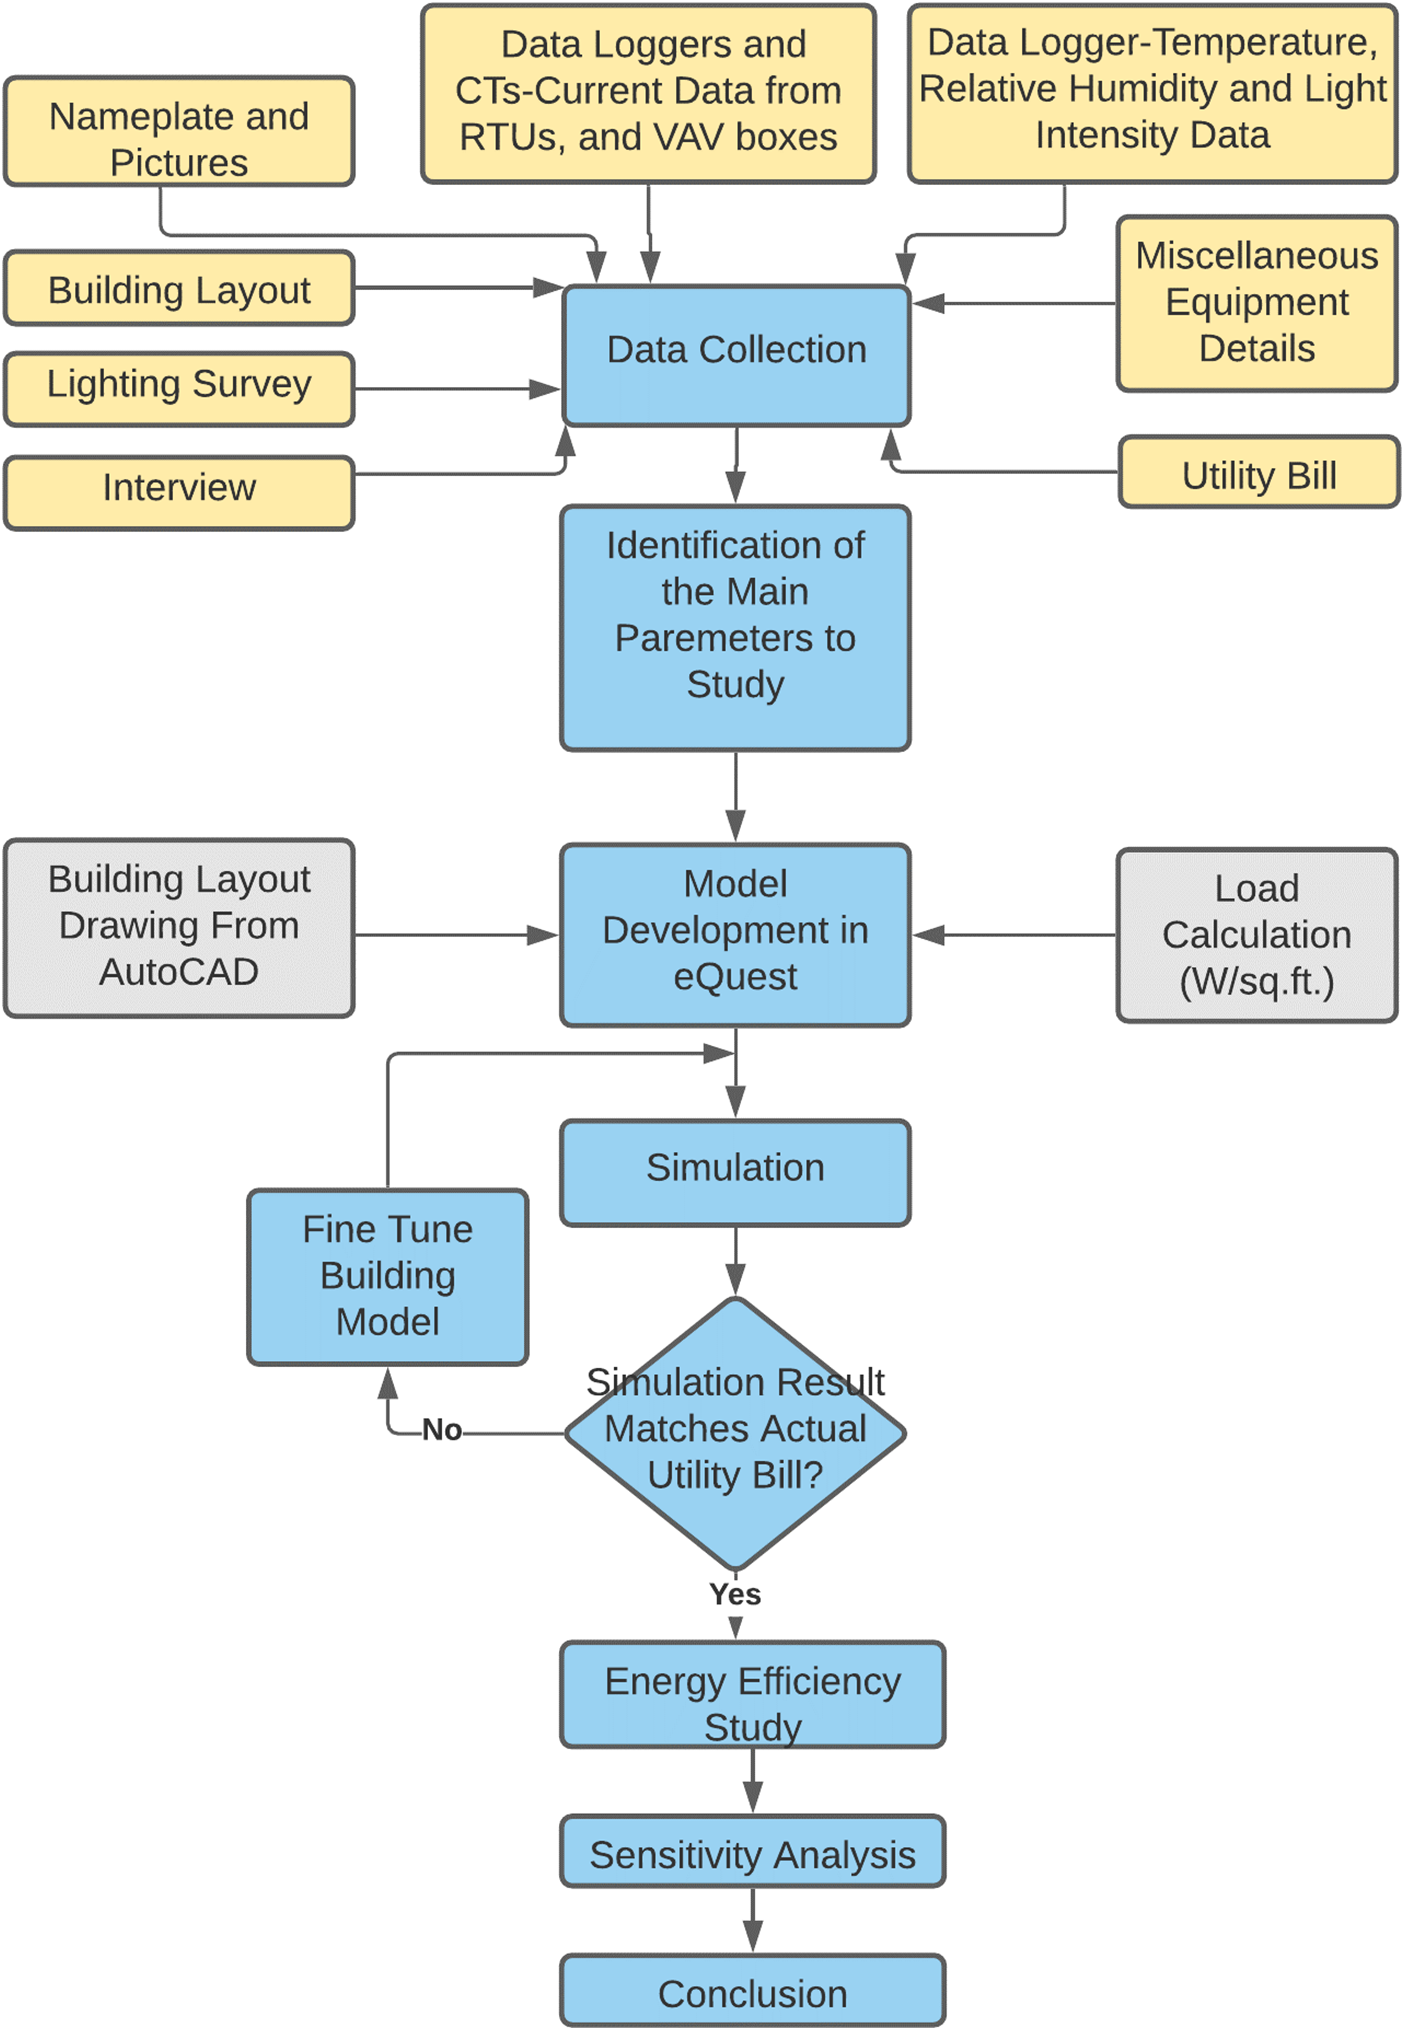
Figure 1: Overview of research methodology
3.1 Data Collection and Parameter Determination
Data collection involves a comprehensive assessment of various building parameters over two days. Detailed data were collected on various building parameters during the two-day energy assessment of the facility. A lighting survey was carried out to determine the current energy consumed by lighting. As the building has a high window-to-wall ratio (WWR), it was identified that there could be substantial energy savings opportunities by implementing daylight controls during the assessment. Pictures of the existing Roof Top Units (RTUs), VAV boxes, auxiliary A/C systems, and water heaters nameplates were taken. Data of current being drawn by the RTUs and VAV boxes were collected with data loggers and current transducers (CTs) over a week. The CTs collected and recorded the electrical current drawn at 16 s intervals for one week. At the time of installation of the CTs, an instantaneous power factor (PF), voltage (V), and current (Amps) were measured with the help of a multimeter and were recorded. Also, the room temperature profile of some rooms was measured with data loggers over a week. The current drawn by the VAVs and the RTUs helps understand the existing operating conditions of those units, and the temperature data can be used to check how well the thermostat responds to the temperature in the room. The recorded data was uploaded to HOBOware® software, from which graphs were obtained. Such data is crucial for analysis and in identifying energy-saving opportunities. Furthermore, a preliminary survey of miscellaneous energy-consuming equipment and interviews with plant personnel are conducted to gather information on occupancy, schedules, and building operations. Utility bills for both buildings spanning September 2019 to August 2020 are also collected.
The selection of parameters for the study is based on their significance in influencing building energy performance, as identified through a literature survey and discussions in previous chapters. These parameters encompass HVAC systems, making envelope and infiltration, windows and doors, lighting systems, thermostat setpoints, and setback controls, demand-controlled ventilation, occupancy and plug loads, building orientation, and climatic conditions.
The eQUEST software, version 3.65, is employed for building model development. The Design Development Wizard (DDW) was chosen due to the complex nature of the buildings and the availability of detailed data. This wizard requires comprehensive information about the building, including address, project details, seasons, and additional building-specific data. A floorplan of the building is created using AutoCAD software and imported into eQUEST to accurately represent the building’s layout. Load profiles and schedules are inputted to calculate load in watts per square foot for different space types. After completing the DDW, the Detailed Data Edit Mode is utilized to make final adjustments to the building parameters, fine-tune the model, and match it with actual energy usage data. This model is also used for performing energy efficiency studies. Figs. 2 and 3 show the eQUEST Model for the building A and building B, respectively.
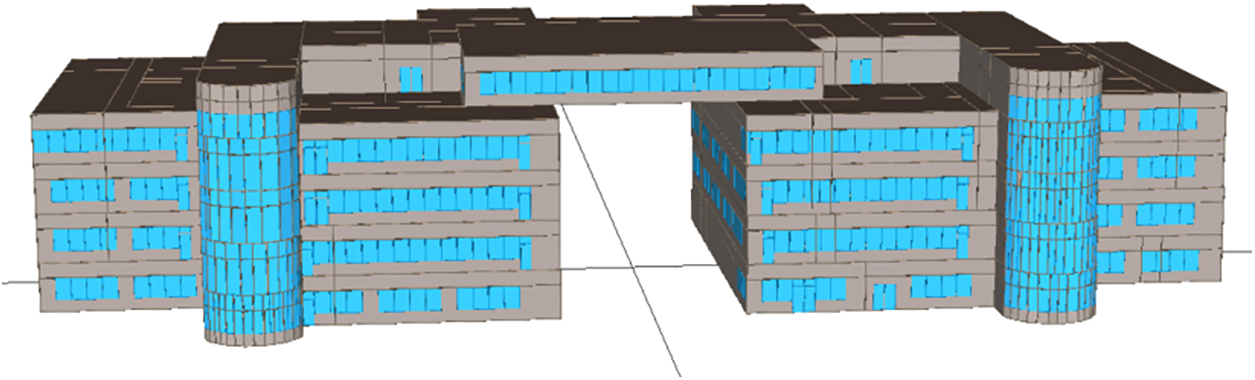
Figure 2: eQUEST model of building A
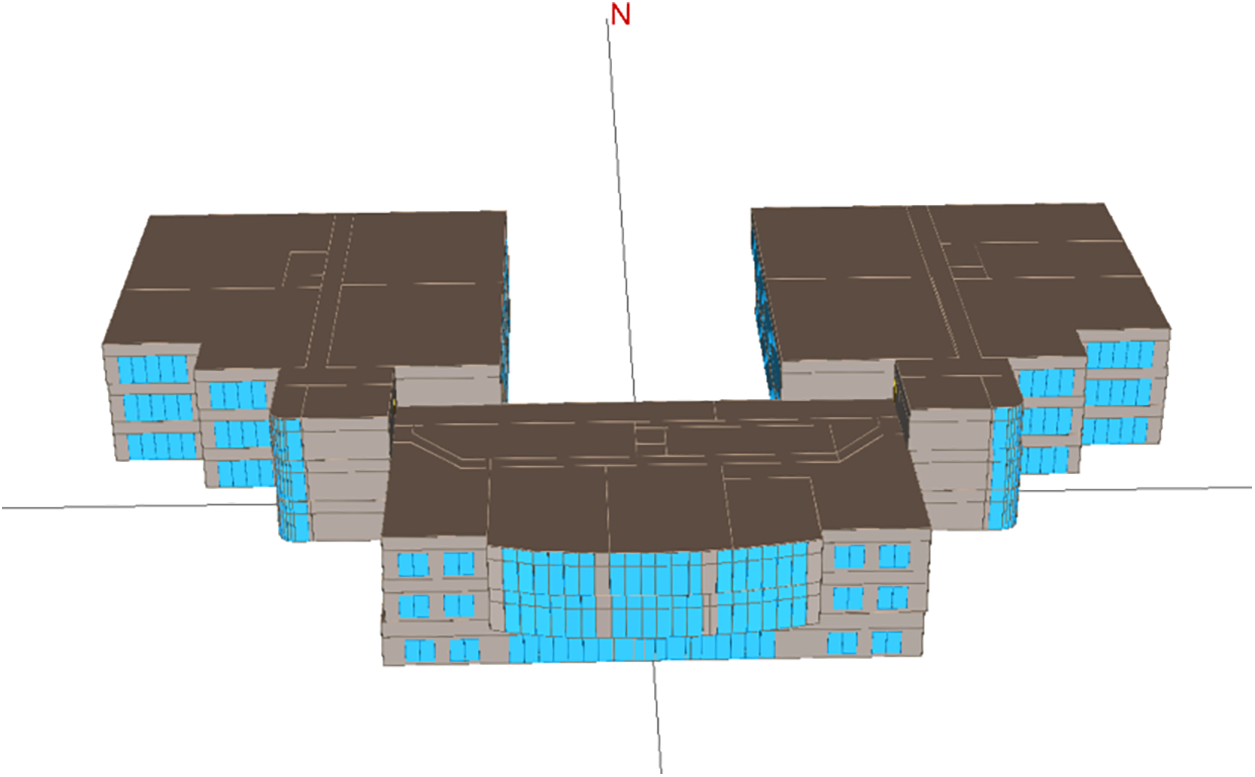
Figure 3: eQUEST model of building B
The baseline values of the parameters for both building A and building B are provided in Table 1. The parameters encompass various aspects such as HVAC systems, building envelope, windows and doors, lighting, thermostat setpoints, demand-controlled ventilation, occupancy and plug loads, and climatic conditions.
The building model is used to simulate the energy consumption of a building for a year. The model performs energy efficiency studies if the simulated annual energy consumption results match the actual energy consumption data. If the monthly simulation result does not match the utility bill, the building parameters are explored in more detail in the detailed data edit mode. ASHRAE Guidelines, Federal Energy Management Program (FEMP), and IPMVP use CV(RMSE) with NMBE to verify the accuracy of the models. The calibration criteria of the FEMP, ASHRAE guideline 14, and IPMVP are shown in Table 2.
where
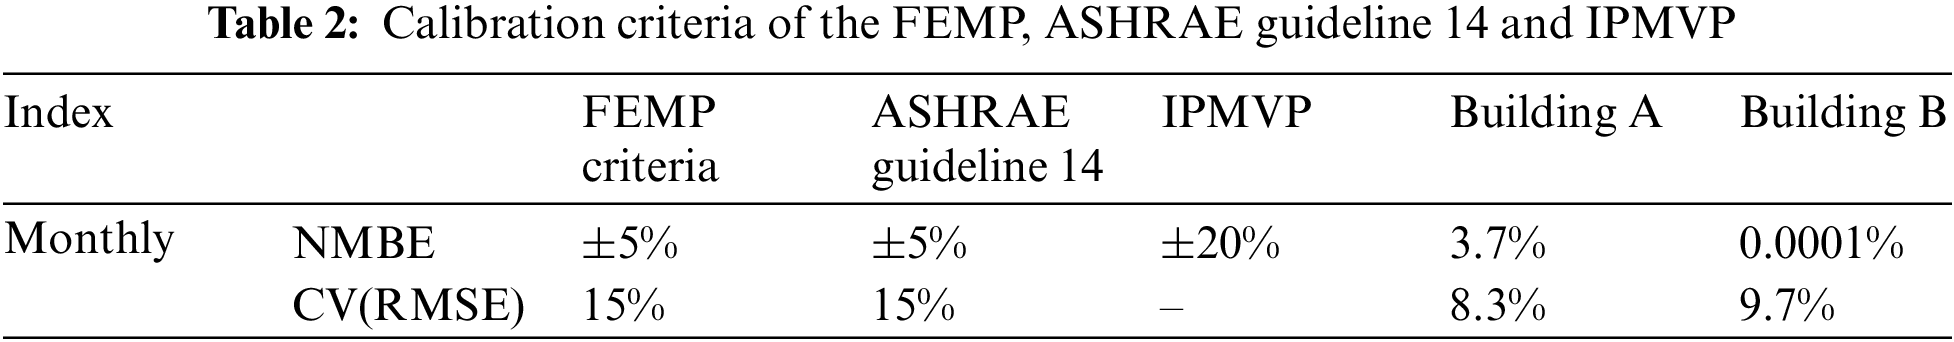
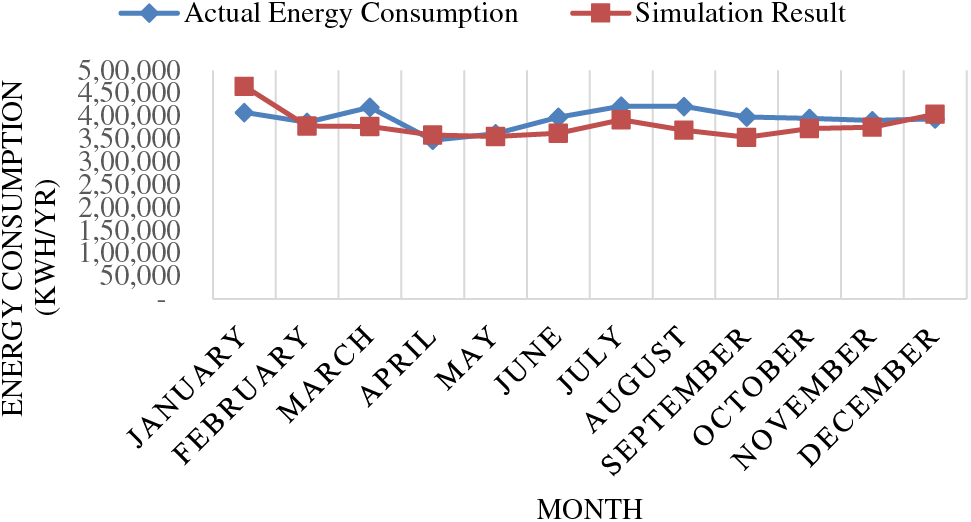
Figure 4: Actual vs. simulated energy consumption of building A
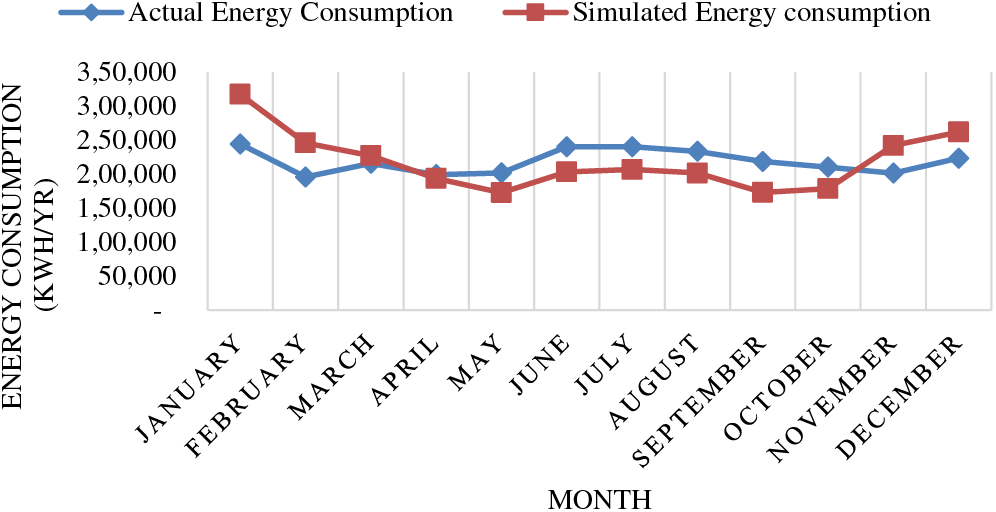
Figure 5: Actual vs. simulated energy consumption of building B
After the building model is fine-tuned, the selected building parameters’ impact on the building’s energy consumption is evaluated. The values for the parameters are varied for two levels. These values are given in Table 3.
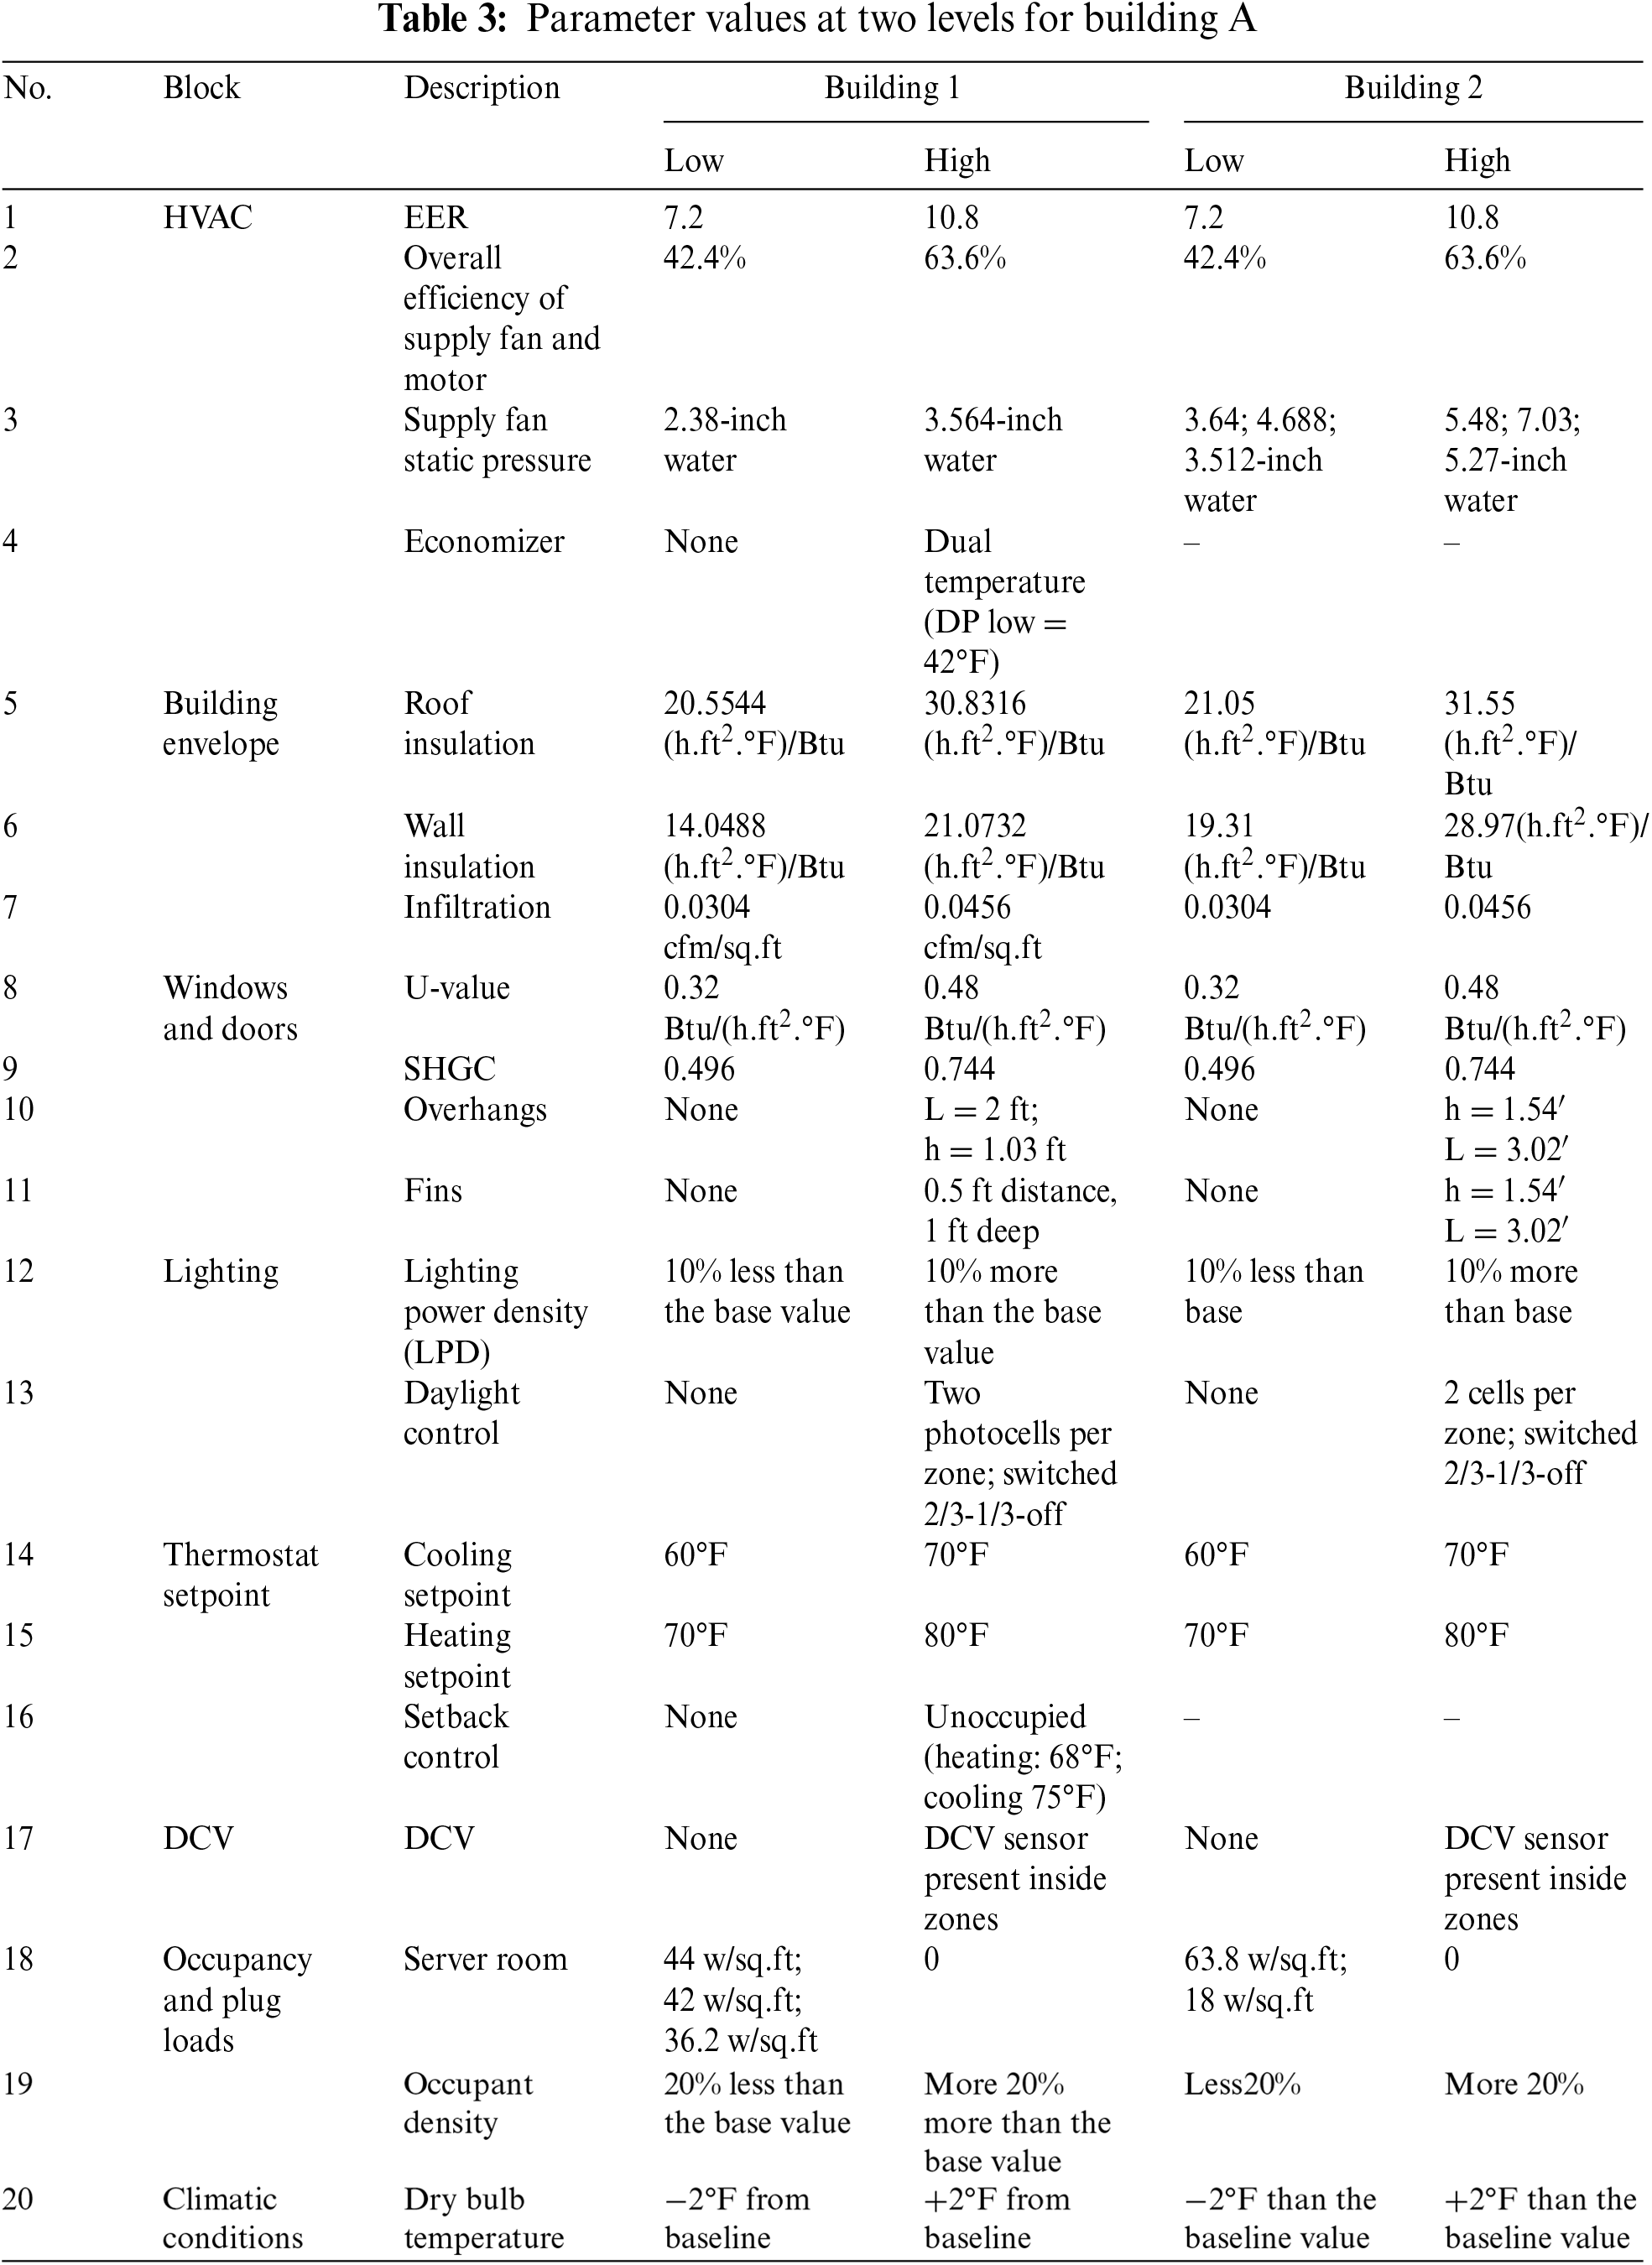
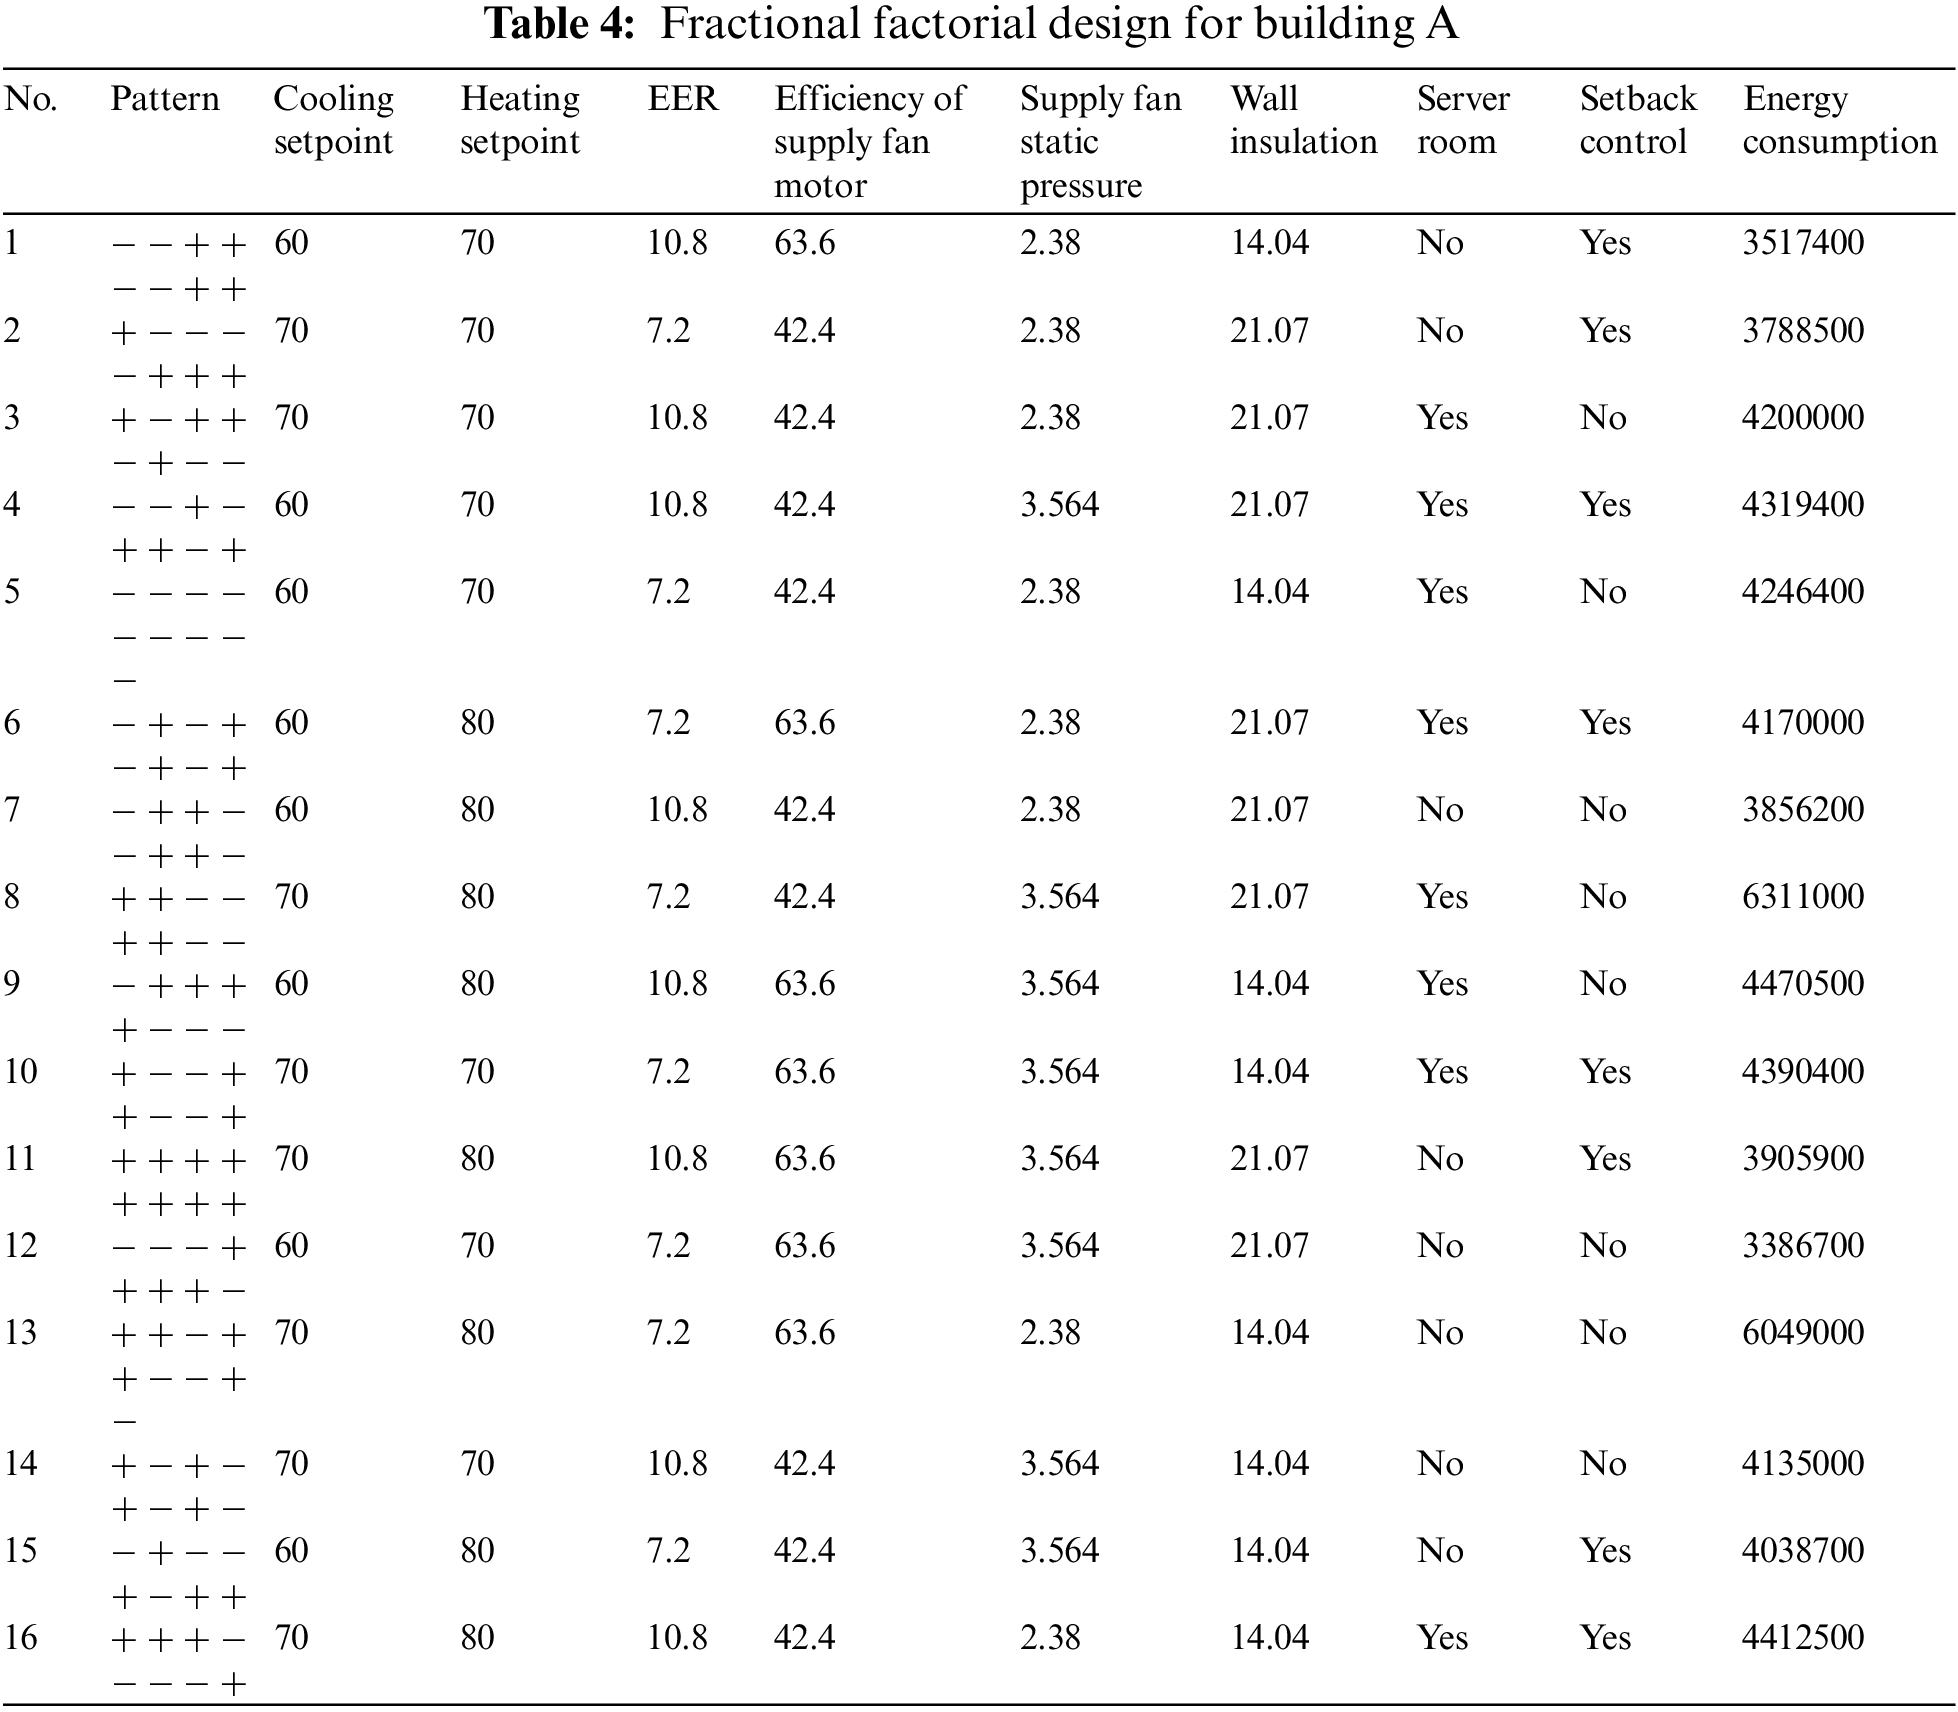
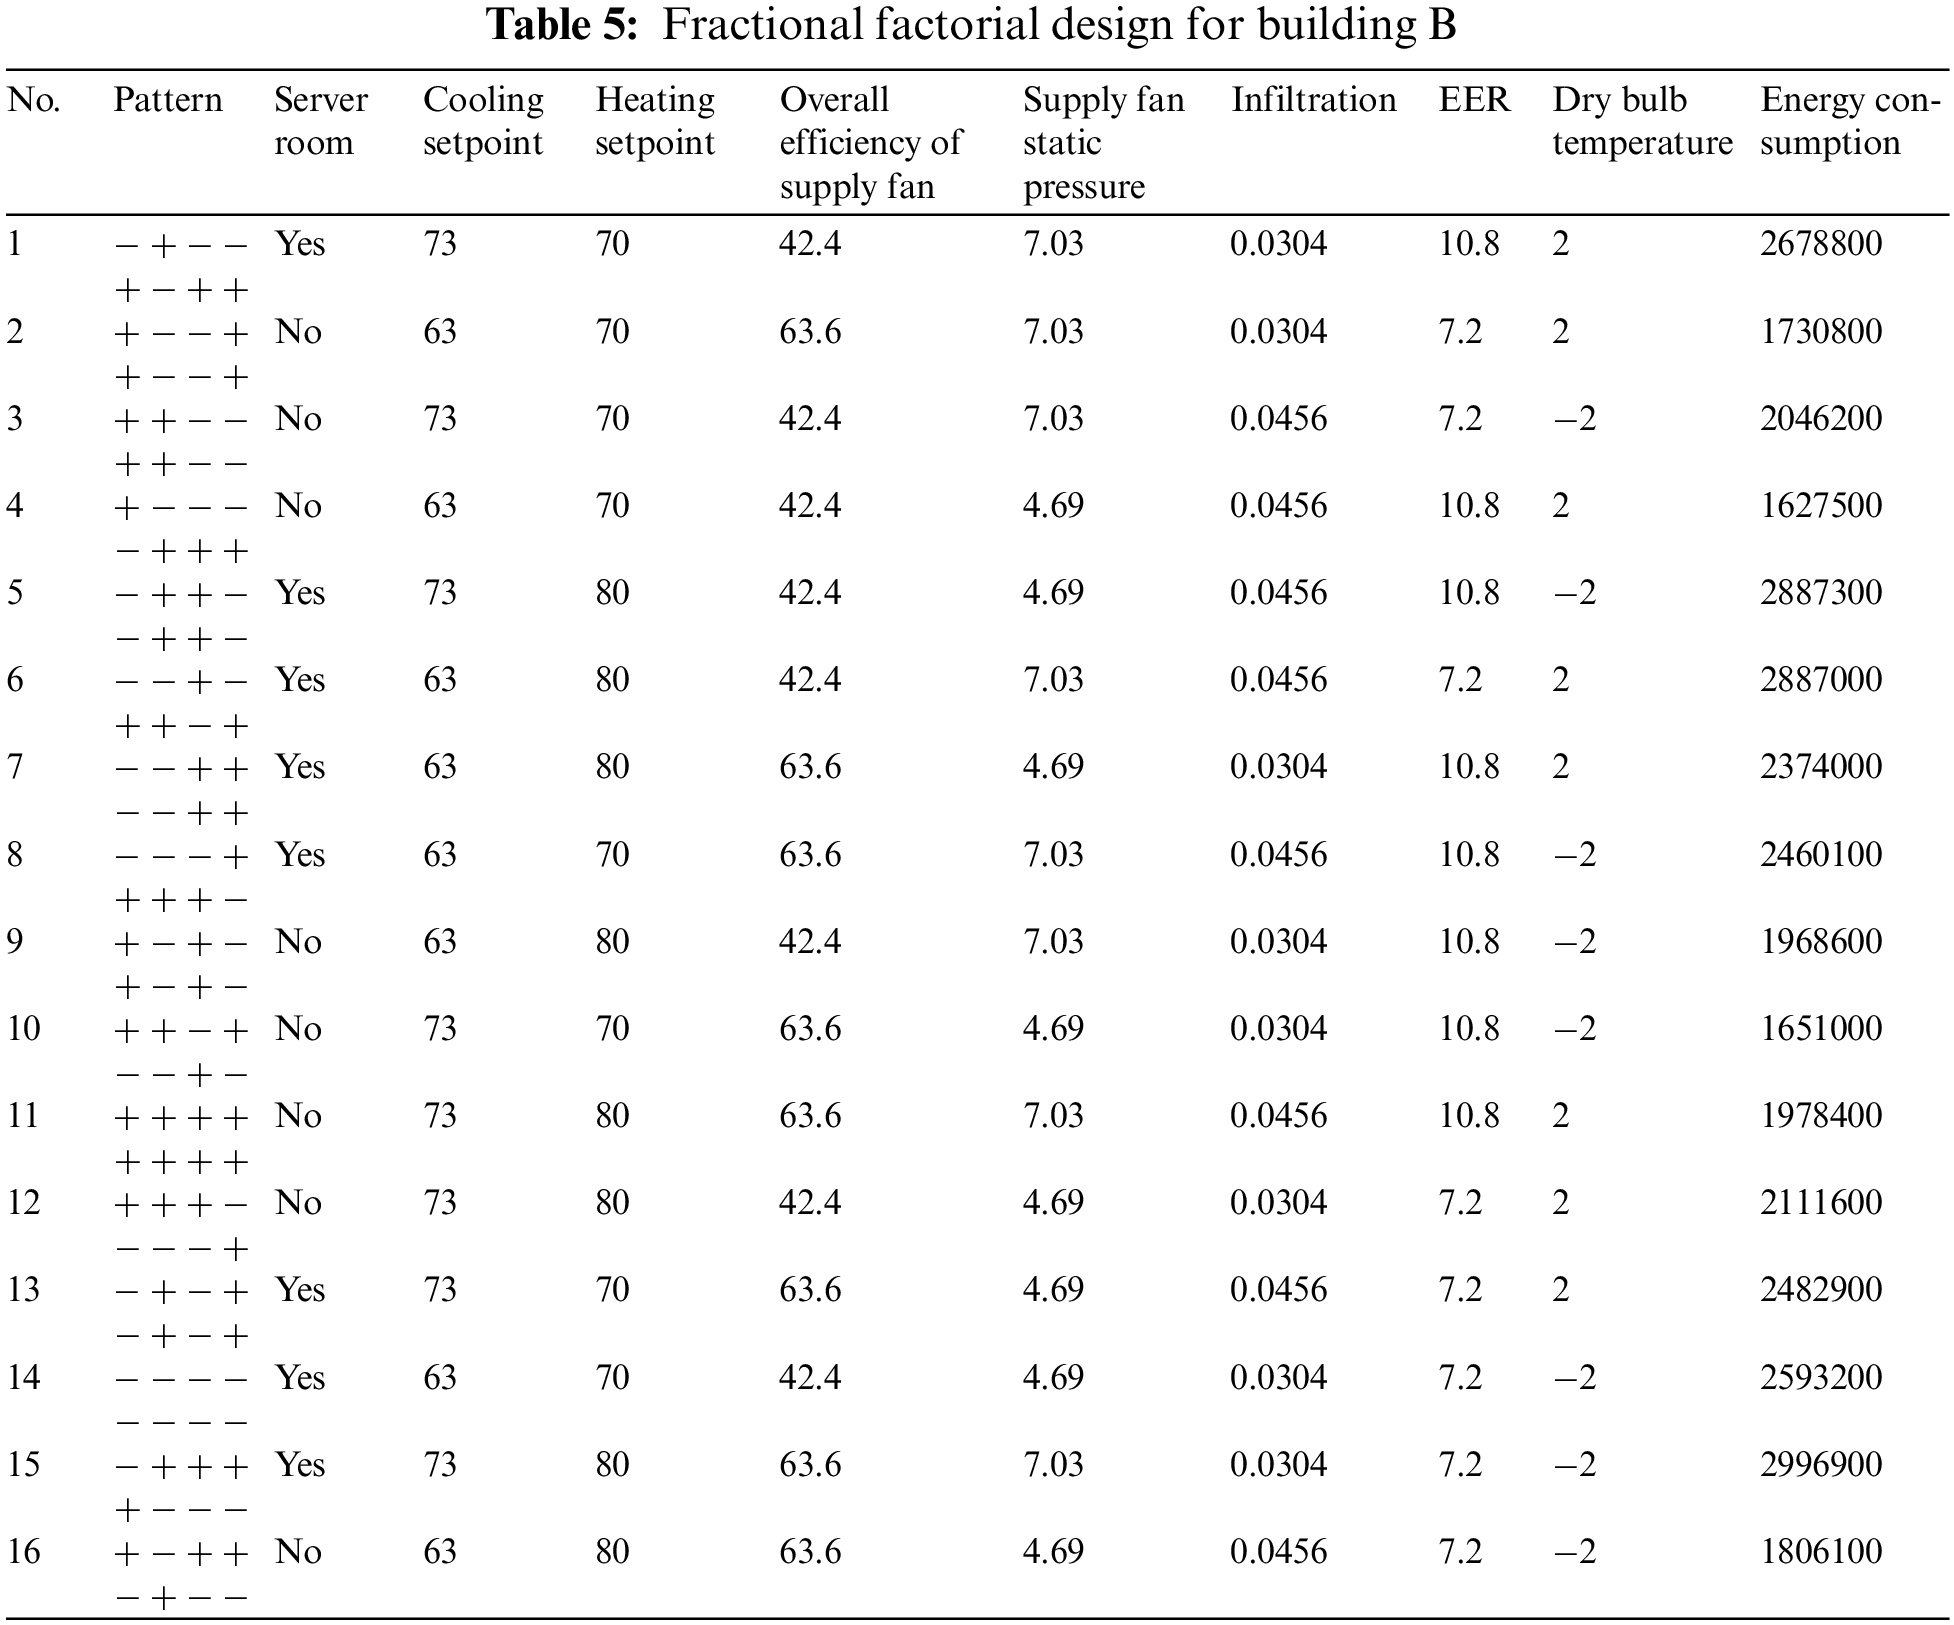
Two sensitivity analysis methods were used to evaluate the impact of different parameters on the energy performance of two buildings. The percentage change method was used as a screening method to identify the eight parameters with the highest impact on building energy performance. The input values for the parameters are varied by ±20% to get the low-value and high-value. Parameters like heating setpoint and cooling setpoint, the setpoints are varied by ±5°F from the baseline value. Whereas outdoor dry bulb temperature varies by ±2°F from the baseline value. The fractional factorial design was used to evaluate the significance of the eight selected parameters and some of the interaction terms between the parameters. Full-Fractional Design was more appropriate to determine the effect of all the interaction terms, but it would require a huge number of simulations runs. The fractional factorial design provided the two-level interaction terms between the most significant parameters, and the impact of higher-level interaction terms were estimated to be insignificant. Tables 4 and 5 show the fractional factorial design used to evaluate the relative significance of eight different parameters for building A and building B, respectively.
3.5 Assumptions and Limitation
The study is based on several assumptions and has certain limitations. Firstly, due to the unavailability of historical weather data for the study location (Fairmont, WV) in eQUEST and EnergyPlus, weather data from the nearest town (Morgantown, WV) is used, which may not accurately represent current weather conditions. Secondly, the impact of equipment and furniture layout within rooms is assumed to be negligible, although different configurations could affect daylight controls and occupancy sensors. Thirdly, the assumption is that occupants consistently use the building as designed throughout the year, even though parameters may vary based on changing circumstances and needs. Fourthly, it is assumed that equipment operates according to specified schedules and manufacturer’s specifications. Lastly, since the building in question has minimal natural gas usage, the study needs to evaluate its impact.
4.1 Sensitivity Analysis Using Percentage Change Method
The results for low and high values of parameters when the parameters are varied independently are shown in Figs. 6 and 7 for building A and building B, respectively.
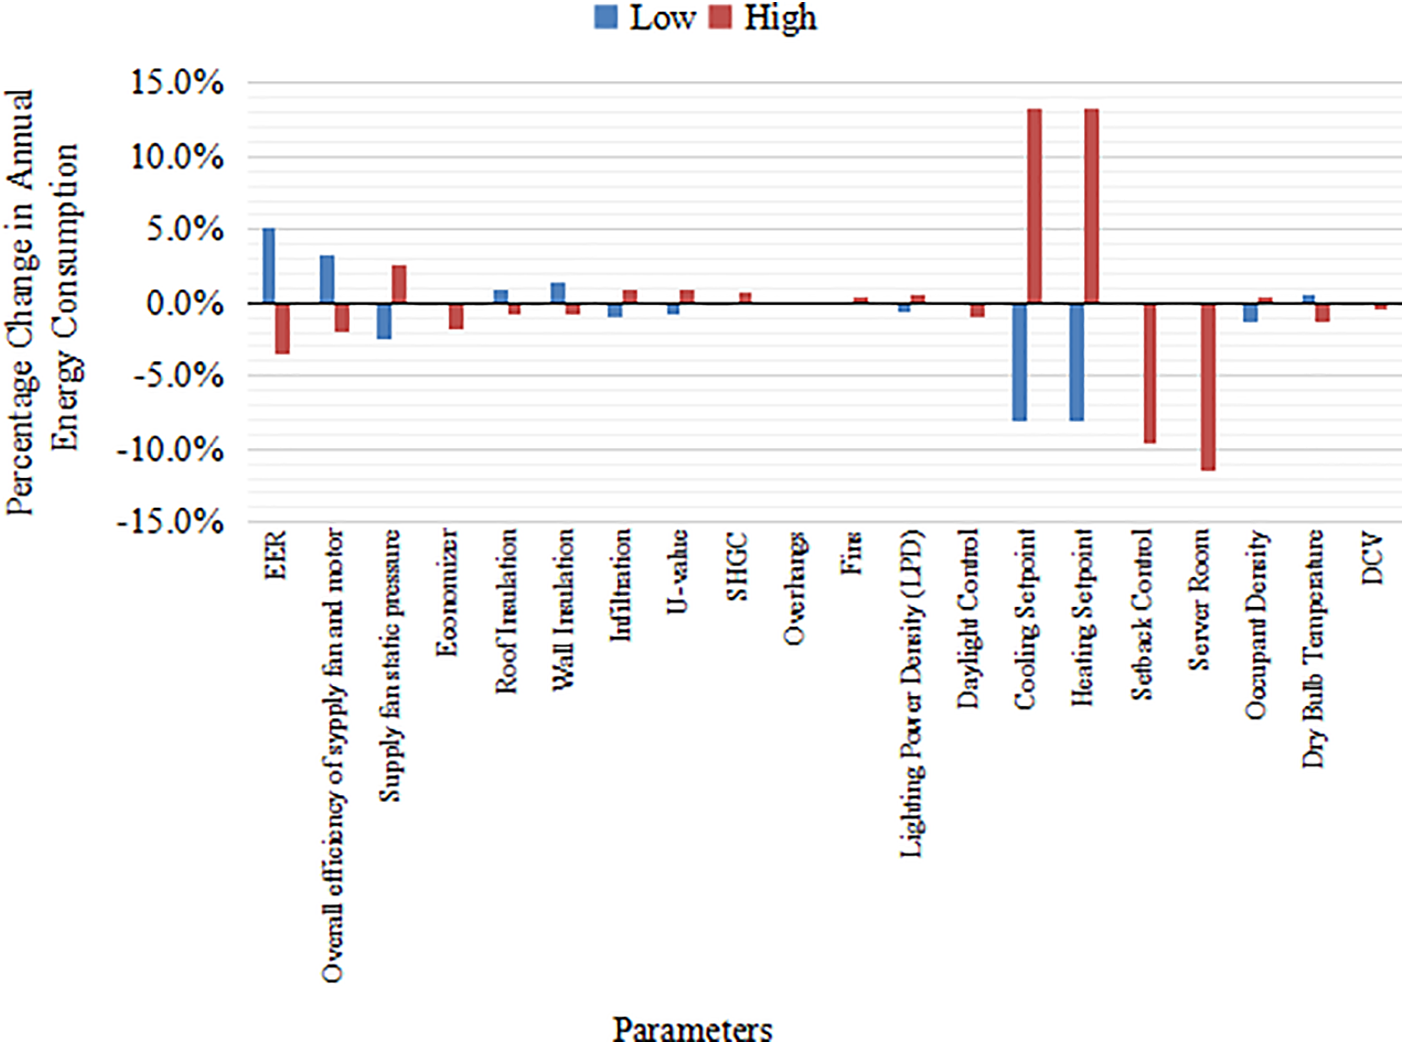
Figure 6: Sensitivity analysis of main parameters of building A
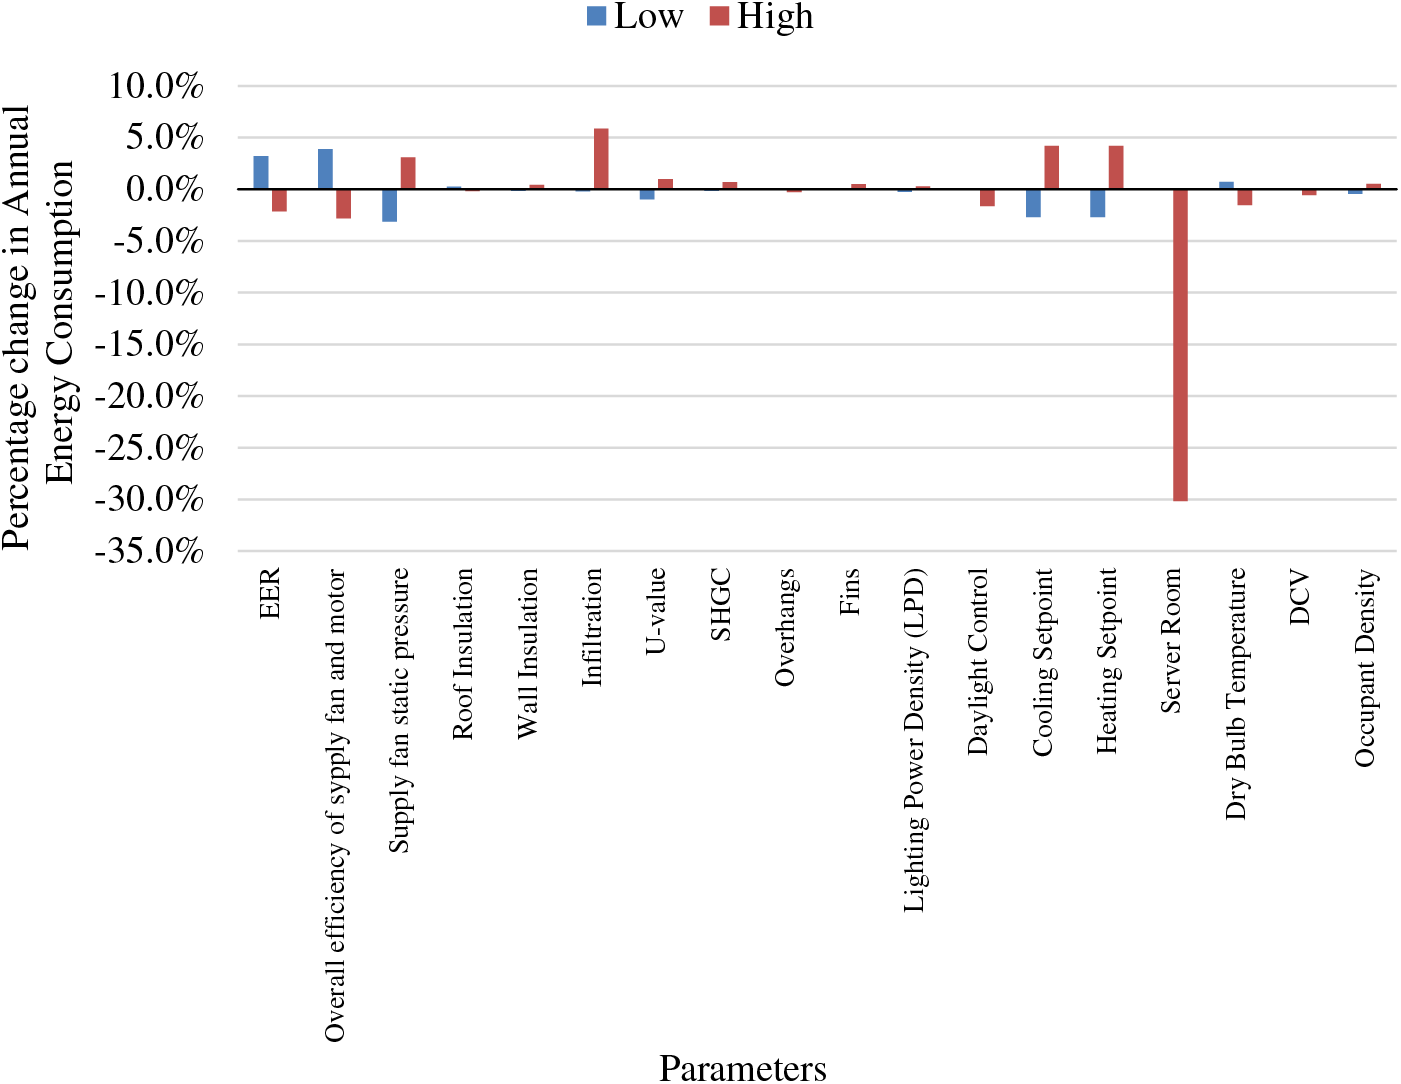
Figure 7: Sensitivity analysis of main parameters of building B
It can be seen from Fig. 6 that cooling setpoint, heating setpoint, server room, setback control, EER, the overall efficiency of supply fan and motor, supply fan static pressure have a higher impact on the energy performance of building A than other parameters like an infiltration, U-value, SHGC, overhangs, fins, economizer, roof insulation, wall insulation, LPD, daylight control, and outdoor dry bulb temperature. The top three parameters affecting the energy performance of building A are the cooling setpoint, heating setpoint, and server room.
It can be seen from Fig. 7 that the top three parameters affecting the energy performance of building B are server room, cooling setpoint, and heating setpoint.
4.2 Sensitivity Analysis Using Fractional Factorial Design
The fractional factorial analysis obtained in JMP software is given in Tables 6 and 7 for building A and building B, respectively.

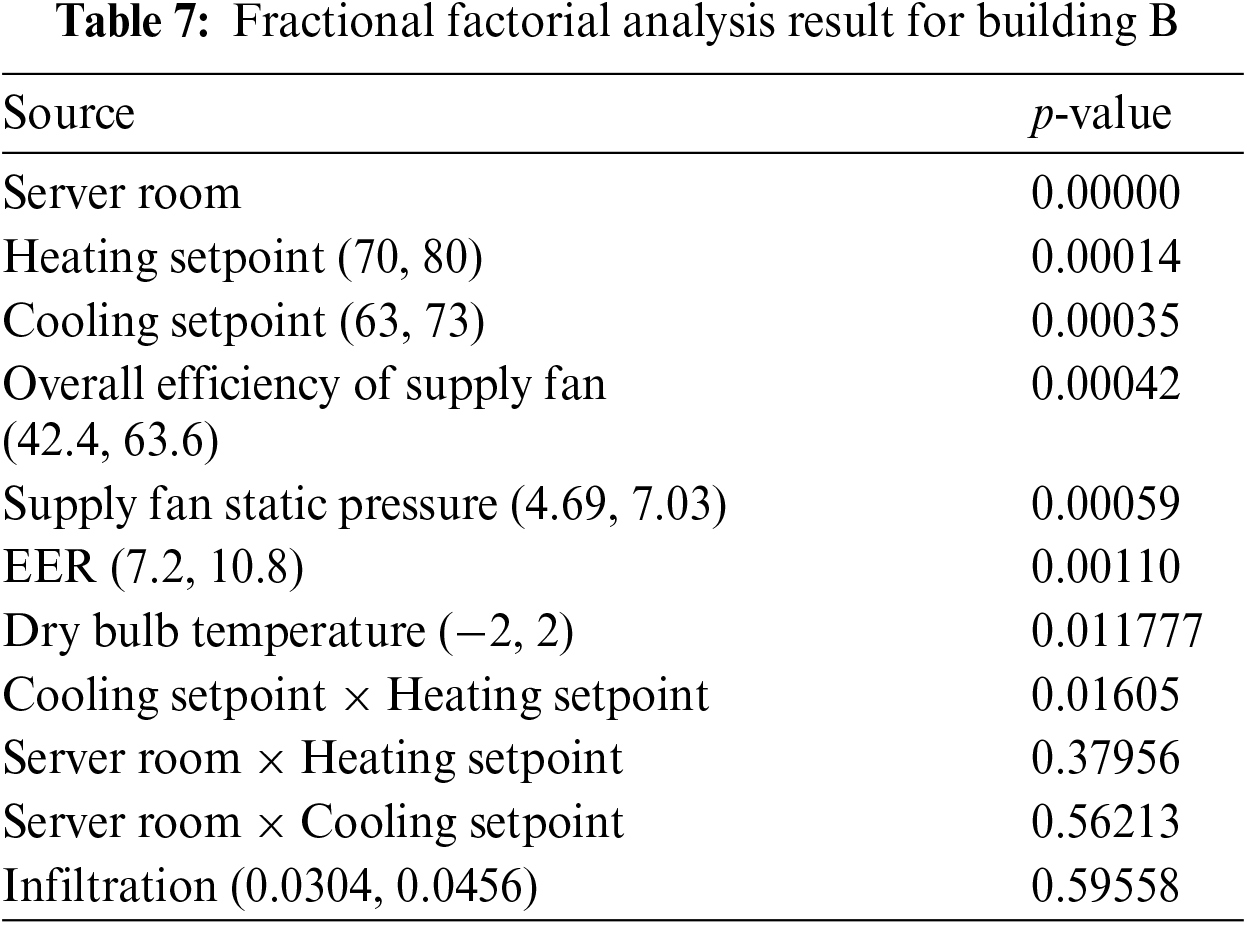
It can be seen from Table 8 that the top three parameters affecting the energy performance of building A are heating setpoint, cooling setpoint, and setback control. However, the interaction between cooling setpoint and setback control and cooling setpoint and EER have a greater impact than the setback control. It can be seen in Table 9 that the top three parameters affecting the energy performance of building B are server room, heating setpoint, and cooling setpoint.


In Tables 8 and 9, the impact of parameters is sorted from largest to smallest. It can be seen that the interaction terms cooling setpoint* setback control and cooling setpoint* heating setpoint have a significant impact on the energy performance of building A. For building B, the interaction terms do not have a significant impact on its energy performance. Table 10 compares the result obtained from using the percentage change method and fractional factorial design.
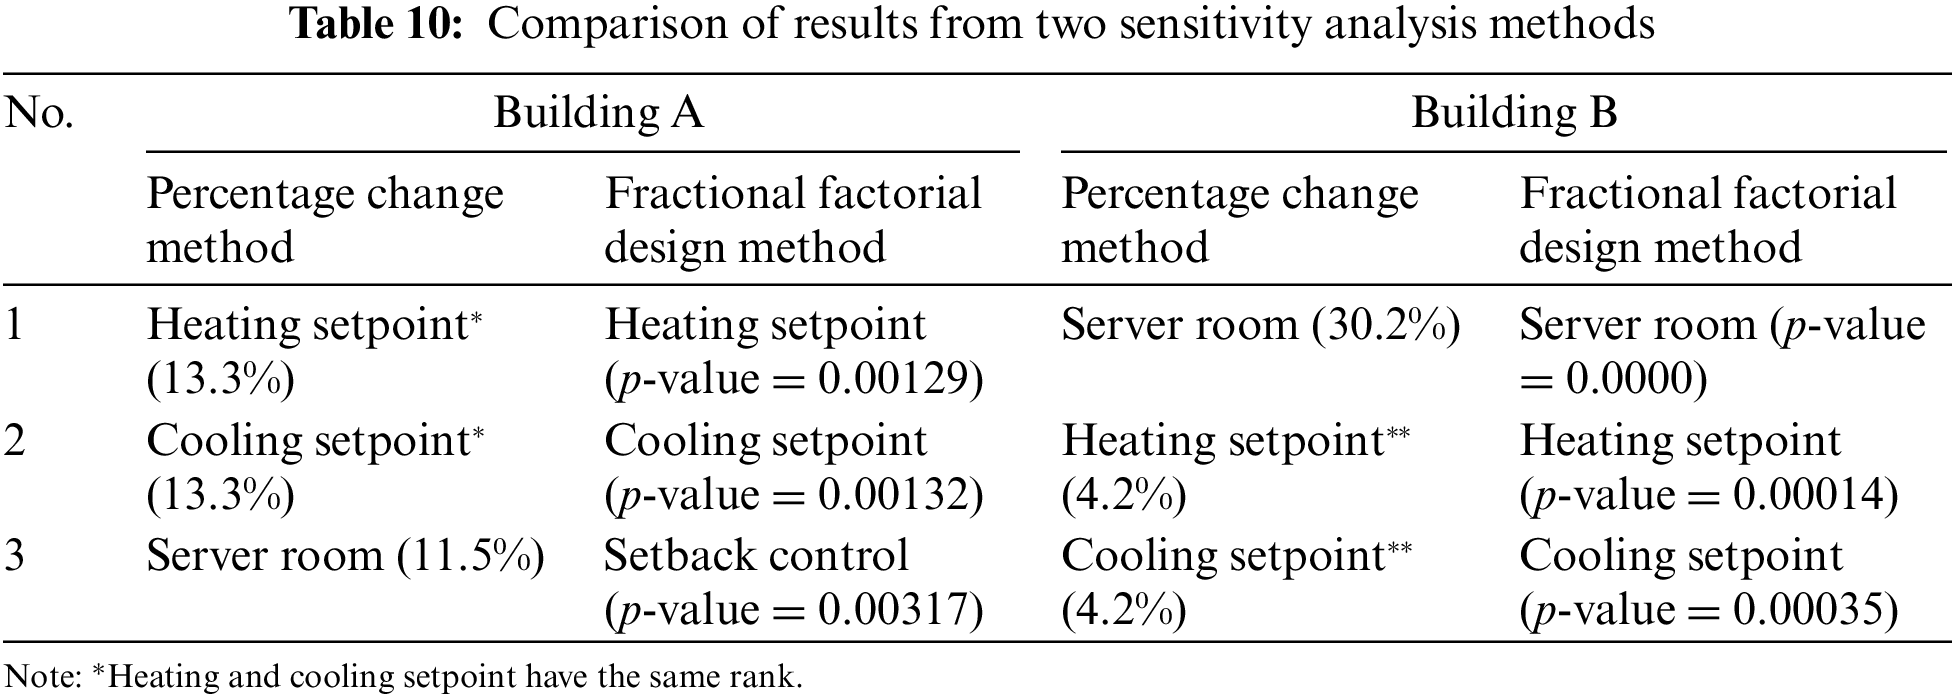
The results from both the sensitivity analysis method for both the buildings have heating and cooling setpoint among the top three parameters. For building A, both the methods show that the heating and cooling setpoint have the same impact on the energy performance of the building. However, the third parameter on the list of the two methods is different. For building B, the results are the same for both methods. Figs. 8 and 9 show how the energy consumption of building A and building B will vary when different parameters change.
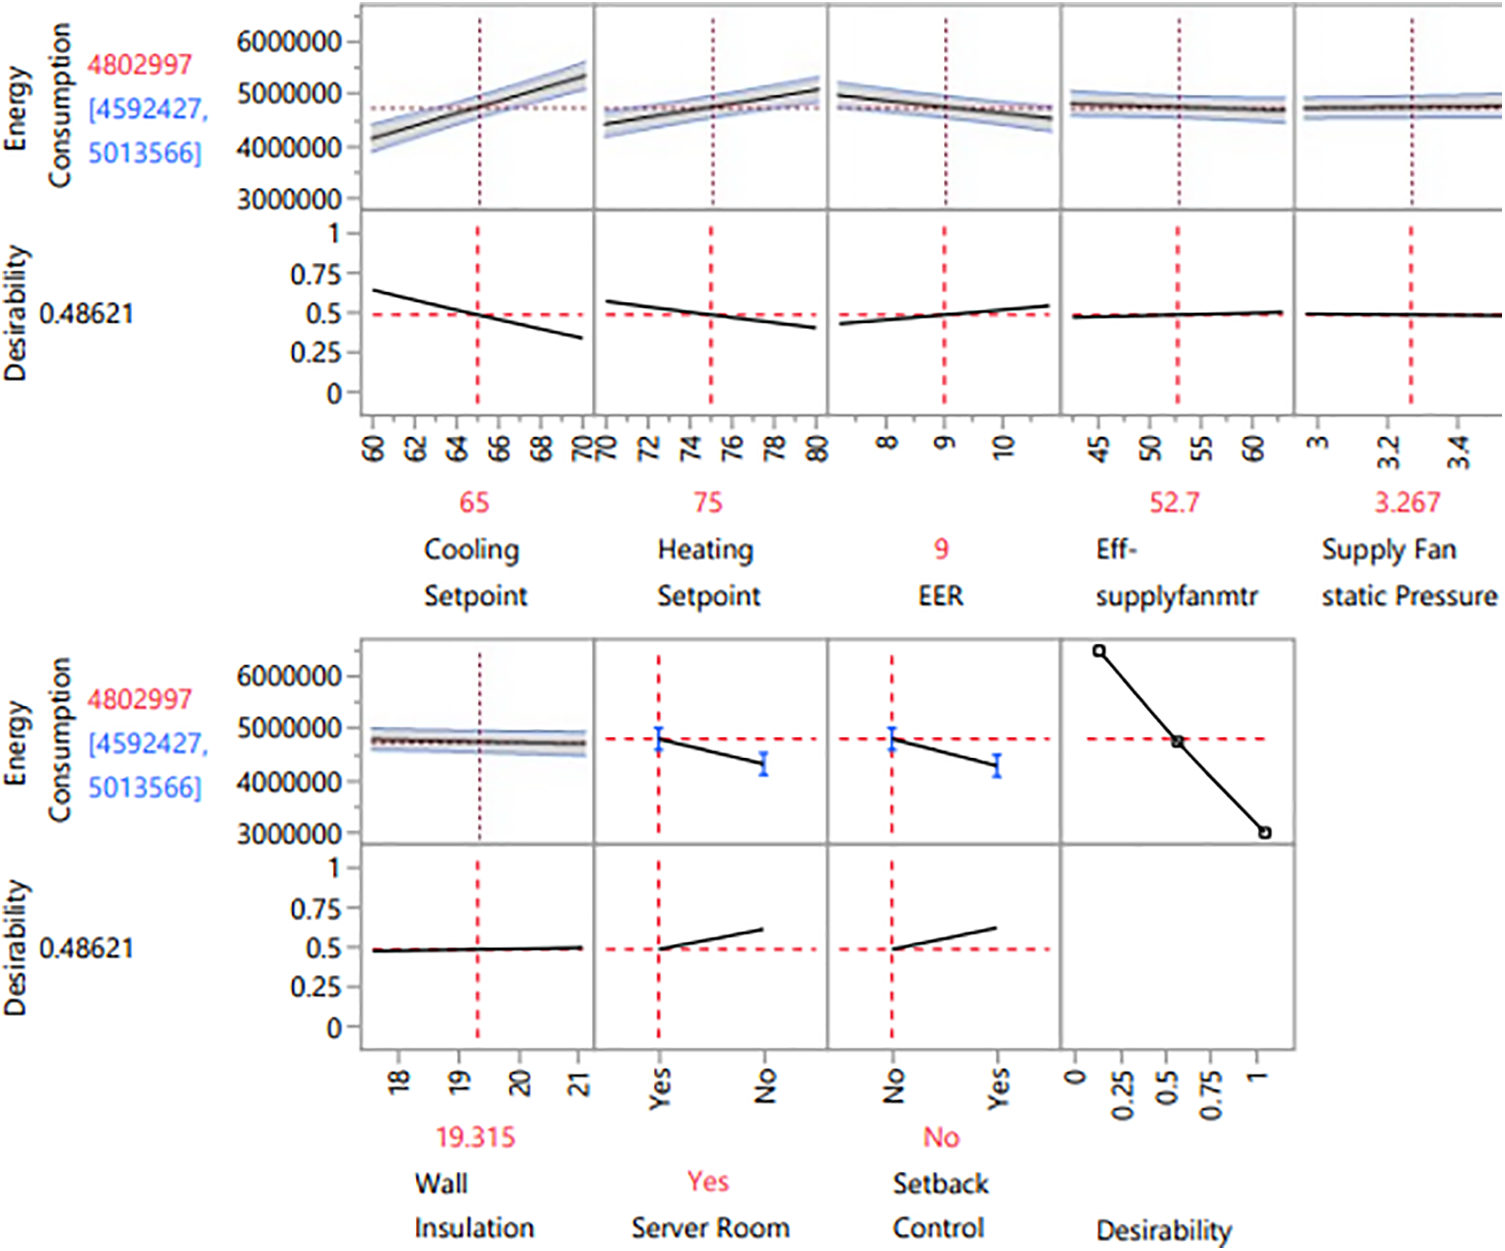
Figure 8: Prediction profile for building A
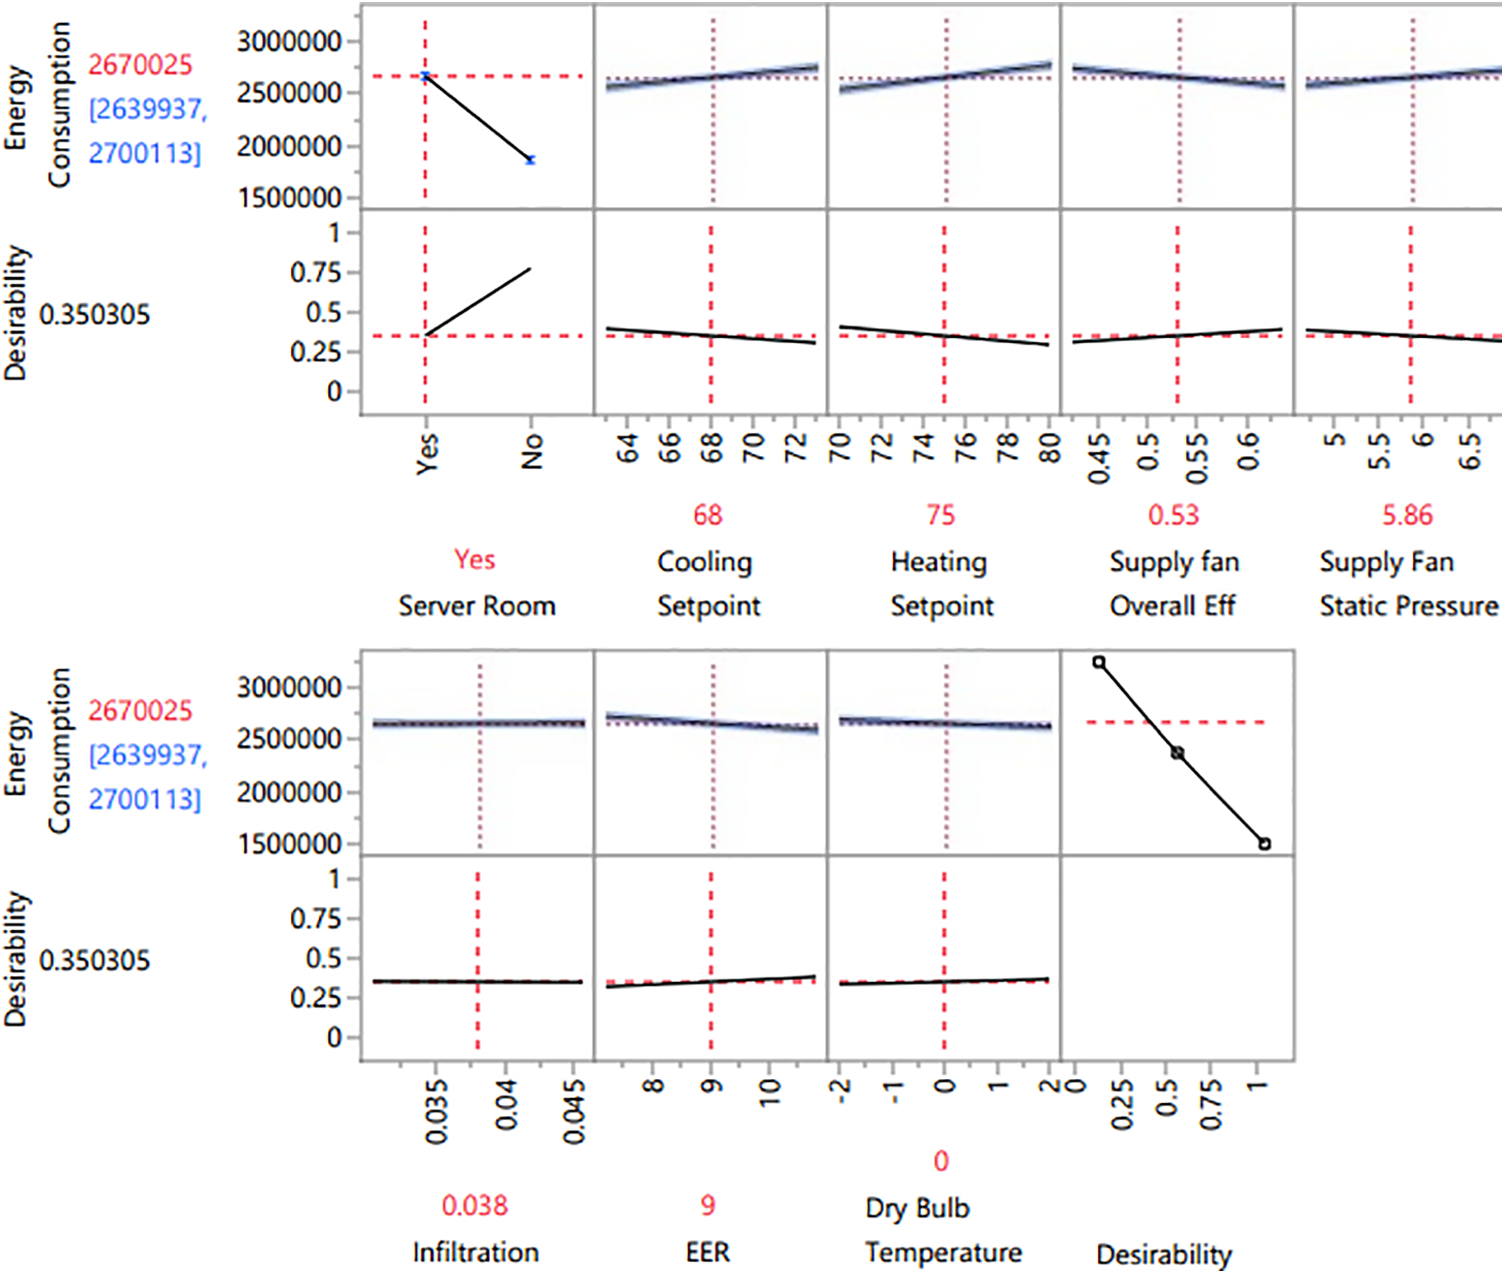
Figure 9: Prediction profile for building B
Fig. 8 shows that the energy performance of building A varies more steeply with changes in heating setpoint, cooling setpoint, server room, and setback control. Fig. 9 shows that the energy performance of building B varies more steeply with changes in values of the server room. Compared to the effect of the server room, changes in other parameters have significantly less effect on the energy performance of building B.
Figs. 10 and 11 show the interaction plot obtained from JMP software for building A and building B parameters.
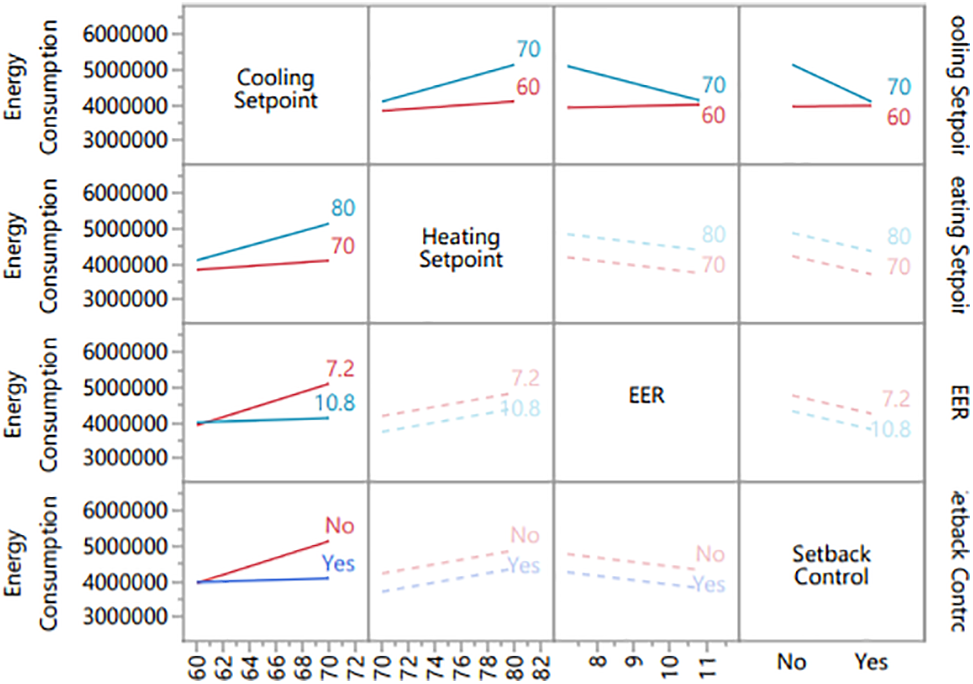
Figure 10: Interaction plot for parameters of building A
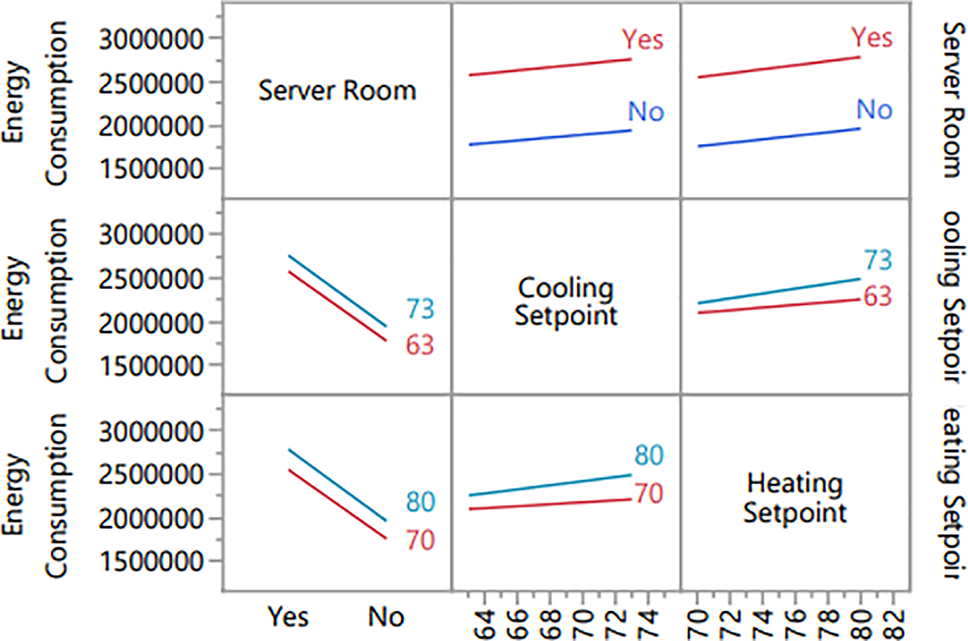
Figure 11: Interaction plot for parameters of building B
The interaction profile for building A shows that the effect of changing the cooling setpoint is more significant when there is no setback control compared to when setback control was present. Also, the effect of changing the cooling setpoint is more when EER is at low level and heating setpoint is at high level. When the cooling setpoint is at high level, the effect of changing heating setpoint, EER and setback control is more than when the cooling setpoint is at low level.
The interaction profile for building B shows that energy consumption is significantly lower when the server room is at a high level (when there is no server room) than at a low level. The energy consumption increases linearly when the cooling setpoint and heating setpoint is increased. This can be explained by the fact that the supply air is constant at 55°F so, increasing the cooling setpoint will make the heating coil heat the supply air to the cooling setpoint at a higher level.
In conclusion, this study identifies the top three building parameters with the highest impact on energy performance. Building A’s most influential parameters based on the percentage change method are the heating setpoint, cooling setpoint, and server room. From the fractional factorial design, the top three parameters are the heating setpoint (p-value = 0.00129), cooling setpoint (p-value = 0.00133), and setback control (p-value = 0.00317). For building B, the top three parameters from both methods are server room (p-value = 0.0000), heating setpoint (p-value = 0.00014), and cooling setpoint (p-value = 0.00035). Optimizing these parameters improves energy efficiency by 29% for building A and 35% for building B.
Furthermore, a 5-degree Fahrenheit change in cooling and heating setpoints results in a 13.3% energy consumption change for building A and a 4.2% change for building B. The absence of a server room reduces energy consumption by 11.5% for building A and 30.2% for building B. The findings also reveal significant interaction terms and the influence of building orientation and removing doors and windows on energy consumption. However, it is important to note that the results are specific to the studied buildings and may not be universally applicable. Future studies should involve a larger sample size and diverse building types to enhance generalizability.
Future work on this research study involves increasing the number of building parameters to investigate all the building parameters. A summary of possible forthcoming work relating to this study are listed below:
• In this study, only two buildings are modeled. Future research can model different building types in different climatic conditions to determine the impact of building parameters in different buildings and climatic conditions. The impact of building parameters can be different for the different building types and different climatic conditions.
• More building parameters can be studied in the research to perform comprehensive research.
• The building being modeled had meager gas bills. The facility had electric heating, and the natural gas was predominantly used for water heating only. Thus, the analysis of natural gas has been ignored in this study. Future research works can investigate the facility where natural gas is a significant portion of the utility bill.
• The study involves only one type of HVAC system. Future research can explore different types of HVAC systems.
Acknowledgement: The authors would like to express their sincere gratitude to the peer reviewers who generously dedicated their time and expertise to review and provide constructive feedback on this research paper. Their insightful comments and suggestions have significantly enhanced the quality and rigor of this study.
Funding Statement: This research work was funded in part by the Industrial Assessment Center Project, supported by grants from the US Department of Energy and by the West Virginia Development Office.
Author Contributions: The authors confirm contribution to the paper as follows: study conception and design: Bhaskaran Gopalakrishnan, Saroj Lamichhane; data collection: Saroj Lamichhane; analysis and interpretation of results: Saroj Lamichhane, Roseline Mostafa; draft manuscript preparation: Roseline Mostafa, Saroj Lamichhane, Dayakar G. Devaru. All authors reviewed the results and approved the final version of the manuscript.
Availability of Data and Materials: The data that support the findings of this study are available from the corresponding author, Bhaskaran Gopalakrishnan, upon reasonable request.
Ethics Approval: Not applicable.
Conflicts of Interest: The authors declare that they have no conflicts of interest to report regarding the present study.
References
1. U.S. Energy Information Administration, International Energy Outlook 2019, “U.S. Department of Energy,” 2019. Accessed: Feb. 01, 2021. [Online]. Available: https://www.eia.gov/outlooks/ieo/pdf/ieo2019.pdf [Google Scholar]
2. U.S. Department of Energy, “Quadrennial technology review: An assessment of energy technology and research opportunity,” 2015. Accessed: Jun. 29, 2024. [Online]. Available: https://www.energy.gov/quadrennial-technology-review-0 [Google Scholar]
3. N. Fumo, “A review on the basics of building energy estimation,” Renew. Sustain. Energy Rev., vol. 31, no. 1, pp. 53–60, Mar. 2014. doi: 10.1016/j.rser.2013.11.040. [Google Scholar] [CrossRef]
4. H. S. Rallapalli, “A comparison of EnergyPlus and eQUEST whole building energy simulation results for a medium sized office building,” 2010. Accessed: May 3, 2021. [Online]. Available: https://keep.lib.asu.edu/items/149515 [Google Scholar]
5. U.S. Energy Information Administration, International Energy Outlook, “2018 Commercial buildings energy consumption survey preliminary results,” 2020. Accessed: Mar. 25, 2021. [Online]. Available: https://www.eia.gov/consumption/commercial/data/2018/pdf/CBECS_2018_Building_Characteristics_Flipbook.pdf [Google Scholar]
6. Energy Star, Facts and Stats. Accessed: Jun. 29, 2024. [Online]. Available: https://www.energystar.gov/buildings/about-us/facts-and-stats [Google Scholar]
7. P. Emrath, “More New Homes Needed to Replace Older Stock,” Aug. 2018. Accessed: Apr. 24, 2021. [Online]. Available: https://www.nahbclassic.org/generic.aspx?sectionID=734&genericContentID=263243 [Google Scholar]
8. D. Ardiyanto, M. Pipattanasomporn, S. Rahman, N. Hariyanto, and N. Suwarno, “Occupant-based HVAC set point interventions for energy savings in buildings,” in 2018 Int. Conf. Utility Exhibit Green Energy Sustain Develop (ICUE), Phuket, Thailand, Oct. 24–26, 2018, pp. 1–6. doi: 10.23919/ICUE-GESD.2018.8635595. [Google Scholar] [CrossRef]
9. K. Mininni, R. Hudson, M. Pommier, J. Okvath, and R. Anderson, “Energy audit at fort stanwix national monument,” in Multi-Discip. Sr. Des. Conf., 2009. [Google Scholar]
10. A. Dilshad, M. Bilal Khan, S. Sajid, and W. A. Khalil, “Energy performance analysis of a commercial building using eQUEST,” presented at the 1st Int. Conf. High Perform. Energy Effic. Build. Homes (HPEEBH 2018Aug. 2018. [Google Scholar]
11. M. Javad Dehghani, P. McManamon, and A. Ataei, “Toward building energy reduction through solar energy systems retrofit options: An equest model,” J. Appl. Eng. Sci., vol. 8, no. 1, pp. 53–60, May 2018. doi: 10.2478/jaes-2018-0007. [Google Scholar] [CrossRef]
12. J. Song, X. Zhang, and X. Meng, “Simulation and analysis of a university library energy consumption based on eQUEST,” Procedia Eng., vol. 121, pp. 1382–1388, 2015. doi: 10.1016/j.proeng.2015.09.028. [Google Scholar] [CrossRef]
13. M. -T. Ke, C. -H. Yeh, and J. -T. Jian, “Analysis of building energy consumption parameters and energy savings measurement and verification by applying eQUEST software,” Energy Build., vol. 61, pp. 100–107, Jun. 2013. doi: 10.1016/j.enbuild.2013.02.012. [Google Scholar] [CrossRef]
14. Y. Ye, K. Hinkelman, Y. Lou, W. Zuo, G. Wang and J. Zhang, “Evaluating the energy impact potential of energy efficiency measures for retrofit applications: A case study with U.S. medium office buildings,” Build. Simul., vol. 14, no. 5, pp. 1377–1393, Mar. 2021. doi: 10.1007/s12273-021-0765-z. [Google Scholar] [CrossRef]
15. American Society of Heating, Refrigerating and Air-Conditioning Engineers (ASHRAE“ANSI/ASHRAE/IES Standard 90.1-2007: Energy standard for buildings except low-rise residential buildings,” 2009. Accessed: Mar. 01, 2021. [Online]. Available: https://www.ashrae.org/File%20Library/Technical%20Resources/Standards%20and%20Guidelines/Standards%20Addenda/90-1-2007/90_1_2007_bu.pdf [Google Scholar]
16. P. Raftery, M. M. Keane, and A. Costa, “Calibration of a detailed simulation model to energy monitoring system data: A methodology and case study,” in Build. Simulat 2009, Glasgow, Scotland, IBPSA, 2009, pp. 1199–1204. Accessed: Feb. 20, 2021. [Online]. Available: https://www.aivc.org/resource/calibration-detailed-simulation-model-energy-monitoring-system-data-methodology-and-case [Google Scholar]
17. A. Dutta and A. Samanta, “Determining factor/s of window glazing regarding reduction in electrical energy consumption,” J. Energy Resources Technol., vol. 142, no. 3, Oct. 2019. doi: 10.1115/1.4044888. [Google Scholar] [CrossRef]
18. A. Dutta, “Passive design and performance evaluation of building using e-Quest: A case study,” Int. Des. J., no. 1, 2013. Accessed: Feb. 15, 2021. [Online]. Available: https://www.researchgate.net/publication/331970753_Passive_design_and_performance_evaluation_of_building_using_e-Quest_a_case_study [Google Scholar]
19. B. Ghobadian, C. Tzivanidis, A. Kouvari, and K. A. Antonopoulos, “Comparison of heating and cooling loads of a typical building with TRNSYS and eQUEST,” Energy, Transp. Glob. warm., vol. 6, no. 3, pp. 327–338, Jan. 2016. doi: 10.1007/978-3-319-30127-3_25. [Google Scholar] [CrossRef]
20. J. Kneifel, “Benefits and costs of energy standard adoption in new commercial buildings [National institute of standards and technology (NIST) special publication SP-1147],” in Nat. Inst. Standards Technol., 2013. Accessed: Apr. 14, 2021. [Online]. Available: https://nvlpubs.nist.gov/nistpubs/SpecialPublications/NIST.SP.1147.pdf [Google Scholar]
21. G. Holness, “On the path to net zero, how do we get there from here?,” ASHRAE J., vol. 53, no. 6, pp. 50–60, 2011. [Google Scholar]
22. Energy Star, “Retrocommissioning,” in Energy Star Building Manual, U.S. Environmental Protection Agency, 2007. Accessed: Apr. 21, 2021. [Online]. Available: https://www.energystar.gov/sites/default/files/buildings/tools/EPA_BUM_CH5_RetroComm.pdf [Google Scholar]
23. ASHRAE, ASHRAE Standard 90.1-2022 Receives Model Energy Code Determination from the DOE. Mar. 2024. Accessed: Jul. 18, 2024. [Online]. Available: https://www.ashrae.org/about/news/2024/-energy-code-determin-ashrae-standard-90-1-2022-receives-modelation-from-the-doe#:~:text=The%20standard%20achieved%20this%20determination,as%20%E2%80%9Cnet%E2%80%9D%20savings [Google Scholar]
24. J. Amann, “Retrocommissioning: Program strategies to capture energy savings in existing buildings,” in Am. Counc. Energy-Effic. Econ. (ACEEE), 2003. Accessed: Jun. 29, 2024. [Online]. Available: https://www.aceee.org/research-report/a035 [Google Scholar]
25. J. Roberts and B. Tso, “Do savings from retrocommissioning last? results from an effective useful life study,” in Am Counc. Energy Effic. Econ., Washington, DC, USA, 2010. [Google Scholar]
26. G. Eleftheriadis and M. Hamdy, “Impact of building envelope and mechanical component degradation on the whole building performance: A review paper,” Energy Proc., vol. 132, pp. 321–326, Oct. 2017. doi: 10.1016/j.egypro.2017.09.739. [Google Scholar] [CrossRef]
27. K. Fenaughty and D. Parker, “Evaluation of air conditioning performance degradation: Opportunities from diagnostic methods,” in 2018 ACEEE Summer Stud. Energy Effic. Buildings, Washington, DC, USA, 2018. [Google Scholar]
28. S. Verbeke, A. Audenaert, and I. Verhaert, “Interlinking the effect of thermal mass and temperature control strategies in dwellings,” E3S Web Conf., vol. 111, no. 6, pp. 04065, 2019. doi: 10.1051/e3sconf/201911104065. [Google Scholar] [CrossRef]
29. K. W. Childs, G. E. Courville, and E. L. Bales, Thermal Mass Assessment: An Explanation of the Mechanisms by Which Building Mass Influences Heating and Cooling Energy Requirements, Oak Ridge, Tennessee: Oak Ridge National Laboratory, 1983. [Google Scholar]
30. T. Ahmad and A. Zakharanka, “The impact of degradation on a building’s energy performance in hot-humid climates,” Sustainability, vol. 15, no. 2, pp. 1–11, 2023. [Google Scholar]
Cite This Article
 Copyright © 2024 The Author(s). Published by Tech Science Press.
This work is licensed under a Creative Commons Attribution 4.0 International License , which permits unrestricted use, distribution, and reproduction in any medium, provided the original work is properly cited.
 Downloads
 Citation Tools