
 Submit a Paper
 Propose a Special lssue
 Open Access
ARTICLE

The Correlation between the Power Quality Indicators and Entropy Production Characteristics of Wind Power + Energy Storage Systems
1 School of Energy and Power Engineering, Inner Mongolia University of Technology, Hohhot, 010080, China
2 Ministry of Education Key Laboratory of Wind and Solar Energy Utilization Technology, Hohhot, 010080, China
3 School of Mechanical Engineering, Shanghai Institute of Electrical Engineering, Shanghai, 201306, China
4 School of Civil Engineering, Inner Mongolia University of Technology, Hohhot, 010051, China
* Corresponding Author: Boxin Zhang. Email:
(This article belongs to the Special Issue: Wind Energy Development and Utilization)
Energy Engineering 2024, 121(10), 2961-2979. https://doi.org/10.32604/ee.2024.041677
Received 01 May 2023; Accepted 05 September 2023; Issue published 11 September 2024
 View Full Text
 Download PDF
Abstract
Power quality improvements help guide and solve the problems of inefficient energy production and unstable power output in wind power systems. The purpose of this paper is mainly to explore the influence of different energy storage batteries on various power quality indicators by adding different energy storage devices to the simulated wind power system, and to explore the correlation between system entropy generation and various indicators, so as to provide a theoretical basis for directly improving power quality by reducing loss. A steady-state experiment was performed by replacing the wind wheel with an electric motor, and the output power qualities of the wind power system with and without energy storage were compared and analyzed. Moreover, the improvement effect of different energy storage devices on various indicators was obtained. Then, based on the entropy theory, the loss of the internal components of the wind power system generator is simulated and explored by Ansys software. Through the analysis of power quality evaluation indicators, such as current harmonic distortion rate, frequency deviation rate, and voltage fluctuation, the correlation between entropy production and each evaluation indicator was explored to investigate effective methods to improve power quality by reducing entropy production. The results showed that the current harmonic distortion rate, voltage fluctuation, voltage deviation, and system entropy production are positively correlated in the tests and that the power factor is negatively correlated with system entropy production. In the frequency range, the frequency deviation was not significantly correlated with the system entropy production.Keywords
Due to the current global environmental changes, the development of renewable and clean energy has become an essential part of achieving carbon neutrality. Wind power is an important component of renewable energy. In recent years, wind power has been vigorously promoted worldwide, and the global installed wind power capacity has been rapidly growing [1]. Off-grid wind power systems are characterized with low quality and unstable output power compared with other energy systems [2]. In a previous work [3], the harmonic robustness of a system was improved by developing innovative filtering methods. Increasing the convergence speed of a system’s controllers can allow it to become fast and responsive, thus improving the power quality of electric vehicle charging. Another study [4] proposed a Liapunov-based harmonic compensation and charging three-phase Shunt Active Power Filter (SAPF) operation as an interface between EV applications and energy grids without increasing the size of DC-link capacitors, and the proposed control algorithm could provide effective harmonic mitigation under various nonlinear loads (NLLs) and grid disturbances. In addition, a sliding-mode-based adaptive linear neuron (ADALINE)-proportional resonance (PR) control scheme [5] was proposed to improve the performance of the Vienna rectifier (VR); eliminate the harmonics and active power of source currents; eliminate ripples in dc-link voltages and battery currents; and improve the power quality of battery charging. All the above-mentioned works used control strategies or filtering methods to improve power quality; however, the installation of energy storage links in wind power systems plays an important role in suppressing power fluctuations and improving the output power quality of wind power systems. Thus, it is necessary to explore the role of different energy storage devices in improving the output power quality of wind power systems.
The entropy theory is mainly used in computer and medicine applications [6,7] and is involved in engineering thermodynamics. Moreover, it is excessively used in the evaluation methods and detection methods related to wind power systems [8,9]. However, in wind power systems, the correlations between output power quality, system entropy, and power quality indicators have rarely been analyzed. It is clear from the second law of thermodynamics that the generation of system entropy is closely related to system losses. Therefore, the correlation between power quality and the generation of system entropy has been studied to explore effective ways of improving power quality by directly reducing system losses. Generally, this approach is more direct than the existing methods of improving power quality.
In this work, the output power quality of a wind power system was taken as a research object, and a comparative experiment on whether there is an energy storage device was performed. The concept of entropy in engineering thermodynamics is herein introduced, and the influence of adding different energy storage systems on output power quality is discussed. Moreover, with the aim of providing a basis for exploring effective ways of improving power quality by reducing the generation of system entropy, the correlation between system entropy and power quality indicators was explored using the losses of each system operation component as a link.
2 Mathematical Model of Entropy Production of Wind Power System
There are various physical processes and coupling relationships during the operation of wind power systems. Among them, the degree of progress and the evaluation criteria of processes such as unavoidable loss, convection heat transfer, field-circuit coupling, and heat conduction are different. Entropy can be used as a different kind of physical process and is also a unified benchmark for process analysis and research. A wind power system is a thermodynamics-based work–heat conversion system, and the generation of losses is inevitable. The second law of thermodynamics shows that entropy is a physical quantity closely related to losses. Thus, wind power systems are accompanied with dynamic entropy generation changes in their course of operation [10].
The entropy generation in the system consists of four parts: viscosity entropy generation, turbulence entropy generation, wall entropy generation and temperature entropy generation.
Above, s represents entropy yield; u, v, w indicate velocity in three directions (x, y, z);
As a state function, the above formula (1) is time averaged, and the time averaged equation is as follows:
In the above formula, Φ/T and Φ/T2 represent entropy generation. The first term represents the entropy generation caused by friction dissipation in the transmission of each component of the generator, and the second term represents the irreversible loss caused by temperature difference in the heat transfer process. Therefore, the variation law of entropy generation in wind power system is closely related to the distribution of dynamic temperature field. Due to the large dynamic temperature measurement error of the generator, this study is elaborated with the help of Ansys temperature field simulation results. In the performed experiment in this study, the temperature of the experimental environment was kept constant. Thus, the environmental convection effect on the system’s entropy production could be ignored. Simulation of wind power systems by electric motors driving generators. Referring to the definition of a thermodynamically isolated system and the internal working conditions of a wind turbine, the generator and output ends are regarded as an isolated system. Since the operation process is irreversible, according to the second law of thermodynamics, the entropy increase of a system follows
In this formula, Sgf is the entropy production of the fluid working medium inside the generator; Sg1 is the entropy production caused by various losses, including copper loss, iron loss, eddy current loss, mechanical loss, and vibration loss, etc; Sgh is the generator to the wake flow Entropy production in the field heat dissipation process; qm is the mass flow; and S1 and S2 are the entropy values of the inlet and outlet of the watershed [12,13].
The expressions of Sg1 and Sgh are:
In the formula, dP is the power loss, qh is the heat exchange between solids, T1 is the experimental ambient temperature, and T2 is the temperature where the loss occurs. By introducing a heat transfer coefficient of
The entropy production in the heat dissipation process in the flow field of the generator is:
In the formula, λ is the thermal conductivity of the fluid, and the unit is W/(m2 · k).
The definition of the minimum value of entropy production in a wind power system is a non-equilibrium steady state, and there is a dissipative process with a non-zero rate, making the system an unbalanced dissipative system. If the external constraints do not allow the system to reach an equilibrium state, the system settles for the next best option and is evolved to a steady state with a minimal entropy generation value. As far as entropy itself is concerned, different fields have different opinions. For organisms and ecosystems, entropy has a positive side. However, regarding the efficiency of energy production and the use of wind power systems, an entropy increase can result in energy depreciation and lower efficiency. It can be seen from the third law of thermodynamics that “zero entropy” does not exist. Therefore, in this study, the power quality of a wind power system was improved after adding different energy storage systems. Then, a correlation between power quality indicators and entropy generation in wind power systems was discussed, where a wind power system loss was used as a medium.
3 Analysis of the Internal Losses of Generators
The Ansys simulation software was used to establish a three-dimensional transient model of the wind turbine, and the temperature distribution of the stator, rotor, permanent magnet, and windings inside the generator was simulated and calculated. The thermal conductivity of the stator and rotor, permanent magnets, and windings was set to 48 (W/m*°C), 20 (W/m*°C), and 380 (W/m*°C), respectively, and the ambient temperature was set to 20°C. The losses caused by the temperature increase of each component of the generator at different rotational speeds were derived through simulations to provide a basis for analyzing the correlation between the entropy production and power quality indicators, and the calculation results were demonstrated, as shown in the figures below.
It can be seen from Fig. 1a that the temperature increase outside the stator was lower than that inside it, as the inside part of the stator is connected to the winding by insulating glue, and the thermal conductivity of the edge glue is small. However, the outside of the stator is connected to the casing, and the heat is transferred to the motor casing and then directly taken away by external air. The heat dissipation capacity is strong; thus, the temperature increase of the stator presents a gradual reduction distribution from the tooth to the outside. Fig. 1b shows that the temperature of the inner layer of the winding is higher than that of the outer layer and that the temperature of the end is highest, as the protruding part of the end of the winding is located in air, and due to the low thermal conductivity of air, the heat dissipation effect is poor, resulting in higher temperature. Moreover, the temperature of the outer winding is lower than that of the inner winding, as the heat dissipation capacity of the outer winding is better than that of the inner winding. Fig. 1c shows that the highest temperature of the rotor is at its axial middle and that the temperature gradually decreases from the axial middle to the outside, showing an irregular boundary distribution with the low temperature at both ends and high temperature at the middle. Fig. 1d shows that the maximum temperature of a permanent magnet occurs at its axial middle, as the heat generated by the vortex loss of the permanent magnet is mainly dissipated through the rotor core and air gap to the stator core, and the heat dissipation effect is poor.
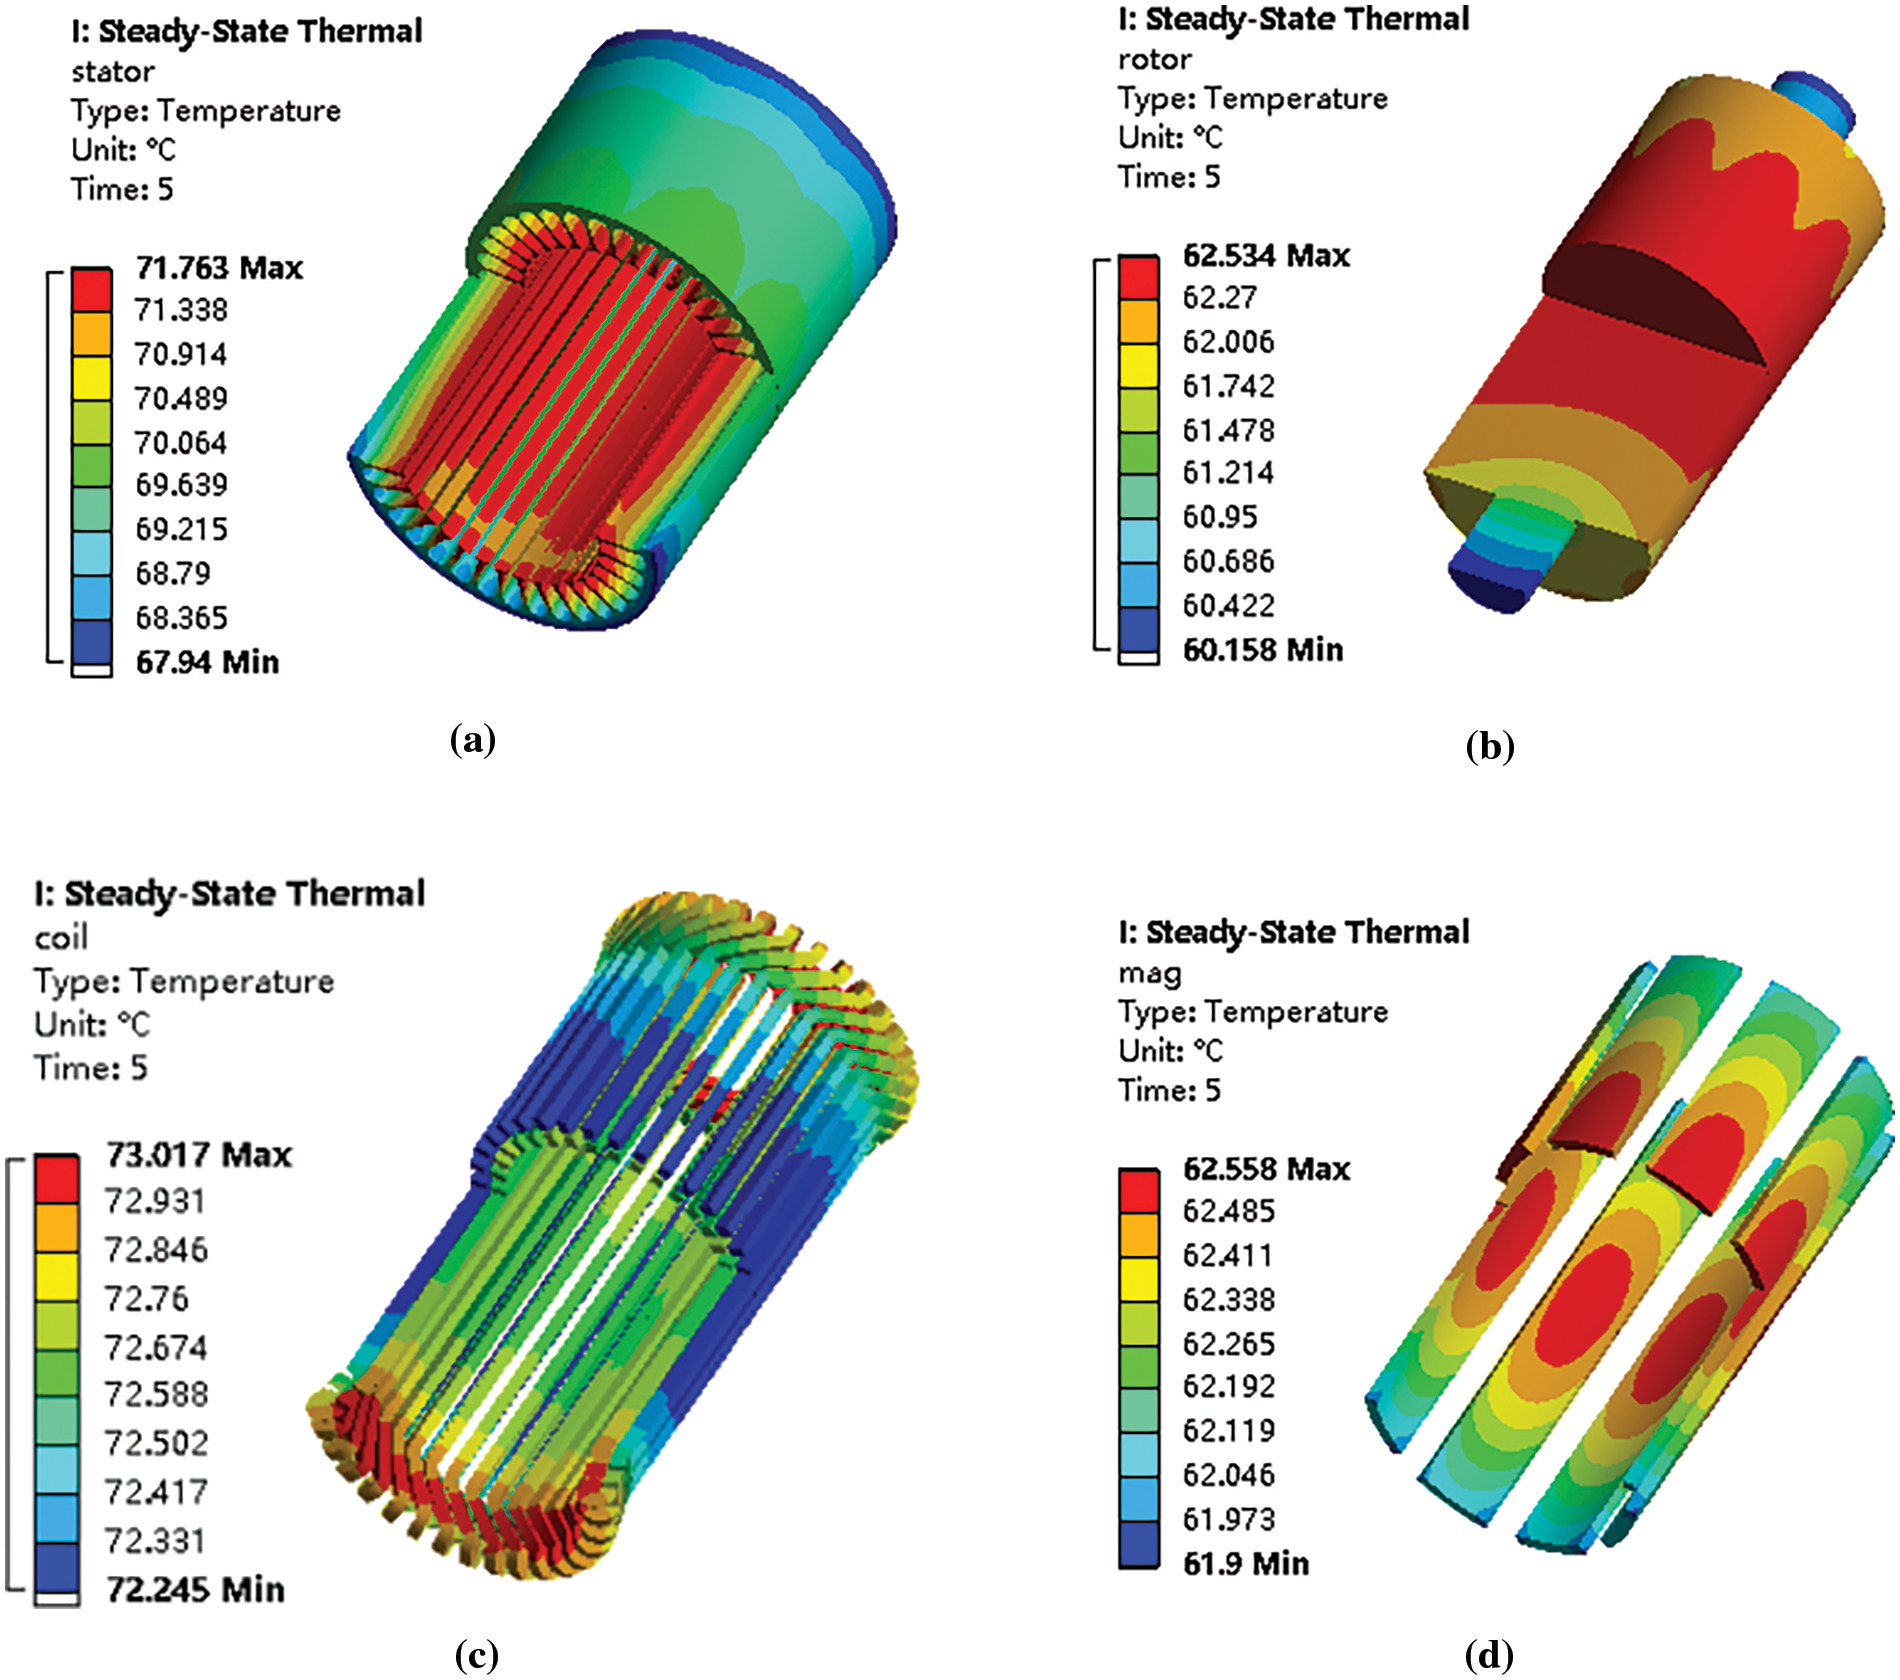
Figure 1: Temperature increase diagram of various components inside the generator. (a) Stator temperature distribution diagram. (b) Winding temperature distribution diagram. (c) Rotor temperature profile. (d) Permanent magnet temperature distribution map
As shown in a–d in Fig. 1, from the simulated temperature distribution of each component in the operation of the generator, combined with the Sgh analysis in Eq. (1), the temperature rise dynamic change law of its four main components during operation can be seen as follows: the temperature increases inside the stator, at the end of the winding, at the middle of the rotor, and at the middle of the permanent magnet (highest change). For the entropy production of the system, the greater the increase in temperature, the greater the loss, and the greater the entropy production. It can be concluded that the maximum entropy production during operation is at the inside of the stator, at the end of the winding, at the middle of the rotor, and at the middle of the permanent magnet of the generator (the winding, stator, permanent magnet, and rotor are in order from high to low).
With the increase in generator speed (caused by current), the voltage harmonics and voltage fluctuations caused by the internal iron loss, copper loss, and eddy current loss of the generator also increase. The Ansys simulation was used to calculate the change of each loss at different speeds to explore the change of the internal entropy production of the generator during the operation of the wind power system, and the calculation result is shown in the figure below.
As seen in Fig. 2, as the speed of the generator increased, the copper loss, iron loss, and eddy current loss inside the generator increased. The reason is that when the generator speed gradually increased, a lot of harmonics were generated in the air gap magnetic density, resulting in increases in the copper loss and eddy current loss inside the generator. Regarding the loss increase for the system entropy production, Sg1 in Eq. (1) gradually increased with the operation of the system, combined with the analysis of the power quality indicators, and the correlation characteristics between the two were explored.
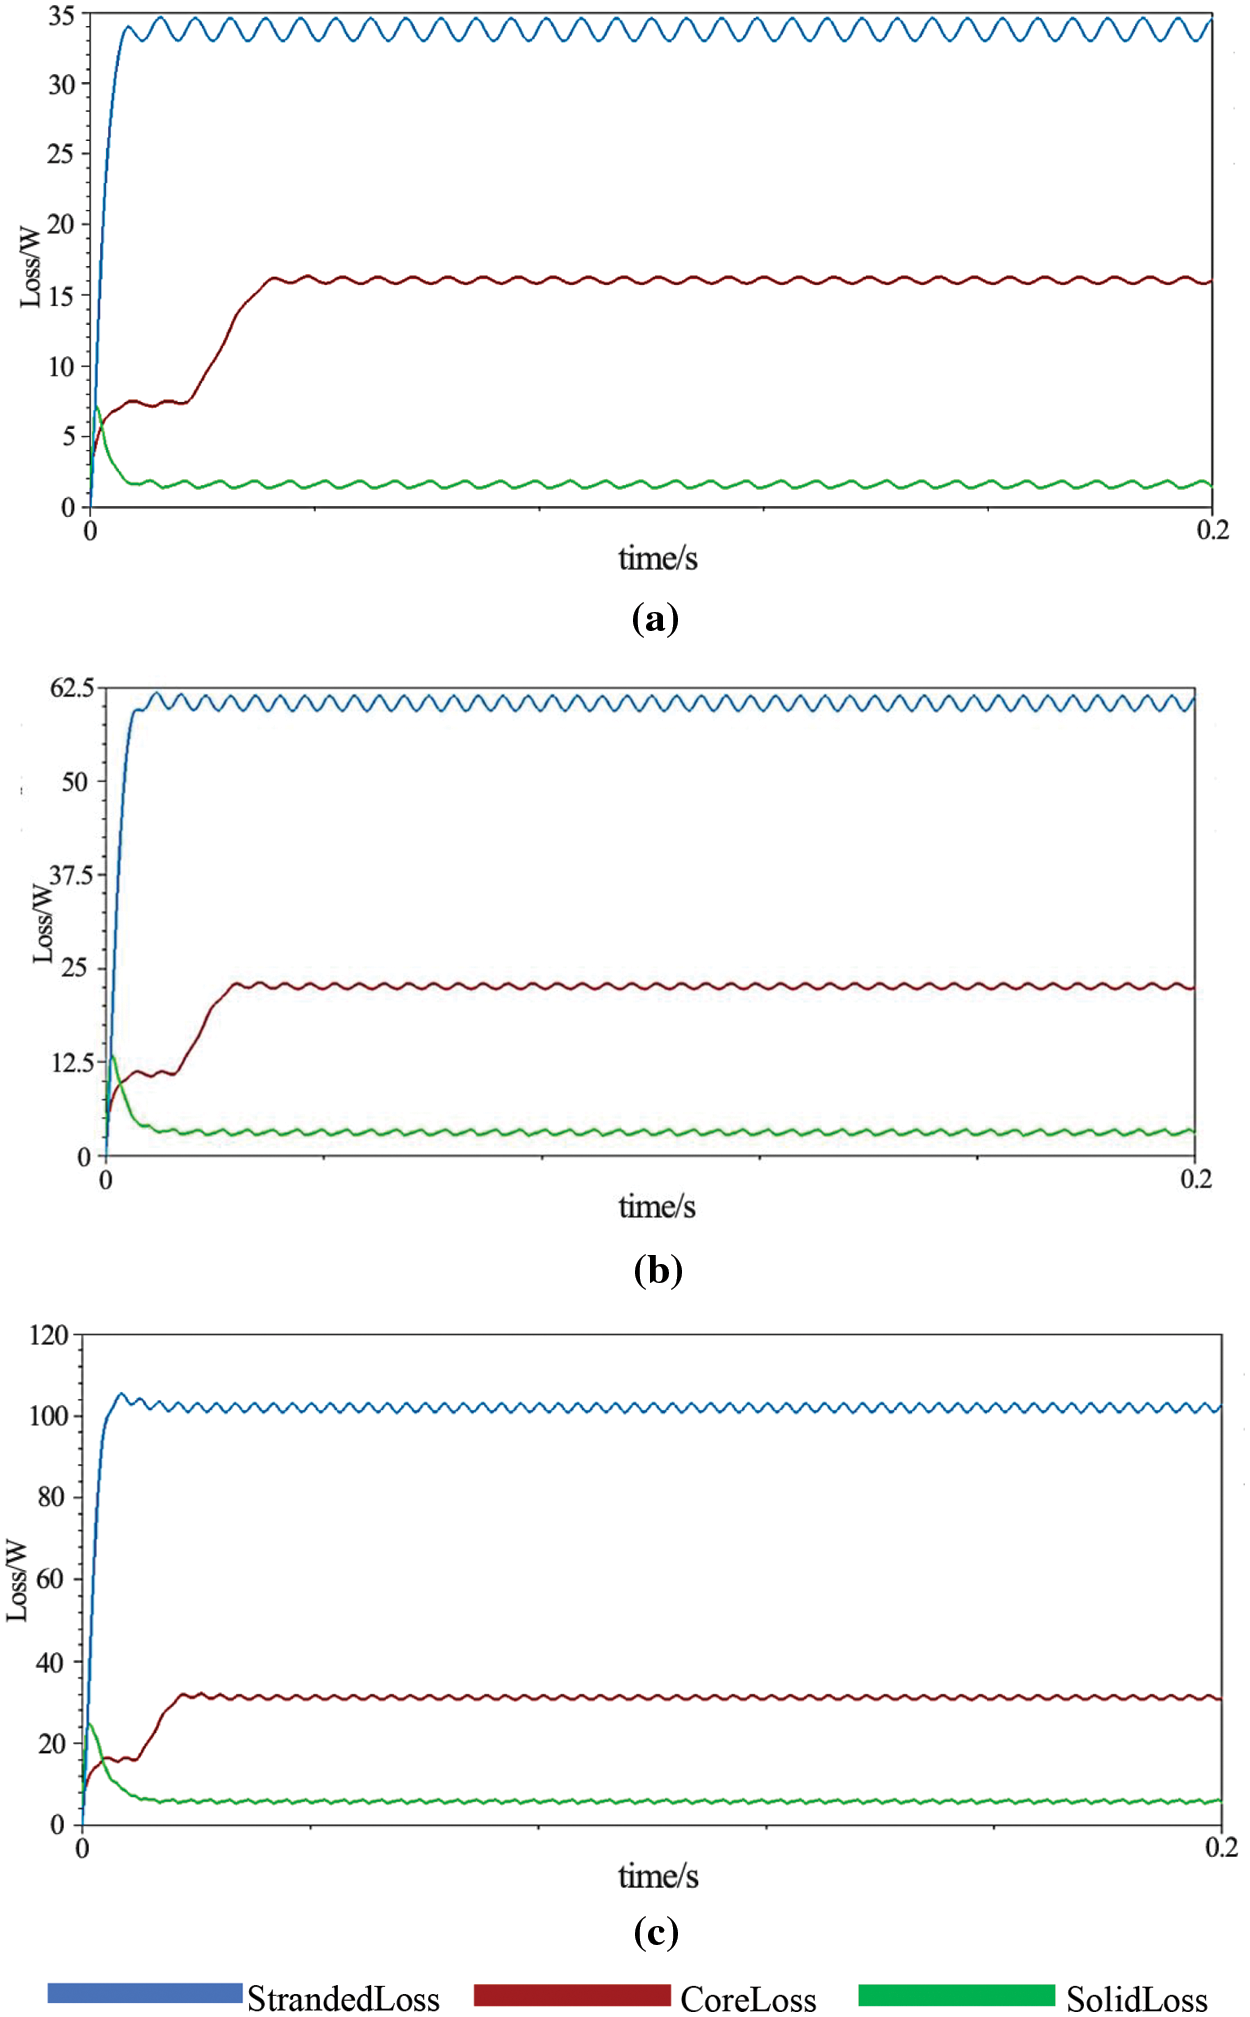
Figure 2: Calculation results of the generator losses at different speeds. (a) 250 r/min. (b) 320 r/min. (c) 400 r/min
4 Power Quality Evaluation Experiment of a Wind Power System
4.1 Introduction to the Experiment
In this experiment, the output power quality index of a generator was used as a target of the experimental layout and operation. We simulated wind power generation systems with electric motors instead of wind-turbine-driven generators. The generator output was connected to a rectifier and then to an adjustable DC load bank for basic experiments without energy storage. Pre-experiments without energy storage were performed at different speeds and loads. Moreover, parameters such as generator output current and voltage were recorded using experimental instruments, such as the DH5902 data acquisition and analysis system, Fluke190 wave meter system, and Fluke Norma 5000 power analyzer. The experimental range was 250–420 rad, with a test interval of 10 rad. The experimental data were recorded and processed according to national standards, and Fig. 3 shows the experimental setup.
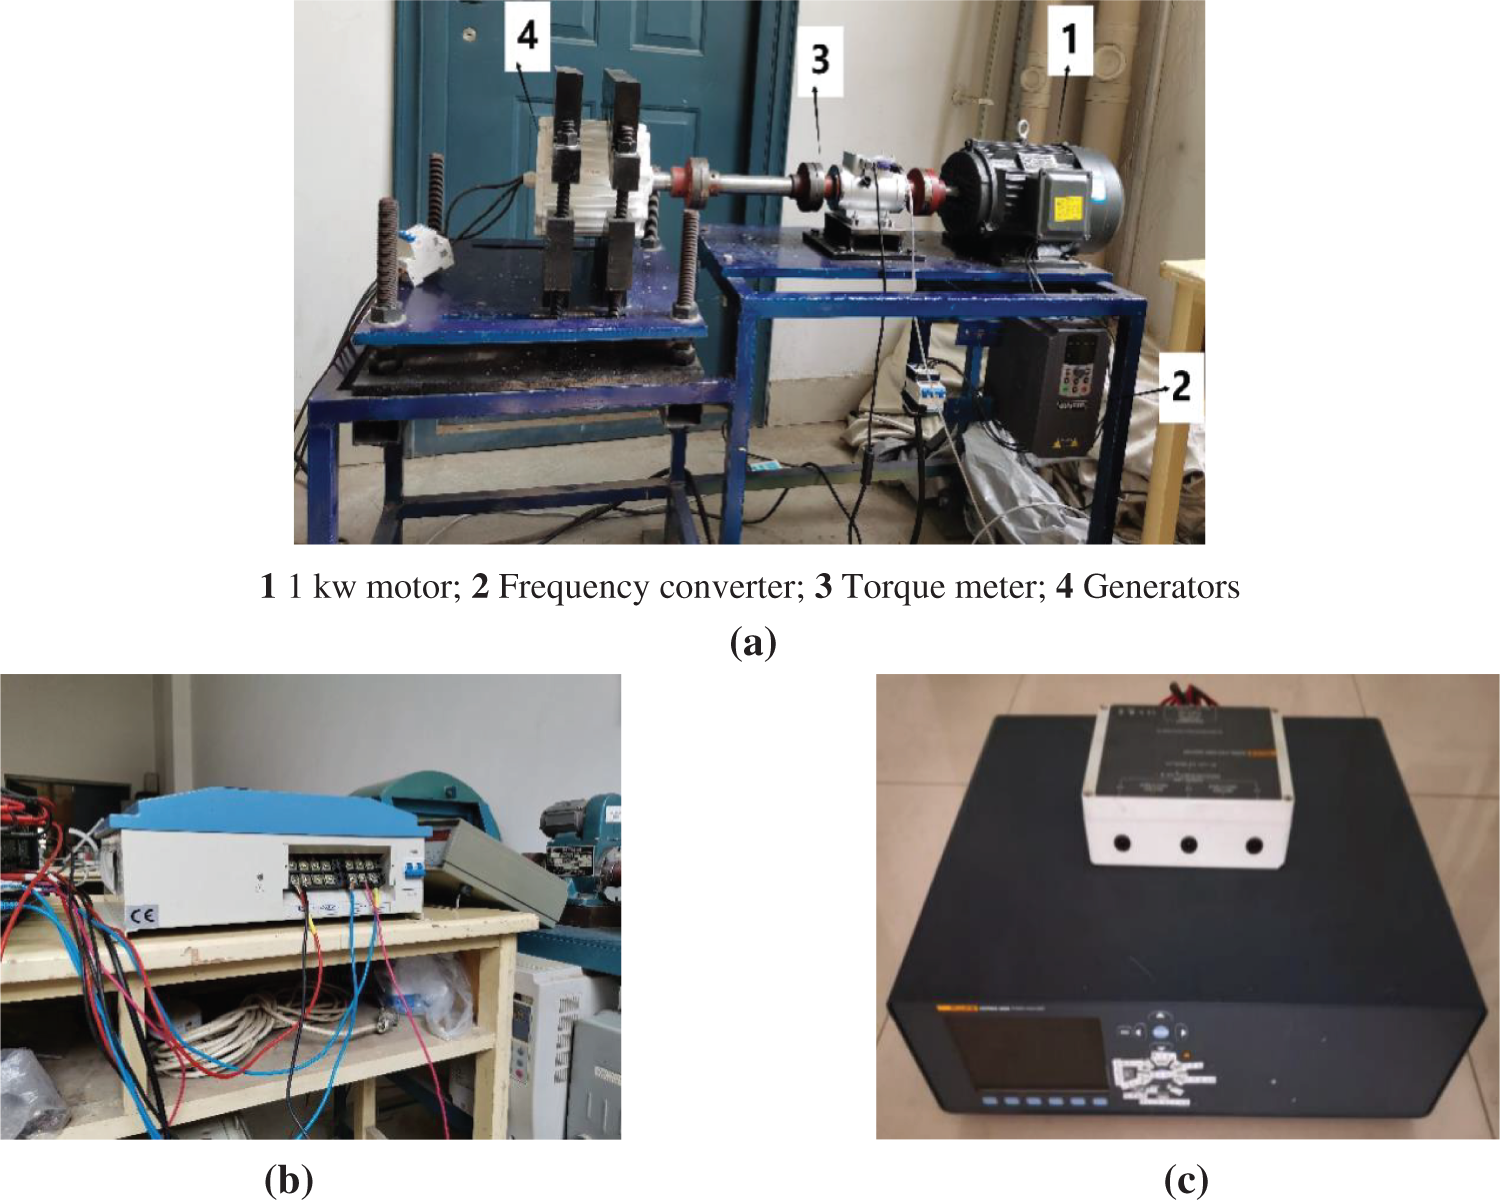
Figure 3: Diagram of the experimental equipment. (a) Steady-state test bench. (b) Rectifier. (c) Fluke Norma 5000 power analyzer
After completing the basic experiment without energy storage, a comparative experiment of adding energy storage devices was performed. Three different battery energy storage devices were added in parallel with the DC load box: lead–acid batteries, lead–carbon batteries, and lithium batteries. The load and speed settings were based on basic experiments as references, the relevant data of the power quality indicators were recorded and analyzed, and the influence of different energy storage devices on each power quality index was explored. Fig. 4 shows the experimental system diagram.
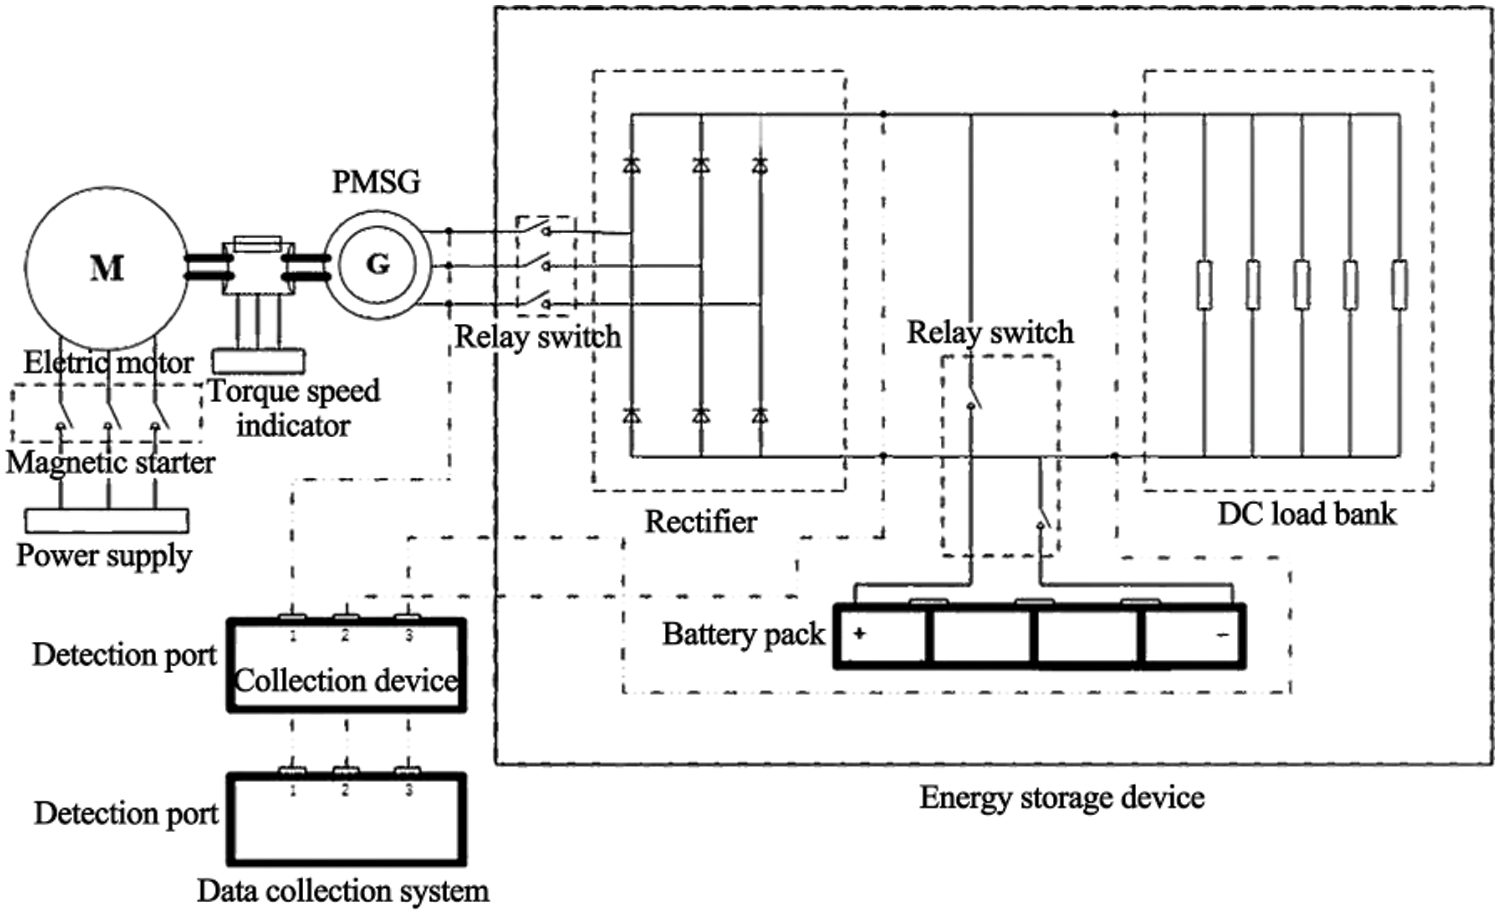
Figure 4: Experimental system block diagram
4.2 Analysis of Factors Influencing Power Quality
Before adding the energy storage experimental device, research on the correlation between power quality, generator speed, and load was performed. Without adding the energy storage device, experiments of setting different negative loads to rated speeds and over-rated speeds were performed to explore the correlation characteristics between the five quality evaluation indices, load, and speed. The whole process was recorded and the results were analyzed, as shown in Fig. 5 below.
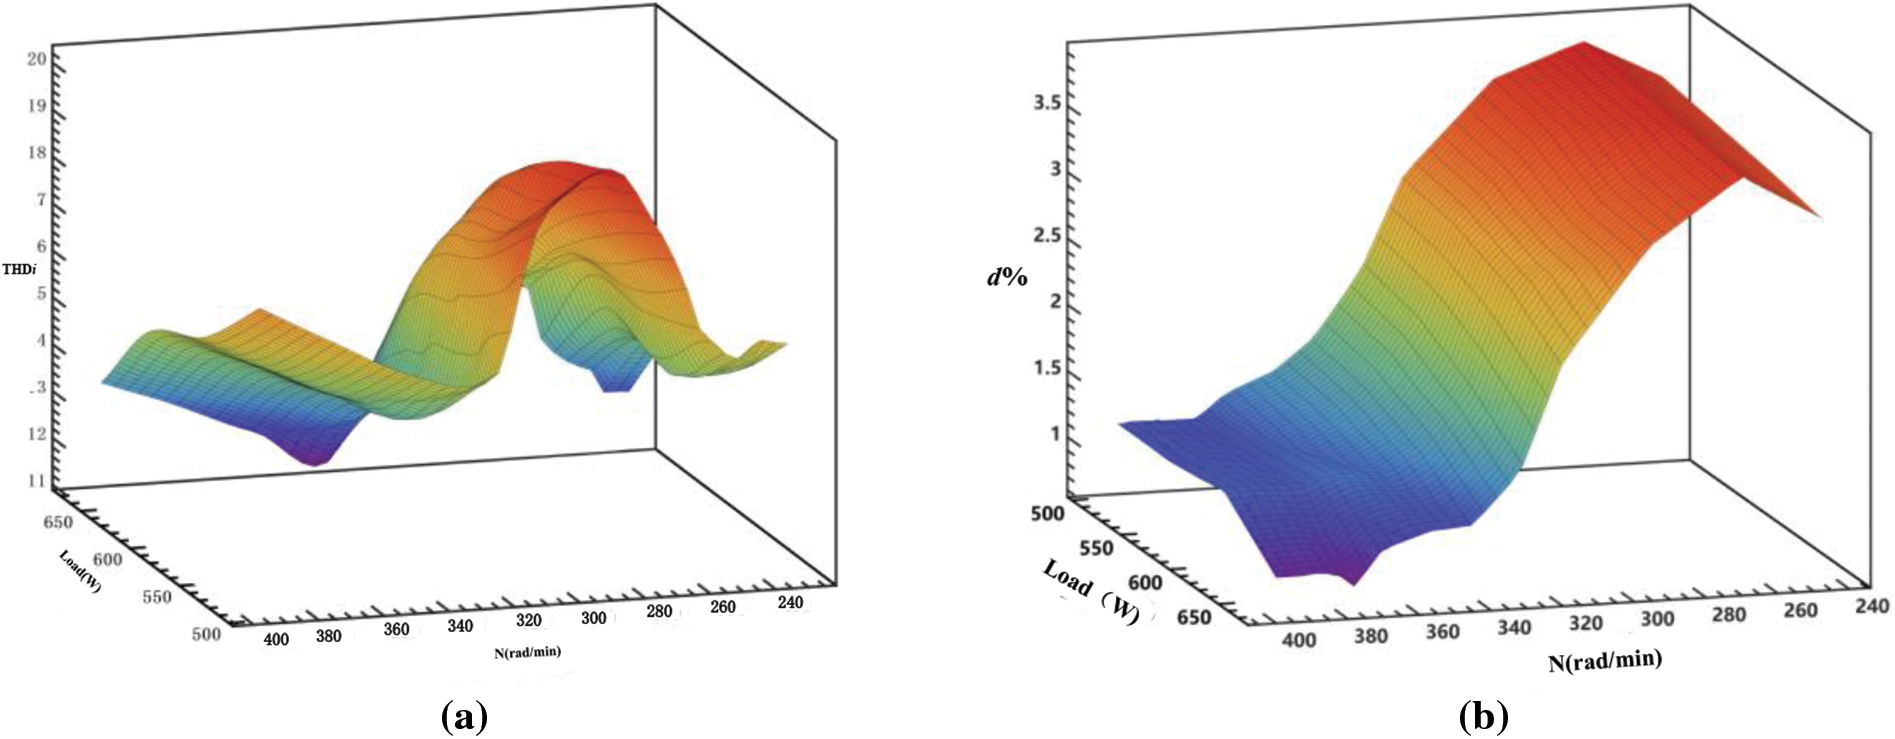

Figure 5: Correlation characteristics of power quality with rotational speed and load. (a) Total current harmonic distortion rate. (b) Voltage fluctuation. (c) Voltage deviation ratio. (d) Frequency deviation ratio. (e)
Fig. 5 shows that the current harmonic distortion rate shows a decreasing trend with the increase in generator speed in the stage of 250–340 rad/min, where it was minimum at ~340 rad/min and then gradually increased after 340 rad/min. Finally, the increasing trend became slow and stable near the rated speed. It is positively correlated with the load, and its value decreases gradually as the load increases. Fig. 5b shows that the voltage change d and speed have a trend of first increasing and then decreasing (reaching a maximum value at ~270 rad/min), gradually decreasing with the increase in speed, and gradually becoming stable near the rated speed, respectively, where the voltage fluctuates with the change in the load. d is basically stable. Fig. 5c shows that the voltage deviation ratio is negatively correlated with the rotational speed and that the downward trend is gradually stable when it reaches ~390 rad/min near the rated speed. Moreover, the Fig. 5c shows that the voltage deviation ratio slightly increased with the increase in the load. Fig. 5d shows that the frequency deviation ratio decreases with the increase in speed until the decreasing trend near the rated speed becomes slow and stable and that the load increase has little effect on it. It can be seen from Fig. 5e that cosφ has a downward parabolic change trend with the increase in speed, reaching a maximum of ~365 rad/min and gradually stabilizing near the rated speed at 390 rad/min. Under the conditions of 672 w load and 395 rad/min, its value showed the lowest point of the experimental value (0.9248). The changing trend is negatively correlated with the load, and the increase or decrease of the load has a greater impact on it than the other four power quality parameters.
5 Power Quality Index and Loss Correlation Analysis
The output power quality of the wind power system was measured and calculated according to national standards. Five representative power quality evaluation indicators were discussed and analyzed according to the four aspects of power, frequency, voltage, and current: THDi, frequency deviation rate, voltage variation rate d, voltage deviation, and power factor cosφ. The weighting percentages of each indicator were first determined according to the Analytic Hierarchy Process (AHP) method.
5.1 Power Quality Indicator Weighting Analysis
As shown Fig. 6, the relative importance of the evaluation indicators in the hierarchical model was evaluated using the IEC and national standards as follows: power indicators are more important than frequency indicators and slightly more important than voltage and current indicators, and voltage fluctuation indicators are more important than voltage deviation indicators. Therefore, a judgement (pairwise comparison) matrix could be constructed based on the D-S evidence theory as follows:

Figure 6: Power quality evaluation hierarchy model
The judgement matrix of Level I to Level II is shown below:
The judgment matrix of the voltage indicators in Level II for the voltage fluctuations and voltage deviations in Level III is shown below:
The maximum eigenroot λmax (A) and eigenvector of matrix A were calculated by MATLAB, and λmax(A) was found to be 4.0944. The corresponding regularized eigenvector could be approximated as the weight vector of matrix A, which characterizes the influence weight of Level II indicators on Level I targets.
Similarly, λmax (B) = 2, i.e., the weight vector of the influence of voltage variations and voltage deviations on voltage indicators in layer III indicators. The weight vector of the judgment matrix results as follows:
From the above calculation, it can be seen that the influence of the power indicators, frequency indicators, voltage indicators, and current indicators located in the second level on the optimal weight of power quality is 0.4596, 0.1256, 0.2074, and 0.2074, respectively. Moreover, the influence of the voltage variation and voltage deviation in the third level on the voltage indicators in the second level is 0.65 and 0.35. Thus, the combination of the third level on the first level. The results of the weight vectors are as follows:
This shows that the subjective weight sizes of the power factor, frequency deviation, voltage variation, voltage deviation, and current harmonic distortion rate on the power quality of the unit are 0.4596, 0.1256, 0.1348, 0.0726, and 0.2074, respectively.
5.2 Current Total Harmonic Distortion Rate
Referring to the algorithm of THDi in the national standard “Power Quality Harmonics of Public Power Grids”, 10 non-overlapping measurement periods were calculated and averaged [14]. Since the rated speed of the selected generator in this experiment is 400 rad/min, to analyze the characteristics effectively and reliably, the speed range of 260–420 rad/min was selected. Since the voltage harmonic distortion rate is close to the current harmonic distortion rate, the test results were used to analyze the influence of the degree of the electrical signal harmonic distortion by various original factors. Then, the correlation characteristics with the system entropy production were analyzed.
Fig. 7 shows that there is a negative correlation between the THDi and monitor speed. When the speed was ~310 rad/min, the THDi with an energy storage device began to be better than the one without an energy storage device. This is because the battery was in a discharged state, supplying power to the load with the generator, at which point the THDi was approximately 13.58%. After 310 rad/min, the generator supplied power to the battery and the load at the same time. At this time, the battery was in a charged state, and the THDi was ~2.17%–4.05% lower than the no energy storage device when the energy storage device was added. In the range of 310–390 rad/min, the improvement effect of the lithium battery on THDi was better than that of the lead–acid battery and lead–carbon battery, and THDi tended to be stable after reaching 390 rad/min, with a minimum value of 6.61% occurring near the rated speed. When the speed was higher than the rated speed of the generator, internal insulation aging and demagnetization occurred after the long-term over-temperature operation, and the three energy storage devices increased by ~8.6%–13%.
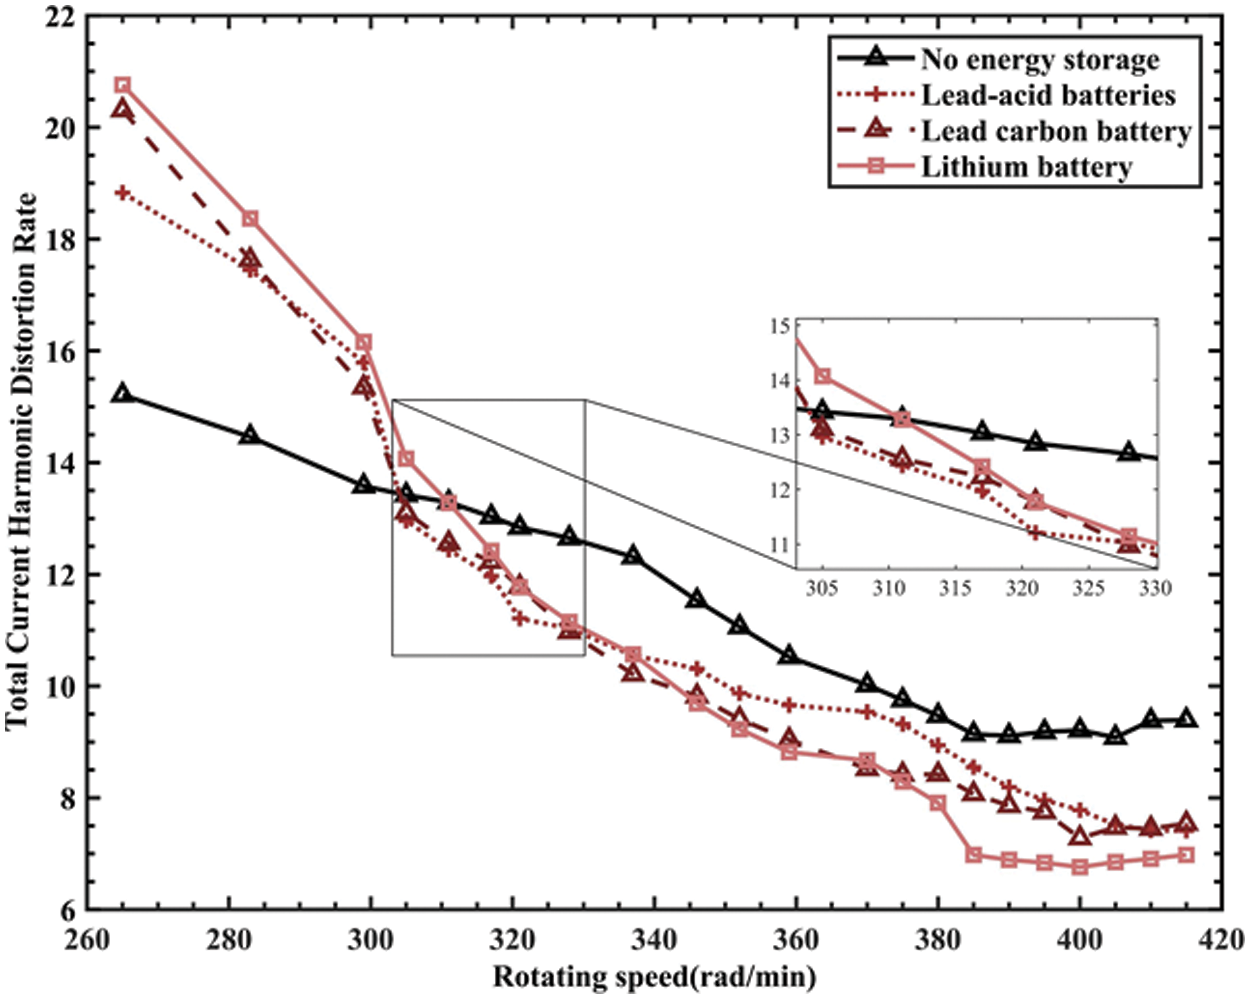
Figure 7: Total current harmonic distortion rate
When the current harmonic distortion rate was too high, the harmonic current in the motor winding increased. Thus, the heating of the winding increased, and its temperature increased. The induced electromotive force of the winding coil in the cogging of the generator was affected by harmonics, the output current also contained a large number of harmonics, and the internal iron loss and eddy current loss of the motor increased [15].
5.3 Voltage Fluctuation and Voltage Deviation
The voltage variation d was used as a measure of generator output voltage fluctuations according to ICE and national standards. The Root Mean Square (RMS) variation of the voltage square root curve over five cycles was selected, and the larger value of

Figure 8: Voltage fluctuation
As the speed of the generator increases, d showes the trend of first rising and then decreasing. The downward trend slows as it approaches the rated speed. When there was no energy storage device, the maximum value of d was 3.53% when the rotation speed was ~290 rad/min. After adding the energy storage device, when the speed gradually increased, d gradually decreased and the downward trend gradually became slower. When the speed reached ~380 rad/min, the fluctuation value basically reached a minimum value of 0.32%, which is ~12.5%–14.6% lower than the maximum value. The lead–carbon battery worked best at the speed range of 240–320 rad/min, and the lithium battery had the best effect on d in the speed range of 320–420 rad/min.
When the voltage fluctuates greatly, the magnetic flux density in the motor core also fluctuates, resulting in an increase in the iron loss and eddy current loss in the core. Moreover, in the case of large voltage fluctuations, current fluctuations can occur, resulting in increased winding heating, thereby increasing its temperature. Fig. 8 shows that at low speeds, the losses caused by voltage fluctuations inside the generator are large.
The arithmetic mean value of the generator output voltage rms value curve was taken as the voltage calibration value, and the average value of 16 voltage rms values in the fixed period of the curve was taken as the measurement value. Then, the “Power Quality Supply Voltage Deviation” in the national standard was used as the standard calculation to obtain the voltage deviation value [18]. Fig. 9 shows the analysis of the relationship between voltage deviation and rotational speed.

Figure 9: Voltage deviation ratio
It can be seen from Fig. 9 that as the generator speed increases, the voltage deviation gradually decreases, and the downward trend of the voltage deviation slows down when it is close to the rated speed. When the speed is 415 rad/min, the minimum value of the voltage deviation is 0.076. After adding the battery energy storage device, the voltage deviation at low speed can be reduced by up to 11.4%–34.1%. At high speed, the energy storage device has less effect on the improvement of the voltage deviation of the generator, and the improvement effect of the lead–carbon battery is better than that of the lithium battery and lead–acid battery, with the lithium battery having a gradual decreasing effect on the voltage deviation at a speed of 390 rad/min.
In the case of a large voltage deviation, current deviation occurred inside the motor, resulting in increased winding heating. At the same time, the heating of the iron core increased; thus, its temperature increased and magnetic permeability decreased, resulting in increased iron and eddy current losses of the core [19,20]. As shown in Fig. 9, the loss caused by the voltage deviation was large at low generator speeds.
5.4 Frequency Deviation Ratio and Power Factor
For easy comparison, the frequency deviation ratio could be obtained by comparing the frequency deviation with the system nominal frequency. From the relation between the rotational speed N and the number of pole pairs P, it can be concluded that the voltage fundamental frequency of the generator at different rotational speeds is the nominal frequency of the system [21]. The frequency deviation of the electrical signals corresponding to 16 groups of different rotational speeds was measured, and the deviation ratio was calculated. Fig. 10 shows the variation trend of the frequency deviation ratio with the rotational speed.
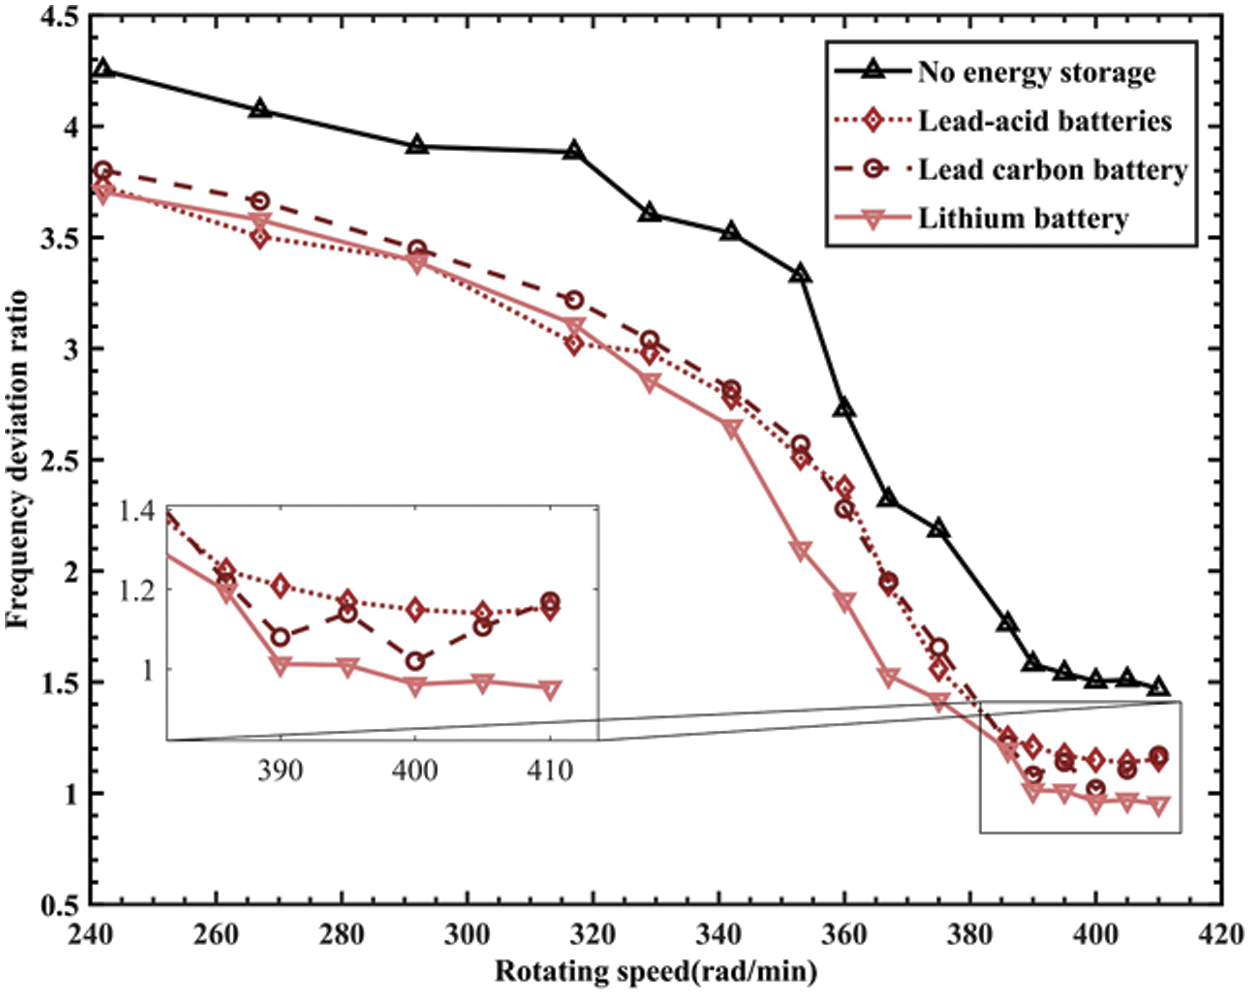
Figure 10: Frequency deviation ratio
Fig. 10 shows that there is a negative correlation between the generator speed and power quality frequency deviation ratio. Moreover, it shows a decreasing trend near the rated speed, and this trend then gradually slows down to a stable trend, dropping to its lowest point when the speed reaches 390 rad/min, showing a minimum value of 0.96, and then remaining stable. The rate of the output frequency deviation was significantly reduced after the addition of the energy storage device. In the speed range of 240–340 rad/min, the three different energy storage batteries had a similar improvement effect. When the lithium battery energy storage device was added, the improvement effect on the output frequency deviation ratio of the system was more prominent when the rotation speed was 330–390 rad/min, and the frequency deviation ratio decreased by ~21.3%–25.7%.
Excessive frequency deviation can lead to a decrease in the operating stability of generators, and it is easy to produce overvoltage and overcurrent phenomena, which cause the temperatures of the motor winding and bearing to increase, resulting in an increase in the losses inside generators [22]. Since the frequency in the experimental operation did not exceed the upper limit, when the frequency deviation of the generator was within the specified frequency, a significant increase in the internal temperature of the motor did not occur, and the loss inside the generator did not increase significantly.
According to the national standard “Measurement and Evaluation Method of Power Quality of Wind Turbines”, the sizes of active power and reactive power also determine the quality of power. In the collected power factor, the average value of cosφ at 19 random time points was obtained as the measured value.
Fig. 11 shows that the relationship between the generator speed and power factor presents an approximately open downward parabolic, and its upward trend slows down around the rated speed of 400 rad/min. A maximum value of 0.947 occurred at a speed of 415 rad/min. After adding the energy storage system, cosφ improved, and the lithium battery could improve cosφ by ~0.56%–1.76% at a lower speed, with the lithium batteries outperforming the lead–acid and lead–carbon batteries. The improvements in cosφ for the three different energy storage batteries were close in the speed range of 370–415 rad/min.

Figure 11: cosφ
If the generator power factor is too low, the temperature of the windings, cores, and bearings inside the motor increases, resulting in a corresponding loss [23,24]. At the same time, it causes additional current losses to flow through the circuit, increasing the temperature and loss of the internal resistance of the generator. Therefore, as seen in Fig. 11, when the generator speed was low, the loss caused by cosφ was large at a higher speed.
6 Correlation Analysis of the Power Quality and Entropy Production Characteristics
According to the mathematical entropy production model of wind power systems, the correlation between system loss, power quality, and system entropy production was used as a medium, and the correlation between the power quality index and entropy production was analyzed.
An increase in THDi causes copper, magnetic leakage, and motor winding temperature losses inside generators. According to the system entropy production model, Sg1 and Sgh increase accordingly. That is, entropy production and THDi would show positive correlation characteristics.
Voltage fluctuations are greatly affected by the interharmonic impact generated by air gap magnetic fields, causing generators to produce significant copper losses and leakages. That is, Sg1 is larger in the system entropy production. Due to the high-speed operation of generators and the instability of wind speed, the internal temperature increase of motors is large, resulting in large heat losses. That is, Sgh is large; thus, d and entropy production have a positive correlation.
In the case of increased voltage deviation, current deviations can occur inside motors, resulting in an increase in winding heating (an increase in Sgh in a system’s entropy production). Meanwhile, the iron core heating increases; thus, the temperature increases and the magnetic permeability decreases, resulting in increases in the iron and eddy current losses of the core, and Sg1 increases in the system entropy production. Thus, voltage deviation is positively correlated with a system’s entropy production.
Due to the fluctuation of wind loads, blade vibrations are larger when frequency deviations are large, resulting in large vibration losses, overvoltage, and overcurrent, which cause the temperature of the motor winding, bearing, and other parts to increase, resulting in an increase in internal losses. Since frequency does not exceed the upper limit during operation, it does not increase a system’s entropy production. Thus, frequency deviation is not absolutely related to system entropy production when the upper-frequency limit is not exceeded.
A low cosφ mainly affects the high-order harmonics in currents, and an effective reduction in high-order harmonics can effectively reduce Sg1 in system entropy production, showing that cosφ and system entropy production have a negative correlation.
In this work, the theory of entropy generation in wind power systems was analyzed based on engineering thermodynamics. The correlation between the output power quality, speed, and load of wind power systems with or without energy storage was analyzed by experimental comparison. Taking the loss of a system in operation as a link, the correlation and distribution law of the system entropy generation and the parameters of the energy storage link were obtained. The obtained conclusions are as follows:
1) The performed Ansys simulation showed that the maximum entropy production position of the generator during system operation was inside the stator, winding end, middle of the rotor, and middle of the permanent magnet. Moreover, the iron loss, copper loss, and eddy current loss inside the generator increased with the increase in speed, which is consistent with the analysis of electric energy indicators.
2) By adding different energy storage batteries, the necessity of energy storage device in wind power system is proved, and the variation law of variable speed, load and each index is explored: Speed is negatively correlated with the power quality parameters of voltage deviation, cosφ, and frequency deviation ratio. THDi first decreased and then increased, while d first increased and then decreased when the speed increased. The load has the most significant effect on cosφ.
3) The performed analysis showed that entropy generation in wind power systems is positively correlated with THDi, d, and voltage deviation and negatively correlated with cosφ. There was no correlation between entropy generation in wind power systems and the frequency deviation ratio within set frequencies.
4) After introducing the entropy generation theory related to the direct loss reduction into the wind power system, the evaluation and analysis of power quality parameters based on entropy are proposed. By linking the loss with system entropy, the power quality index could be evaluated more directly. Thus, an optimization scheme could be directly proposed for the loss. It provides a proof for exploring ways to improve power quality by reducing system loss.
The innovation of this paper is mainly taking the losses in the operation of wind power systems as a starting point and exploring the correlation characteristics between the generation of entropy and power quality indicators in wind power systems. It can provide help and guidance for subsequent research on entropy in wind power systems and thus provide theoretical support for exploring ways to improve power quality by reducing system losses.
Acknowledgement: None.
Funding Statement: This work was Supported by the National Natural Science Foundation of China (No. 51966013), Inner Mongolia Natural Science Foundation Jieqing Project (No. 2023JQ04), the National Natural Science Foundation of China (No. 51966018), and the Natural Science Foundation of Inner Mongolia Autonomous Region (No. STZC202230).
Author Contributions: The authors confirm contribution to the paper as follows: study conception and design: Caifeng Wen, Boxin Zhang, Yuanjun Dai, Wenxin Wang, Wanbing Xie, Qian Du; analysis and interpretation of results: Caifeng Wen, Boxin Zhang; draft manuscript preparation: Caifeng Wen, Boxin Zhang. All authors reviewed the results and approved the final version of the manuscript.
Availability of Data and Materials: Data available on request from the authors. Some of the data in the article relate to confidentiality, and unclassified data are available from the corresponding author, Boxin Zhang.
Ethics Approval: Not applicable.
Conflicts of Interest: The authors declare that they have no conflicts of interest to report regarding the present study.
References
1. X. G. Zhang, S. H. Liu, L. Huang, and H. Wu, “The current status and development trend of wind power generation,” presented at the 2018 7th Int. Conf. Adv. Mater. Comput. Sci. (ICAMCS 2018Shenzhen, China, Apr. 14–15, 2018. [Google Scholar]
2. L. Yang, Y. L. Xu, W. Gu, and H. Sun, “Distributionally robust chance-constrained optimal power-gas flow under bidirectional interactions considering uncertain wind power,” IEEE Trans. Smart Grid, vol. 12, no. 2, pp. 1722–1735, Mar. 2021. [Google Scholar]
3. D. Celik and H. H. Ahmed, “Enhanced control of superconducting magnetic energy storage integrated UPQC for power quality improvement in EV charging station,” J. Energy Storage, vol. 62, Jun. 2023. doi: 10.1016/j.est.2023.106843. [Google Scholar] [CrossRef]
4. D. Celik, “Lyapunov based harmonic compensation and charging with three phase shunt active power filter in electrical vehicle applications,” Int. J. Electr. Power Energy Syst., vol. 136, no. 12, pp. 107564, Mar. 2022. doi: 10.1016/j.ijepes.2021.107564. [Google Scholar] [CrossRef]
5. H. Ahmed and D. Celik, “Sliding mode based adaptive linear neuron proportional resonant control of Vienna rectifier for performance improvement of electric vehicle charging system,” J. Power Sources, vol. 542, no. 4, pp. 231788, Sep. 2022. doi: 10.1016/j.jpowsour.2022.231788. [Google Scholar] [CrossRef]
6. J. H. Dai, H. Hu, G. J. Zheng, Q. H. Hu, H. F. Han and H. Shi, “Attribute reduction in interval-valued information systems based on information entropies,” Front. Inf. Technol. Electron. Eng., vol. 17, no. 9, pp. 919–928, Jul. 2021. doi: 10.1631/FITEE.1500447. [Google Scholar] [CrossRef]
7. H. Zhou, Y. Long, S. Miraglia, F. Porcher, and H. Zhang, “Age stability of La(Fe,Si)13 hydrides with giant magnetocaloric effects,” Rare Metals, vol. 41, no. 3, pp. 992–1001, Sep. 2022. doi: 10.1007/s12598-021-01849-3. [Google Scholar] [CrossRef]
8. Y. W. Lai, Z. H. Ma, and S. T. Xu, “Information entropy evaluation model of bus-line reliability considering the combination of bus stops and bus travel time,” Can. J. Civ. Eng., vol. 49, no. 1, pp. 64–72, 2022. doi: 10.1139/cjce-2020-0666. [Google Scholar] [CrossRef]
9. F. Y. Yang, M. L. Zhang, D. M. Xia, Z. Y. Tian, K. D. Qu and T. M. Yang, “Wind power disorder index and prediction effect evaluation method based on information entropy theory,” CN112785033A. 2021. Accessed: May 21, 2023. [Online]. Available: https://d.wanfangdata.com.cn/patent/ChJQYXRlbnROZXdTMjAyMzA5MDESEENOMjAyMDExNDY1NjI5LjUaCGZjdWd2aTNr [Google Scholar]
10. J. Yngvason, “A Direct road to entropy and the second law of thermodynamics,” Math. Phys., vol. 1, 2022. doi: 10.48550/arXiv.2202.07982. [Google Scholar] [CrossRef]
11. A. Kleidon, “Physical limits of wind energy within the atmosphere and its use as renewable energy: From the theoretical basis to practical implications,” Meteorol. Z., vol. 30, no. 3, pp. 203–225, Feb. 2021. doi: 10.1127/metz/2021/1062. [Google Scholar] [CrossRef]
12. C. F. Wen, J. X. Zhang, H. L. Peng, and J. W. Wang, “Minimization analysis of entropy production of wind turbines based on multi-field coupling,” (in Chinese), Trans. China Electr. Soc., vol. 33, no. 19, pp. 4563–4572, Oct. 2021. doi: 10.19595/j.cnki.1000-6753.tces.171477. [Google Scholar] [CrossRef]
13. K. Mehrdad, S. Mostafa, S. S. Abdolali, K. Şendur, M. Pinar Mengüç and A. Koşar, “Entropy generation analysis of laminar flows of water-based nanofluids in horizontal minitubes under constant heat flux conditions,” (in Chinese), Entropy, vol. 20, no. 4, pp. 242, 2018. doi: 10.3390/e20040242. [Google Scholar] [PubMed] [CrossRef]
14. H. X. Lin, “National power quality standard lecture series lecture 3 harmonic standard for public power grid,” (in Chinese), Build. Electr., vol. 30, no. 6, pp. 3–8, Jun. 2011. [Google Scholar]
15. S. Tao, C. Luo, X. N. Xiang, and C. Chen, “Improvement method of physical component theory of electric current and its application in power quality assessment,” (in Chinese), Trans. China Electr. Soc., vol. 34, no. 9, pp. 1960–1970, Mar. 2019. [Google Scholar]
16. H. X. Lin, “Power quality national standard lecture series lecture No. 4 voltage fluctuation and flicker standard,” (in Chinese), Build. Electr., vol. 30, no. 8, pp. 12–16, Aug. 2011. [Google Scholar]
17. IEC 61000-3-3, “Limitation of voltage changes, voltage fluctuations and flicker in public low-voltage supply systems, for equipment with rated current <=16 A per phase and not subject to conditional connection,” 2013. Accessed: May 21, 2023. [Online]. Available: https://d.wanfangdata.com.cn/standard/ChpTdGFuZGFyZE5ld1MyMDI0MDYwNTE2NTg1ORISSUVDIDYxMDAwLTMtMy0yMDEzGgh5MjlwZ2V1Mw%3D%3D [Google Scholar]
18. H. X. Lin, “Power quality national standard series lecture No. 1 power supply voltage deviation standard,” (in Chinese), Build. Electr., vol. 30, pp. 3–9, Jun. 2011. [Google Scholar]
19. M. R. Behbahani, A. Jalilian, and A. S. Fini, “Reconfiguration of distribution network for improving power quality indexes with flexible lexicography method,” Elect. Power Syst. Res., vol. 230, no. 6, pp. 110172, 2024. doi: 10.1016/j.epsr.2024.110172. [Google Scholar] [CrossRef]
20. S. K. Gupta, S. K. Mallik, and D. Kumar, “Voltage stability assessment of the power system using novel line voltage collapse index,” Eng. Res. Express, vol. 6, no. 2, pp. 025324, 2024. doi: 10.1088/2631-8695/ad4254. [Google Scholar] [CrossRef]
21. GB/T 15945—2008, “Power quality–Frequency deviation for power system,” 2008. Accessed: May 21, 2023. [Online]. Available: https://d.wanfangdata.com.cn/standard/ChpTdGFuZGFyZE5ld1MyMDI0MDYwNTE2NTg1ORIPR0IvVCAxNTk0NS0yMDA4Ggh0NGQzdnBibA%3D%3D [Google Scholar]
22. D. Bellan, “Impact of Gaussian frequency deviation on the detection probability of power system harmonics,” Int. J. Appl. Eng. Res., vol. 34, no. 3, pp. 11–15, Jan. 2016. [Google Scholar]
23. J. Q. Liao, Y. T. Liu, and C. S. Guo, “Power quality of DC microgrid: Index classification, definition, correlation analysis and cases study,” Int. J. Electr. Power Energy Syst., vol. 156, no. 1, pp. 109782, 2024. doi: 10.1016/j.ijepes.2024.109782. [Google Scholar] [CrossRef]
24. Z. M. Duan, X. J. Yuan, and R. F. Zhu, “Application of fuzzy control harmonic suppression and reactive power compensation technology for power electronic equipment based on cloud computing,” J. Intell. Fuzzy Syst., vol. 40, no. 4, pp. 5795–5806, 2021. doi: 10.3233/JIFS-189419. [Google Scholar] [CrossRef]
Cite This Article
 Copyright © 2024 The Author(s). Published by Tech Science Press.
This work is licensed under a Creative Commons Attribution 4.0 International License , which permits unrestricted use, distribution, and reproduction in any medium, provided the original work is properly cited.
 Downloads
 Citation Tools