
 Submit a Paper
 Propose a Special lssue
 Open Access
ARTICLE
Risk Analysis Using Multi-Source Data for Distribution Networks Facing Extreme Natural Disasters
School of Information Engineering, Beijing Institute of Petrochemical Technology, Beijing, 102617, China
* Corresponding Author: Jun Yang. Email:
Energy Engineering 2023, 120(9), 2079-2096. https://doi.org/10.32604/ee.2023.028653
Received 30 December 2022; Accepted 15 March 2023; Issue published 03 August 2023
 View Full Text
 Download PDF
Abstract
Distribution networks denote important public infrastructure necessary for people’s livelihoods. However, extreme natural disasters, such as earthquakes, typhoons, and mudslides, severely threaten the safe and stable operation of distribution networks and power supplies needed for daily life. Therefore, considering the requirements for distribution network disaster prevention and mitigation, there is an urgent need for in-depth research on risk assessment methods of distribution networks under extreme natural disaster conditions. This paper accesses multi-source data, presents the data quality improvement methods of distribution networks, and conducts data-driven active fault diagnosis and disaster damage analysis and evaluation using data-driven theory. Furthermore, the paper realizes real-time, accurate access to distribution network disaster information. The proposed approach performs an accurate and rapid assessment of cross-sectional risk through case study. The minimal average annual outage time can be reduced to 3 h/a in the ring network through case study. The approach proposed in this paper can provide technical support to the further improvement of the ability of distribution networks to cope with extreme natural disasters.Keywords
As an important part of the electric power system, the distribution network is an important public infrastructure integral to people’s livelihoods [1], and is a key element for ensuring the quality of power supply [2], improving the operational efficiency, and enhancing the reliability of the power supply [3] and customer service. Earthquakes, typhoons, mudslides, and other extreme natural disasters are extremely destructive and can cause severe failures, thus threatening the safe and stable operation of distribution networks and power supplies needed for daily life. For instance, in September 2016, Typhoon Meranti caused enormous damage to distribution networks and power outages in many areas.
China’s distribution network has a weak foundation, a natural structure, and power supply vulnerability compared to the transmission network. The unbalanced development and a low level of intelligence make the distribution network more susceptible to faults and outages caused by internal and external factors. with the urbanization progress, the scales of distribution networks have increased, as well as the risk of extreme natural disasters triggering large scale blackouts. However, existing analysis and control methods of distribution networks cannot achieve real-time, accurate, and complete access to disaster data, making it difficult to support accurate assessment, resource deployment and optimal decision-making at the macro level effectively. This restricts the effective implementation of emergency repair commands, rapid restoration of power supplies, and differentiated transformation of weak links. Therefore, there is an urgent need to improve the risk control level of the distribution networks and enhance its ability to respond to extreme natural disasters effectively.
Continuous improvement in intelligence of distribution grid has resulted in the accumulation of a large amount of operation data on the distribution grid, and the increasing maturity and practicality of new-generation information technology, such as big data and artificial intelligence, provide effective technical means for distribution grid risk management. The data-driven risk control technology of the distribution networks has a feasible data and algorithm foundation. Thus, it is necessary to ensure the consistency, accuracy and completeness of a model and data acquisition to improve the accuracy of the distribution network’s fault diagnosis and risk assessment.
This paper aims to solve key problems such as poor quality of distribution network basic data and a lack of means for disaster damage analysis and evaluation, to achieve cross-system, multi-link data integration and quality improvement. In this way, accurate fault diagnosis and disaster damage analysis of the distribution networks could be realized, and effective technical support could be provided to improve the risk management capability of the distribution networks.
The main contributions of this work can be summarized as follows:
1) An approach for multi-source data integration in distribution networks is proposed in this study. Compared with traditional approach, the unified modeling, information integration, and rapid data exchange between heterogeneous systems is realized, thus providing the necessary scientific data for fault handling of distribution network. 2) A data-driven risk assessment approach considering the complex network structures and special environments of distribution networks is proposed in this study, thus effectively promoting the accuracy and reliability of risk assessment.
The remainder of this paper is organized as follows. Section 2 review and analyze the related work on this topic. Section 3 proposes a multi-source data interaction and data quality improvement method. Section 4 describes data quality evaluation and measurement calibration methods. Section 5 proposes fault judgment and disaster damage analysis methods based on multi-source data. The case study using a 10-kV distribution network model is given in Section 6 and the conclusions are stated in Section 7.
This section review and analyze the related work in terms of multi-source data fusion and disaster analysis for distribution networks.
2.1 Research on Multi-Source Data Fusion for Distribution Networks
Regarding the issue of multi-source data fusion in distribution networks, many studies have made feasibility arguments from the perspective of information integration, such as IEC61850-based intelligent substation automation [4], IEC61850-based automatic fault location and isolation for distribution automation [5], IEC61968-based information interaction bus for distribution networks [6], bidirectional communication interface between users and smart grids, and information visualization display research. Based on the IEC61968-11, Nanrui Group defined a standard and unified data exchange model, developed a standardized interface between systems, and gradually performed information interaction and function integration with the energy management system (EMS), production management system (PMS), geographic information system (GIS), marketing management system, 95598 customer service system, electricity information acquisition system, and other systems according to the foundation of the power grid information construction. Data quality significantly affects the accuracy of analysis results, so to achieve the risk control of distribution networks based on multi-source data, it is necessary to solve the data quality problems first [7], for instance, the untimely uploading of protection switch action information, inconsistent time scales, and missing data. Further to compensate for the lack of real-time measurement data, state estimation algorithms have been designed in the literature for distribution networks [8]. In [9], a physical probabilistic network model was proposed for determining the switch states of distribution networks based on data obtained from the electricity information acquisition system deployed in smart grids, and trust propagation algorithms were modified to achieve state estimation based on the graph-theoretic model. In [10], a multi-layer state estimation method based on low-voltage measurements in smart meters was proposed, using an uncertainty propagation theory to integrate different types of data. A Bayesian state estimation method based on deep learning was introduced in [11]. The Monte Carlo simulations were used to train deep neural networks to consider stochastic power injection in the distribution system, and the Bayesian methods were employed to detect and filter out invalid data. In [12], a learning architecture for distribution network state estimation that uses a large amount of historical data to simulate the network state offline was introduced, and a real-time state estimation was achieved. However, the exact mapping relationship between the measured data and the network state was difficult to obtain. In [13], a PD-IoT multi-source data processing and fusion architecture based on edge intelligence of PD-IoT is proposed. The unification of dimension and magnitude under various distribution network data acquisition systems are realized though Box–Cox transform and PCA algorithm. The other typical distribution network state estimation algorithms include a least squares-based state estimation algorithm, a decoupled state estimation algorithm based on measurement transformation, an artificial intelligence-based distribution network state estimation, and an expert system-based distribution network state estimation.
2.2 Research on Distribution Network Disaster Analysis Technology
Considering the distribution network risk assessment, researchers from Iowa State University introduced risk theory into the power system, a concept that has attracted widespread attention [14]. Based on the traditional state analysis method, the Monte Carlo method and other methods, various algorithms for risk assessment have been developed to improve risk assessment efficiency [15], and many risk assessment index systems have been proposed [16]. In [17], the authors developed an active distribution network risk assessment and early warning mechanism to achieve a complete assessment of multiple risk indicators. The proposed model considered a variety of risk factors, including both internal and external factors. Further, in [18], a method for distribution network analysis in a winter storm environment was presented to assess the disaster damage to poles of various materials. In [19], a GIS-driven proactive risk-based management tool integrating outage records, historical weather information, and fault event management was introduced, and a risk model was established based on Bayesian learning for determining the economic impact of natural disasters and defined by a time-series space-time correlation equation. A three-layer risk trust strategy for power systems that makes full use of multi-source data to ensure the reliability index of distribution systems was proposed in [20]. In [21], a data-model hybrid driven resilience assessment framework that considers the impact of multiple factors is established to accurately find the weak links of the transmission system and improve the system resilience. The optimal promotion strategy is selected according to the construction difficulty, resilience improvement ability, and cost analysis. An investigation in [22] posited a reinforcement learning-based Bayesian model tool for smart grids that use indicators such as network architecture and vulnerability models, and employed two learning methods, where Bayesian models was used to calculate the optimal recovery strategy for damage caused by weather effects. According to domestic research in China, distribution network risk assessment methods can be categorized into three main types: analytical methods, simulation methods, and hybrid methods that combine the first two types. The computational complexity of the analytical method increases significantly with the number of fault weights and system states. In addition, the computational time of a simulation method increases sharply with the error accuracy requirements. In [23], the authors applied a complex network theory to realize the active distribution network risk assessment and established a set of multi-level operation risk rapid assessment systems based on an automation system, thus effectively improving the speed of the power system operation risk assessment; and compensating for the deficiency of power flow calculations in multi-level operation risk assessment. In [24], a distribution network fault line grading evaluation method for a typhoon environment, which constructs an index system based on typhoon disaster loss historical fault data, was proposed. This method combines data mining methods to construct a principal component analysis model and a single-level analysis model, calculates the weights of each index separately, and finally uses a comprehensive subject-objective assignment strategy to determine the weights, which is followed by intelligent evaluation and grading of typhoon fault lines. However, due to the complexity of actual distribution networks, theoretical models are difficult to apply directly to an actual network.
(1) Analysis of the existing research on multi-source data integration in distribution networks
Distribution networks in China has shown unbalanced development and a low level of intelligence, requiring the integration and synchronization of data obtained from decentralized systems. Therefore, it is necessary to guarantee the comprehensiveness, accuracy and consistency of multi-source data acquisition. However, research in this field has still been in the initial stage of deepening the application of multi-source data in distribution networks. Therefore, the unified modeling, information integration, and rapid data exchange between heterogeneous systems and the inconsistent time scale of multi-source data requires further in-depth research.
(2) Analysis of the existing research on distribution network disaster risk assessment
The analysis of the current research on the risk assessment technology of distribution networks has shown that, although extensive research has been conducted, there are still certain deficiencies. First, the accuracy of risk assessment models is low, which affects the reliability of a large-scale risk assessment. Second, the risk assessment theory mostly related to the main network’s method without considering the complex network structures and special environments of distribution networks. Therefore, it is necessary to solve the problems of global analysis and spatial and temporal multi-dimensional disaster damage in distribution networks through data-driven active fault diagnosis, providing decision support for disaster damage recovery and emergency management.
3 Multi-Source Data Interaction in a Distribution Network
Considering the requirements of distribution network disaster analysis, a multi-source data interaction and data quality improvement method is proposed as follows.
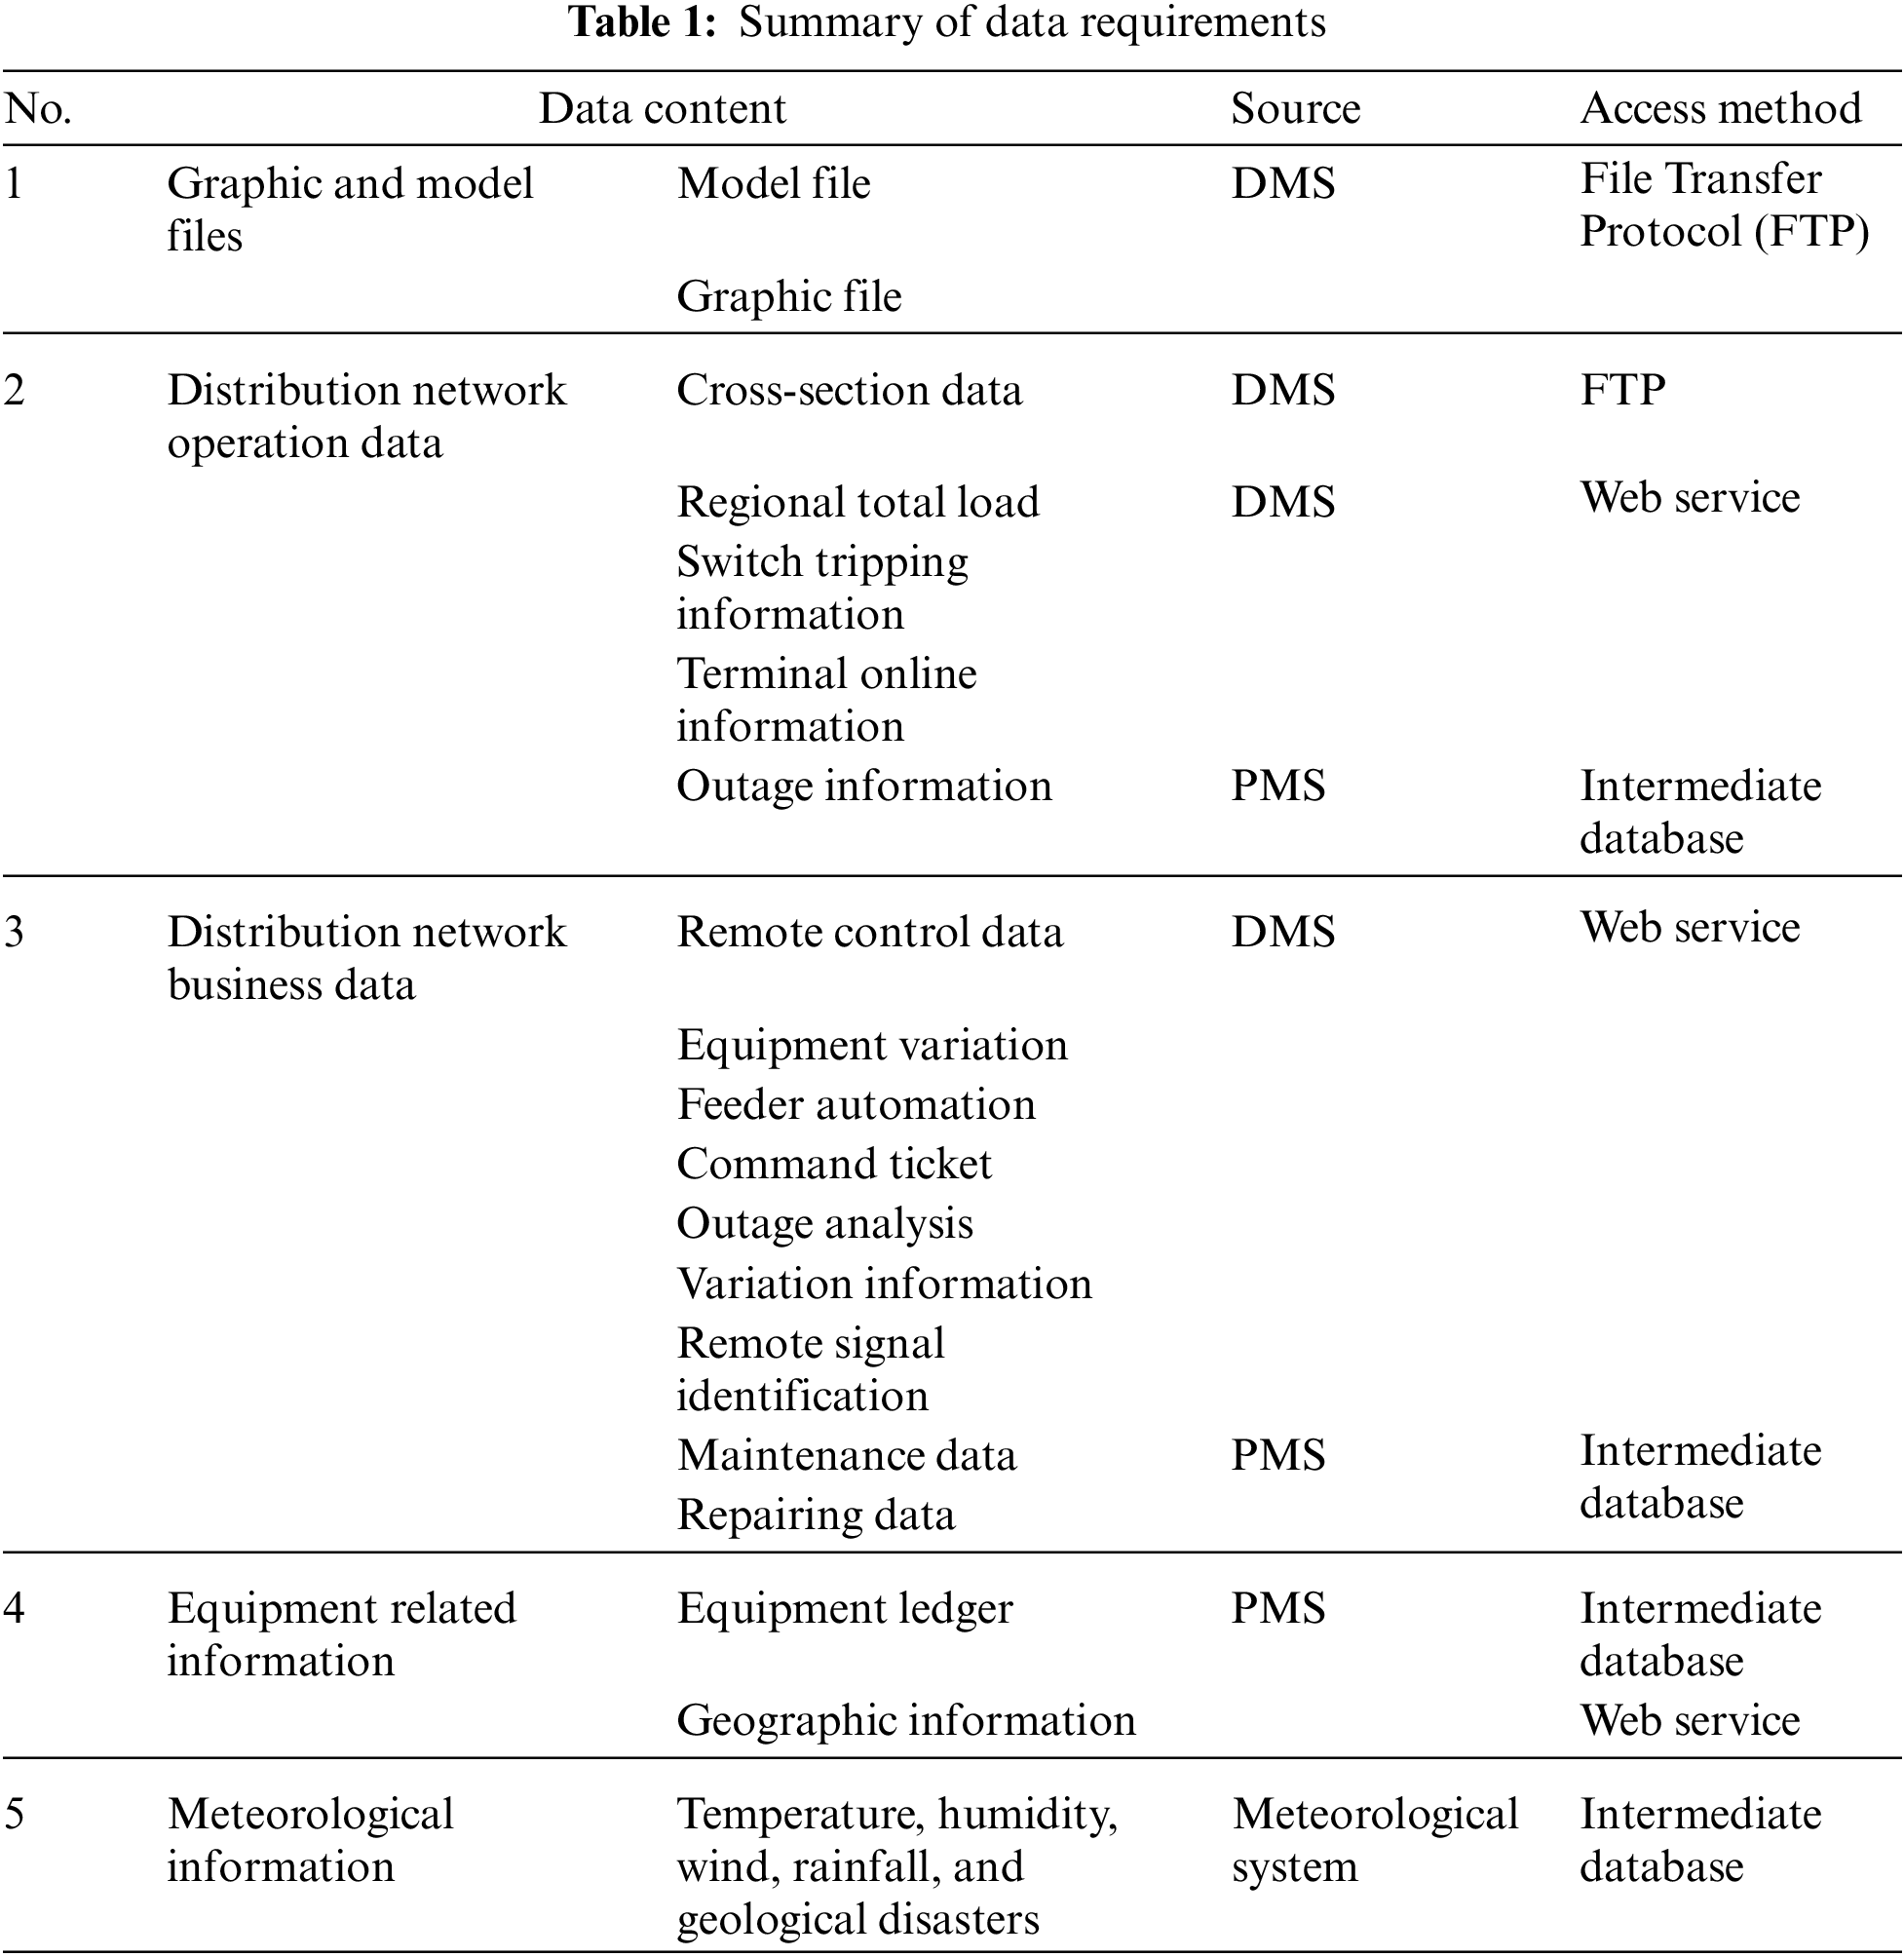
The functions of a distribution network disaster analysis system include quasi-real-time monitoring of the distribution networks, substation outage and resumption statistics, switch tripping monitoring, and real-time statistics and monitoring of disaster losses. The required data are obtained from the distribution management system (DMS), PMS, electricity information acquisition system, and the meteorological systems. These data include graphic and model file, operation and business data, equipment information, and meteorological information. The specific data requirements are presented in Table 1.
As illustrated in Fig. 1, a provincial distribution management system is divided into a production control safety region and an information management safety region according to the system security requirement. The multi-source data of each system are integrated and shared in different ways, for instance, via FTP, Web service, or intermediate database, to meet the interaction requirements of various applications and facilitate information-sharing across different security partitions and regional scopes.
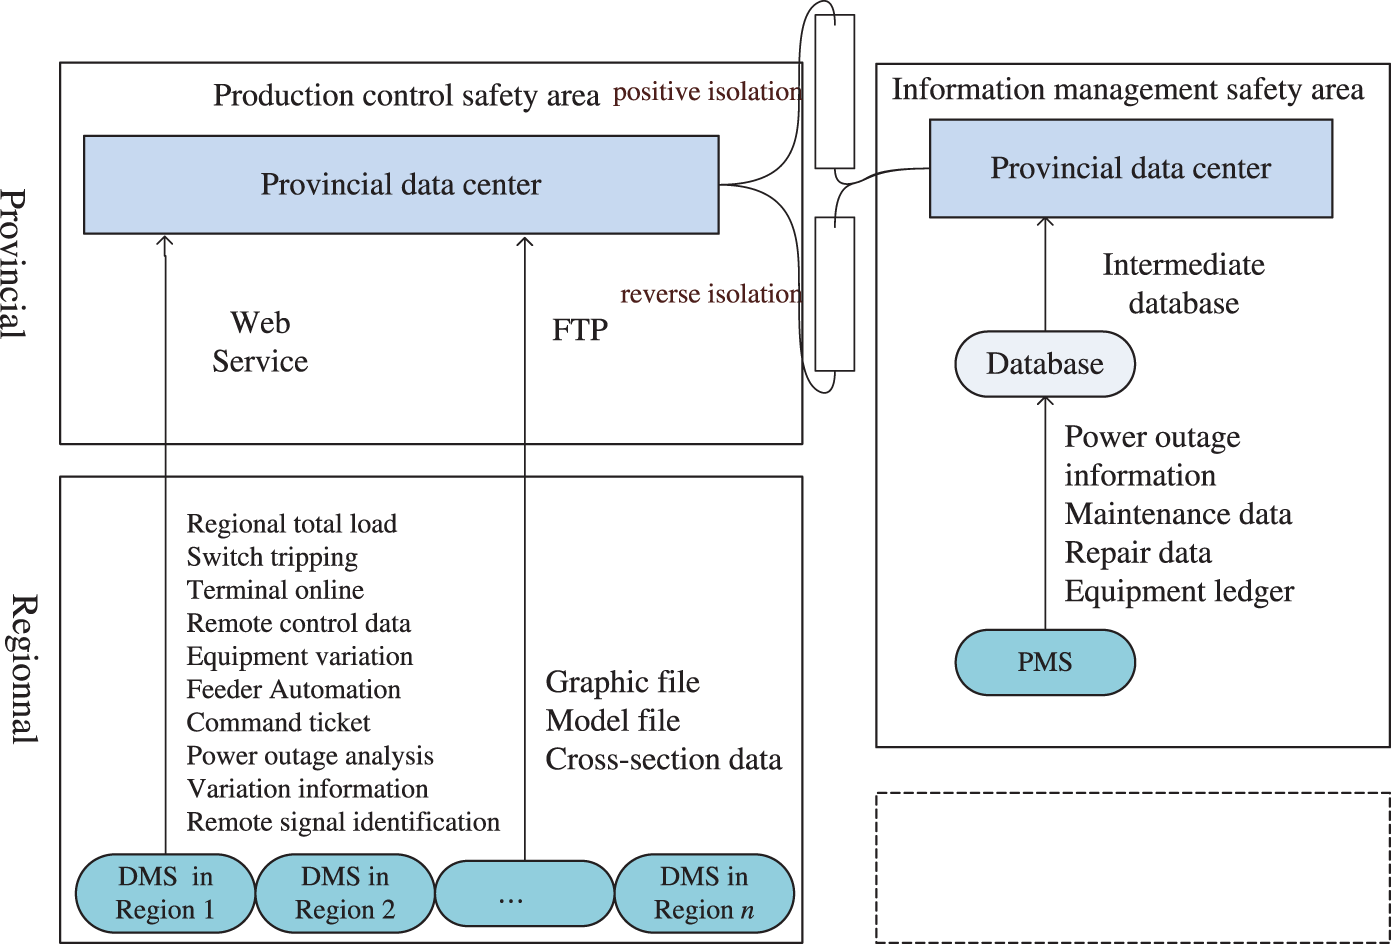
Figure 1: Block diagram of the information interaction process
(1) Distribution network graphic and model file
The distribution network graphic and model files include data from the DMS, and denote the basis of real-time monitoring, statistical analysis, and visualization of the distribution networks. The information is interacted through FTP with a regular incremental push.
(2) Distribution network operation data
The operation data pushed by the DMS mainly include real-time cross-section data (i.e., information on equipment and the corresponding voltage, current, active and reactive powers), switch tripping data, and terminal online data. The real-time cross-section data are transferred with FTP, and other data are sent with Web service.
The operational data transferred via the PMS are mainly distribution network outage data, and these data are interacted via an intermediate database.
(3) Distribution network business data
The business data obtained by the DMS include remote control data, equipment variation data, feeder automation data, command tickets, power outage data, variation information, remote signal identification data. These data are transferred via Web service for information interaction.
The business data obtained from PMS mainly include the maintenance and emergency repair data of the distribution networks, and these data are exchanged through the intermediate database.
(4) Distribution network equipment data
Data related to the distribution network equipment include the information on the equipment ledger and its geographic data, which are obtained from the PMS. The distribution equipment ledger data regularly interact with an intermediate database, and the geographic information data are sent via Web service.
(5) Meteorological data
The meteorological data include temperature, humidity, wind, rainfall, typhoon, and earthquake. These data are stored in an intermediate database and restored via regular push.
4 Data Quality Improvement Methods
In the distribution network data collection process, due to the problems of collection environment, collection equipment, and transmission channel, real-time data can be mixed with a large amount of invalid and uncollected data, which affects the accuracy and credibility of the distribution network operation monitoring significantly. Therefore, it is essential to improve data quality.
The data quality is quantitatively characterized by a value from zero to one. The closer the value is to one, the higher the data quality is; zero indicates that data are not credible, and one means data are credible.
(1) Voltage data quality evaluation
In an open-loop distribution network, each bus voltage should obey the two following laws:
Law 1: The voltage of each bus should be within the rated voltage range limits; namely, it should be less than the maximum voltage allowed but larger than the minimum allowable voltage. The specific expression is as follows:
According to law 1, voltage data quality evaluation principle 1 can be defined as follows. When the bus voltage meets the upper and lower voltage constraints, the quality evaluation indicator is
Law 2: The voltage decreases gradually in the power flow direction, and the voltage value of a specific distribution area is smaller than the voltage value of its upstream area and larger than the voltage value of its downstream area, which can be described as follows:
If there is no bus bar in the distribution area, the bus bar voltage refers to the feeder’s voltage. The voltage of a distribution area containing the substation outlet switch is defined as the substation bus voltage value, and its quality evaluation index is one. When there are many measurement points along the downstream direction of the distribution area, the value of
According to law 2, the second principle of voltage quality evaluation is as follows. When the voltage in the distribution area meets the upstream and downstream voltage limit conditions, the quality evaluation indicator is a certain value. However, when the constraints are not met, the quality evaluation indicator is zero. Assume the bus voltage data quality evaluation indicator is denoted by
According to the bus voltage quality evaluation principles 1 and 2, the sum of the two quality evaluation indicators is used as a total bus voltage quality evaluation indicator, which can be expressed as follows:
(2) Switch telemetry data quality evaluation
The switch telemetry includes active and reactive powers and currents flowing through the switch, and the switch telemetry needs to satisfy the following laws.
Law 3: If the number of closed out-domain switches in a distribution area is greater than one, the telemetry of each out-domain switch in this distribution area needs to be smaller than its in-domain switch telemetry, which is expressed by
According to switch telemetry law 3, switch telemetry quality evaluation principle 1 is defined as follows. When the distribution area out-domain switch telemetry is smaller than the corresponding in-domain switch telemetry, and the minimum distribution area closed out-domain switch number is larger than one, the out-domain switch quality evaluation index is
The telemetry quality evaluation index of the substation outlet switch is specified as one, which means that the measurement is credible.
Law 4: The incoming switch telemetry value in a distribution area should be equal to the sum of all outgoing switch telemetry values, which is given by
According to law 4, switch telemetry quality evaluation principle 2 is defined as follows. When the difference in switch tide between regions in and out of the distribution area is less than a certain error
If the switch telemetry value is zero and the switch is split, the measurement quality evaluation index is one. The initial value of the virtual switch measurement is zero and the measurement quality index is zero.
(3) Switch signal quality evaluation
An incorrect switching signal can lead to an incorrect distribution network topology model. Therefore, an accurate switch signal identification crucial, and the following rule should be satisfied: if the current flows through the switch of a distribution area, its switch state should be closed.
According to the aforementioned law, the switch signal quality evaluation principle can be defined follows. When the switch telemetry quality evaluation index of a distribution area is a non-zero value, the telemetry value is also a non-zero value, then the telemetry status of this switch is closed, and its telemetry quality evaluation index is one. However, if the switch telemetry quality evaluation index is a non-zero value, the telemetry status of this switch is split, the telemetry value is zero, its telemetry quality evaluation index is one. Further, if the switch telemetry quality evaluation index is a non-zero value, the switch telemetry quality evaluation index is also a non-zero value, then the switch telemetry state is split, the telemetry value is non-zero, and its telemetry quality evaluation index is −1. Finally, if the switch telemetry quality evaluation index is zero, the switch telemetry state is indefinite, and its telemetry quality evaluation index is zero. The switch telemetry quality evaluation index is denoted by
The distribution network measurement calibration includes the identification of invalid data and the completion of missing data. Detailed descriptions of the switch telemetry data calibration, signal identification, and bus voltage data calibration are given in the following:
(1) Switch telemetry calibration
First, a quality evaluation of switch telemetry is performed for each distribution area in the direction from parent to child, and the telemetry quality evaluation index of each switch is calculated. Next, starting from the root node of the feeder, the switch telemetry data are corrected and complemented according to the parent–child hierarchical relationship in a distribution area as follows. The specific steps are as follows:
Step 1: If the telemetry quality evaluation index of a switch in the distribution area is one, then that the telemetry value of the switch is reliable.
Step 2: If the telemetry quality evaluation index of four switches in the distribution area is zero, these switches are denoted load-out domain switches, and the evaluation indices of the other switches are non-zero value. This indicates that the telemetry value of an invalid switch is greater than the value of the incoming domain switch, and each invalid measurement is corrected by the average value approximation.
Step 3: If the telemetry quality evaluation index of the incoming switch in the distribution area is zero, and all other switch quality evaluation indices are non-zero values, the telemetry value of the incoming switch represents the sum of downstream switch measurement.
Step 4: If the quality evaluation index of the switch in the distribution area is non-zero value lower than one, the area has a measurement deviation from the actual value.
Step 5: If the minimum distribution area contains both outgoing and incoming problematic domain switches, or a problematic load outgoing domain switch and a problematic connected outgoing domain switch, and the quality evaluation indices of the outgoing and incoming domain switches are not equal to one, the incoming domain switch problem can be converted to the outgoing domain switch problem of the upstream parent minimum distribution area, and the connected outgoing domain switch problem can be converted to the parent–child hierarchical relationship region inbound domain switching problem with the downstream child minimum distribution and can be processed by Steps 2–5.
(2) Switch signal identification
After the identification correction process and complementing of switch telemetry, the switch signal identification correction can be performed as follows:
Step 1: Perform the switch signal quality evaluation by the above-described method for each distribution area from parent to child.
Step 2: When the switch signal quality evaluation indicator is one, the current switch status is credible.
Step 3: When the switch signal quality evaluation index is −1, then the switch correction state should be opposite to the current state, the current switch state should be reversed and corrected, and the switch signal quality evaluation index should be changed to one.
Step 4: When the switch signal corrects the variation, the switch signal in the distribution area associated with the complementary variation switch needs to be corrected again using the above described method.
(3) Busbar voltage identification correction
When the signal of all switches is corrected, the busbar voltage identification correction can be performed as follows:
Step 1: Fill up the voltage of a distribution area where the busbar voltage is not collected and where there is no busbar in order from parent to child, and specify that the voltage of the distribution area is the voltage of its upstream parent distribution area.
Step 2: Evaluate the bus voltage quality for each distribution area.
Step 3: When the voltage quality evaluation indicator is one, it means that the current bus voltage value is credible.
Step 4: When the voltage quality evaluation index is zero, then the voltage value satisfies neither the voltage rating constraint nor the parent–child area voltage constraint. If the parent area voltage of the region is a non-zero value, it is replaced by an approximate parent area voltage value. If the sub-region voltage value of the region is a non-zero value, it is replaced by an approximate maximum sub-region voltage value with the measured quality evaluation index. If the parent and child areas’ voltage values of the region are both non-zero values, they are replaced by the approximate average value of the parent and child voltage values.
Step 5: When the voltage quality evaluation indicator is zero, then the voltage value meet neither the parent area voltage constraint nor the rated value constraint, and the voltage quality evaluation indicator can be set to zero. If the correction indicator is approximately the original indicator, the original value is replaced by the corrected voltage measurement value, and the measurement quality indicator is modified accordingly; otherwise, the measurement value is not changed.
5 Disaster Analysis Based on Multi-Source Data
5.1 Fault Judgment Based on Multi-Source Data
The main purpose of distribution network fault judgment is to analyze the fault outage mode and its scope through outage events, as well as measurement information combined with equipment operation status and topology analysis results. Thus, the power loss area can be analyzed based on a distribution network topology tree. Disaster damage analysis including disaster definition, damage statistics and monitoring can further be achieved [25] base on the result of fault judgment.
The fault point location can be determined based on a distribution network parent-child hierarchical relationship, which mainly includes three evaluation steps. First, the fault judgment is performed based on outage events; then, the fault judgment is conducted based on the phase loss of a public transformer; finally, the fault judgment is performed based on the loss of the bus voltage. The three steps are described in the following:
(1) Fault judgment based on power outage events
A fault point can be located based on the outage event and related public transformer measurement information, combined with the equipment operation status data and topology analysis results; also, the possible outage range can be generated.
(2) Fault judgment based on the phase loss of public transformers
For public transformers, if the phase voltage of one or two phases changes from a non-zero value to zero, it can be judged as a phase loss. Therefore, the distribution transformers with the same phase loss, and the location of the equipment causing these distribution transformers should be determined to find a fault using the topology information.
(3) Fault judgment based on the busbar or station-wide outage
If the line voltage of the substation 10-kV bus decreases from a normal value to zero, the judgment will be triggered. After a certain judgment delay, the line voltage and the outgoing switch current of all feeders corresponding to this bus are analyzed, and they are all zeros, it is judged that the bus is out of power. In addition, all transformers on the feeders connected to this busbar will be judged to be in the outage range.
However, if all 10-kV buses of a substation are in the outage status, it is judged that the entire station is out of power. Then, all transformers on the feeders supplied by the substation are judged to be in the outage range.
5.2 Disaster Damage Analysis for Distribution Networks
Real-time access to distribution network models, graphics, and data can be realized through data fusion of multiple system. Then, real-time monitoring of the distribution network operation status and real-time statistics and the analysis of disaster losses down to the township or street granularity can be realized. The disaster analysis process includes the disaster definition process, disaster statistics, data comparison, and disaster monitoring.
(1) Disaster definition
To provide a flexible disaster customization function, the disaster definition is performed to provide the time and scope bases for disaster statistical analysis. This process includes the definition of the start and end times, disaster impact area, disaster type, and recovery period days.
It should be noted that defining a historical disaster starts with disaster data statistics. However, a future disaster is defined based on the predicted disaster time, disaster impact area and disaster type. When the disaster starting time comes, the disaster statistics operation also starts. Query, modification and deletion operations are performed to define disasters. After a disaster definition is obtained, a re-statistic operation is conducted. The time and scope of disaster can be adjusted in real time, and the statistical operation results are modified according to the new definition.
(2) Disaster damage statistics based on multi-source data
Outage scope analysis method was adopted in both distributed and centralized ways, combining the DMS for outage analysis. The real-time statistics on the scope of the disaster impact and disaster recovery progress under major disaster scenarios are obtained by real-time processing of planned outage data, fault outage data, real-time telegrams and location data. The outage, restoration line, and distribution transformer are all counted. In addition, the system conducts multi-level statistical analysis and real-time monitoring at provincial, municipal, county and township levels.
It should be noted that multi-level outage and resumption statistics are obtained for provinces, cities, counties, and townships. Based on the disaster definition, the system obtains quasi-real-time and historical statistics of power outages and resumptions at specified values of time and space of the disaster. It also employs statistical methods for disaster-related and affected outages. Since only the power outage during the disaster period is considered, accurate classification of disaster loss statistics can be achieved. The flowchart of the described process is presented in Fig. 2.
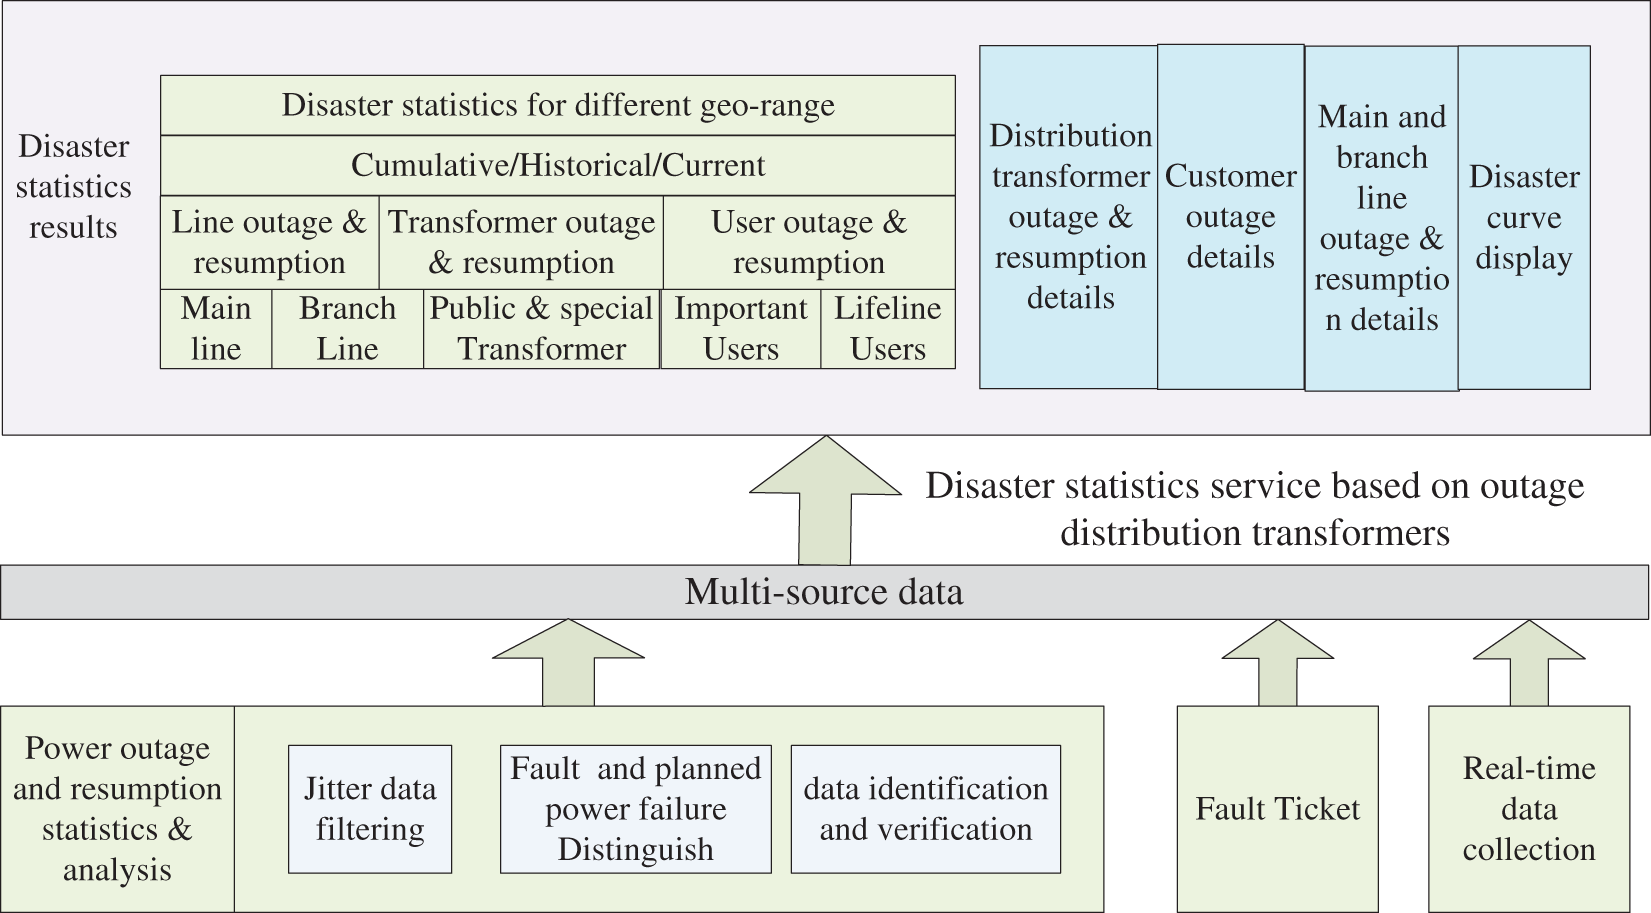
Figure 2: Flow chart of the disaster statistics determination based on multi-source data
The main classification process of outage types is as follows:
1) Based on the administrative division, the outage records are divided into different levels such as provinces, cities and counties.
2) Detailed information on the installation location of distribution transformers in villages or at the township-level areas is provided to determine the township-level division of outage records.
3) Based on the outage resumption message, it is identified whether the action switch belongs to the incoming switch or the first switch under no load after the incoming switch, and it is determined whether this outage record is a trunk line outage record.
4) Information on important and lifeline users is obtained based on the PMS to distinguish whether the affected area in the outage record is an important or lifeline user.
(3) Disaster damage data comparison
Based on real-time disaster data, the system performs a disaster damage data comparison for 10-kV lines, trunk lines, branch lines, distribution transformers, and users in different areas of the same disaster, visually reflecting the severity of a disaster in different cities and providing data for provincial repair dispatching. At the municipal level, a comparison of the disaster damage data of 10-kV lines, trunk lines, branch lines, distribution lines, and important users in different counties experiencing the same disaster to provide a basis for municipal emergency repair dispatching.
Further, based on historical disaster data, the system compares the disaster loss data at the local and municipal levels. Multiple disasters can be selected, and disaster loss data of 10-kV lines, trunk lines, branch lines, distribution lines, and important users in different disasters can be compared to explore the effect of season, path and other factors of disasters, and provide a data for subsequent disaster prevention and mitigation.
(4) Disaster monitoring
The system provides a data display of power outage, restoration, unrestored power, and restoration ratio and displays the bar graph and curve display functions for provincial, local, and county-level disaster data. It compares the power outage and restoration data using bar graphs forms to control the impact of disasters. In addition, it displays the restoration ratio of regional power outage data through curve graphs to reflect the restoration of the power supply in each region. By displaying the cumulative, historical, and current curves at one point every 5 min, it intuitively monitors the three-level outage and restoration situation of trunk lines, branch lines, distribution transformers and customers, thus providing multi-dimensional and multi-level display data for disaster monitoring themes.
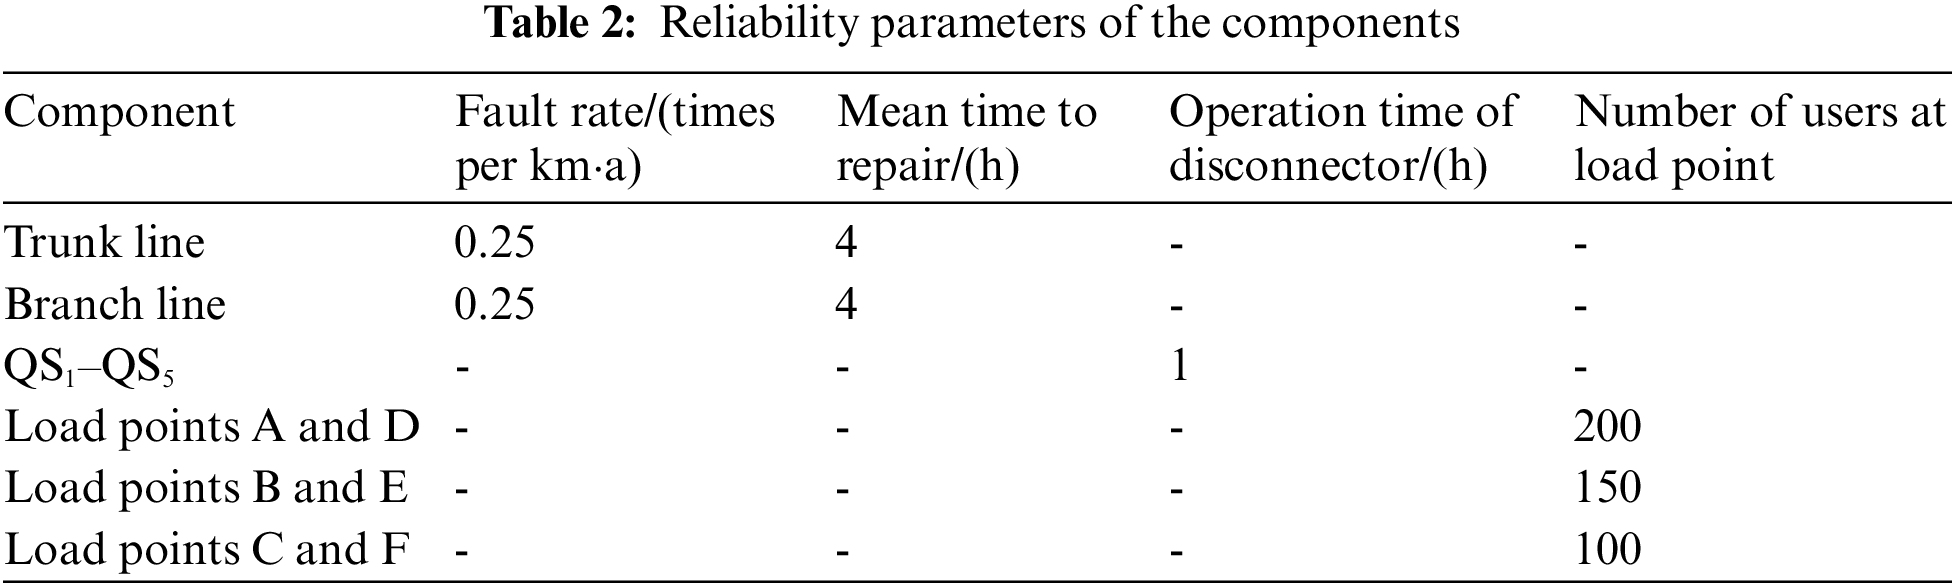
A 10-kV distribution network model was constructed, as illustrated in Fig. 3, where W1 and W2 denote power sources; QS1, QS2, …, QS5 are isolation switches, where QS5 is a tie switch, which is normally in the open state. Line 1 is from W1 to QS5. Line 2 is from W2 to QS5. FU1, FU2, …, FU6 denote fuses, and A, B, …, F are concentrated load points. The reliability parameters of the components are presented in Table 2.
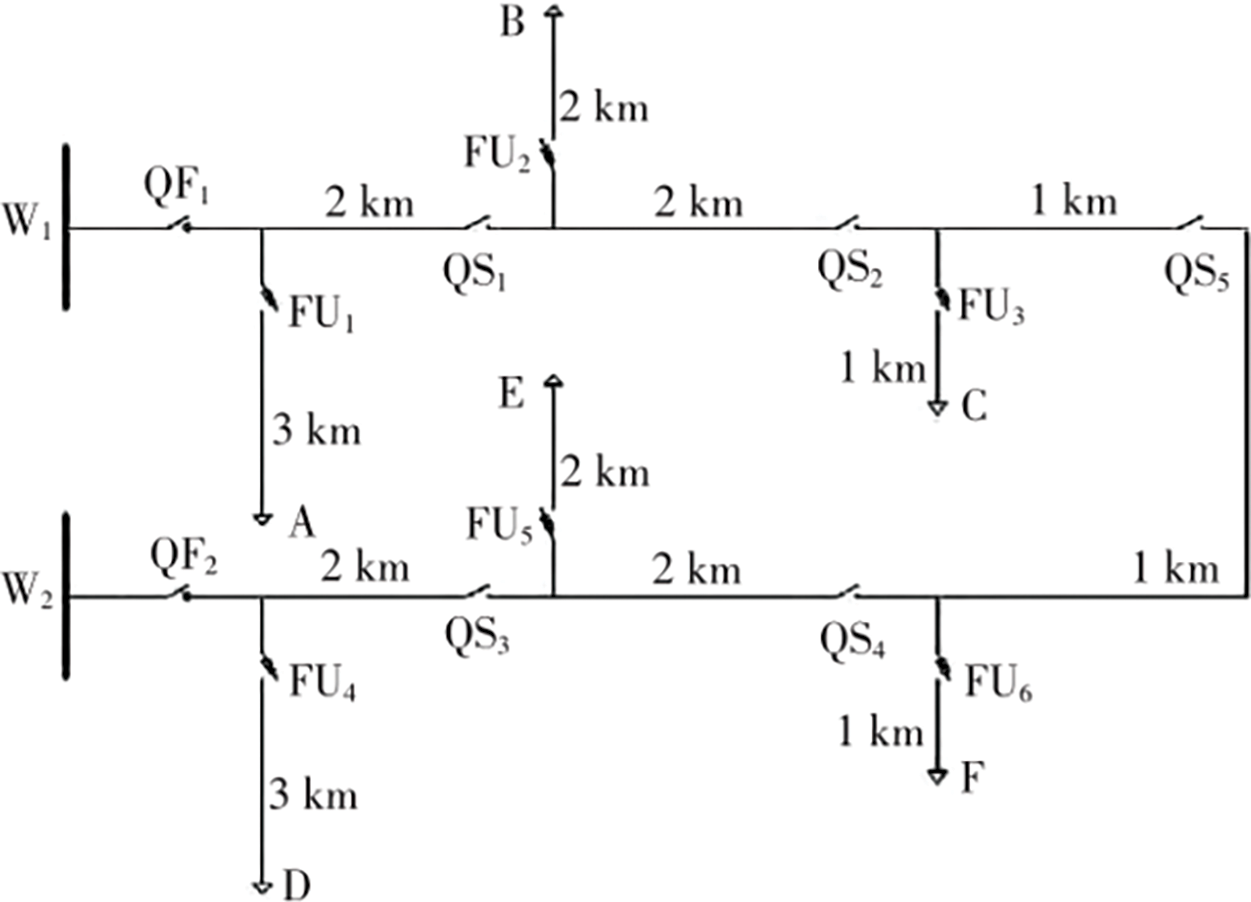
Figure 3: Distribution network model
When the distribution network’s state was “normal operation”, Lines 1 and 2 operated in an open-loop manner according to the ring network. When the distribution network’s state is “associated line maintenance”, namely, when any of Lines 1 and 2 was maintained, the other line operated as a radial connection. Different operational modes corresponded to different average fault time r. The case of simultaneous maintenance or failure of the two lines was not considered in the calculation example due to the low probability.
The parameters were set as follows. The current carrying capacity of the 10-kV insulated conductor line was 505 A, and the power capacity was 9.093 MVA. The rated capacity of the line is 9 MVA. At time t0, the powers of load points A, B, and C were 2.2, 1.7, and 1.1 MW, while the corresponding power factors were 0.95, 0.90, and 0.92, respectively. The powers of load points D, E, and F are 2.2, 1.7, and 1.1 MW, while the power factors are 0.95, 0.90, and 0.92, respectively. When load points B and C were transferred to Line 2, the minimum voltage of the network was 9.20 kV, and the maximum load was 8.94 MVA. However, when load point C was transferred to Line 2, the minimum voltage of the network was 9.72 kV, and the maximum load was 6.97 MVA. During the open-loop operation, the minimum voltage of the network was 9.93 kV, and the maximum load was 5.51 MVA.
(1) Fault analysis of the ring network
When the distribution network’s state was “normal operation”, if the 2-km section of the lines failed, loads B and C could be powered by the interconnection line. The outage time for opening QS1 and closing QS5 was 1 h.
When the 3-km section of the trunk line failed, load point A could recover the power supply by pulling off QS1 within 1 h. Thus, load point B could be powered only after the line was repaired, namely, after 4 h. Load point C was powered by the tie line within 1 h by opening QS2 and closing QS5.
In the case of fault in the 1-km section of the trunk line, load points A and B could recover power supply from the main power supply in 1 h by opening QS2. Load point C needed to be repaired in this section after 4 h.
The failure rate of load point A was 0.5 + 0.5 + 0.25 + 0.75 = 2 times/a.
The average time of each failure at load point A was (0.5 × 4 + 0.5 × 1 + 0.25 × 1 + 0.75 × 4)/2 = 2.88 h.
The average annual outage time of load point A was λ × r = 2 × 2.88 = 5.75 h/a.
Similarly, the failure outage data of the other load points were obtained, and the results are shown in Table 3.
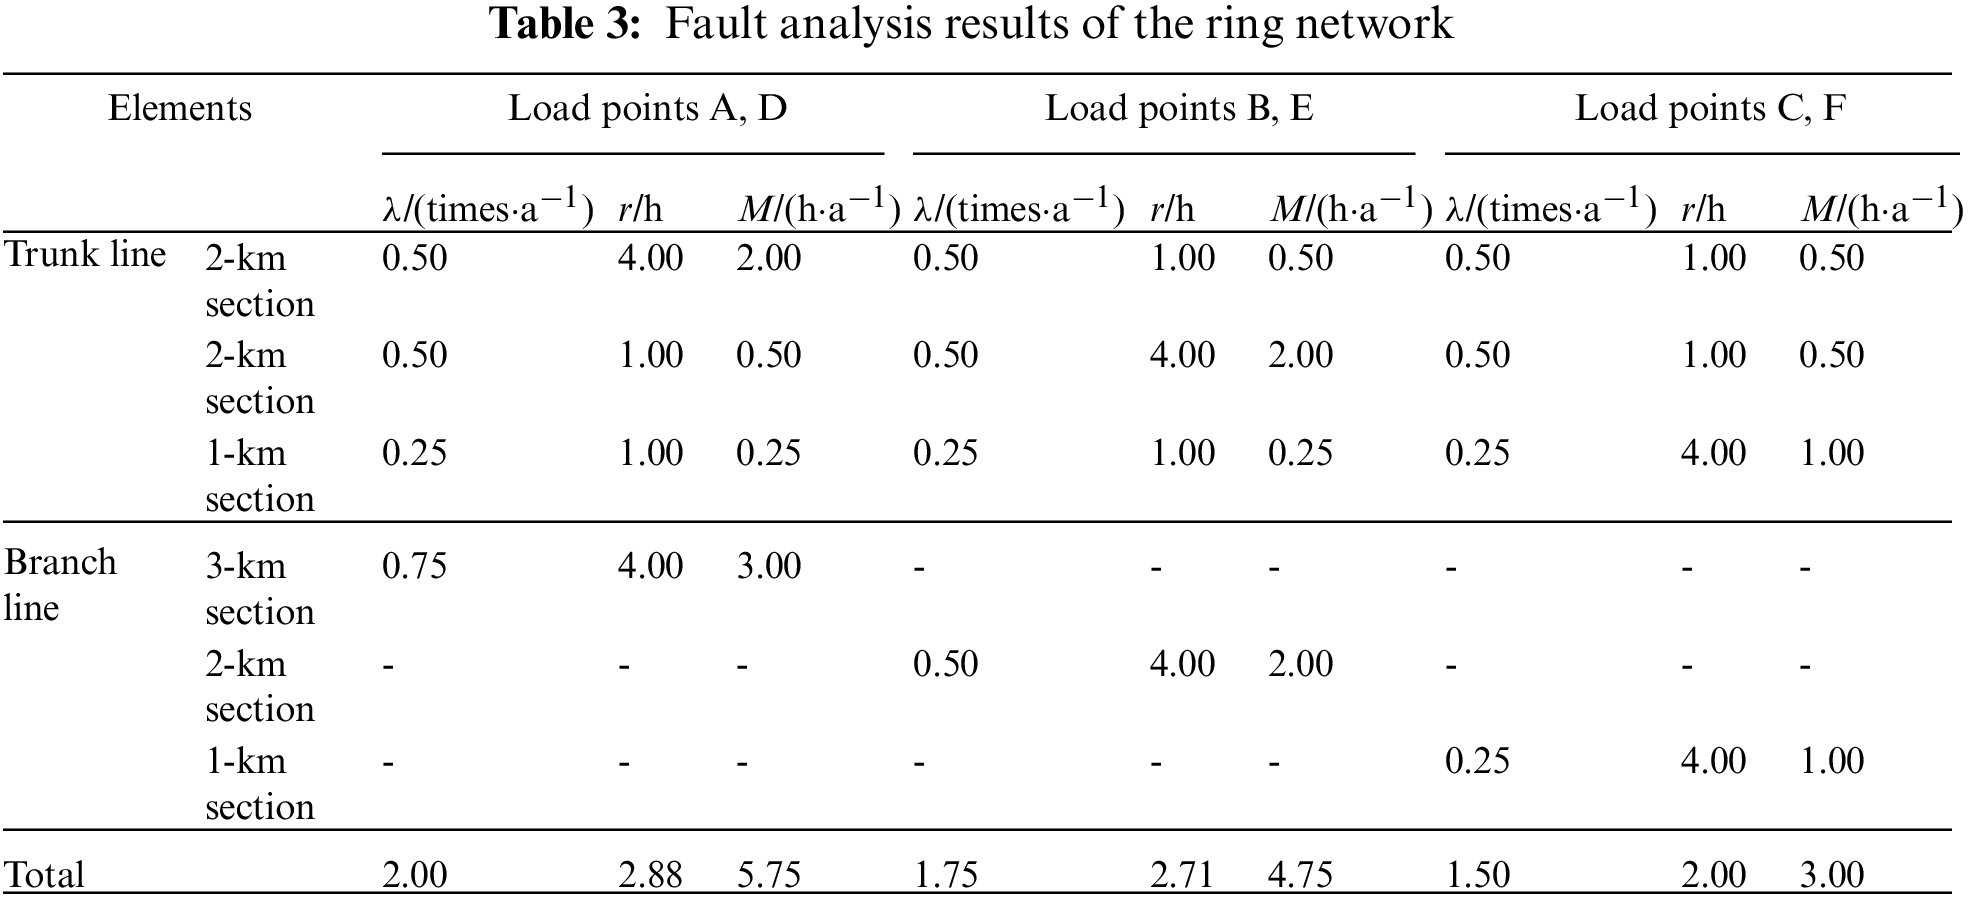
In a ring network, the average annual outage time of load points A and D is 5.75 h/a, which is the longest among all the load points. The shortest average annual outage time of 3 h/a is in the load points C and F.
(2) Fault analysis of the radial network
When the distribution network operation scenario is an “associated line maintenance”, the fault outage data of each load point can be calculated similarly, as shown in Table 4.
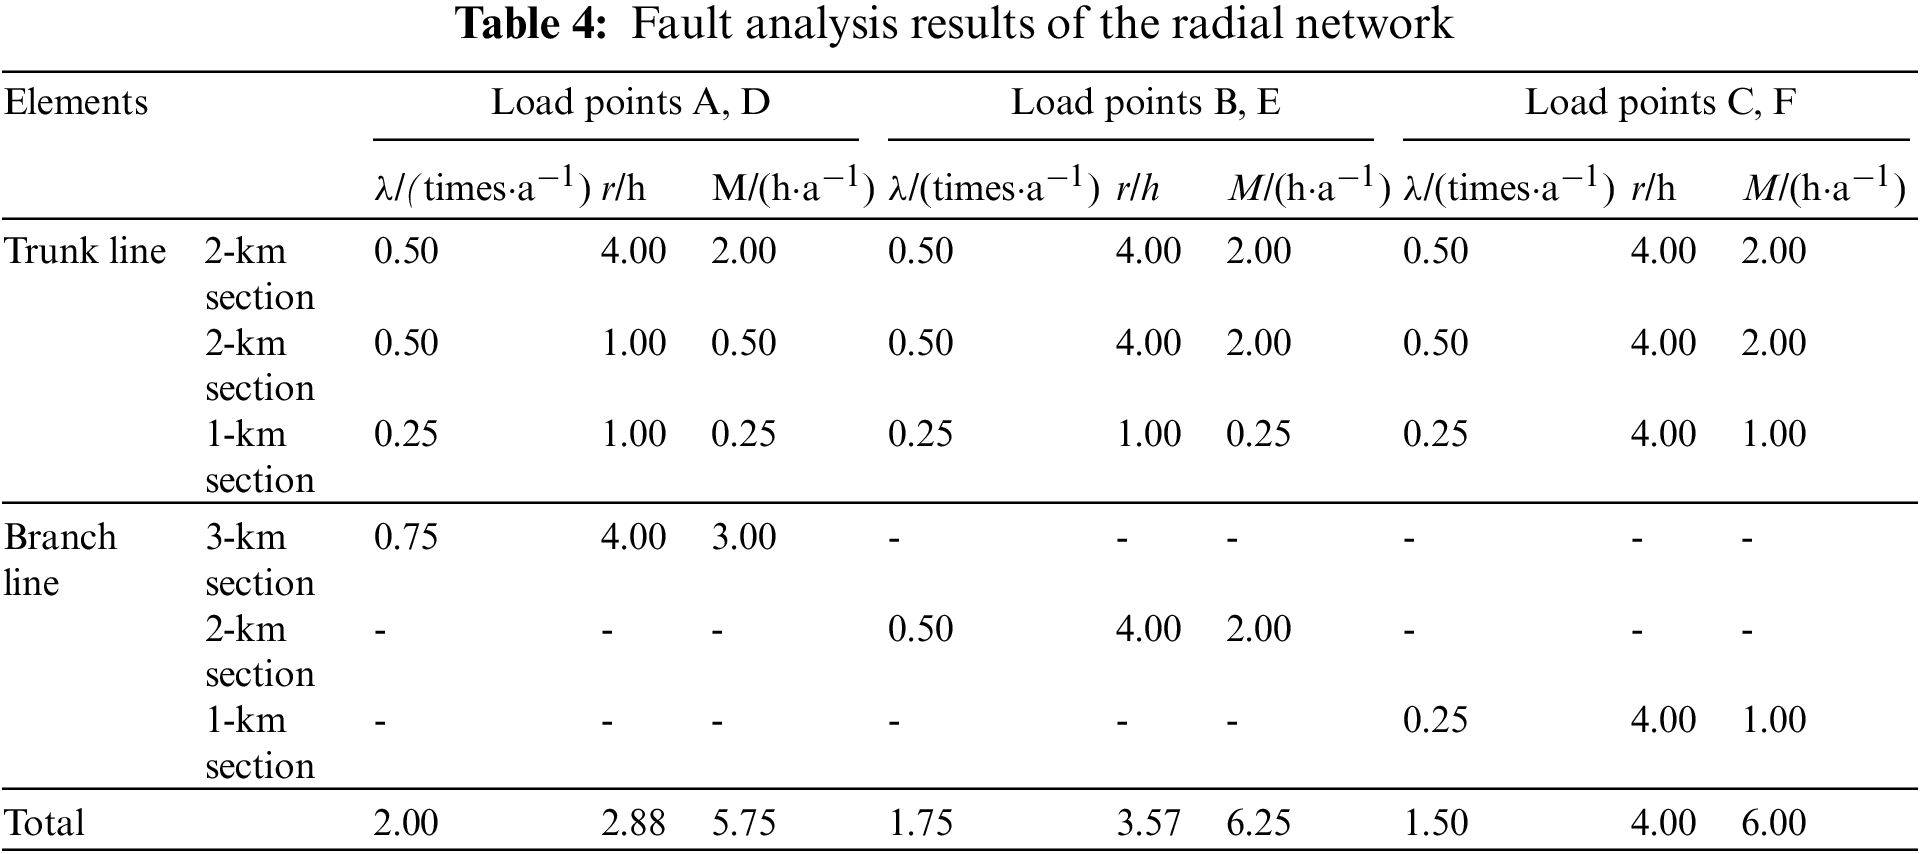
In the case of fault in the 1-km section of the trunk line, load points A and B could recover power supply from the main power supply in 1 h by opening QS2. Load point C needed to be repaired in this section after 4 h.
The failure rate of load point C was 0.5 + 0.5 + 0.25 + 0.25 = 1.5 times/a.
The average time of each failure at load point C was (0.5 × 4 + 0.5 × 4 + 0.25 × 4 + 0.25 × 4)/1.5 = 4 h.
The average annual outage time of load point C was λ × r = 1.5 × 4 = 6 h/a.
Similarly, the failure outage data of the other load points were obtained, and the results are shown in Table 4.
In a radial network, the average annual outage time is larger than in ring network. The longest average annual outage time is 6.25 h/a in load points B and E, which is 0.5 h/a higher than in ring network. As a result, it can be indicated that the stability of ring network is better than radial network, especially facing natural disasters.
The safe and stable operation of distribution networks is severely threated by natural disasters resulting in power failures. Continuous improvement in intelligence of distribution grid has resulted in the accumulation of a large amount of operation data on the distribution grid. A data-driven approach is proposed in this paper, which integrates graphic and model files, operational and business data, and equipment and meteorological data from DMS, PMS, and electricity information acquisition systems. It proposes a multi-source data interaction method and a data quality improvement method; achieves fault judgment based on the outage events, phase loss of public transformers and busbar loss of voltage; and designs a multi-source data-based approach. The approach with the functions of disaster definition, disaster damage statistics, disaster comparison and data monitoring is designed based on multi-source data. The proposed system can achieve real-time and accurate acquisition of disaster loss information and accurate analysis and evaluation of disaster loss in a distribution network. The feasibility of the designed method was verified by case study for a 10-kV distribution network. The maximal average annual outage time of load point A was 5.75 h/a in ring network and 6.00 h/a in radical network. The results will be more significant as the data becomes richer, which can provide technique support for the improvement of stability in distribution networks.
Funding Statement: The authors received no specific funding for this study.
Conflicts of Interest: The authors declare that they have no conflicts of interest to report regarding the present study.
References
1. Hamidan, M. A., Borousan, F. (2022). Optimal planning of distributed generation and battery energy storage systems simultaneously in distribution networks for loss reduction and reliability improvement. Journal of Energy Storage, 46(4), 103844. https://doi.org/10.1016/j.est.2021.103844 [Google Scholar] [CrossRef]
2. Borousan, F., Hamidan, M. A. (2023). Distributed power generation planning for distribution network using chimp optimization algorithm in order to reliability improvement. Electric Power Systems Research, 217(5), 109109. https://doi.org/10.1016/j.epsr.2022.109109 [Google Scholar] [CrossRef]
3. Saboori H., Hemmati R., Jirdehi M. A. (2015). Reliability improvement in radial electrical distribution network? By optimal planning of energy storage systems. Energy, 93(2), 2299–2312. https://doi.org/10.1016/j.energy.2015.10.125 [Google Scholar] [CrossRef]
4. Jankee, P., Awodele, K. (2019). Design of an IEC61850 based substation automation and protection panel: Including peer to peer relay communication. 2019 Southern African Universities Power Engineering Conference, Bloemfontein, South Africa. [Google Scholar]
5. Song, J., Zhou, J., Liu, Y., Luo, L., Liu, J. (2016). Quick fault location and isolation of the distribution network based on IEC6185. CIRED Workshop, Helsinki. [Google Scholar]
6. Liu, P., Lyu, G. X., Du, J., Kang, X., Guo, S. et al. (2018). Study on information exchange technology of advanced distribution automation system. International Conference on Information Systems and Computer Aided Education (ICISCAE), pp. 227–230. Changchun, China. [Google Scholar]
7. Wang, P., Lin, J., Guo, Q., Luan, W., Lin, T. (2017). Distribution system data analytics and applications. Power Grid Technology, 41(10), 3333–3340. [Google Scholar]
8. Primadianto, A., Lu, C. N. (2017). A review on distribution system state estimation. IEEE Transactions on Power systems, 32(5), 3875–3883. https://doi.org/10.1109/TPWRS.2016.2632156 [Google Scholar] [CrossRef]
9. Jiang, W., Chen, J., Tang, H., Cheng, S., Hu, Q. et al. (2019). A physical probabilistic network model for distribution network topology recognition using smart meter data. IEEE Transactions on Smart Grid, 10(6), 6965–6973. https://doi.org/10.1109/TSG.2019.2936148 [Google Scholar] [CrossRef]
10. Pau, M., Patti, E., Barbierato, L., Estebsari, A., Pons, E. et al. (2019). Design and accuracy analysis of multilevel state estimation based on smart metering infrastructure. IEEE Transactions on Instrumentation and Measurement, 68(11), 4300–4312. https://doi.org/10.1109/TIM.2018.2890399 [Google Scholar] [CrossRef]
11. Mestav, K. R., Luengo-Rozas, J., Tong, L. (2019). Bayesian state estimation for unobservable distribution systems via deep learning. IEEE Transactions on Power Systems, 34(6), 4910–4920. https://doi.org/10.1109/TPWRS.2019.2919157 [Google Scholar] [CrossRef]
12. Zamzam, A. S., Fu, X., Sidiropoulos, N. D. (2019). Data-driven learning-based optimization for distribution system state estimation. IEEE Transactions on Power systems, 34(6), 4796–4805. https://doi.org/10.1109/TPWRS.2019.2909150 [Google Scholar] [CrossRef]
13. Yuan, Q., Pi, Y., Kou, L., Zhang, F., Li, Y. et al. (2022). Multi-source data processing and fusion method for power distribution Internet of Things based on edge intelligence. Frontiers in Energy Research, 10, 891867. https://doi.org/10.3389/fenrg.2022.891867 [Google Scholar] [CrossRef]
14. Mccalley, J. D., Vittal, V., Abi-Samra, N. (1999). An overview of risk-based security assessment. IEEE Power Engineering Society Summer Meeting, pp. 173–178. Edmonton, AB, Canada. [Google Scholar]
15. Chopra, S. S., Dillon, T., Bilec, M. M., Khanna, V. (2016). A network-based framework for assessing infrastructure resilience: A case study of the London metro system. Journal of Royal Society Interface, 13(118), 4773–4783. https://doi.org/10.1098/rsif.2016.0113 [Google Scholar] [PubMed] [CrossRef]
16. Salman, A. M., Li, Y., Stewart, M. G. (2015). Evaluating system reliability and targeted hardening strategies of power distribution systems subjected to hurricanes. Reliability Engineering & System Safety, 144(12), 319–333. https://doi.org/10.1016/j.ress.2015.07.028 [Google Scholar] [CrossRef]
17. Chen, X., Qiu, J., Reedman, L., Dong, Z. Y. (2019). A statistical risk assessment framework for distribution network resilience. IEEE Transactions on Power systems, 34(6), 4773–4783. https://doi.org/10.1109/TPWRS.2019.2923454 [Google Scholar] [CrossRef]
18. Michel, B., Massignan, J. A. D., Fanucchi, R. Z., Camillo, M. H., London, J. B. et al. (2019). Probabilistic assessment of power distribution systems resilience under extreme weather. IEEE Systems Journal, 13(2), 1747–1756. https://doi.org/10.1109/JSYST.2018.2853554 [Google Scholar] [CrossRef]
19. Leite, J. B., Mantovani, J. R. S., Dokic, T., Yan, Q., Chen, P. C. et al. (2019). Resiliency assessment in distribution networks using GIS based predictive risk analytics. IEEE Transactions on Power Systems, 34(6), 4249–4257. https://doi.org/10.1109/TPWRS.2019.2913090 [Google Scholar] [CrossRef]
20. Li, G., Yin, Z., Zhang, G., Huang, W., Li, L. et al. (2018). Risk assessment of power system based on a three level capability from active distribution network. International Conference on Applied Energy, pp. 2–25. Hong Kong, China. [Google Scholar]
21. Yang, R., Li, Y. (2022). Resilience assessment and improvement for electric power transmission systems against typhoon disasters: A data-model hybrid driven approach. Energy Reports, 8(4), 10923–10936. https://doi.org/10.1016/j.egyr.2022.08.226 [Google Scholar] [CrossRef]
22. Wadhawan, Y., Neuman, C. (2018). RL-BAGS: A tool for smart grid risk assessment. IEEE International Conference on Smart Grid & Clean Energy Technologies, Kajang, Malaysia. [Google Scholar]
23. Wang, Y., Yang, J., He, Y., Zhao, Z., Wangping, W. U. (2016). Rapid risk assessment of active distribution network multi-level operation based on complex network theory. Automation of Electric Power Systems, 40(14), 65–71. [Google Scholar]
24. Sun, M., Su, Y., Shao, X., Zhou, J., Jin, Y. et al. (2019). Grading evaluation of typhoon fault impact on distribution lines based on data mining. Zhejiang Electric Power, 38(10), 78–83. [Google Scholar]
25. Hou, H., Zhang, Z., Yu, J., Wei, R., Huang, Y. et al. (2022). Damage prediction of 10 kV power towers in distribution network under typhoon disaster based on data-driven model. International Journal of Electrical Power & Energy Systems, 142(12), 108307. https://doi.org/10.1016/j.ijepes.2022.108307 [Google Scholar] [CrossRef]
Cite This Article
 Copyright © 2023 The Author(s). Published by Tech Science Press.
This work is licensed under a Creative Commons Attribution 4.0 International License , which permits unrestricted use, distribution, and reproduction in any medium, provided the original work is properly cited.
 Downloads
 Citation Tools