
 Submit a Paper
 Propose a Special lssue
 Open Access
ARTICLE
Research on Operation Optimization of Heating System Based on Electric Storage Coupled Solar Energy and Air Source Heat Pump
1
Technical Management Department, Beijing District Heating Group Co., Ltd., Beijing, 100028, China
2
College of Biochemical Engineering, Beijing Union University, Beijing, 100032, China
3
School of Energy and Environmental Engineering, Hebei University of Technology, Tianjin, 300401, China
4
Technology Research and Development Department, Beijing Heating Project Design Co., Ltd., Beijing, 100071, China
5
Digital Intelligence Technology Center, China Railway Group Mechanical and Electrical Installation Co., Ltd.,
Beijing, 100049, China
* Corresponding Author: Lu Wang. Email:
(This article belongs to the Special Issue: Key Technologies of Renewable Energy Consumption and Optimal Operation under )
Energy Engineering 2023, 120(9), 1991-2011. https://doi.org/10.32604/ee.2023.029749
Received 06 April 2023; Accepted 05 May 2023; Issue published 31 July 2023
 View Full Text
 Download PDF
Abstract
For heating systems based on electricity storage coupled with solar energy and an air source heat pump (ECSA), choosing the appropriate combination of heat sources according to local conditions is the key to improving economic efficiency. In this paper, four cities in three climatic regions in China were selected, namely Nanjing in the hot summer and cold winter region, Tianjin in the cold region, Shenyang and Harbin in the severe cold winter region. The levelized cost of heat (LCOH) was used as the economic evaluation index, and the energy consumption and emissions of different pollutants were analyzed. TRNSYS software was used to simulate and analyze the system performance. The Hooke-Jeeves optimization algorithm and GenOpt software were used to optimize the system parameters. The results showed that ECSA system had an excellent operation effect in cold region and hot summer and cold winter region. Compared with ECS system, the system energy consumption, and the emission of different pollutants of ECSA system can be reduced by a maximum of 1.37 times. In cold region, the initial investment in an air source heat pump is higher due to the lower ambient temperature, resulting in an increase in the LOCH value of ECSA system. After the LOCH value of ECSA system in each region was optimized, the heating cost of the system was reduced, but also resulted in an increase in energy consumption and the emission of different pollutant gases.Graphic Abstract
Keywords
Nomenclature
| A | Solar heat collection area, m2 |
| Cp | Specific heat capacity, kJ/(kg·oC) |
| Cn | Maintenance cost of the system in year, CNY |
| CR | System operation cost, CNY |
| f | Solar guarantee rate, % |
| H | Latent heat, kJ/kg |
| h | Heat exchanger coefficient, W/(m·K) |
| Lo | Initial investment, CNY |
| J | Conversion coefficient of pollutant emission |
| m | Mass flower, kg/h |
| N | System life, year |
| n | Year within the operating life of the system, year |
| P | Power, kW |
| Qd | Heating supply per unit area of the heating system, kWh/m2 |
| QH | Design building heat load, MJ |
| Qn | Heat supply of the system, kWh |
| q | Heat storage density of PCM, MJ/kg |
| R | Discount rate, % |
| ri | Radius of copper pipe, m |
| St | Average daily solar radiation, MJ/(m2·d) |
| SD | Standard Deviation |
| T | Temperature, oC |
| t | Time, h |
| W | PCM weight, kg |
| Z | Annual cost value, CNY/year |
With the rapid growth of the global economy, the demand for building energy consumption is gradually increasing. In 2018, China’s total energy consumption was about 4.5 billion tons of standard coal, of which building energy consumption exceeded 20% [1], and heating consumption accounts for a relatively large proportion. The use of clean energy to replace traditional fossil fuel heating is crucial for energy savings and reducing environmental pollution. However, regional climate conditions and building structure affect building energy demand, therefore, it is very important to find a suitable heating scheme for buildings with different structures in different regions [2]. As a clean heating system, solar energy has the advantages of mature technology and relatively low cost [3,4]. However, due to intermittency, there is a mismatch between the availability of solar energy resources and the heat demands of buildings [5].
The coupling system of solar energy and electric heating can solve the above problems. The electric heating system includes direct electric heating, heat pump and electric heat storage. Normally, the main form of direct electric heating is the electric heater, electric heating film and air conditioner [6–8], and the advantage is that it is easy to control and simple to construct. However, it is expensive to run because electricity is still an expensive source of energy under current energy structures. In contrast, a heat pump with high electric-thermal conversion efficiency is an effective approach to achieve a low power cost e.g., air-source heat pump [9], which uses air as a low-grade heat source, and has the advantages of environmental protection and energy savings. In addition, the solar air-source heat pump system can be divided into series system [10–12], parallel system [13,14] and dual heat source system [15,16]. However, the energy efficiency of the air-source heat pump relies heavily on outdoor environmental conditions, e.g., ambient temperature and humidity, which severely limits its application scope. Moreover, massive electric heating during peak hours can increase the peak-load of regional power grids, especially in densely populated areas. Therefore, the air-source heat pump is not conducive to power grid peak clipping and valley filling.
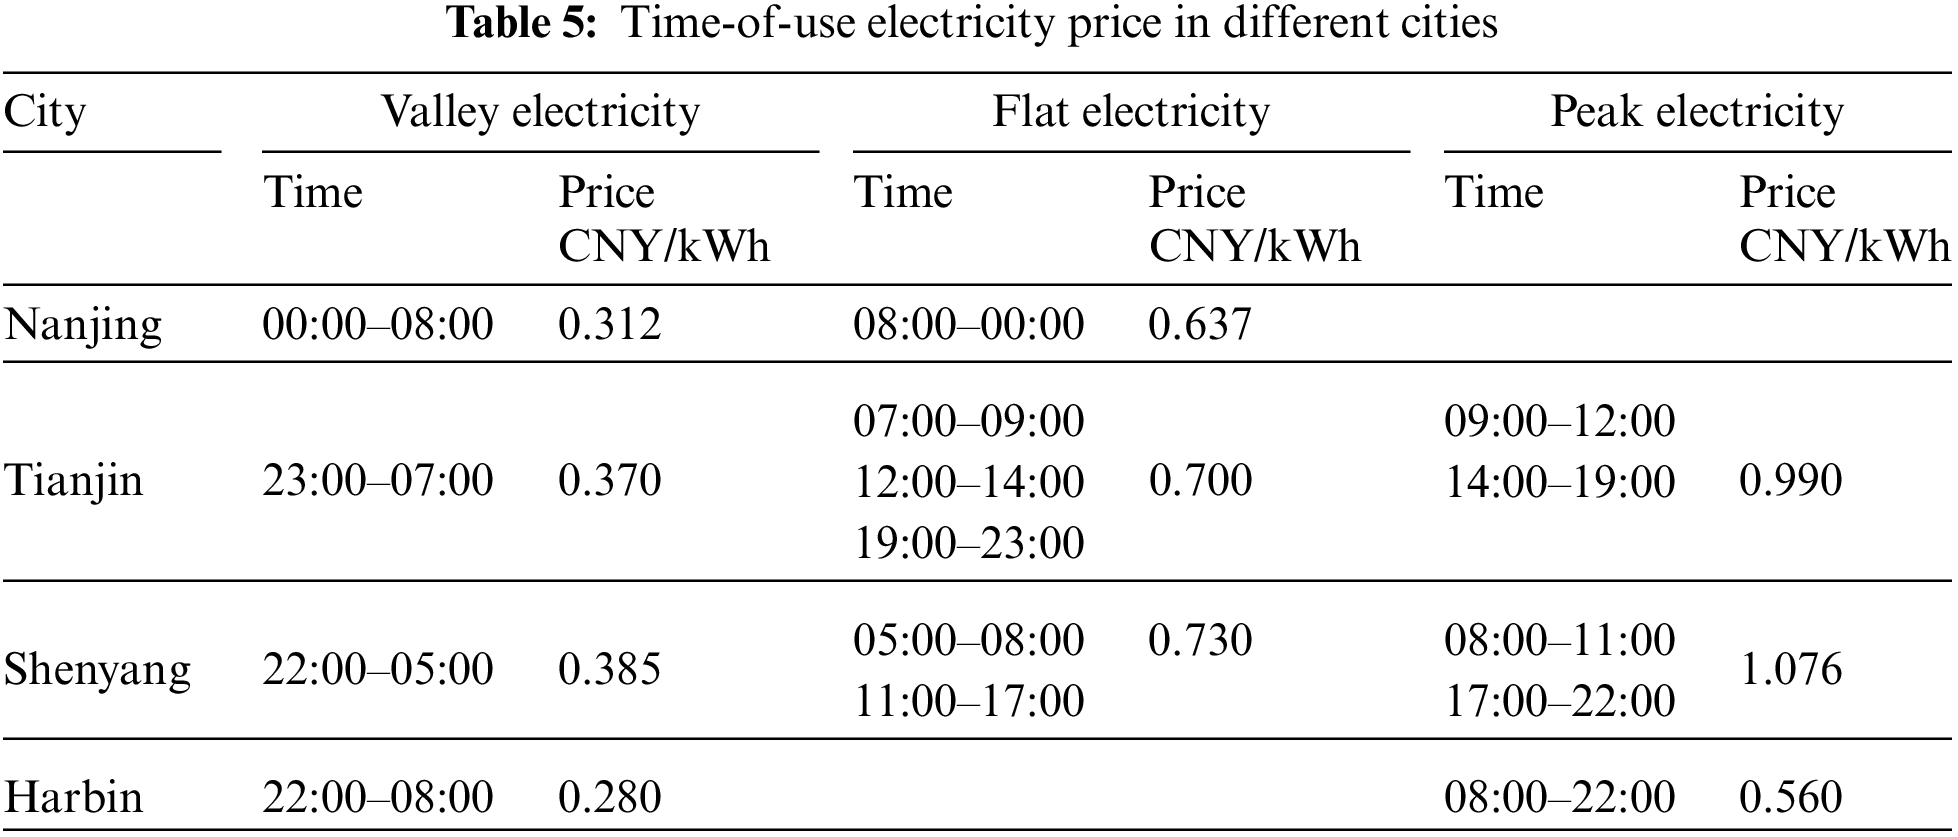
Electric heat storage (EHS) refers to electric heating systems equipped with heat storage devices. The effective cost-saving approach for EHS is to make full use of time-of-use electricity rates to reduce the average power cost [17]. The core uses a thermal energy storage (TES) device to store surplus thermal energy produced during off-peak price periods and release the stored heat during subsequent on-peak price periods. Heat storage methods include sensible heat storage, chemical heat storage and latent heat storage [18]. Sensible heat storage refers to storing energy with its specific heat capacity, such as water [19], thermal oils [20], molten salts [21], etc. However, this method possesses a large thermal energy storage density due to the large operating temperature range, but the main drawback is the instability of temperature during the discharge process [22]. The chemical heat storage method uses reversible reactions, which involve absorption and release of heat under a medium range operating temperature between 200°C and 400°C [23], and there are also some technical challenges for chemical heat storage, for example, the material may undergo sintering during the charging process, leading to obstruction of material rehydration during discharge [24]. The latent heat storage method utilizes latent heat to maintain a constant temperature process during phase change [25]. Meanwhile, latent energy storage has an overall superiority in aspects of volume, energy storage density, operation reliability, structural compactness and cost effectiveness at the present stage [26,27]. Therefore, latent heat storage using phase change materials (PCMs) is better suited for EHS systems. The combination of solar energy collection systems and air-source heat pumps based on electric heat storage technology can solve the intermittent problem of solar energy resources and achieve the purpose of power grid peak clipping and valley filling.
In this paper, a new type of distributed heating system was introduced. The application of EHS system with a solar heat energy system can make up for the intermittent shortage of solar energy. At the same time, the coupling system with an air source heat pump system can form a multi-quality clean heating system, i.e., ECSA system. Based on meteorological conditions, four typical cities in three climate regions in China were selected for analysis. TRNSYS software was used to simulate and analyze the system performance, and the hook-jeeves optimization algorithm and GenOpt software were used to optimize the system parameters, and the optimal selection of the heat system in different climate regions was proposed.
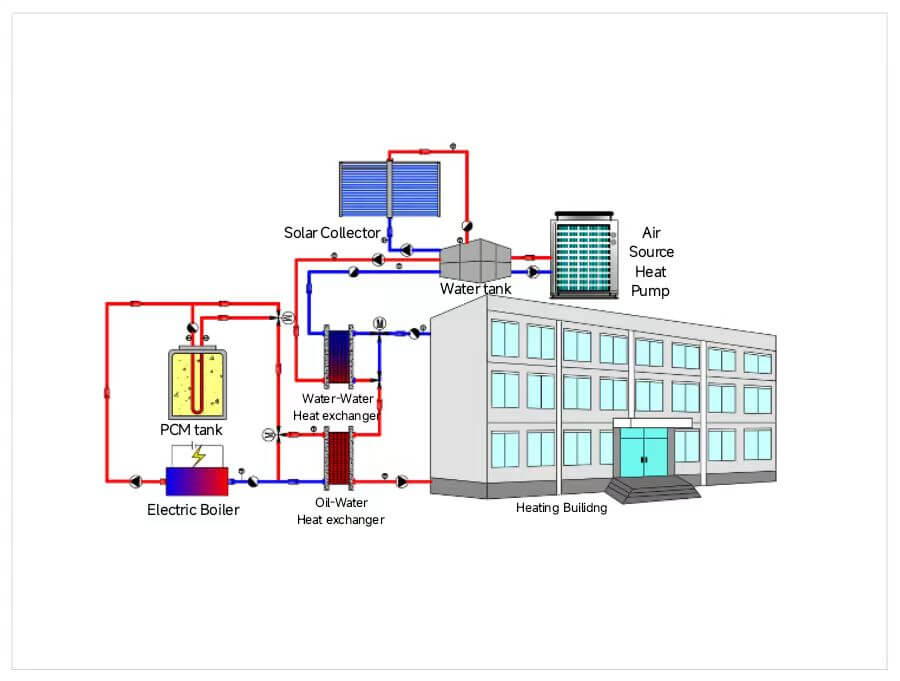
The ECSA system based on phase-change heat storage is shown in Fig. 1. The heating system includes an electric heat storage system, a solar heat collection system, an air source heat pump system, and a secondary pipe network system. The electric heat storage system includes an electric heating boiler and PCM tank. The solar heat collection system adapts to vacuum tube collectors. To reduce the cost of the system, the air source heat pump system shares a water tank with the solar heat collection system. The pipe network system is mainly composed of an oil-water plate heat exchanger and a water-water plate heat exchanger. The oil-water plate heat exchanger is used for heat exchange between the electric heat storage system and the pipe network system, and the water-water plate heat exchanger is used for heat exchange between the water tank and the pipe network. The operation mode is as follows: the system uses the electric heating boiler to heat the PCM tank during the night valley power, while the air source heat pump system heats the building. In the non-valley power period, the solar heat collection system combined with the PCM tank is used to heat the building.
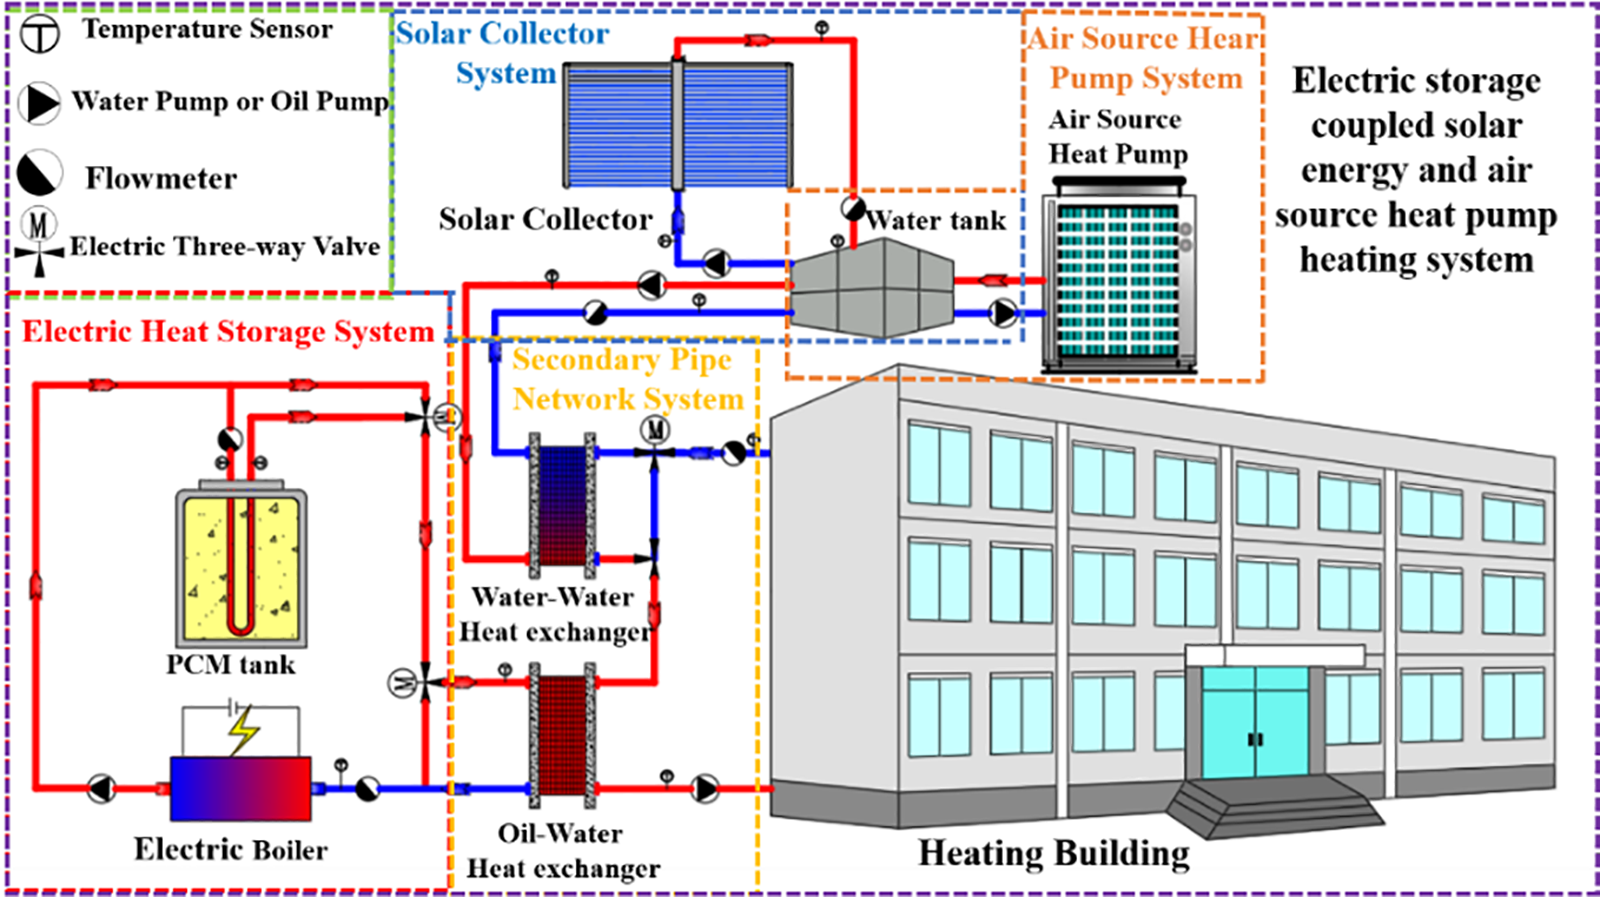
Figure 1: Schematic diagram of ECSA system
The specifications of the building model are shown in Table 1. The heat obtained by solar radiation through windows during the day, and the thermal inertia are considered in the simulation. The three-dimensional view of the model is shown in Fig. 2. Fig. 2a shows the south and west directions, and Fig. 2b shows the north and east directions of the building model. During the workday, the set schedule for personnel, lighting, and office equipment is shown in Fig. 3.
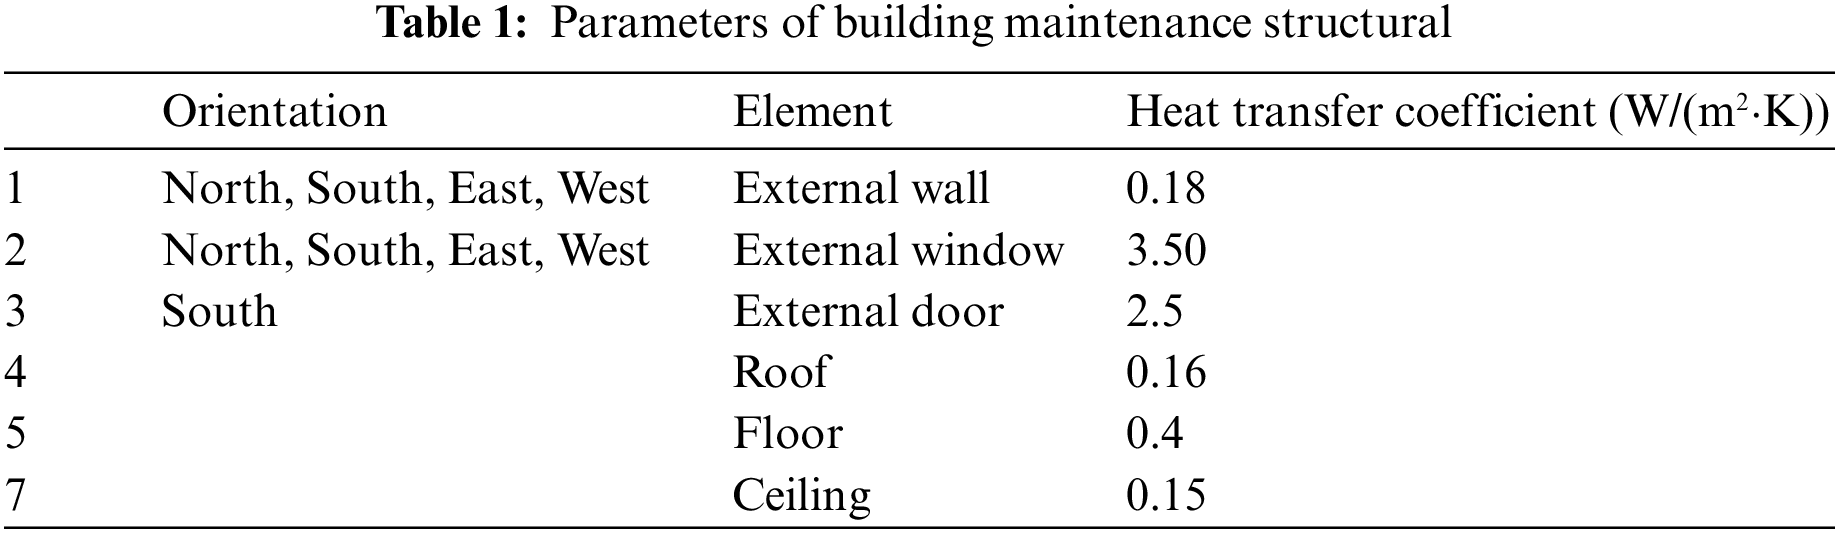
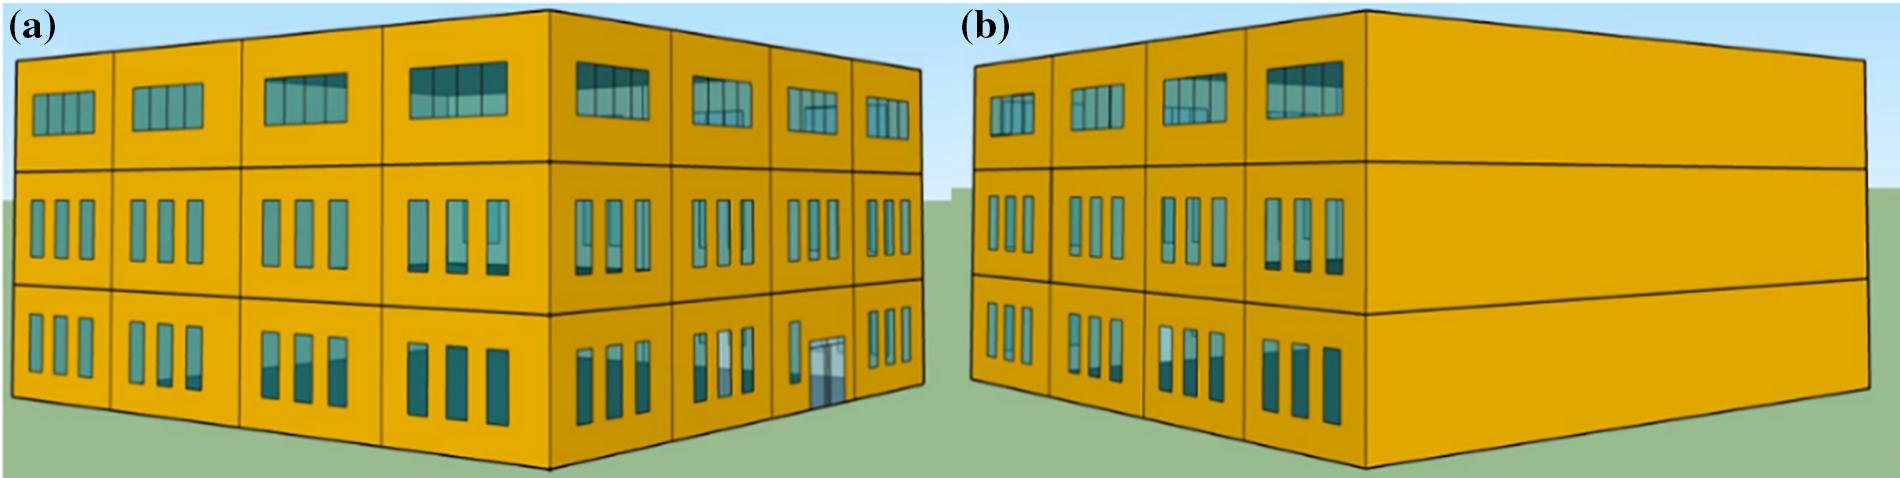
Figure 2: 3D view of the building model: (a) south and west facade; (b) north and east façade
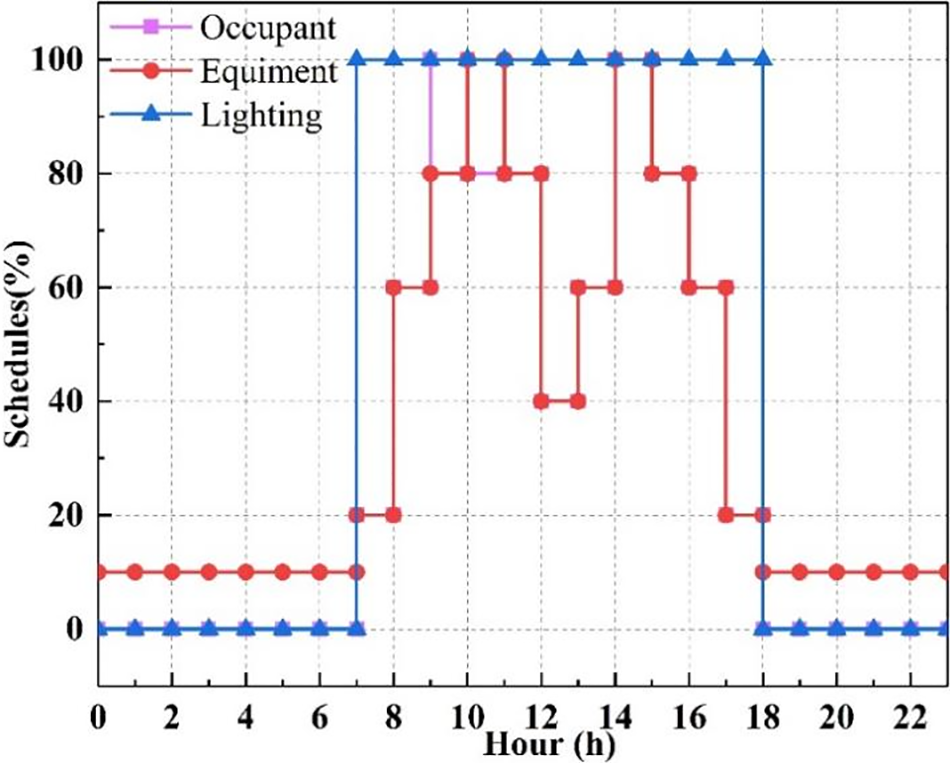
Figure 3: Operating schedules
A new module named Type 211 is compiled based on FORTRAN embedded in TRNSYS. The method is based on the effectiveness-number of transfer units (
The phase change process is assumed to be isothermal;
The flow pattern of the HTF is assumed to be single-pass;
The heat transfer between the PCMs and the HTF for each tube is assumed to be identical;
The potential heat convection within the PCMs is neglected;
The specific heat capacity of the PCMs in liquid and solid phases is the same;
The PCMs have no expansion during the phase change process.
For heat transfer fluid:
where
For PCMs:
where
For the boundary condition:
where
For the initial condition:
where
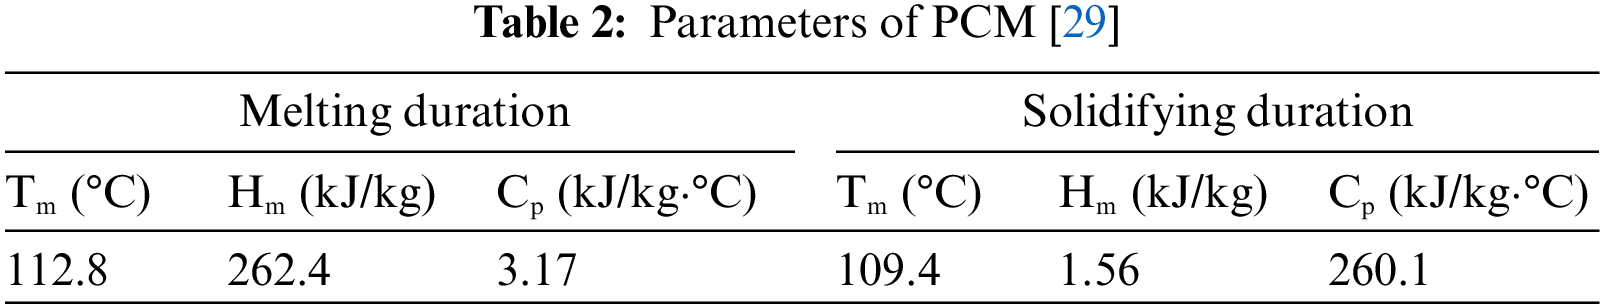
The phase change material properties included phase change temperatures, specific heat capacities, the latent heat of melting and solidifying. The phase change parameters are presented in Table 2.
3.1.3 Meteorological Data for Different Climate Regions
China has five climate regions, they are the severe cold region, the cold region, the hot summer and cold winter region, the hot summer and warm winter region, and the mild region. The regions with heating demand include the severe cold region, the cold region, the hot summer and cold winter region. Buildings in the mild region and the hot summer and warm winter region need not be heated due to the low geographical latitude. Nanjing (hot summer and cold winter region), Tianjin (cold winter region), Shenyang (severe cold region) and Harbin (severe cold region) are selected as the typical cities of their respective climate regions. Ambient temperature and solar radiation intensity are important meteorological parameters for calculating building loads. The annual environmental temperatures of different cities are shown in Fig. 4. For Nanjing, the heating season lasts for 81 days from December 15 to March 5, and the monthly average minimum/maximum ambient temperature is −0.7°C/14.2°C. The heating season in Tianjin lasts from November 15 to March 15, a total of 121 days, and the average monthly minimum/maximum ambient temperature is −5.5°C/12.6°C. The heating season in Shenyang covers 151 days from November 1st to March 31st. The average monthly minimum/maximum ambient temperature is −16.5°C/7°C. The heating season in Harbin lasts from October 20 to April 20, for a total of 183 days, in which the monthly average minimum ambient temperature is −22.9°C/14°C.
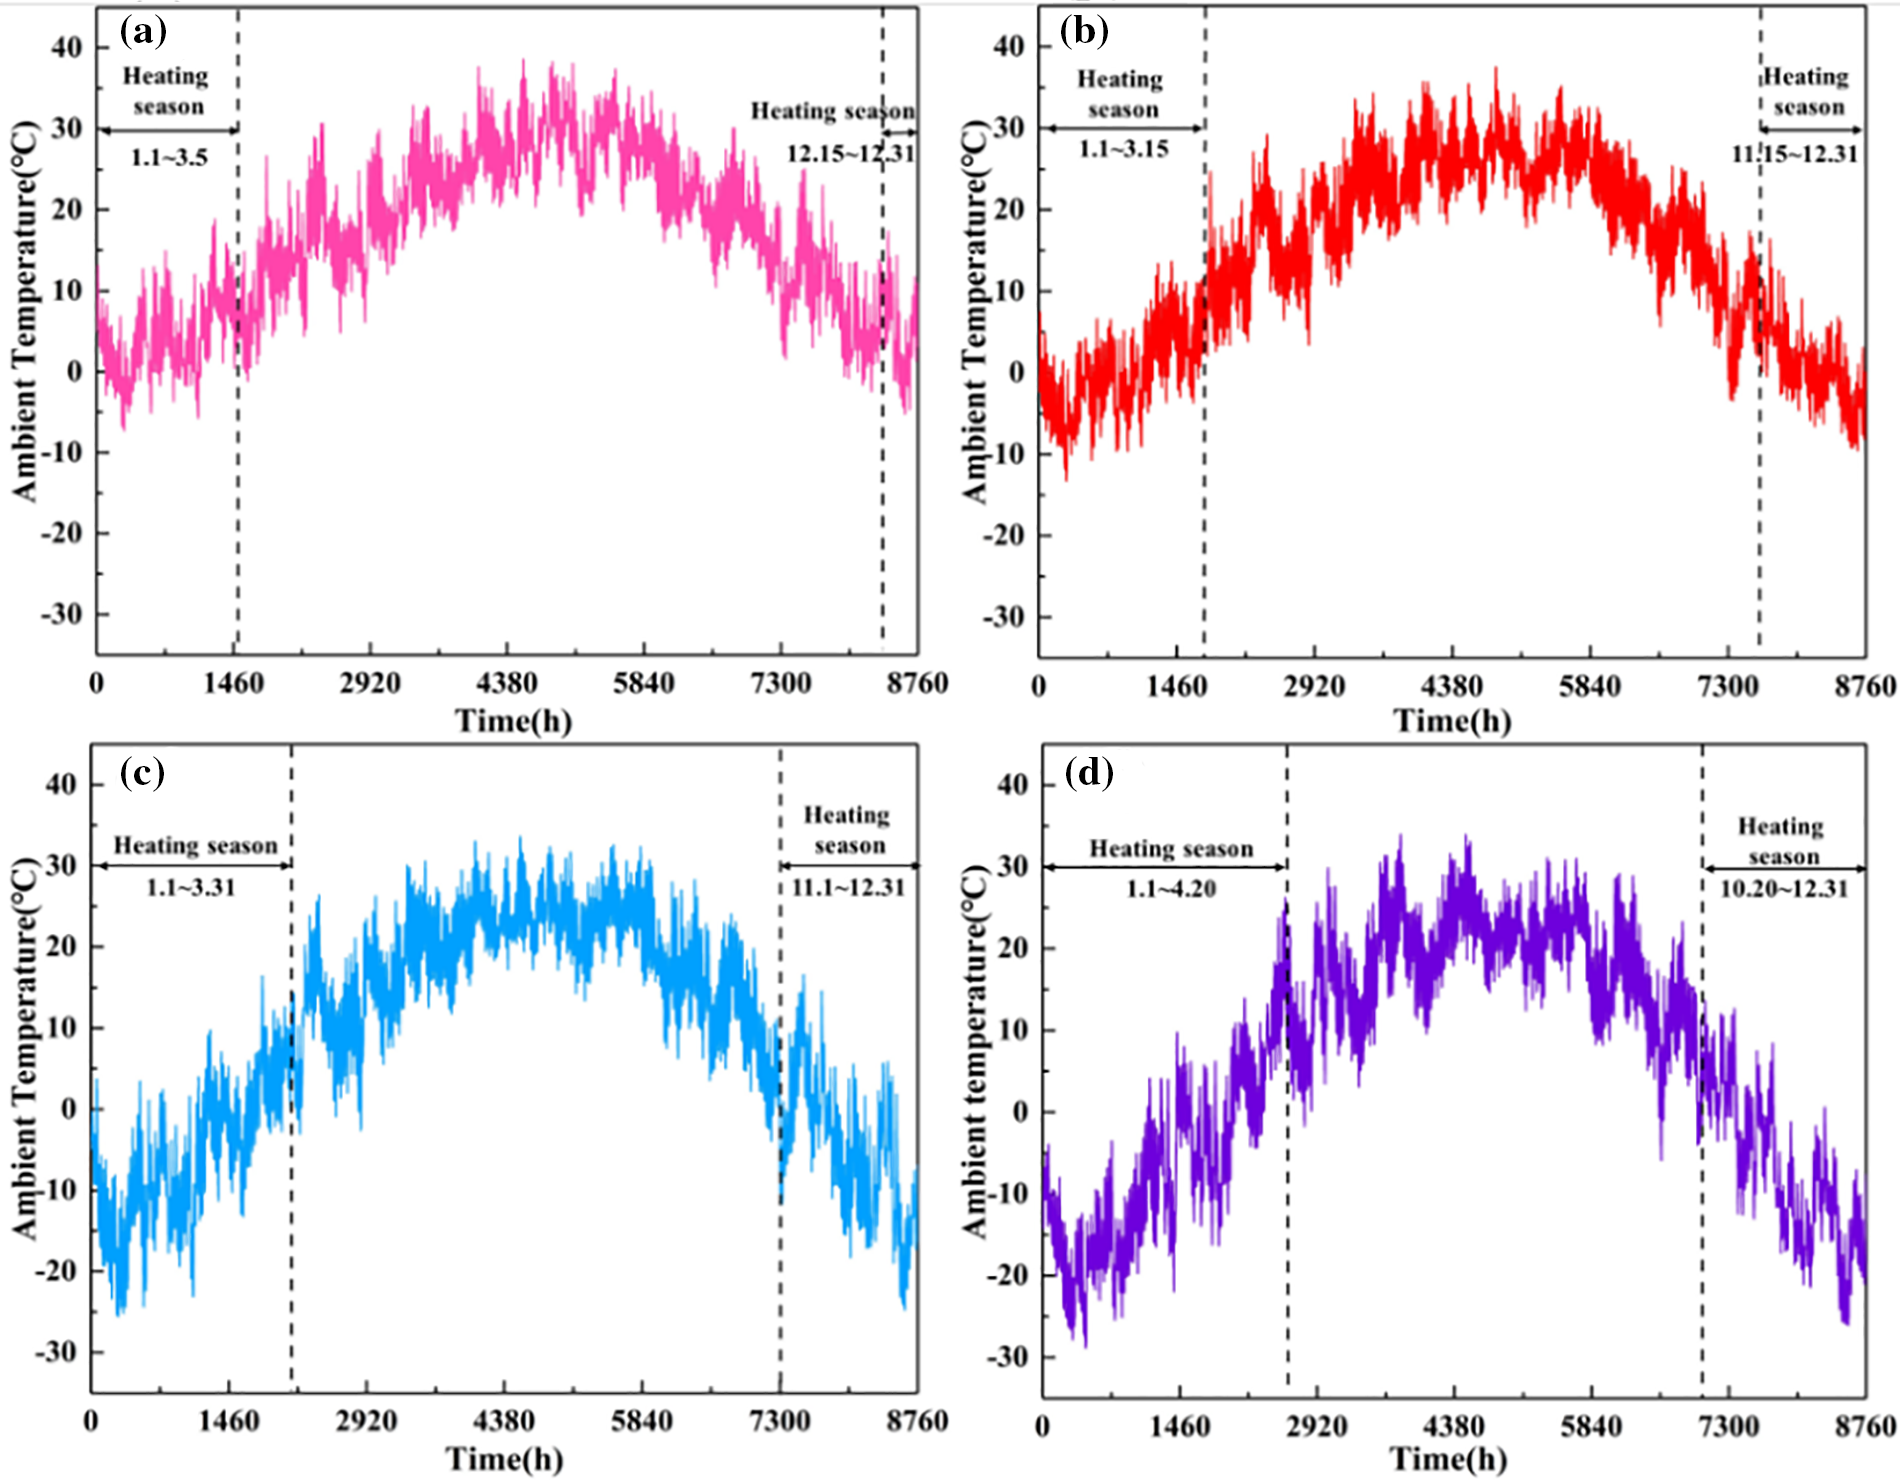
Figure 4: Annual ambient temperatures in different cities: (a) Nanjing; (b) Tianjin; (c) Shenyang; (d) Harbin
3.2 System Operation Control Strategy
The operation of the solar heat collection system depends on the inlet/outlet temperature of the collector and the temperature of the water tank, while the operation of the electric boiler and the air source heat pump depends on the valley electricity time. The control strategy is shown in Fig. 5. When the temperature difference between the inlet and outlet of P1 is greater than 5°C, the water pump P1 starts, and when the temperature difference is less than 3°C, the water pump P1 closes. When the temperature of the water tank is higher than 50°C, the water pump P2 starts; and if the temperature is lower than 45°C, the water pump P2 closes. Meanwhile, the outlet temperature of the air source heat pump is set to 50°C. In order to meet the melting temperature requirement of PCM, the oil output temperature of the electric heating boiler is 160°C. Electric three-way valve EV1 controls the heating mode of the system according to the start and stop of water pump P2.
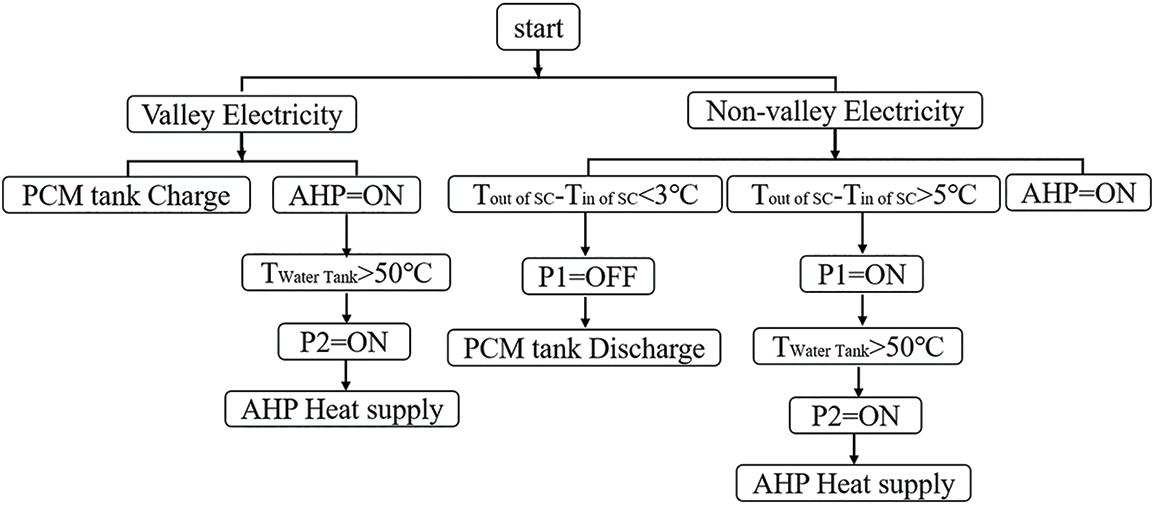
Figure 5: The diagram depicting the system control strategy
3.3 Multi-Objective Optimization Method
3.3.1 Multi-Objective Optimization Strategy
Due to the interaction between variables, it is difficult to obtain the best input variable values for good optimization of the system, fortunately, the GenOpt optimization strategy can set the optimization variable to solve the complexity of variables, and Fig. 6 shows the GenOpt optimization flow chart. TrnOpt is a part of the TESS component library in TRNSYS, and can be used for connecting TRNSYS to GenOpt.
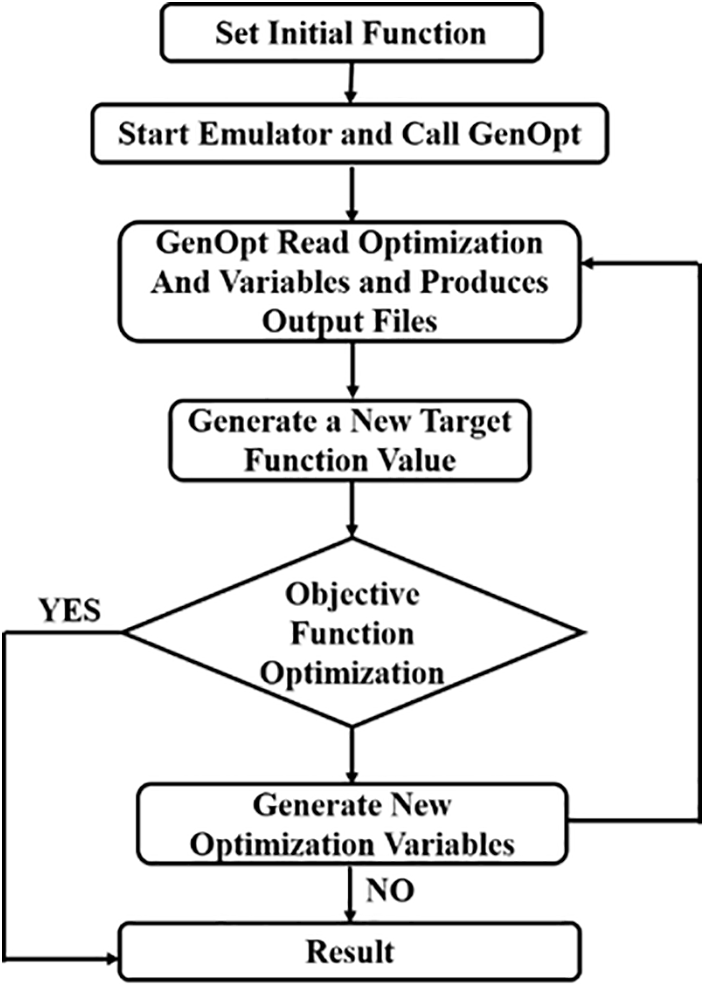
Figure 6: GenOpt optimization flowchart
The optimization algorithm has an important impact on results. In this study, the Hooke-Jeeves optimization algorithm was selected, which was also known as the “step acceleration method” or “pattern search method”. The search principle of the algorithm can be imagined as finding the minimum value of a quadratic function to find the lowest point of the surface.
Hooke-Jeeves consists of two actions: probe movement and pattern search. Each iteration of the optimization method alternates axial and modal movements. Among these, the purpose of axial movement is to detect the favorable direction of descent, and that of mode movement is to accelerate the search along a favorable direction [30].
3.3.2 Multi Objective Function
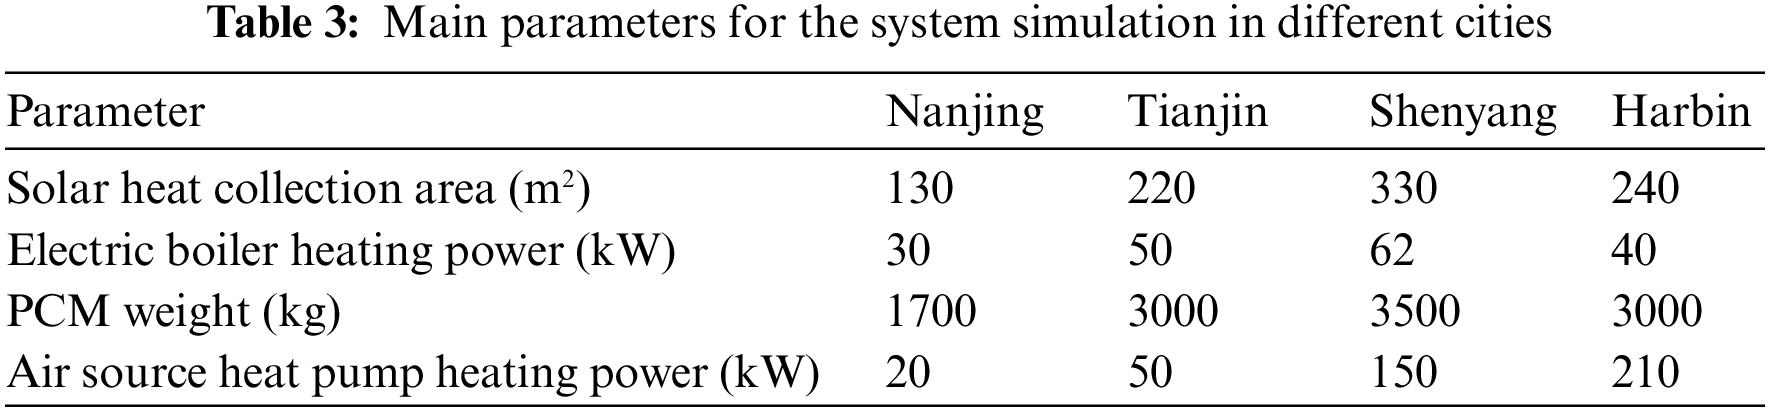
The optimization scheme adopts an annual cost method to optimize system, including the heat production of air source heat pump, the heating power of the electric boiler and the consumption of phase change material. The main design parameters of the system are shown in Table 3.
For the calculation formula of solar heat collection area:
where,
For the calculation formula of PCM weight:
where,
For the calculation formula of electric boiler heating power:
where,
For the calculation formula of air heat pump heating power:
where,
In order to prevent the indoor temperature below 20°C, the penalty rules are set, i.e., if the indoor temperature is below 20°C after the system starts 1 h, the penalty will start, and the penalty is 5000 yuan per hour, which will be added to the cost of the annual value function of the operating cost. Because of the severity of the penalty, the optimization program will give up choosing equipment whose indoor temperature is lower than 20°C.
The formula for calculating annual cost value is as follows:
where,
3.4.1 Economic Analysis Method
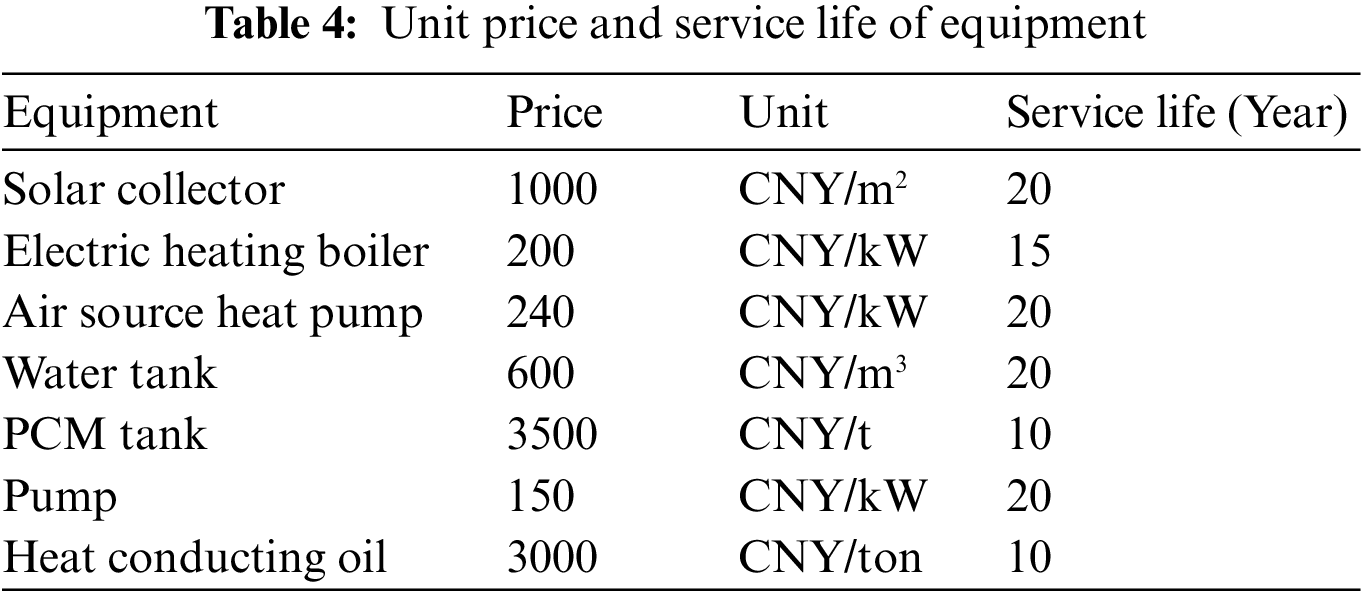
LCOH is an index to evaluate the economic performance of ECSA system. In the whole life cycle, the cost of generating 1 kWh of heat can be expressed by Eq. (10) [31]:
where,
According to the provisions of the National Bureau of Statistics of China, the value of
where, the heat supply
where,
3.4.2 Environmental Analysis Method
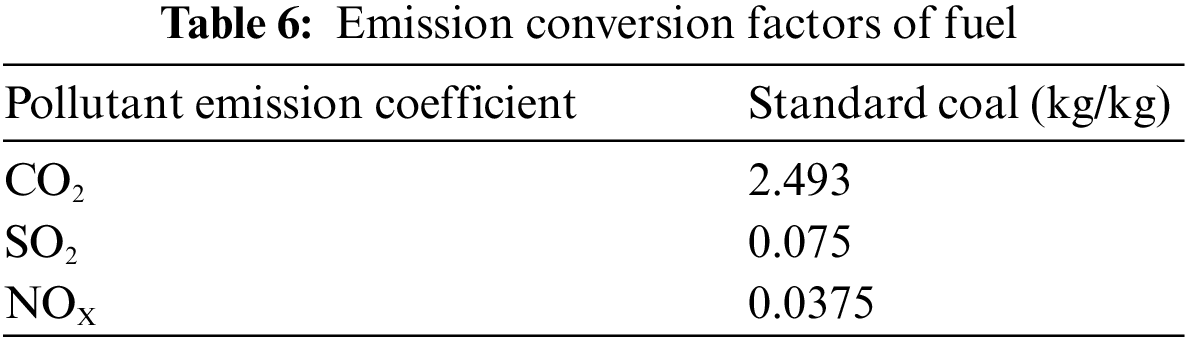
In this study, the environmental analysis focuses on the emissions of carbon dioxide (CO2), sulfur dioxide (SO2) and nitrogen oxides (NOX). CO2 is the main factor causing global warming, while SO2 and NOX are easily induced by haze and acid rain. The calculation and definition of pollutant gases produced by the heating system is as follows [32]:
where,
The primary energy consumption of the system is defined as follows:
where,
Fig. 7 shows the daily heat load of buildings in each city during the heating period. The x-axis represents the number of days in the heating period. Compared to the other three regional cities, the variation in daily heat load in Nanjing had little fluctuation. The maximum heat load was 885.9 kWh and the minimum value was 188.4 kWh. The standard deviation (SD) was 152.6 kWh. The variability of daily heat load in Harbin fluctuated greatly. The maximum and minimum heat loads were 1649.5, and 123.7 kWh, the SD was 369.9 kWh. The other two cities were relatively stable, i.e., the SD was small.
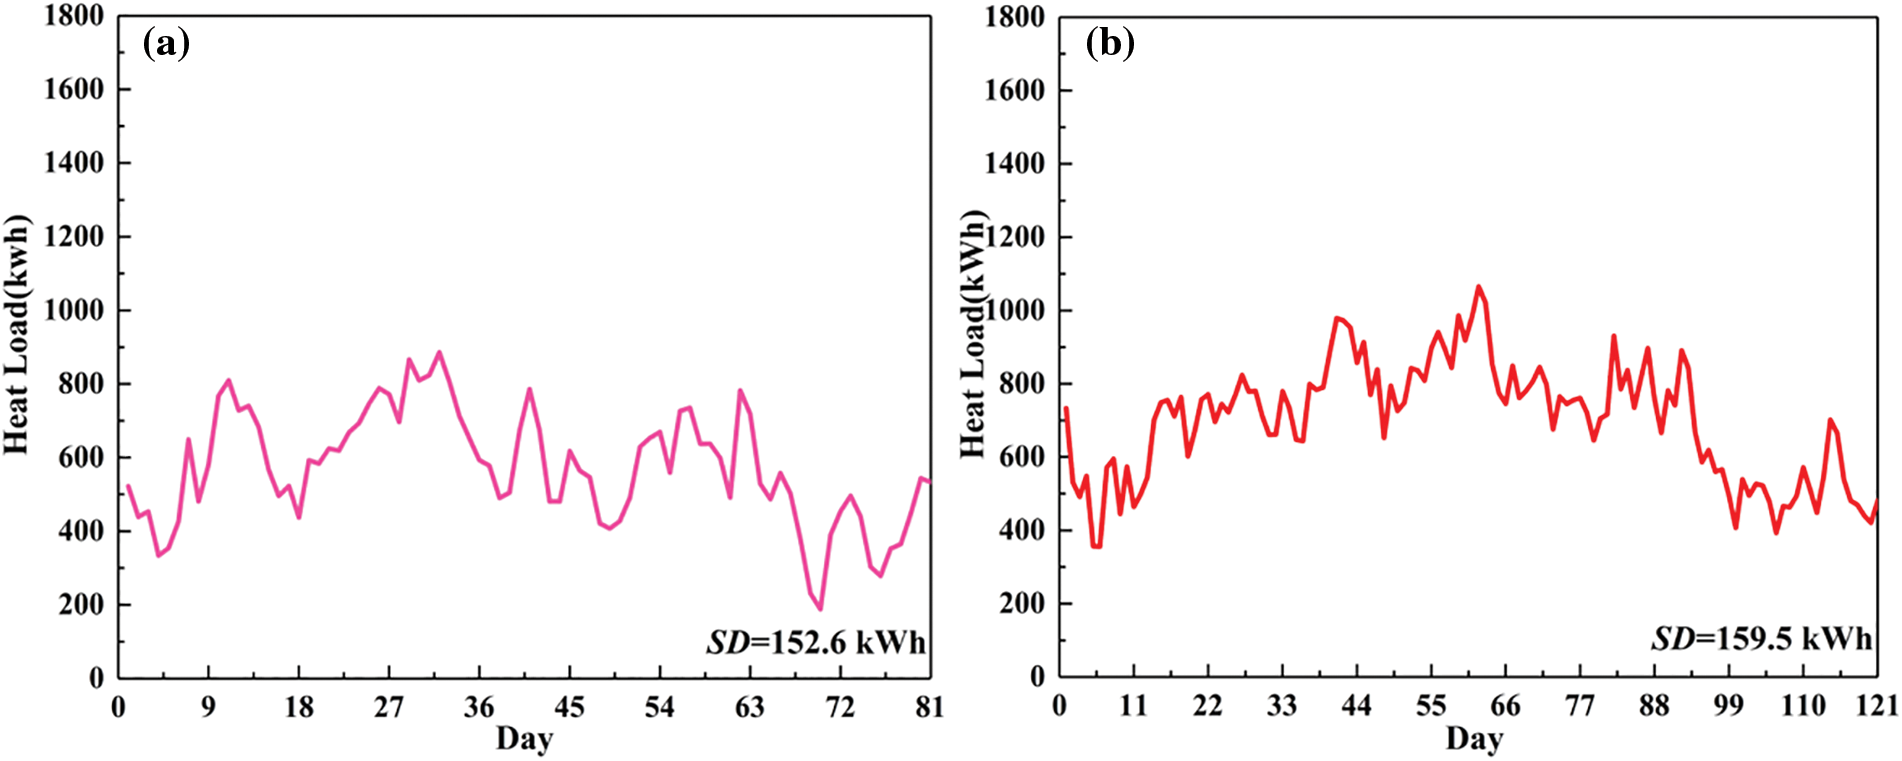
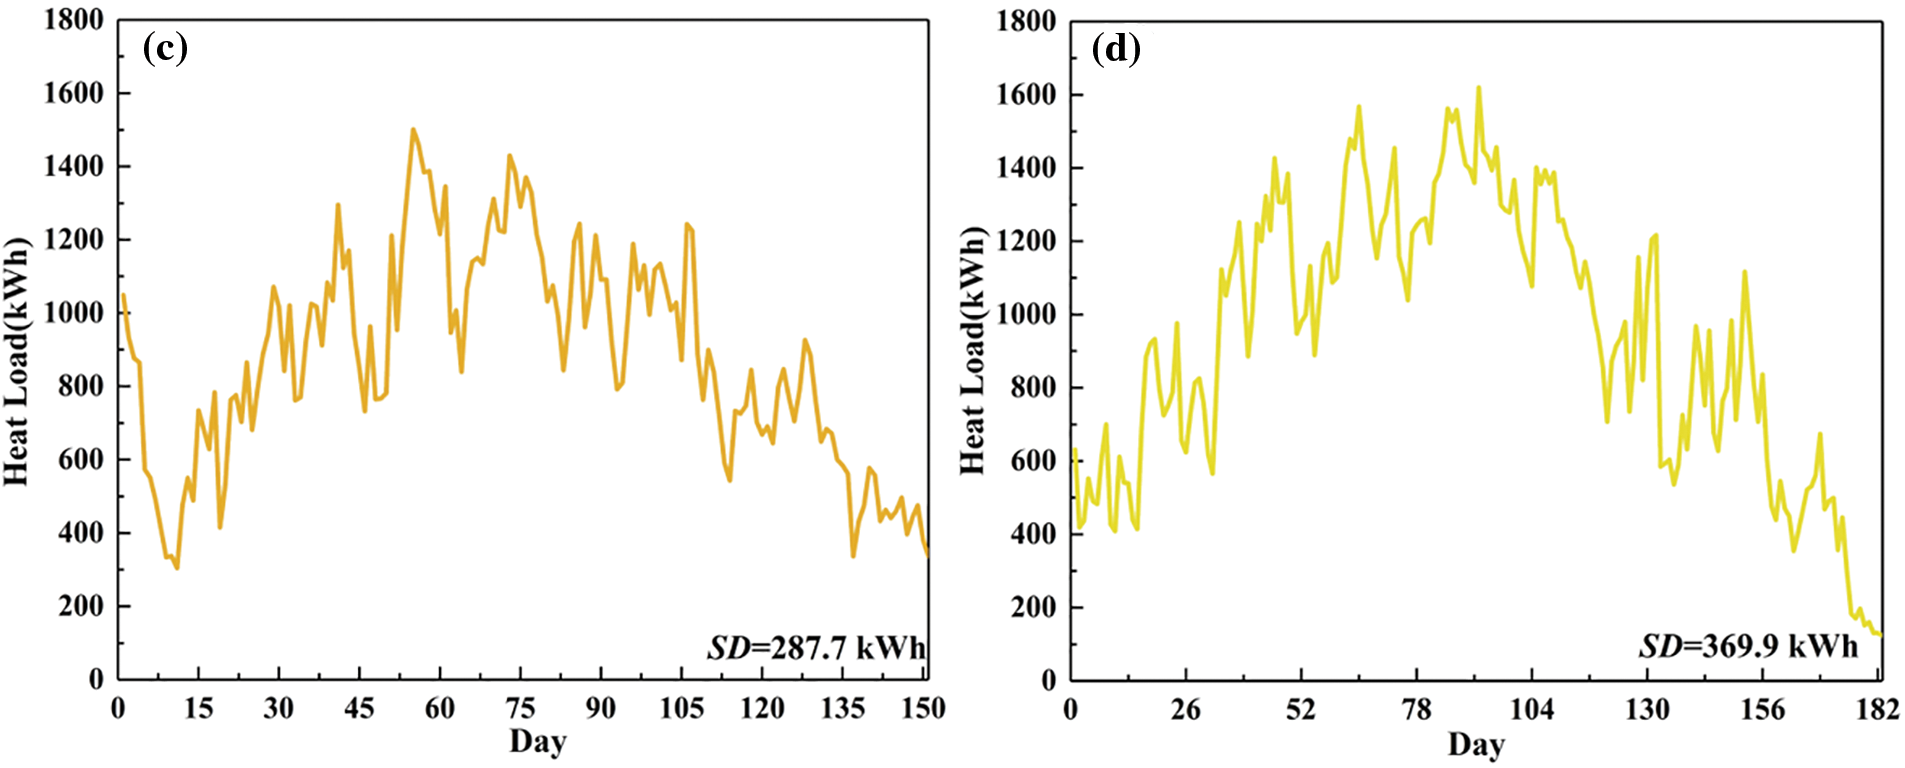
Figure 7: Daily heat load in different cities: (a) Nanjing; (b) Tianjin; (c) Shenyang; (d) Harbin
4.2 Results of Economic Analysis
The system parameters after adopting the multi-objective optimization strategy are shown in Table 7. Fig. 8 shows the LOCH values of different heating systems in different cities.
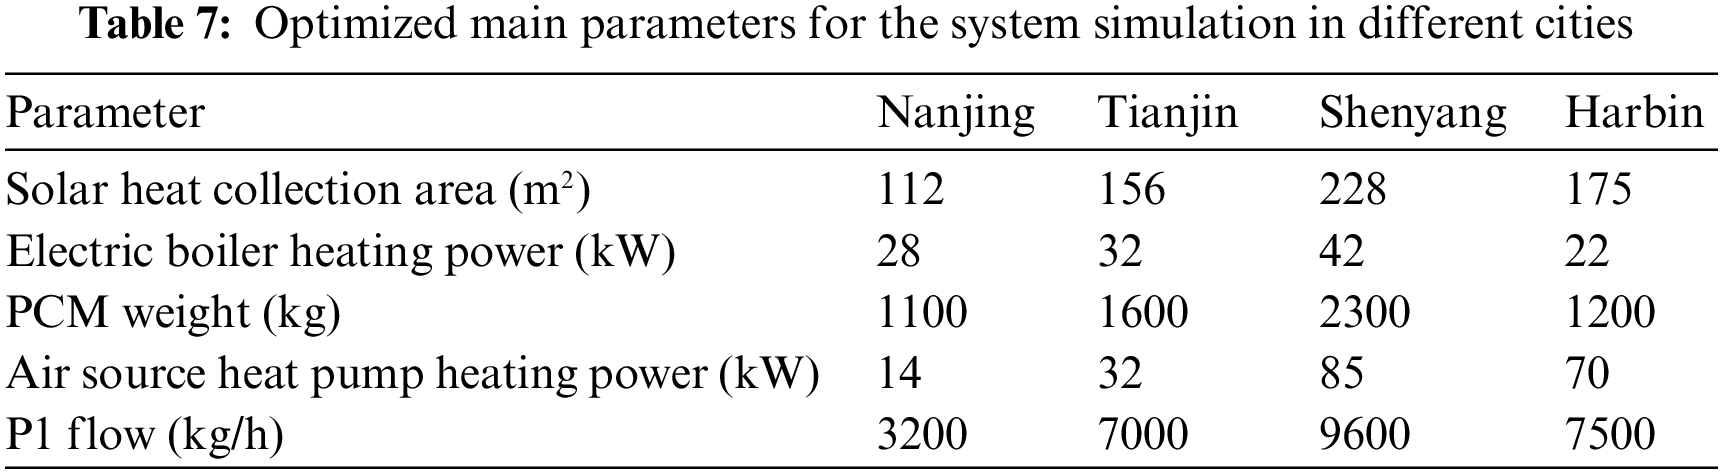
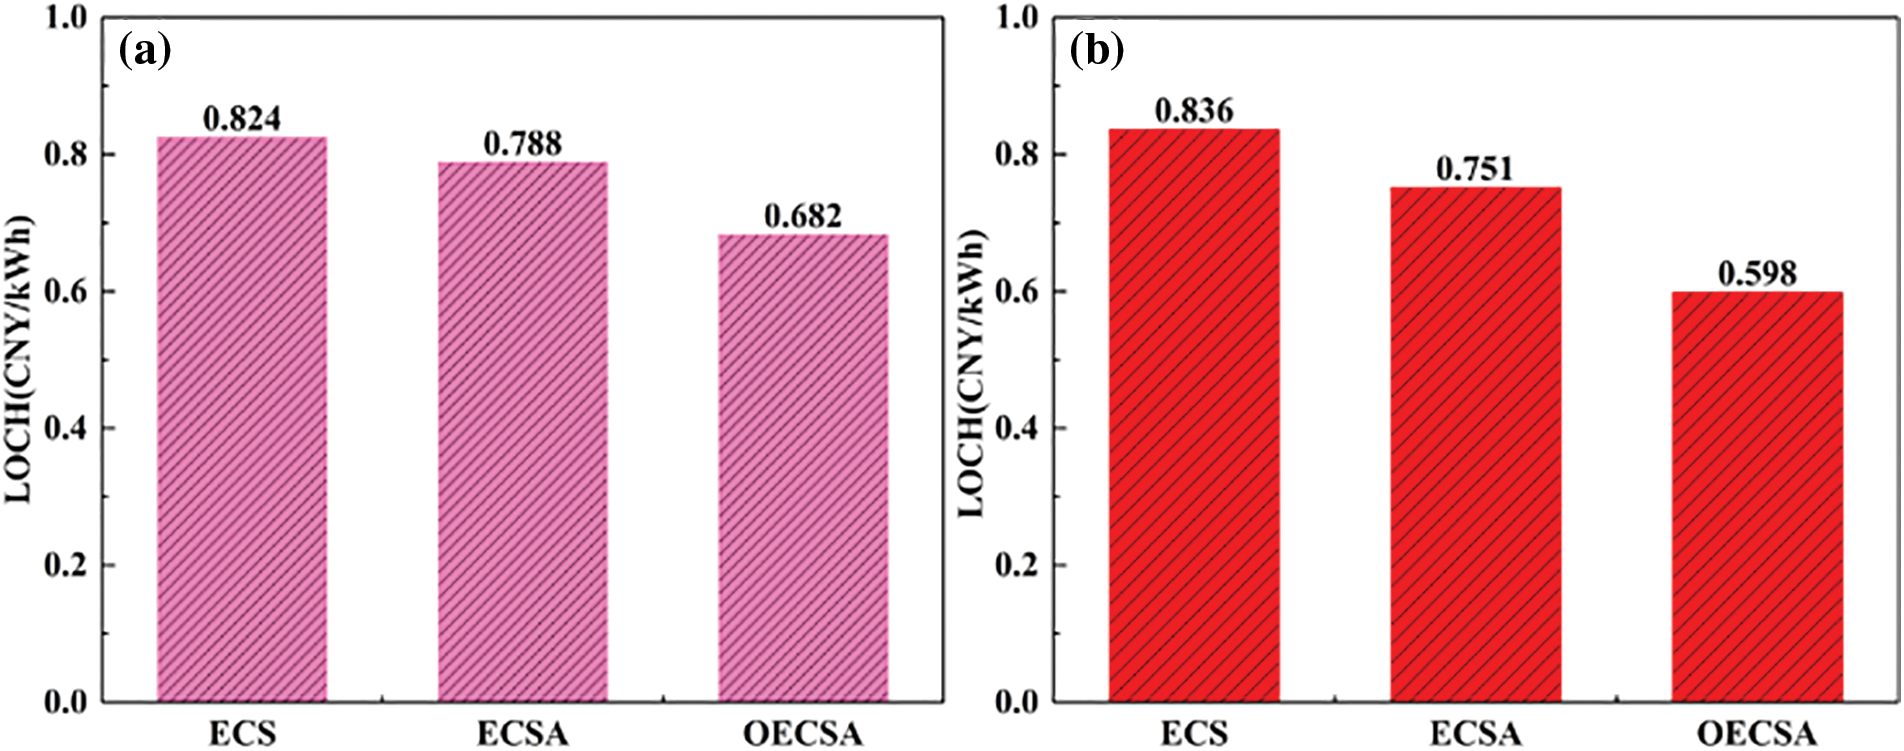
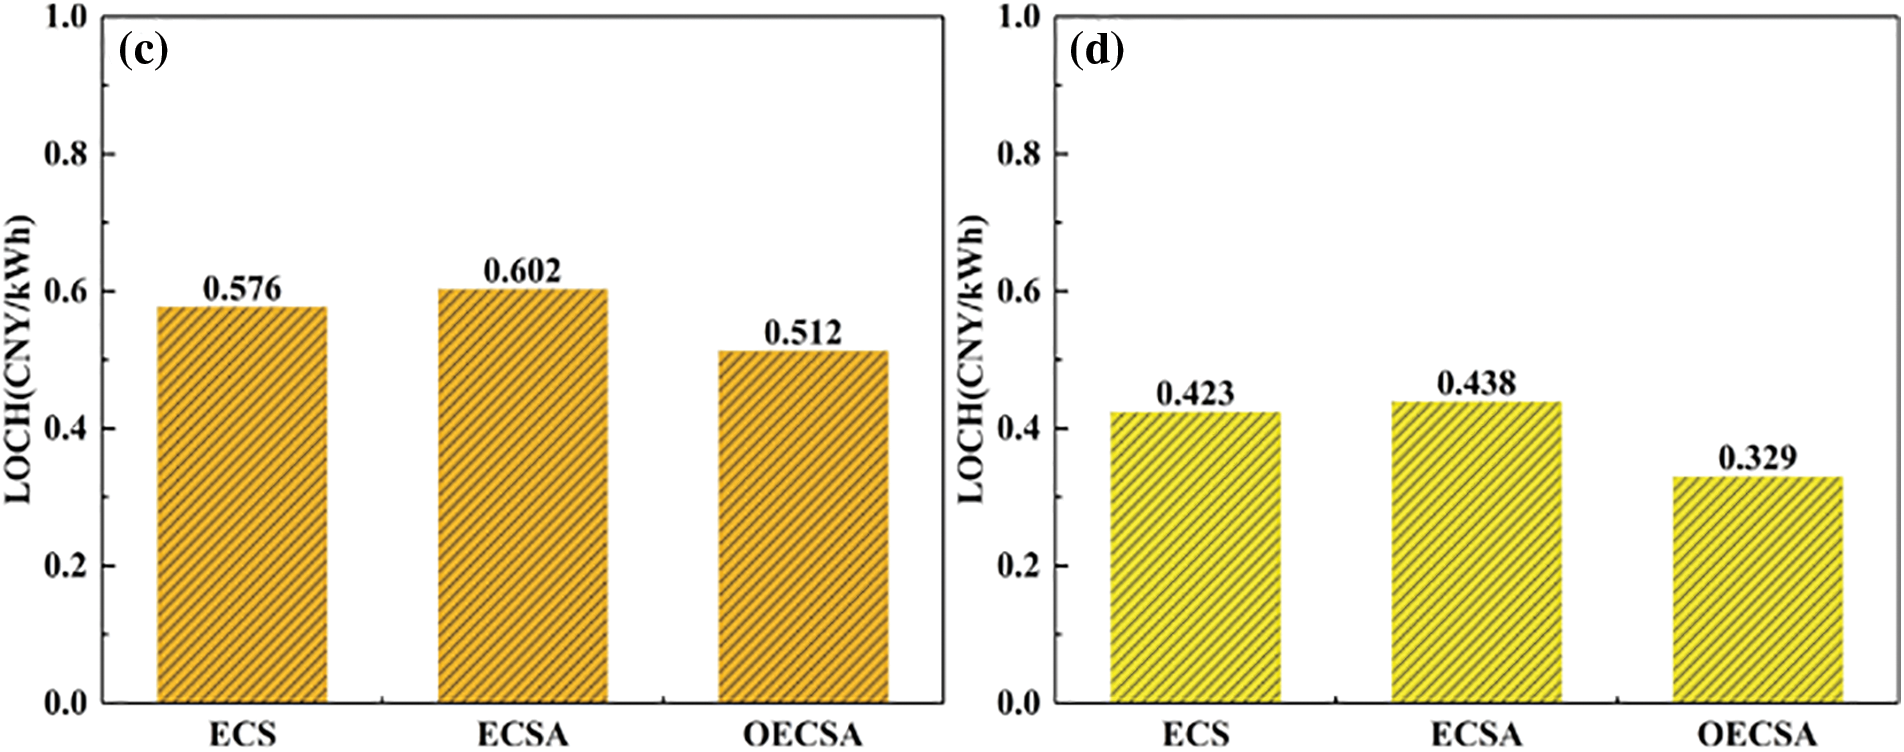
Figure 8: LOCH in different cities: (a) Nanjing; (b) Tianjin; (c) Shenyang; (d) Harbin
During the heating period, the LOCH values of ECS system in descending order were Harbin, Shenyang, Nanjing, and Tianjin. It can be concluded that the economy of ECS system was relatively good in the cold region, and the LOCH value of Harbin was lower than that of Shenyang. This was because the parameters of the solar heat collection system and the amount of phase change material were determined by the heating quantity required during the non-valley electricity period of the building, and the longer the valley electricity period was, the less amount of PCM was.
For ECSA system, the air source heat pump system improved the LOCH value in the cold region, but in the hot summer and cold winter region of Nanjing and the cold winter region of Tianjin, the LOCH value decreased. Because the ambient temperature in the severe cold region was low, and the power design of the air source heat pump system was relatively high, the initial investment of the system was high. At the same time, in the cold region, the COP of air source heat pump system was low, resulting in increased operation cost. From an economic point of view, ECS system was more suitable for the cold region. Under the condition that the indoor temperature is not lower than 20°C, the optimized OECSA system has a significantly low LOCH value in different cities, as it can reduce heating waste while reducing the construction and operating costs of the system.
4.3 Result of Energy Consumption Analysis
Fig. 9 shows the energy consumption per unit area of different heating systems in different cities. The descending order was Nanjing, Tianjin, Shenyang, and Harbin. The reason is that for the same heating area, energy consumption in the cold region was relatively high. Nanjing in the hot summer and cold winter region had the lowest system energy consumption, and followed by Tianjin in the cold region. The energy consumption of Shenyang in the severe cold region was lower than that of Harbin, Shenyang had the shortest power supply time, the largest solar collector area, and the largest proportion of clean energy in heating.
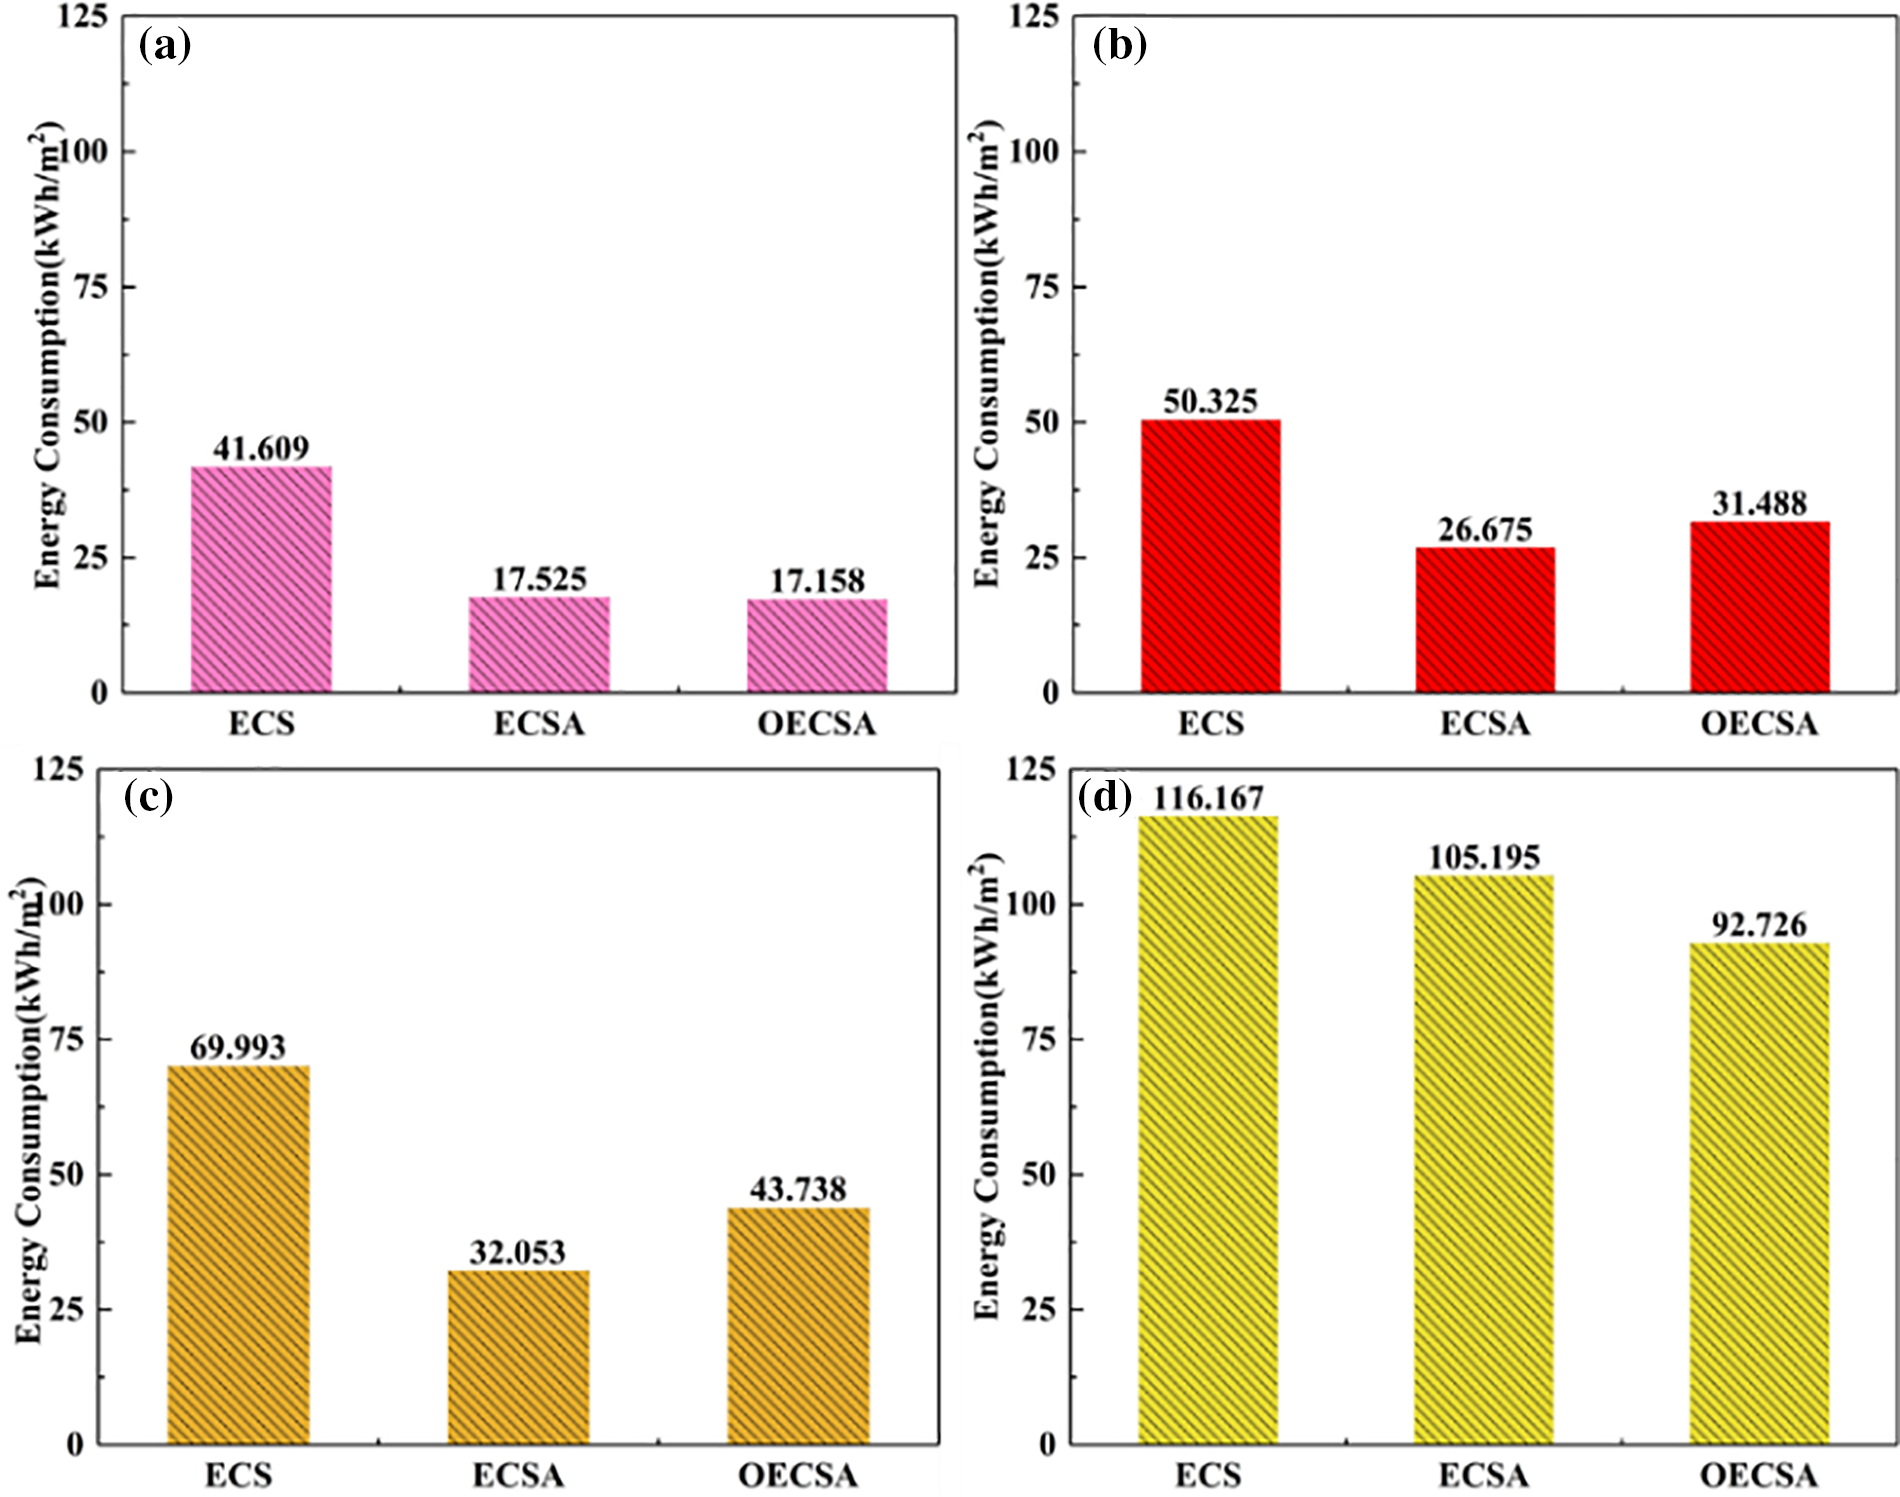
Figure 9: Energy consumption in different cities: (a) Nanjing; (b) Tianjin; (c) Shenyang; (d) Harbin
For ECSA system, the energy consumption of each city reduced. Nanjing had the best effect, which reduced the system energy consumption by 57.88%, while Harbin had the worst effect, which reduced energy consumption by 9.44%, while the energy consumption of Shenyang was reduced by 54.21%. This was because the COP of air source heat pump decreased with the decrease in the ambient temperature. The mean temperature difference between day and night in Harbin was 36.9°C, and the mean minimum value was −22.9°C. While the mean temperature difference between day and night in Shenyang was 23.5°C, the mean minimum value was −16.5°C. The low temperature environment in Harbin resulted in an average COP of air source heat pump system of 0.51, while the average COP in Shenyang was 2.3. Therefore, ECSA system cannot reduce the energy consumption in the severe cold region north.
The average COP in Nanjing and Tianjin was 3.0 and 2.7, respectively. From the perspective of energy consumption, ECAS system was more suitable for the hot summer and cold winter region and the cold region. In order to reduce the heating cost of the system and the initial investment of the system, the solar heat collection area, electric boiler heating power, PCM weight and air source heat pump heating power were reduced. The solar collector area of Shenyang and Tianjin decreased the most, which led to an increase in energy consumption of the electric heat storage system.
4.4 Result of Environment Analysis
Figs. 10–12 show CO2, SO2 and NOX emissions per unit area of different heating systems in different cities, respectively. For ECS system, the emissions of different pollutants from small to large were as follows: Nanjing, Tianjin, Shenyang, Harbin. For the OECSA system with an air source heat pump system, different pollutant gas emissions from small to large were in order: Nanjing, Shenyang, Tianjin, Harbin. It is worth noting that the emissions of different pollutants in Harbin reduced the least, only by 5.86%. This was because the low night temperatures in Harbin were not conducive to the operation of air source heat pump system, resulting in low COP and high energy consumption. From an environmental perspective, the ECSA system was more suitable for Nanjing, Shenyang, and Tianjin. For the optimized OECSA system for different cities, the emissions of different pollutants increased for Shenyang and Tianjin, while decreased for Harbin and Nanjing.
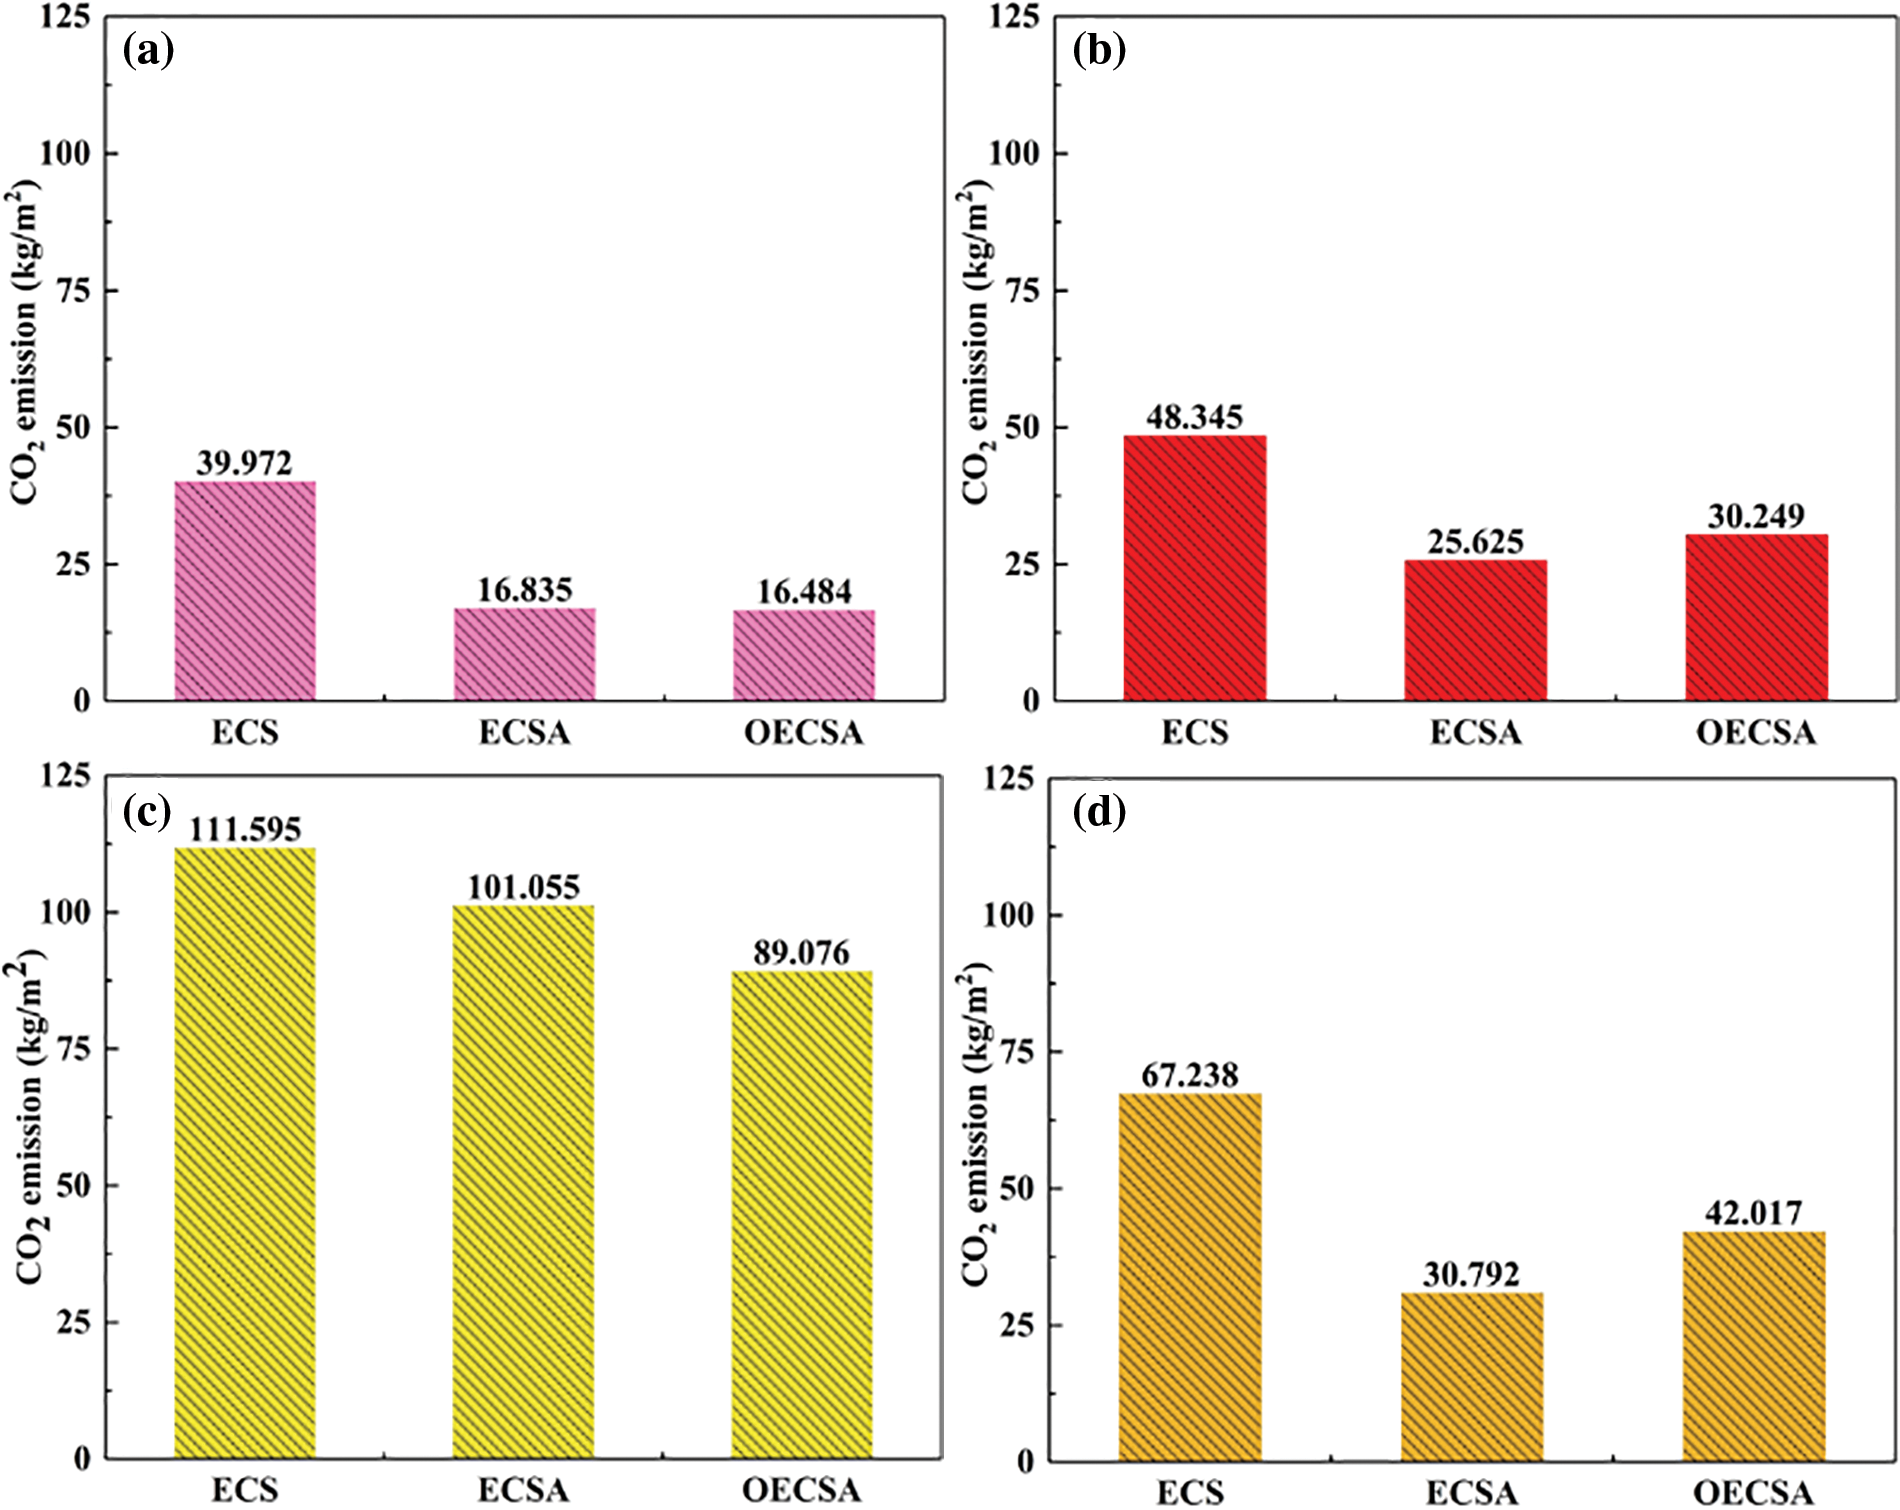
Figure 10: CO2 emission in different cities: (a) Nanjing; (b) Tianjin; (c) Shenyang; (d) Harbin
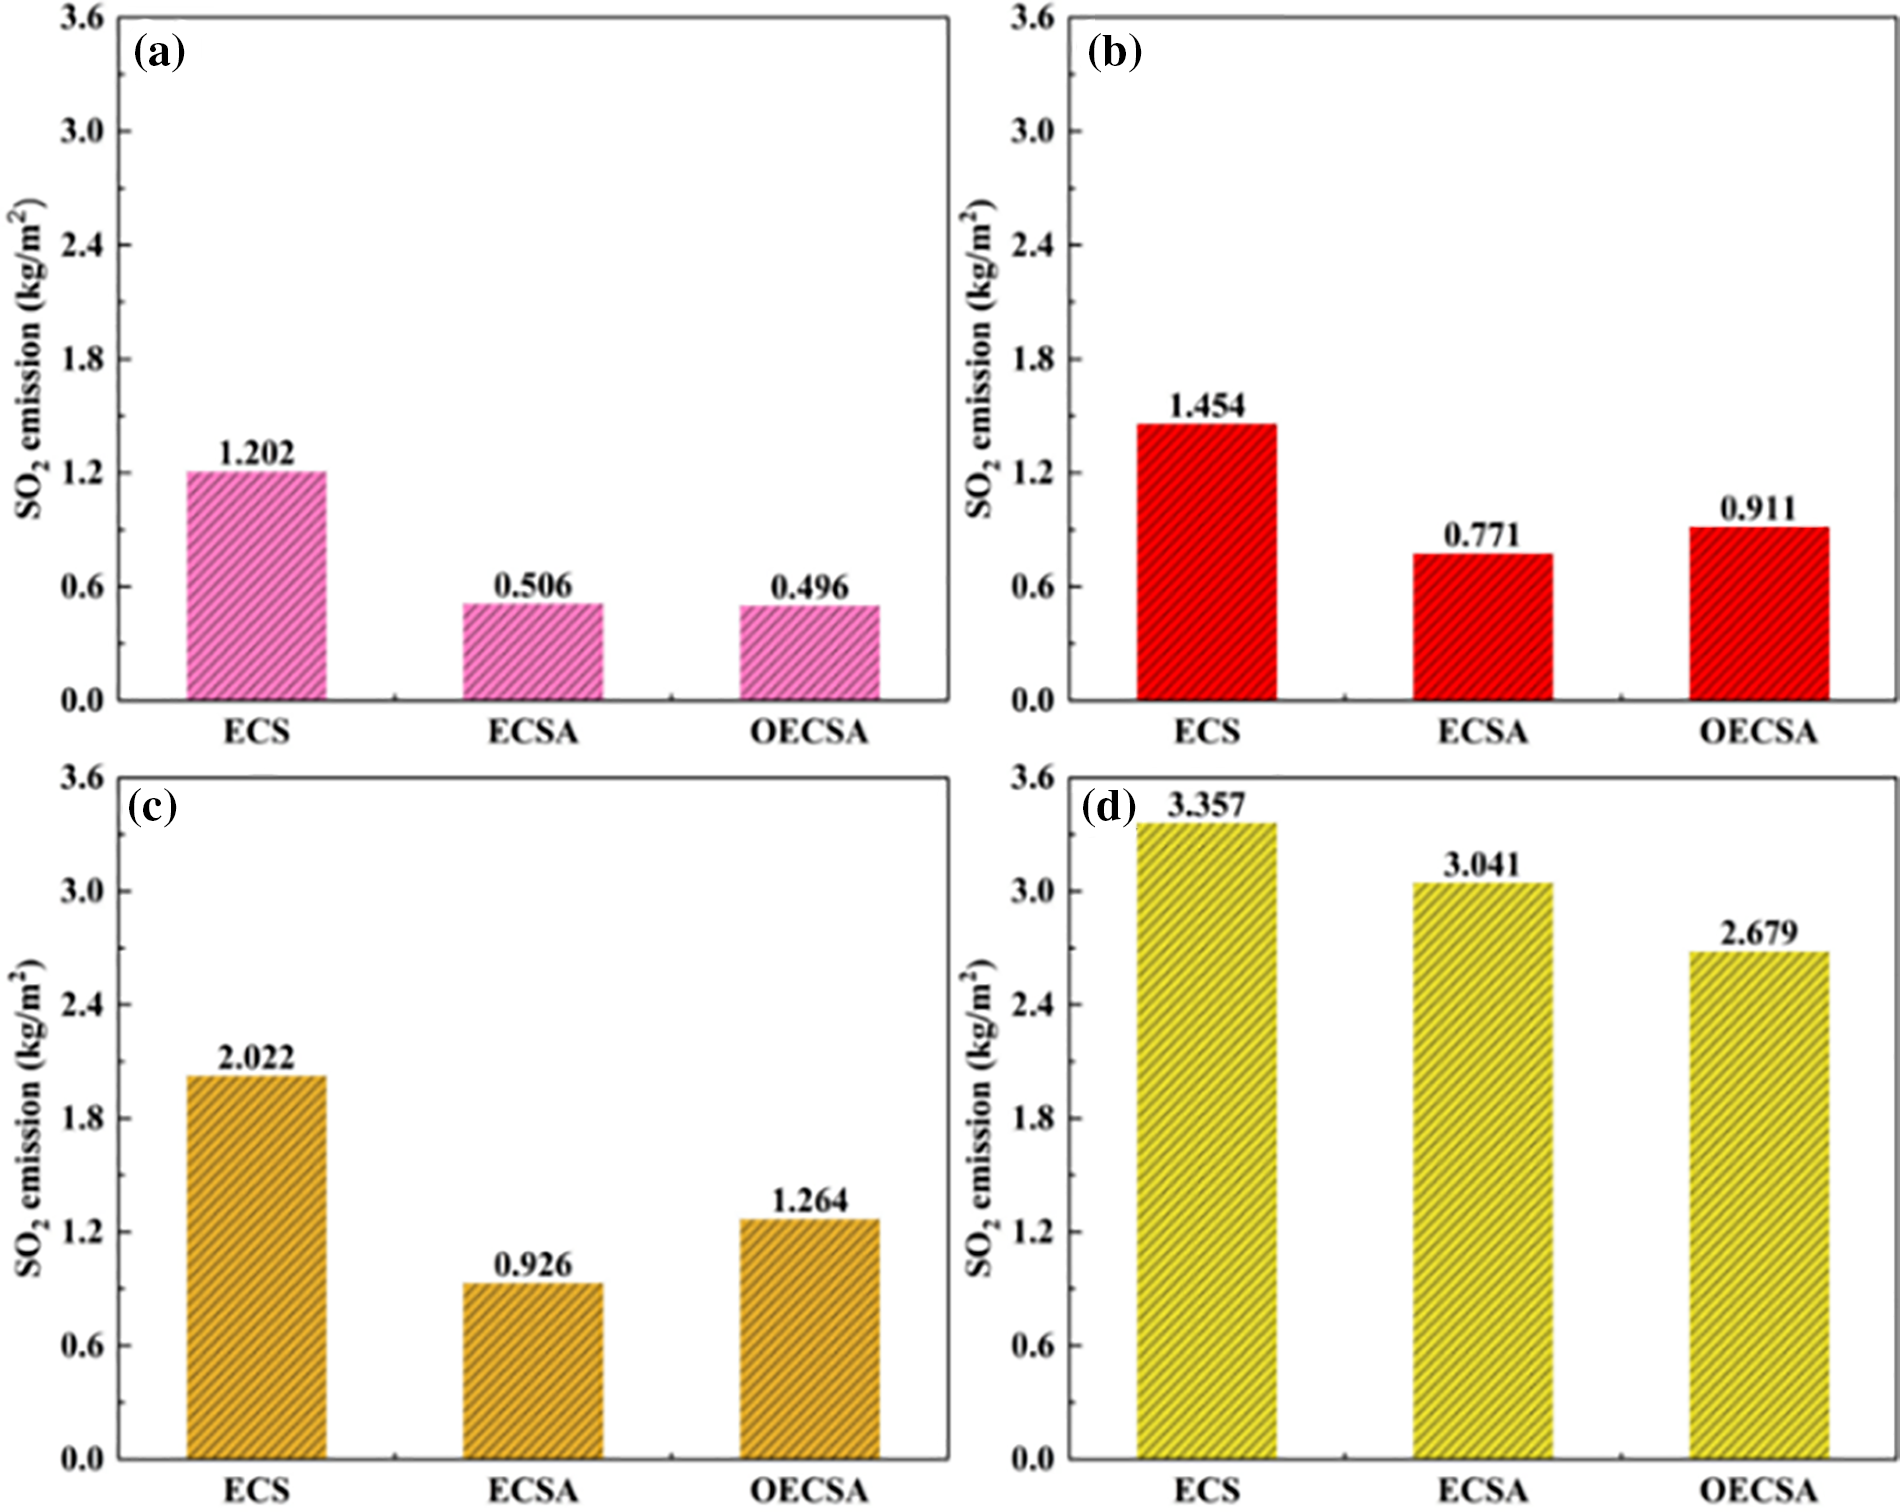
Figure 11: SO2 emission in different cities: (a) Nanjing; (b) Tianjin; (c) Shenyang; (d) Harbin
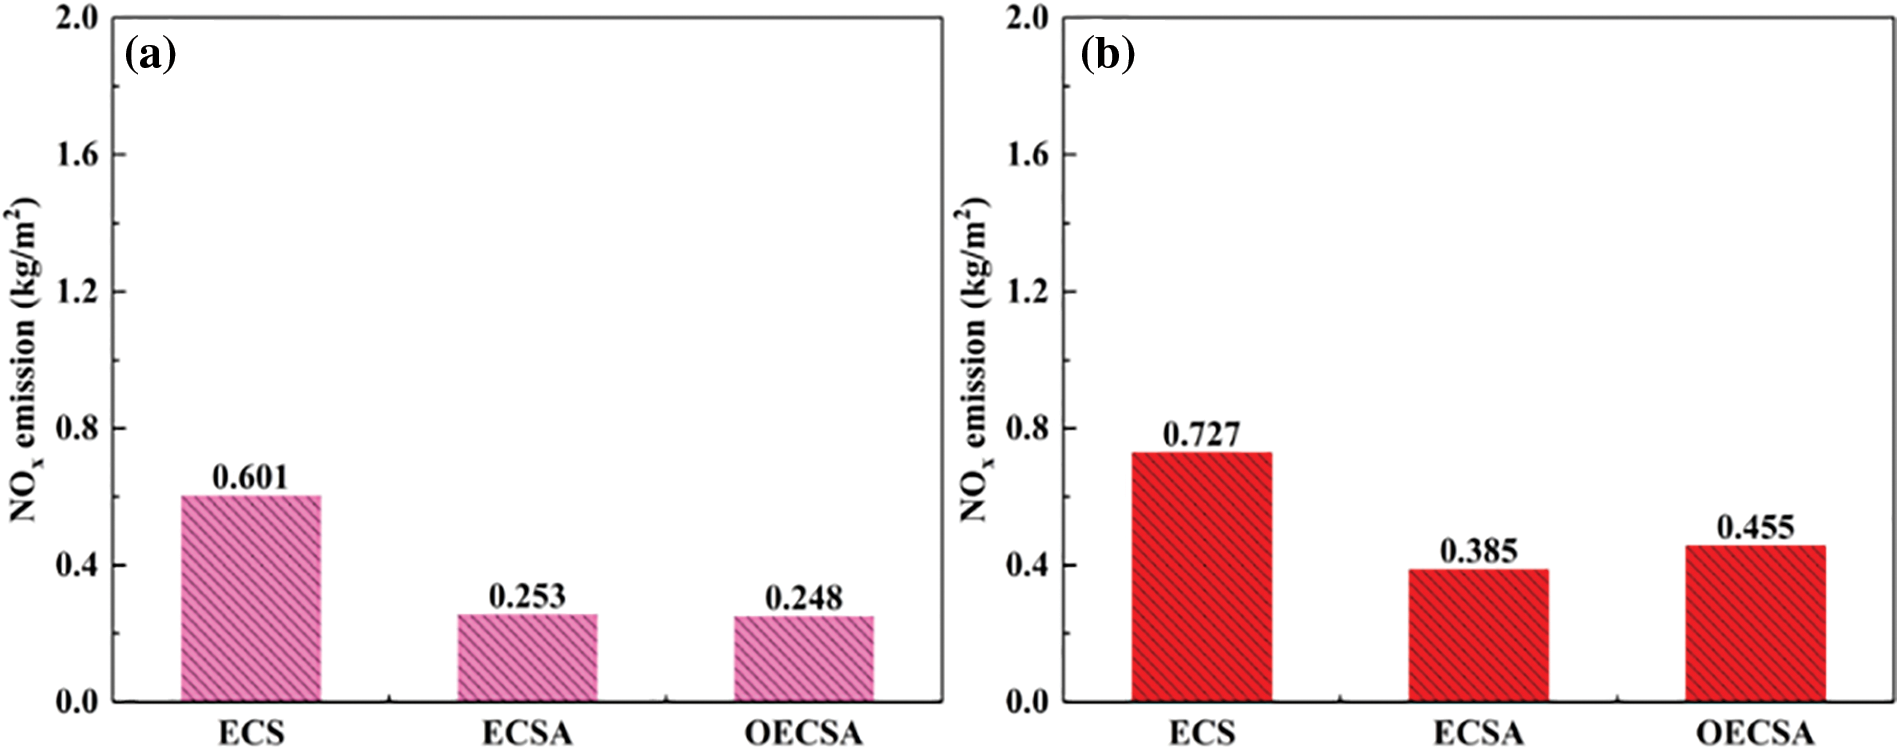
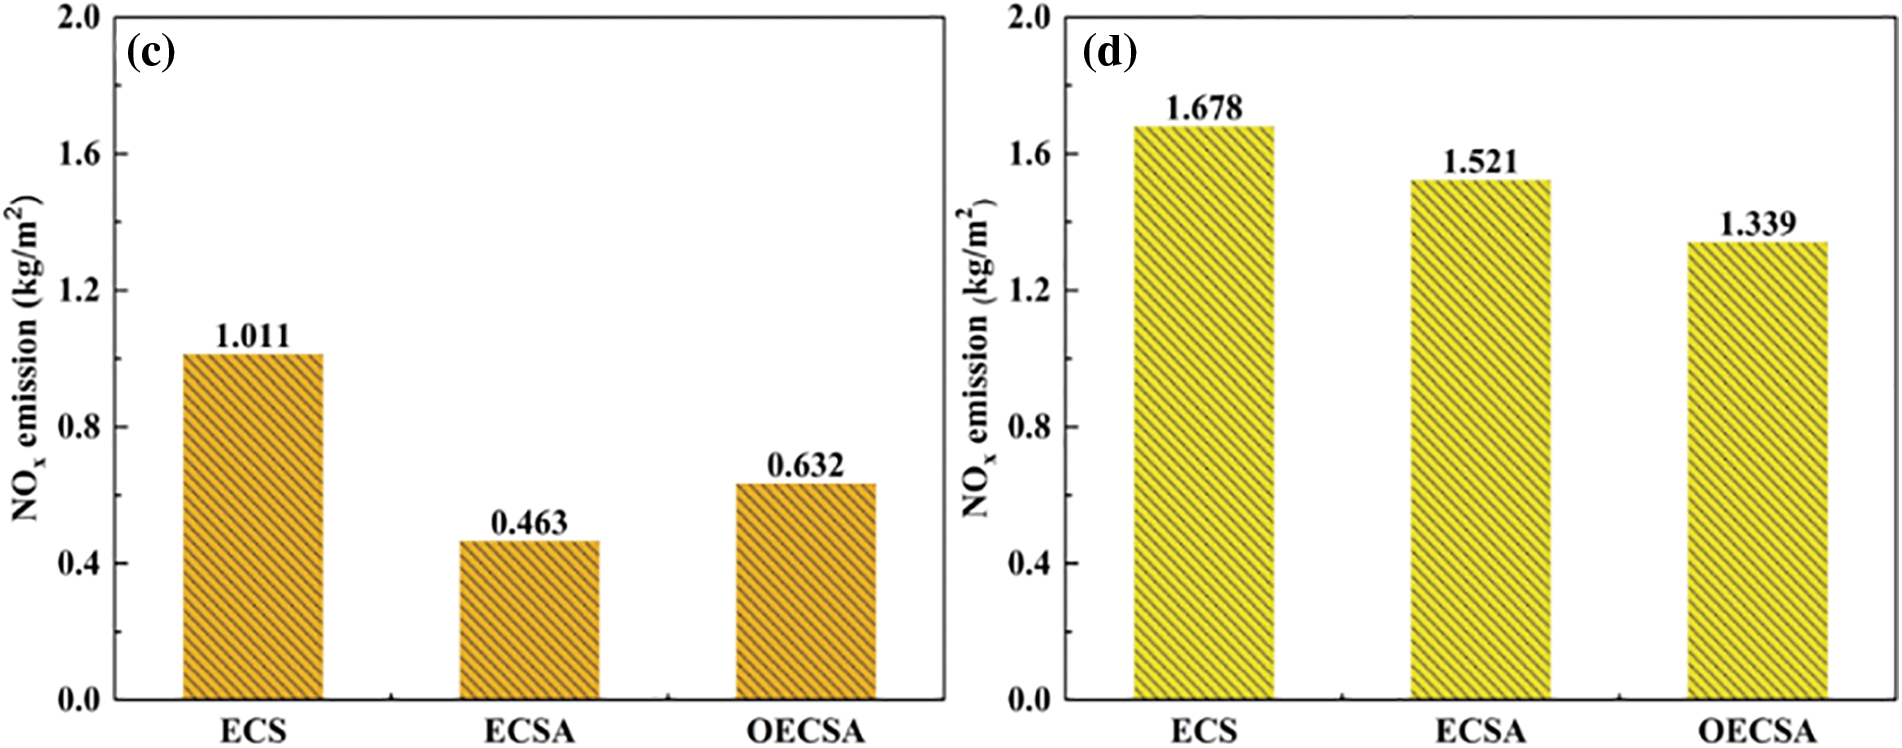
Figure 12: NOx emission in different cities: (a) Nanjing; (b) Tianjin; (c) Shenyang; (d) Harbin
In this study, the technical and economic analysis of ECSA system based on phase change heat storage was studied from the perspectives of system energy consumption, CO2 emissions, SO2 emissions, NOx emissions, initial investment costs, operating investment costs, etc. Based on the Hooke-Jeeves optimization method, the multi-mesh optimization of the system was carried out, and the application effects of ECSA system and ESC system before and after optimization were compared in Nanjing, Tianjin, Shenyang, and Harbin, which provided guidelines for the application of the system in different regions. The main conclusions are as follows:
The economic analysis showed that ECS system of solar coupled electric heat storage was suitable for application in the severe cold region, while ECSA system combined with air source heat pump increased the heating cost in the severe cold region.
From the perspective of energy consumption, ECSA system was suitable for the hot summer and cold winter region and the cold region.
The application of ECSA system can reduce CO2, SO2 and NOx emissions, which is conducive to environmental protection. However, the decrease in the heat supply of the solar heat collection system and the increase in electric heat storage system in the OECSA system of Tianjin and Shenyang led to an increase in the emissions of different pollutant gases.
Acknowledgement: This paper was completed with the hard help of every author.
Funding Statement: This work was supported by the National Key Research and Development Program of China (No. 2019YFE0193200 KY202001) and Science and Technology Planning Project of Beijing (No. Z201100008320001 KY191004).
Conflicts of Interest: The authors declare that they have no conflicts of interest to report regarding the present study.
References
1. Zhang, R. C., Wang, D. J., Liu, Y. F., Chen, Y. W., Fan, J. H. et al. (2021). Economic optimization of auxiliary heat source for centralized solar district heating system in Tibetan Plateau, China. Energy Conversion and Management, 243, 114385. https://doi.org/10.1016/j.enconman.2021.114385 [Google Scholar] [CrossRef]
2. Su, C., Madani, H., Palm, B. (2018). Heating solutions for residential buildings in China: Current status and future outlook. Energy Conversion and Management, 177, 493–510. https://doi.org/10.1016/j.enconman.2018.10.005 [Google Scholar] [CrossRef]
3. Yao, K. G., Li, T., Tao, H. Z., Wei, J. J., Feng, K. (2015). Performance evaluation of all-glass evacuated tube solar water heater with twist tape inserts using CFD. Energy Procedia, 70, 332–339. https://doi.org/10.1016/j.egypro.2015.02.131 [Google Scholar] [CrossRef]
4. Hazami, M., Kooli, S., Naili, N., Farhat, A. (2013). Long-term performances prediction of an evacuated tube solar water heating system used for single-family households under typical Nord-African climate (Tunisia). Solar Energy, 94, 283–298. https://doi.org/10.1016/j.solener.2013.05.020 [Google Scholar] [CrossRef]
5. Englmair, G., Moser, C., Schranzhofer, H., Fan, J., Furbo, S. (2019). A solar combi-system utilizing stable supercooling of sodium acetate trihydrate for heat storage: Numerical performance investigation. Applied Energy, 242, 1108–1120. https://doi.org/10.1016/j.apenergy.2019.03.125 [Google Scholar] [CrossRef]
6. Kong, X. F., Wang, L., Li, H., Yuan, G. P., Yao, C. Q. (2020). Experimental study on a novel hybrid system of active composite PCM wall and solar thermal system for clean heating supply in winter. Solar Energy, 195, 259–270. https://doi.org/10.1016/j.solener.2019.11.081 [Google Scholar] [CrossRef]
7. Li, J., Xue, P., He, H., Ding, W. Y., Han, J. M. (2009). Preparation and application effects of a novel form-stable phase change material as the thermal storage layer of an electric floor heating system. Energy and Buildings, 41(8), 871–880. https://doi.org/10.1016/j.enbuild.2009.03.009 [Google Scholar] [CrossRef]
8. Yang, L. W., Xu, R. J., Hua, N., Xia, Y., Zhou, W. B. et al. (2021). Review of the advances in solar-assisted air source heat pumps for the domestic sector. Energy Conversion and Management, 247, 114710. https://doi.org/10.1016/j.enconman.2021.114710 [Google Scholar] [CrossRef]
9. Zhou, L., Bao, H., Jin, K., Zhang, H., Chen, Z. et al. (2018). Application and analysis of air source heat pumps in countryside home heating with substituting electricity for coal. Earth and Environmental Science Conference, 012045. Hangzhou, China. [Google Scholar]
10. Dikici, A., Akbulut, A. (2008). Performance characteristics and energy-exergy analysis of solar-assisted heat pump system. Building and Environment, 43(11), 1961–1972. https://doi.org/10.1016/j.buildenv.2007.11.014 [Google Scholar] [CrossRef]
11. Georgiev, A. (2008). Testing solar collectors as an energy source for a heat pump. Renewable Energy, 33(4), 832–838. https://doi.org/10.1016/j.renene.2007.05.002 [Google Scholar] [CrossRef]
12. Li, H., Yang, H. (2010). Study on performance of solar assisted air source heat pump systems for hot water production in Hong Kong. Applied Energy, 87(9), 2818–2825. https://doi.org/10.1016/j.apenergy.2009.06.023 [Google Scholar] [CrossRef]
13. Martinez, P. J., Velázquez, A., Viedma, A. (2005). Performance analysis of a solar energy driven heating system. Energy and Buildings, 37(10), 1028–1034. https://doi.org/10.1016/j.enbuild.2004.12.008 [Google Scholar] [CrossRef]
14. Du, S., Wang, R. Z., Lin, P., Xu, Z. Z., Pan, Q. W. et al. (2012). Experimental studies on an air-cooled two-stage NH3-H2O solar absorption air-conditioning prototype. Energy, 45(1), 581–587. https://doi.org/10.1016/j.energy.2012.07.041 [Google Scholar] [CrossRef]
15. Liang, C. H., Zhang, X. S., Li, X. W., Zhu, X. (2011). Study on the performance of a solar assisted air source heat pump system for building heating. Energy and Buildings, 43(9), 2188–2196. https://doi.org/10.1016/j.enbuild.2011.04.028 [Google Scholar] [CrossRef]
16. Qu, M., Chen, J., Nie, L., Li, F., Yu, Q. et al. (2016). Experimental study on the operating characteristics of a novel photovoltaic/thermal integrated dual-source heat pump water heating system. Applied Thermal Engineering, 94, 819–826. https://doi.org/10.1016/j.applthermaleng.2015.10.126 [Google Scholar] [CrossRef]
17. Nicolson, M. L., Fell, M. J., Huebner, G. M. (2018). Consumer demand for time of use electricity tariffs: A systematized review of the empirical evidence. Renewable and Sustainable Energy Reviews, 97, 276–289. https://doi.org/10.1016/j.rser.2018.08.040 [Google Scholar] [CrossRef]
18. Alva, G., Lin, Y., Fang, G. (2018). An overview of thermal energy storage systems. Energy, 144, 341–378. https://doi.org/10.1016/j.energy.2017.12.037 [Google Scholar] [CrossRef]
19. Novo, A. V., Bayon, J. R., Castro-Fresno, D., Rodriguez-Hernandez, J. (2010). Review of seasonal heat storage in large basins: Water tanks and gravel-water pits. Applied Energy, 87, 390–397. https://doi.org/10.1016/j.apenergy.2009.06.033 [Google Scholar] [CrossRef]
20. Bruch, A., Fourmigué, J. F., Couturier, R. (2014). Experimental and numerical investigation of a pilot-scale thermal oil packed bed thermal storage system for CSP power plant. Solar Energy, 105, 116–125. https://doi.org/10.1016/j.solener.2014.03.019 [Google Scholar] [CrossRef]
21. Zou, L. L., Chen, X., Wu, Y. T., Wang, X., Ma, C. F. (2019). Experimental study of thermophysical properties and thermal stability of quaternary nitrate molten salts for thermal energy storage. Solar Energy Materials and Solar Cells, 190, 12–19. https://doi.org/10.1016/j.solmat.2018.10.013 [Google Scholar] [CrossRef]
22. Alonso, M. C., Vera-Agullo, J., Guerreiro, L., Flor-Laguna, V., Sanchez, M. et al. (2016). Calcium aluminate based cement for concrete to be used as thermal energy storage in solar thermal electricity plants. Cement and Concrete Research, 82, 74–86. https://doi.org/10.1016/j.cemconres.2015.12.013 [Google Scholar] [CrossRef]
23. Shkatulov, A., Aristov, Y. (2015). Modification of magnesium and calcium hydroxides with salts: An efficient way to advanced materials for storage of middle-temperature heat. Energy, 85, 667–676. https://doi.org/10.1016/j.energy.2015.04.004 [Google Scholar] [CrossRef]
24. Mastronardo, E., Bonaccorsi, L., Kato, Y., Piperopoulos, E., Milone, C. (2016). Efficiency improvement of heat storage materials for MgO/H2O/Mg (OH)2 chemical heat pumps. Applied Energy, 162, 31–39. https://doi.org/10.1016/j.apenergy.2015.10.066 [Google Scholar] [CrossRef]
25. Cárdenas, B., León, N. (2013). High temperature latent heat thermal energy storage: Phase change materials, design considerations and performance enhancement techniques. Renewable and Sustainable Energy Reviews, 27, 724–737. https://doi.org/10.1016/j.rser.2013.07.028 [Google Scholar] [CrossRef]
26. Zhao, B. C., Li, T. C., Gao, J. C., Wang, R. C. (2020). Latent heat thermal storage using salt hydrates for distributed building heating: A multi-level scale-up research. Renewable and Sustainable Energy Reviews, 121, 109712. https://doi.org/10.1016/j.rser.2020.109712 [Google Scholar] [CrossRef]
27. Tao, Y. B., He, Y. L. (2018). A review of phase change material and performance enhancement method for latent heat storage system. Renewable and Sustainable Energy Reviews, 93, 245–259. https://doi.org/10.1016/j.rser.2018.05.028 [Google Scholar] [CrossRef]
28. Nazir, H., Batool, M., Osorio, F. J. B., Isaza-Ruiz, M., Xu, X. et al. (2019). Recent developments in phase change materials for energy storage applications: A review. International Journal of Heat and Mass Transfer, 129, 491–523. https://doi.org/10.1016/j.ijheatmasstransfer.2018.09.126 [Google Scholar] [CrossRef]
29. Wang, L., Guo, L. H., Ren, J. L., Kong, X. F. (2022). Using of heat thermal storage of PCM and solar energy for distributed clean building heating: A multi-level scale-up research. Applied Energy, 321, 119345. [Google Scholar]
30. Xiong, F., Wei, B., Xu, F. (2022). Identification of arch dam mechanical parameters based on sensitivity analysis and Hooke-Jeeves algorithm optimization. Structures, 46, 88–98. https://doi.org/10.1016/j.apenergy.2022.119345 [Google Scholar] [CrossRef]
31. Zhang, R., Wang, D., Liu, Y. F., Chen, Y. W., Fan, J. H. (2021). Economic optimization of auxiliary heat source for centralized solar district heating system in Tibetan Plateau, China. Energy Conversion and Management, 243, 114385. https://doi.org/10.1016/j.enconman.2021.114385 [Google Scholar] [CrossRef]
32. Huang, J., Fan, J., Furbo, S., Chen, D., Dai, Y. et al. (2019). Economic analysis and optimization of household solar heating technologies and systems. Sustainable Energy Technologies and Assessments, 36, 100532. https://doi.org/10.1016/j.seta.2019.100532 [Google Scholar] [CrossRef]
33. Wei, W., Ni, L., Zhou, C., Yao, Y., Xu, L. et al. (2020). Performance analysis of a quasi-two stage compression air source heat pump in severe cold region with a new control strategy. Applied Thermal Engineering, 174, 115317. https://doi.org/10.1016/j.applthermaleng.2020.115317 [Google Scholar] [CrossRef]
Cite This Article
 Copyright © 2023 The Author(s). Published by Tech Science Press.
This work is licensed under a Creative Commons Attribution 4.0 International License , which permits unrestricted use, distribution, and reproduction in any medium, provided the original work is properly cited.
 Downloads
 Citation Tools