
 Submit a Paper
 Propose a Special lssue
 Open Access
ARTICLE

Grid Side Distributed Energy Storage Cloud Group End Region Hierarchical Time-Sharing Configuration Algorithm Based on Multi-Scale and Multi Feature Convolution Neural Network
State Grid Chongqing Shiqu Electric Power Supply Branch, Chongqing, 400000, China
* Corresponding Author: Wen Long. Email:
Energy Engineering 2023, 120(5), 1253-1269. https://doi.org/10.32604/ee.2023.026395
Received 02 September 2022; Accepted 17 November 2022; Issue published 20 February 2023
 View Full Text
 Download PDF
Abstract
There is instability in the distributed energy storage cloud group end region on the power grid side. In order to avoid large-scale fluctuating charging and discharging in the power grid environment and make the capacitor components show a continuous and stable charging and discharging state, a hierarchical time-sharing configuration algorithm of distributed energy storage cloud group end region on the power grid side based on multi-scale and multi feature convolution neural network is proposed. Firstly, a voltage stability analysis model based on multi-scale and multi feature convolution neural network is constructed, and the multi-scale and multi feature convolution neural network is optimized based on Self-Organizing Maps (SOM) algorithm to analyze the voltage stability of the cloud group end region of distributed energy storage on the grid side under the framework of credibility. According to the optimal scheduling objectives and network size, the distributed robust optimal configuration control model is solved under the framework of coordinated optimal scheduling at multiple time scales; Finally, the time series characteristics of regional power grid load and distributed generation are analyzed. According to the regional hierarchical time-sharing configuration model of “cloud”, “group” and “end” layer, the grid side distributed energy storage cloud group end regional hierarchical time-sharing configuration algorithm is realized. The experimental results show that after applying this algorithm, the best grid side distributed energy storage configuration scheme can be determined, and the stability of grid side distributed energy storage cloud group end region layered time-sharing configuration can be improved.Keywords
In order to meet the growing demand for electric energy, China’s power construction scale has gradually increased, the power generation capacity has reached the first place in the world, and the installed capacity of power generation is far more than that of many developed countries, promoting the stable development of the national economy [1]. The side distributed power grid is a power generation, distribution and consumption system composed of distributed power supply, energy storage system, load and other structures, which has the function of self monitoring and controlling the operation status [2,3]. If there can be an effective optimization layered time-sharing configuration algorithm applied to the power grid, it will make the application scope of the power grid wider. Distributed generation refers to any power generation unit installed in the power grid by independent power producers or users. It is a new form of clean energy application at present [4,5]. The installed capacity of distributed generation unit is less than 50 MW, which is close to the load center. It has the advantages of small floor area, low initial investment, high energy utilization rate and strong stability. It is an inevitable choice for power supply demand in some special occasions.
In order to enable the power grid to reduce operating costs, reduce losses and improve power supply security, many scholars have studied the hierarchical time-sharing configuration algorithm. Bai et al. [6] proposed the optimal allocation of energy storage on the power grid side taking into account the value of improving the operation efficiency of multi-level distribution networks. First, based on the role of energy storage in peak load reduction and valley filling of network supply load, a reasonable measurement method for the value of improving the operation efficiency of lines at this level is proposed, Combined with the possible differences of stakeholders between the upper and lower distribution networks, an analysis method of the substitution effect of the energy storage configuration of the lower distribution network on the capacity of the upper distribution network is proposed. Secondly, a two-level alternative optimization framework for the configuration and operation of energy storage system is constructed and solved by using mature optimization tools. Finally, the effectiveness and practicability of the proposed method are verified by the analysis of an improved ieee-33 bus system. Guo et al. [7] proposed a location allocation method of power grid side energy storage system taking into account multi-attribute comprehensive indicators and economy. At the multi-point location level of energy storage system, combined with the multi-functional requirements of energy storage system on the power grid side and system stability and economy, based on line load rate, network loss sensitivity, voltage sensitivity, and taking into account the timing of indicators, a multi-attribute comprehensive indicator evaluation model is constructed. At the level of optimal allocation of power capacity of energy storage system, a bilevel programming mathematical model is established. In the outer layer, the benefits of delaying transmission line upgrading, reducing system network loss benefits, energy storage investment costs and system operation costs are considered, and the power and capacity of multi-point layout energy storage system are optimized with the goal of maximizing the net benefits of configuring energy storage system; The inner layer aims to minimize the operation cost after configuring the energy storage system, and optimize the source, storage and operation curve. Fabrice et al. [8] proposed a multi-level power and energy management strategy for photovoltaic power generation and hydrogen storage hybrid microgrid. This method is based on distributed explicit model predictive control. The energy management system analyzes the interaction between the power management system and the energy management system through mixed integer quadratic programming to improve its storage efficiency. Abadi et al. [9] proposed a model predictive control strategy to improve the performance of the DC microgrid hybrid energy storage system. The current is decomposed through low-pass or high pass filters. In order to maintain signal stability, the filtering model predictive control strategy enables the DC microgrid to obtain higher gain value, so as to obtain better voltage storage quality. Based on the improved IEEE 24 bus example, the effectiveness of the proposed model is verified, which lays the foundation for the planning of large-scale energy storage technology on the grid side. Although the above research has made some progress, the connection between distributed generation and large power grid mainly occurs in the power grid, which will have an impact on the internal structure of the power grid, resource allocation and other aspects, resulting in the reduction of regional power grid capacity, power quality and operation reliability. If the installation node of the distributed power supply is wrong, it will increase the loss of the power grid at first, and then the distribution system will not work normally.
To solve the problems in the above methods, a grid side distributed energy storage cloud group end region hierarchical time-sharing configuration algorithm based on multi-scale and multi feature convolution neural network is proposed. Multiscale and multi feature convolution neural network is a feedforward neural network, which is constructed according to the characteristics of biological vision and perception, including supervised learning and unsupervised learning, and can be applied to the field of recognition and classification. In the grid side distributed energy storage cloud group end regional environment, the energy storage and supply system is responsible for the aggregation and processing of electric energy signals, and can distribute them to lower level application components with the help of transmission channels, which can effectively improve the grid side distributed energy storage cloud group end regional layered time-sharing configuration.
2 Grid Side Distributed Energy Storage Cloud Group End Region Hierarchical Time-Sharing Configuration Algorithm
2.1 Voltage Stability Analysis Based on Multiscale and Multi Feature Convolution Neural Network
Through the high-dimensional nonlinear mapping relationship between the electrical quantity and the voltage stability state, the voltage stability of the distributed energy storage cloud group end region at the power grid side can be analyzed. The deep structure of the multi-scale and multi feature convolution neural network can obtain more information, which is more intelligent than artificial, and can obtain the key characteristics of the input quantity [10,11]. The multi-scale and multi feature convolutional neural network can describe the high-dimensional nonlinear mapping relationship in many aspects, and process the high-dimensional data with high quality by sharing the convolution kernel. Therefore, the multi-scale and multi feature convolutional neural network is very suitable for analyzing the voltage stability of the distributed energy storage cloud group end region on the power grid side.
Based on the stability analysis of multi-scale and multi feature convolution neural network, it is necessary to define the appropriate model structure of multi-scale and multi feature convolution neural network, and construct the correct mapping relationship between input and output. Finally, deep learning is carried out according to the input characteristics, so as to analyze the voltage stability of multi-scale and multi feature convolution neural network.
To analyze the voltage stability of multi-scale and multi feature convolution neural network, it is necessary to select the appropriate characteristic quantity as the input sample. Select the corresponding data from the measurement or simulation, input the initial data in the multi-scale and multi feature convolution neural network model, and the multi-scale and multi feature convolution neural network model is shown in Fig. 1.
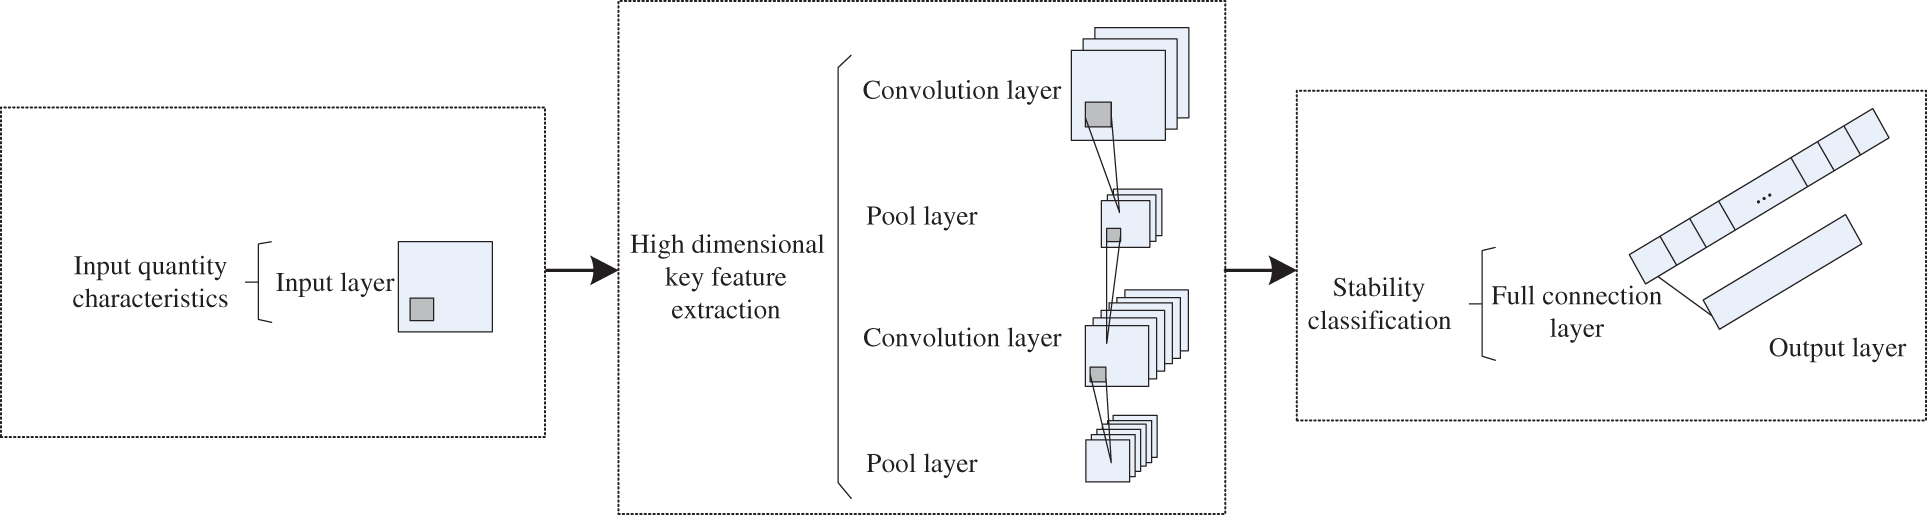
Figure 1: Multi-scale and multi feature convolution neural network model
For the input sample matrix, the convolution layer realizes local learning through the convolution kernel of the multi-scale and multi feature convolution neural network model. The convolution calculation equation of the convolution kernel is:
In Eq. (1),
The pooling layer uses the maximum pooling method, which is described by Eq. (2):
In Eq. (2),
The calculation equation of the whole connection layer is:
In Eq. (3),
The full connection layer inputs the output value into the output layer, and the output layer uses
In Eq. (4),
2.1.2 Optimization of Multiscale and Multi Feature Convolution Neural Network Based on SOM Algorithm
The convergence of multi-scale and multi feature convolution neural network affects its learning effect. The convergence is related to the initialization weight. SOM algorithm is applied to multi-scale and multi feature convolution neural network to preprocess the initialization weight, that is, preprocess the stability index to optimize the convergence of its multi-scale and multi feature convolution neural network.
SOM neural network includes two layers, specifically input layer and output layer. The input layer inputs samples into the network, and the selection of neurons in the output layer is based on the principle of survival of the fittest, so the input samples include multiple reaction areas.
The input sample of SOM neural network is set as
In Eq. (5),
2.1.3 Voltage Stability Analysis of Cloud Group End Region of Distributed Energy Storage on the Grid Side under the Framework of Credibility
The multi-scale and multi feature convolutional neural network optimized by SOM algorithm cannot analyze the stability of the stable boundary. Therefore, this paper proposes a four element decision structure based on the credibility framework to improve the credibility of the stability analysis of the distributed energy storage cloud group end region layered time-sharing configuration on the power grid side.
After the test samples are processed by
In Eq. (6),
Looking up the training samples, we can know the reliability thresholds
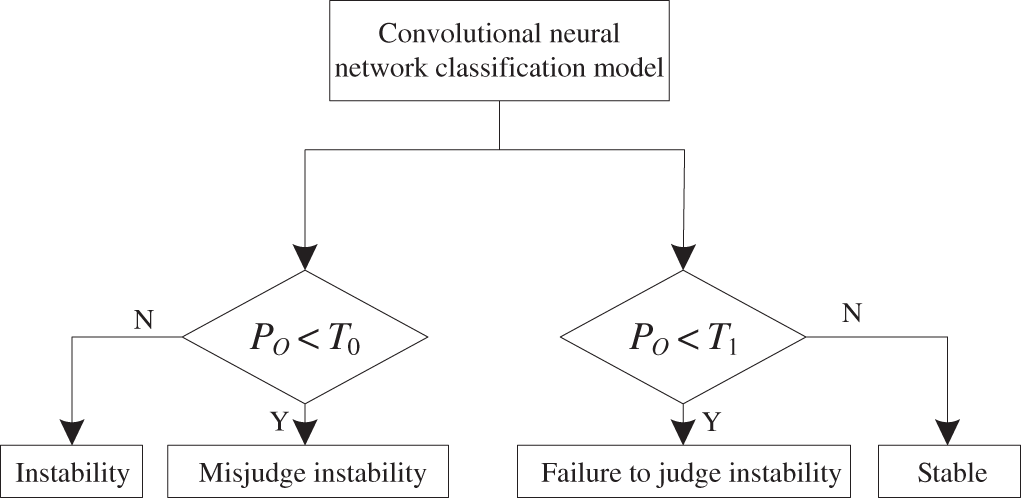
Figure 2: Voltage stability of distributed energy storage cloud group end region on grid side determined by quaternion evaluation structure
As shown in Fig. 2, compare the size of
Based on the above analysis method, the final analysis results of voltage stability in the cloud group end region of distributed energy storage on the power grid side are stability, missed instability, instability and misjudged instability. For the situation of stability and misjudgment of instability, analyze its stability. If the evaluation result is instability or missing judgment of instability, give an alarm in time, and inform the staff to adjust or make decisions on the voltage of the distributed energy storage cloud group end area on the power grid side.
2.2 Coordinated Optimal Scheduling Framework under Multi Time Scales
According to the three time scales of day ahead, day in day rolling and real-time, the distributed energy storage grid is divided into three time periods for configuration optimization scheduling. During the day ahead optimization period, the configuration optimization of the distributed energy storage network is carried out by using the day ahead market price, the output of the distributed energy storage network, the interruptible load reduction, etc., to control the output status, load reduction and power purchase of the distributed energy storage network next day, and configure the optimization scheduling framework, as shown in Fig. 3.
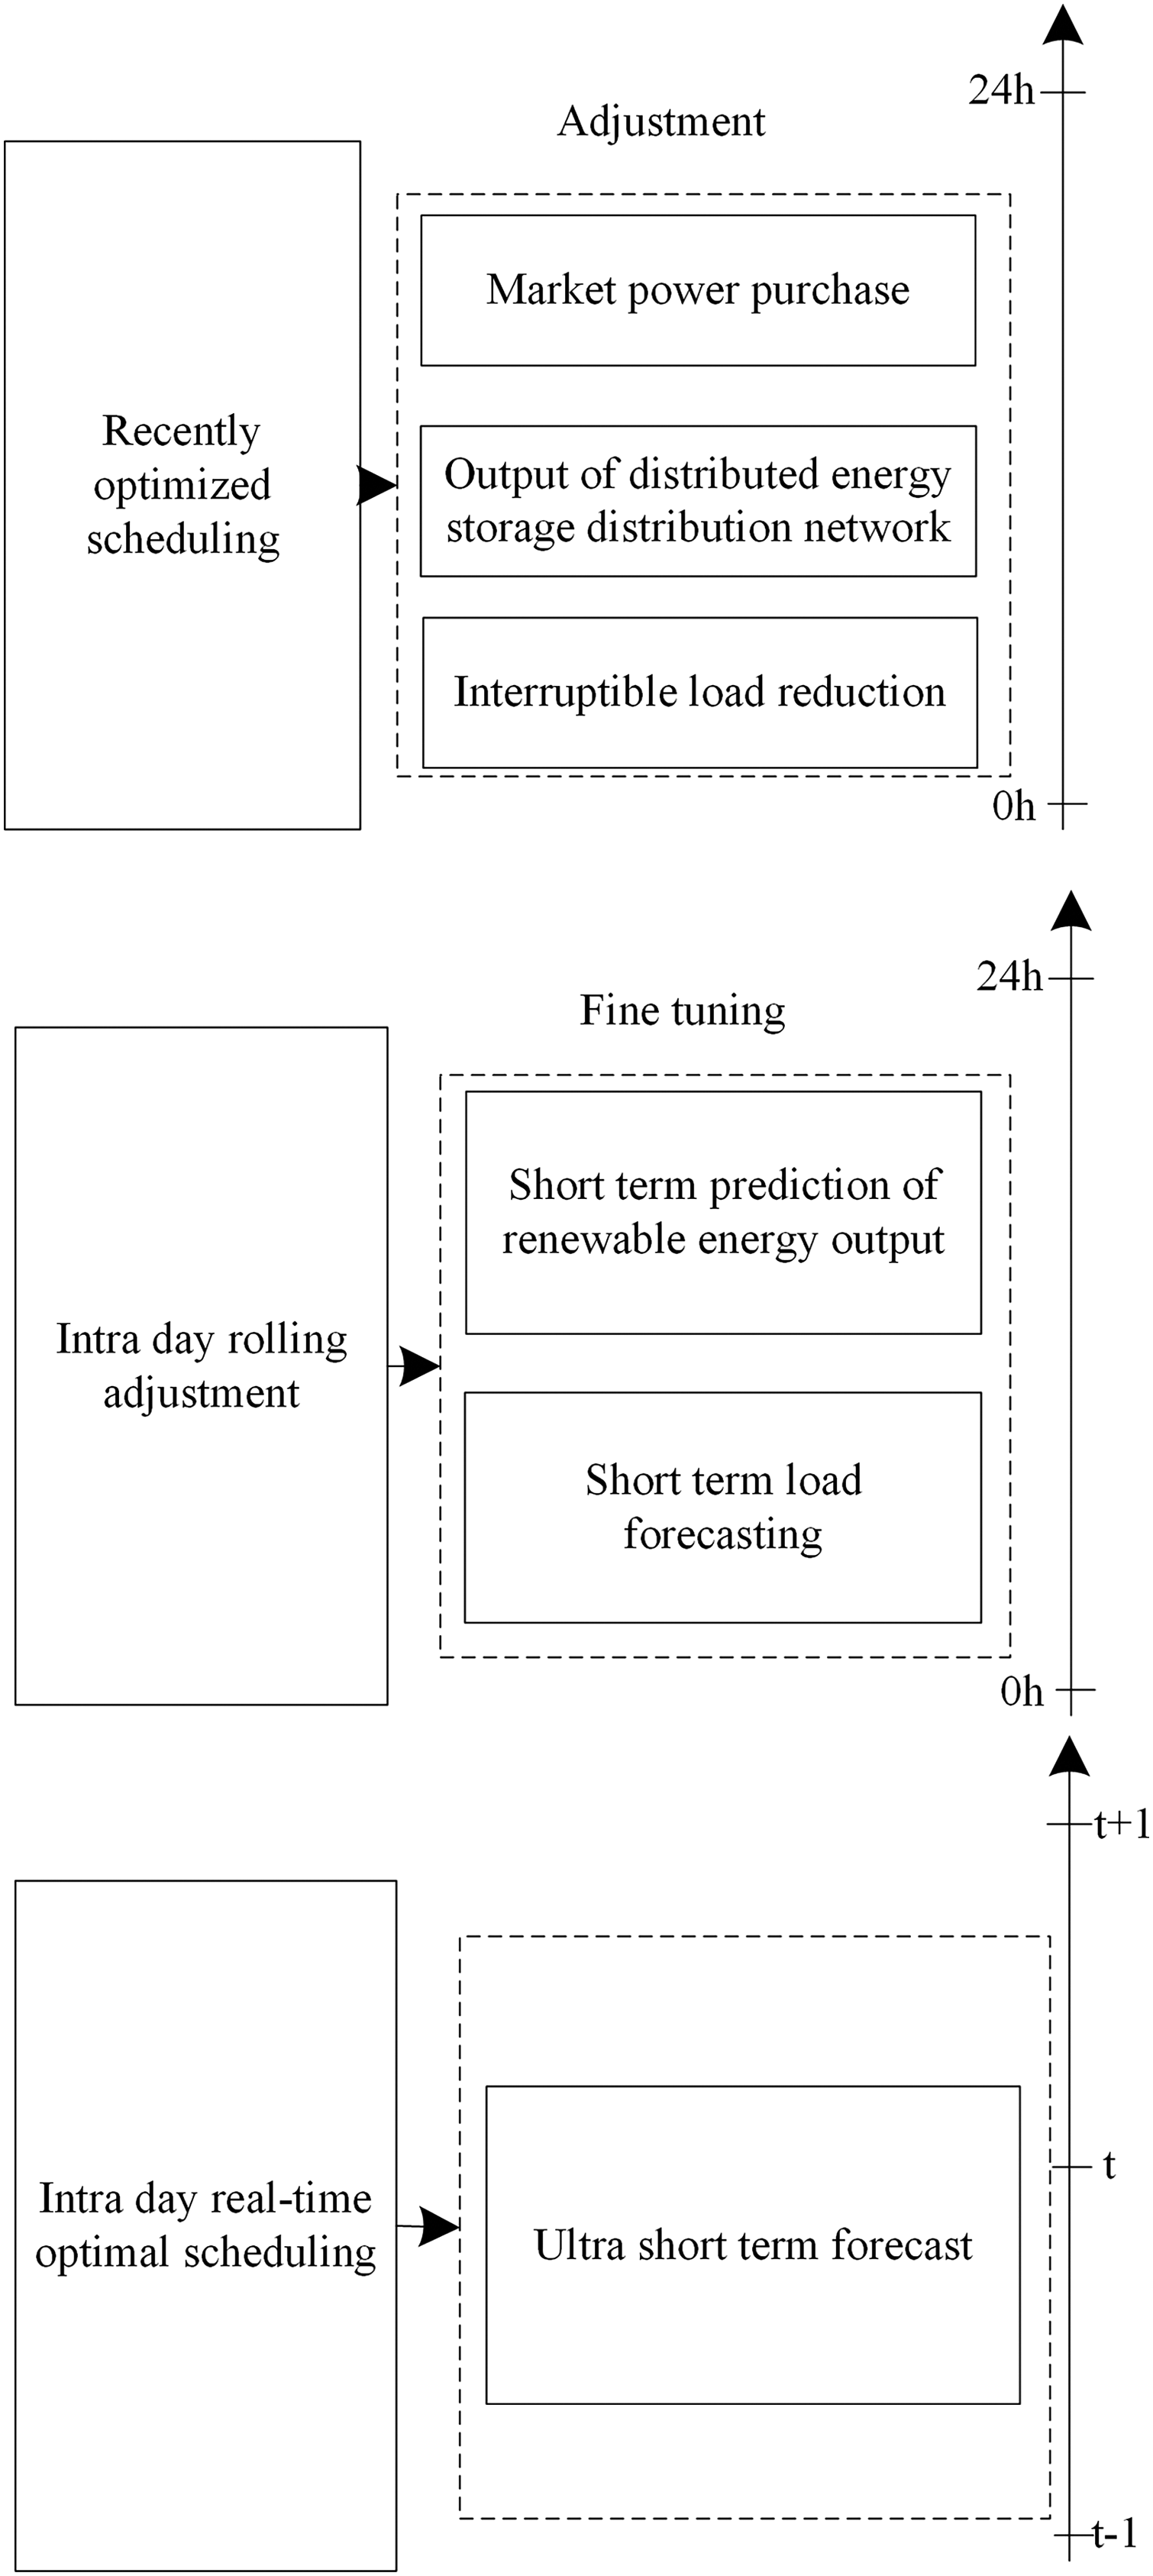
Figure 3: Framework diagram of distributed energy storage grid configuration optimization scheduling under multiple time scales
According to Fig. 3, with the extension of the time scale, the prediction results of renewable energy output and load are divorced from the actual demand for optimal scheduling, and further adjustment is made through the intra day stage at this time. If the superposition value of daily and intra day changes of load and renewable energy output prediction results does not exceed a certain threshold, there is no need for rolling adjustment. At this time, the results of daily optimal scheduling still meet the needs of actual optimal scheduling, and the configuration and optimal scheduling of distributed energy storage grid can continue to be carried out according to the standard of daily optimization. If the superposition value is larger than the threshold value, it is necessary to make rolling adjustment to the day ahead optimization results. The real-time optimal dispatching node is based on the intra day rolling adjustment to further fine tune the optimal dispatching of the distributed energy storage grid configuration. During the intra day rolling optimal scheduling calculation, the real-time operation status of the distributed energy storage grid is collected every time, and the ultra short predicted power value is updated at the same time, so that the optimal scheduling method has a certain proofreading function, which can ensure the stability and robustness of the scheduling method.
The distributed energy storage grid has enough time in the previous stage to optimize the configuration and scheduling, so as to provide reference for the distribution of the distributed energy storage grid and the use and production of relevant resources in the next day [12,13]. As the day ahead optimal scheduling is applied to the distributed energy storage grid, it is necessary to consider the actual working conditions and various resource operation parameters, take the safety of the distributed energy storage grid as the constraint condition, take the minimum loss of the grid, avoid the peak and fill the shortage as the goal, carry out the optimal scheduling operation through the scheduling methods of distributed generation, energy storage and grid operation, and take the particle swarm optimization algorithm as the day ahead optimal scheduling method, the process of particle swarm optimization algorithm is simple, easy to operate, and the convergence speed is fast, which can avoid producing local optimal solutions.
2.2.1 Optimize Scheduling Objectives
The calculation process of optimal scheduling objective function is shown in Eq. (7):
In Eq. (7),
(1) Minimum objective function of power grid loss
The calculation process of the minimum objective function of power grid loss is shown in Eq. (8):
In Eq. (8),
(2) Peak shaving and grain filling objective function
The meaning of peak shaving and valley filling is to make the load curve as stable as possible. Through the calculation of load variance, the stable state of the load curve can be presented, and the minimum value of load variance is taken as the objective result of avoiding peak and filling insufficient sub objective function operation. The objective function is shown in Eq. (9):
In Eq. (9),
Network scale is a scoped index parameter, which is different from the weighting factor and correlation order. This coefficient index has a poor influence on wireless sensor networks, and the instruction significance derived from it can only be expressed in the shallow structure of the network. However, for the distributed energy storage and supply system, the network scale determines the electrical signal action intensity that the host element must bear in unit time [14,15]. Therefore, in order to keep the capacitor components in a relatively stable charge and discharge state, the calculated network scale index must be controlled within the established numerical range. Let
With the increase of the coverage area of wireless sensor networks, the calculation results of the network scale will continue to increase. In this process, the energy storage and energy supply intensity of the distributed microgrid will gradually increase, so its ability to control the stability of the charging and discharging behavior of capacitive components is also continuously enhanced.
2.3 Solution of Distributed Robust Optimal Configuration Control Model
For the distributed robust optimal configuration control model, this paper adopts the multi-scale and multi feature convolution neural network to solve it. This method decomposes the solved objective function, forms each objective function into two main and sub problems, and solves them alternately, so as to obtain the optimal solution of the objective function. The solving steps are as follows:
Step 1: Given the value of a group of
Step 2: According to the worst scenario determined above, complete the solution of the two main problems and obtain the optimal solution; The new lower bound is described by the value of the objective function of the main problem [16].
Step 3: According to the optimal solution result, solve the corresponding sub problem, and obtain the objective function value result and the value of
Step 4: Set the convergence threshold of the solution algorithm, represented by
3 Grid Side Distributed Energy Storage Cloud Group End Region Layered Time-Sharing Configuration Algorithm Based on Multi-Scale and Multi Feature Convolution Neural Network
3.1 Analysis of Regional Power Grid Load and Time Sequence Characteristics of Distributed Generation
In the actual operation process, the load size of regional power grid and distributed power generation will change correspondingly with time [17], and the maximum load of both will not appear in the same period of time, which will greatly hinder the configuration planning of regional power grid. Therefore, the time series characteristics of regional power grid load and distributed generation are analyzed before the construction of regional hierarchical time-sharing configuration model.
An example of regional grid load curve is shown in Fig. 4.
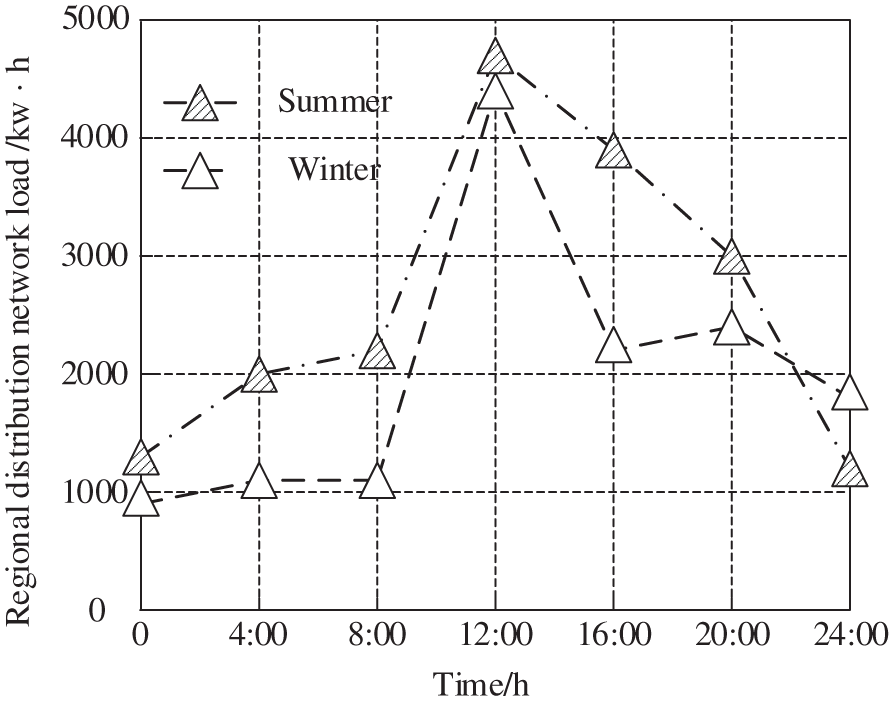
Figure 4: Example diagram of load time series curve of regional power grid
An example of distributed power timing curve is shown in Fig. 5.
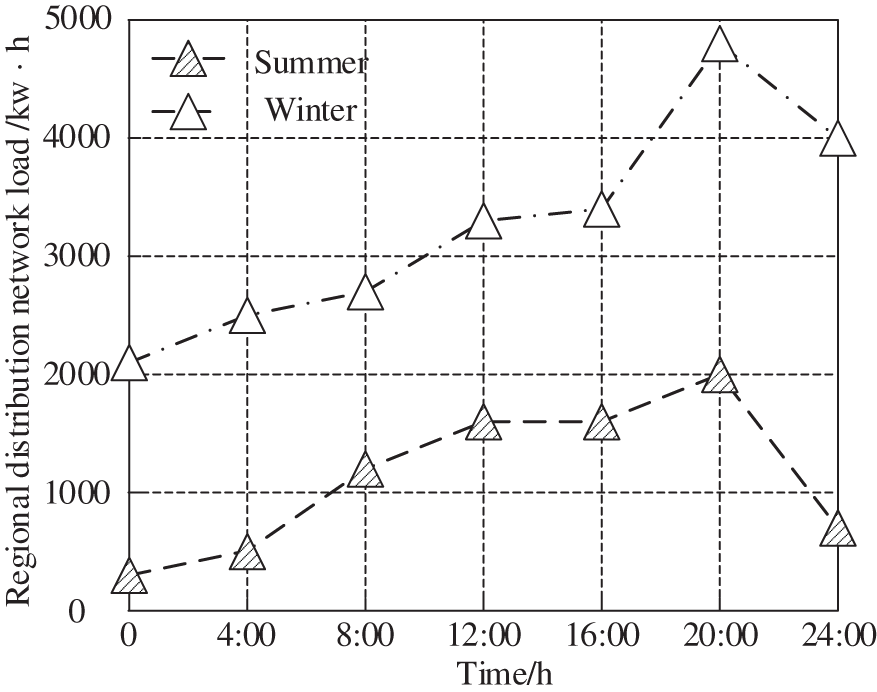
Figure 5: Example diagram of distributed power timing curve
As shown in Figs. 4 and 5, the maximum load of the regional power grid mainly occurs at 12:00 in summer, while the maximum output of the distributed power generation mainly occurs at 20:00 in winter. The seasons and time periods of the two do not coincide, which is likely to make the power grid reverse the trend and overload the load, threatening the stability and reliability of the operation of the regional power grid.
The above process completes the analysis of the regional power grid load and the timing characteristics of distributed generation, exposes the key problems of distributed generation access to the power grid, and makes sufficient preparations for the subsequent implementation of the grid side distributed energy storage cloud group end region layered time-sharing configuration algorithm.
3.2 Grid Side Distributed Energy Storage Cloud Group End Area Hierarchical and Time-Sharing Configuration Algorithm
Based on the above analysis results of regional power grid load and distributed generation timing characteristics, from the perspective of cloud, group and end, the grid side distributed energy storage cloud group end regional hierarchical time-sharing configuration algorithm is realized, as shown below:
3.2.1 “Cloud” Layer Regional Layered Time-Sharing Configuration Model
Aiming at maximizing the benefits of distributed power operators, build a regional layered time-sharing configuration model of the “cloud” layer
In Eq. (11),
3.2.2 “Group” Layer Regional Hierarchical Time-Sharing Configuration Model
Aiming at minimizing the cost of regional power grid, a “group” layer regional hierarchical time-sharing configuration model
In Eq. (12),
In the process of regional power grid configuration planning, after the distributed power supply is connected, it is easy to have “island” phenomenon, resulting in the complexity of
(1)
(2)
(3)
3.2.3 “End” Layer Regional Layered Time-Sharing Configuration Model
With the goal of maximizing user benefits, build a regional layered time-sharing configuration model of the “end” layer
In Eq. (13),
Integrating Eqs. (11)–(13), that is, the construction of regional layered time-sharing configuration model is completed, and the configuration planning problem is converted into mathematical form, so as to realize the grid side distributed energy storage cloud group end regional layered time-sharing configuration algorithm.
4 Analysis of Experimental Results
In order to test the application effect of the grid side distributed energy storage cloud group end region layered time-sharing configuration algorithm based on multi-scale and multi feature convolution neural network in this paper. PQVIEW is a multi component software system used to establish and analyze power quality and energy measurement databases. A regional power grid is randomly selected for the coordinated configuration experiment. In the experiment, the distributed power is connected to the side distributed energy storage network and placed on different nodes. The distributed power is one wind turbine with a capacity of 50 kW; One small gas turbine with capacity of 90 kW; A battery with a capacity of 250 kW, a rated capacity of 4.5 kW, an AC voltage of 380 V/50 Hz, and a total power of 0~3 kw for DC and AC loads. The relevant parameters of the power supply connected to the distributed energy storage grid are shown in Table 1. The system architecture of the distributed energy storage cloud cluster terminal area on the grid side is shown in Fig. 6.
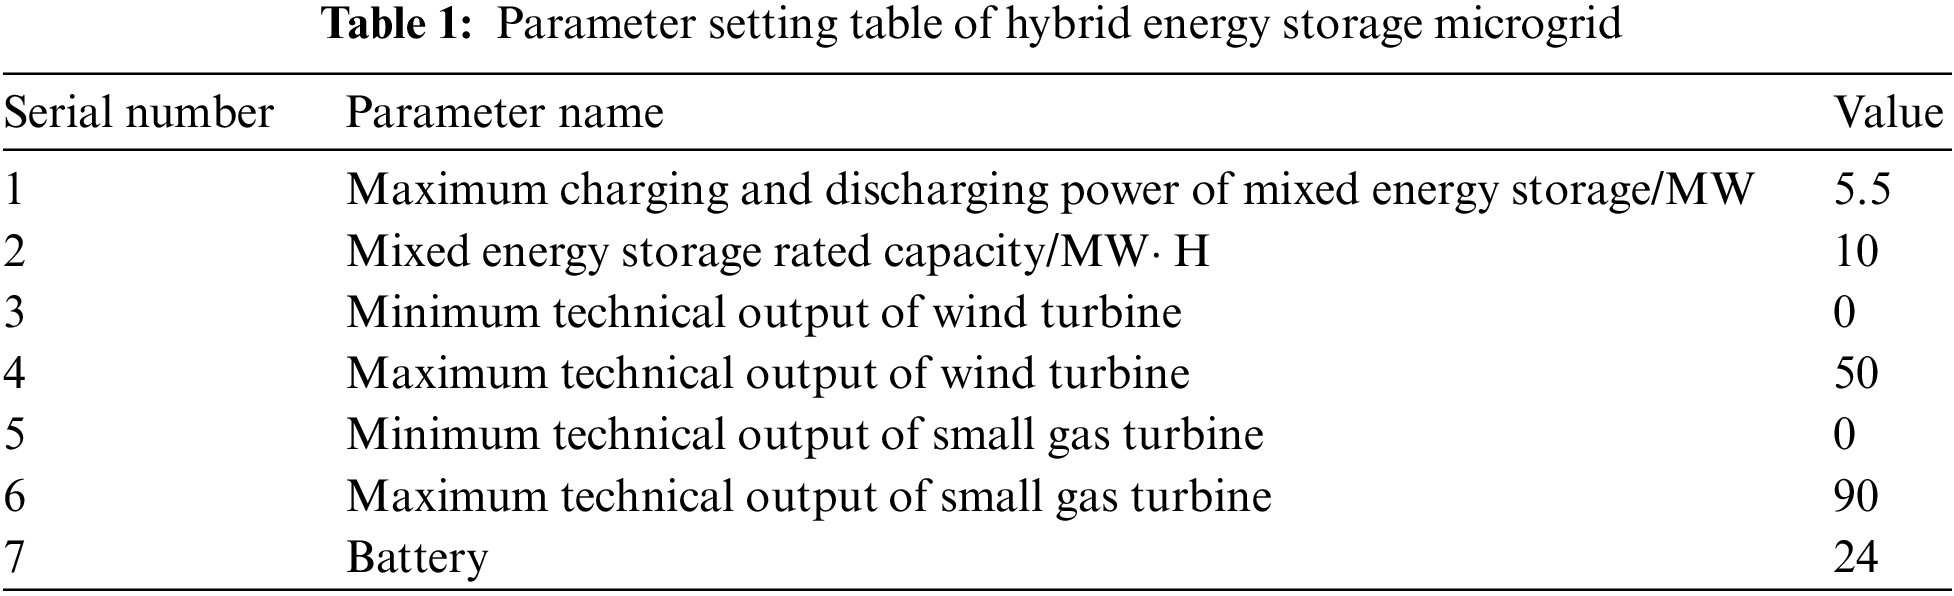
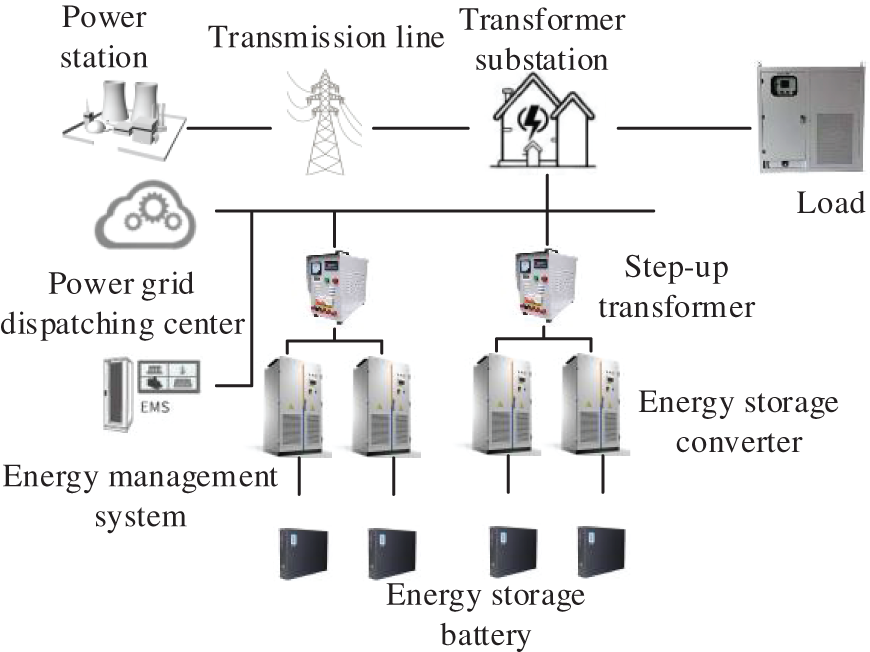
Figure 6: System architecture diagram of distributed energy storage cloud cluster terminal area on grid side
In the experiment, the grid side distributed energy storage cloud group end area hierarchical time-sharing configuration needs to analyze the load of each time period in a day, and take the total load calculated by the whole day standard as a reference to adjust the total load at other times. The load active power of the day ahead load and the load time-sharing configuration of the distributed energy storage cloud group end region on the grid side at each time before the day are shown in Fig. 7.
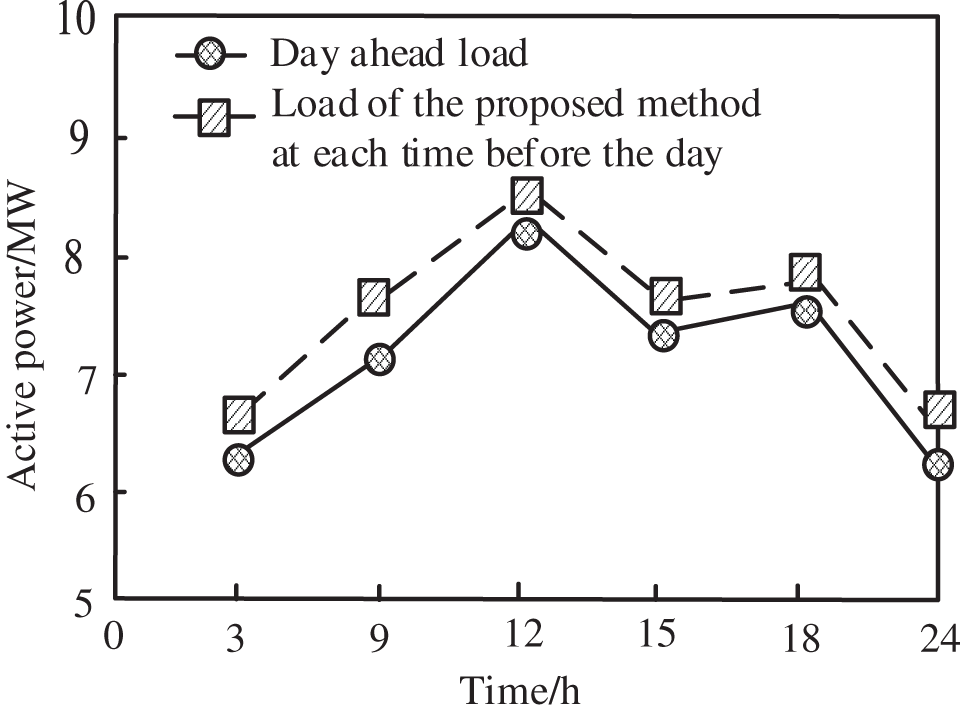
Figure 7: Load and electricity price results before the day
According to Fig. 7, the fluctuation trend of the load active power before the day and the load active power of the grid side distributed energy storage cloud group end area layered time-sharing configuration at each time before the day is similar. In order to measure the effect of the algorithm in this paper on the hierarchical time-sharing configuration of the distributed energy storage cloud group end region on the grid side, test the grid loss and maximum voltage deviation of the hybrid energy microgrid under different load fluctuations. The test results are shown in Table 2.
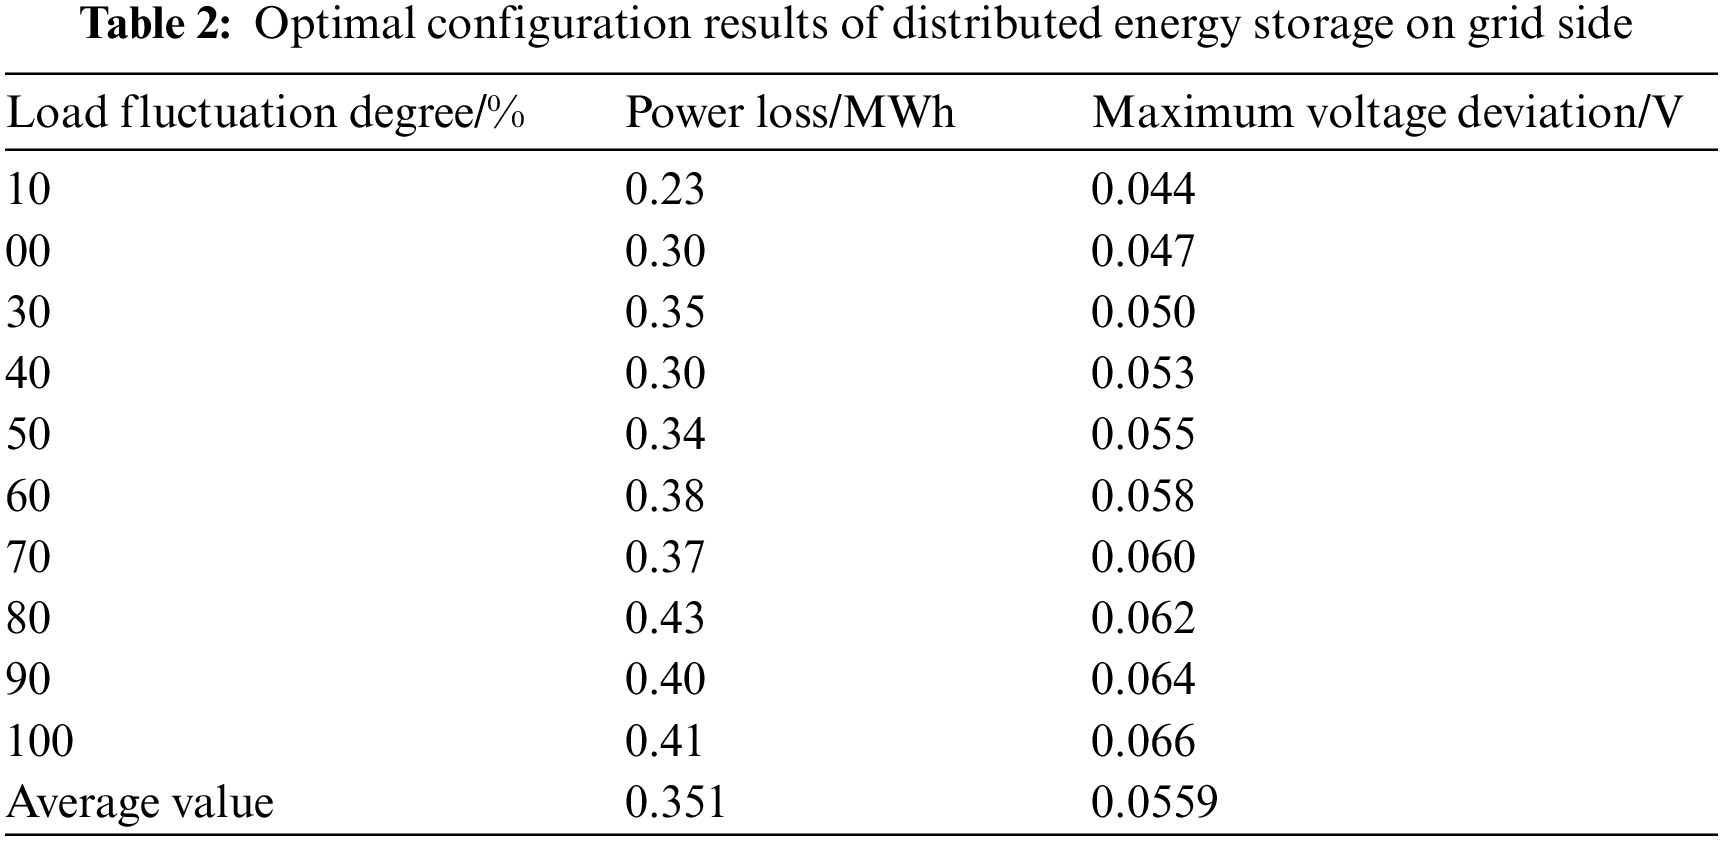
According to the test results in Table 2, after the application of the algorithm in this paper, the best grid side distributed energy storage configuration scheme can be determined. The maximum values of grid loss and maximum voltage deviation of grid side distributed energy storage are 0.43 MWh and 0.068 V, respectively, and the average values are 0.351 MWh and 0.0559 V, respectively, which can ensure the utilization of electric energy, reduce grid loss and ensure the stability of voltage.
In order to verify the applicability of the algorithm in this paper, the indirect and direct carbon emission results under different power output during the operation of the grid side distributed energy storage cloud group end region layered time-sharing configuration after the application of the algorithm in this paper are shown in Table 3.
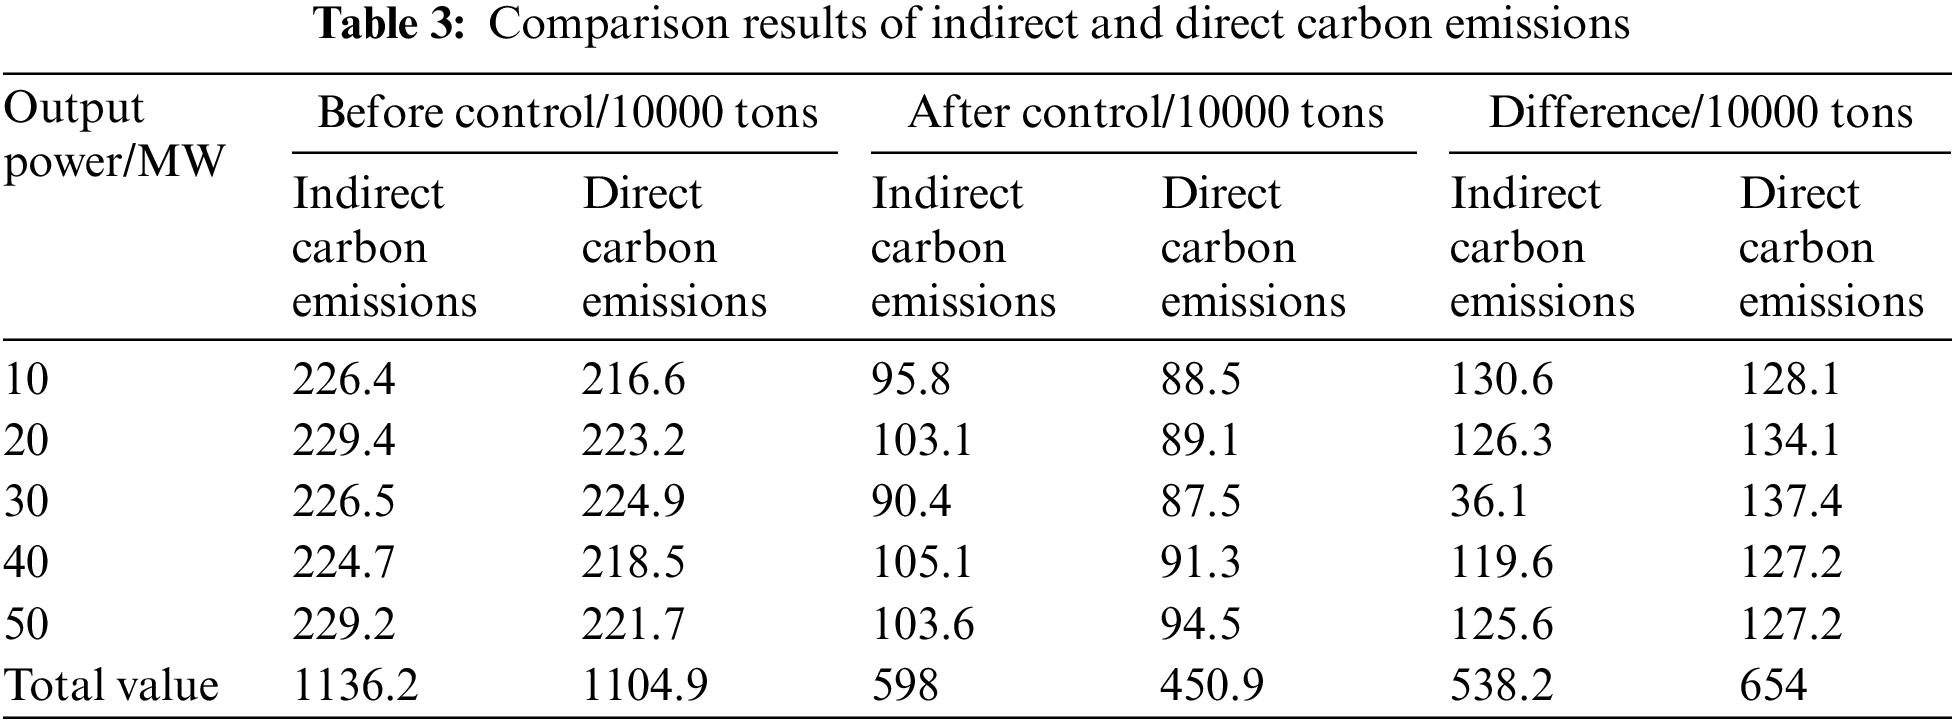
According to the test results in Table 3, before the application of this algorithm, with the gradual increase of power output, the distributed energy storage cloud group end region layered time-sharing configuration on the power grid side has higher indirect and direct carbon emission results, with the highest values of 2.294 and 2.249 million tons, respectively. After the algorithm control in this paper, under different output power, the results of indirect and direct carbon emissions decreased significantly, with the highest values of 1,051,000 and 945,000 tons. Therefore, this algorithm has good applicability and can effectively reduce carbon emissions.
Five kinds of insulation faults are set up in the experiment, including harmonic fault, arc anomaly, switching overvoltage, bus voltage fluctuation, and insulator dampness. The judgment sensitivity of the distributed energy storage cloud group end area layered time-sharing configuration on the power grid side to different fault types before and after using this algorithm is compared. Sensitivity is an indicator to evaluate system faults. The higher the sensitivity is, the earlier the fault is detected. Fig. 8 shows the judgment sensitivity results of different fault types.
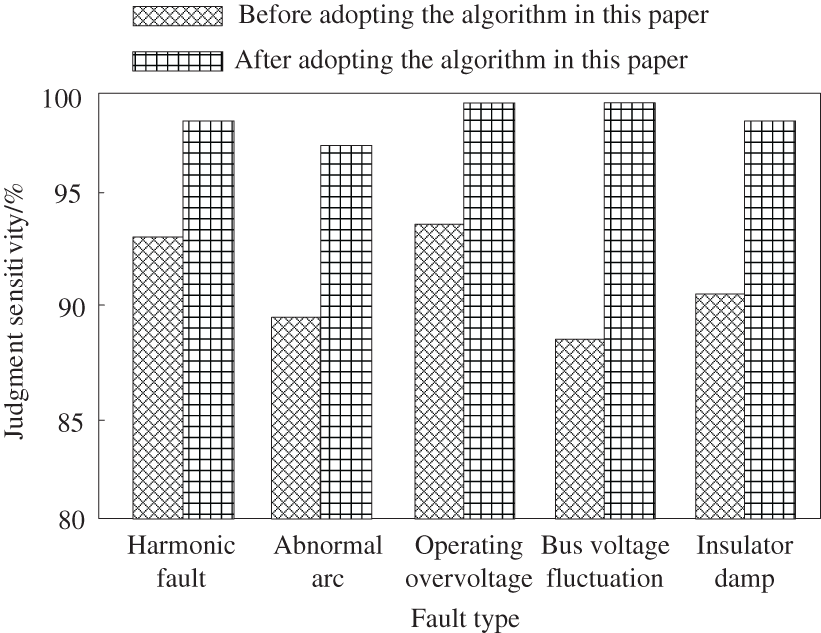
Figure 8: Comparison results of judgment sensitivity of different fault types before and after using the algorithm in this paper
According to the analysis of Fig. 8, compared with before the application of this algorithm, after the application of this algorithm, the grid side distributed energy storage cloud group end region layered time-sharing configuration has higher sensitivity to judge various fault types. Especially for the fault of bus voltage fluctuation, the judgment sensitivity is 88% before the application of this algorithm. After the application of this algorithm, the judgment sensitivity is 98%, which is increased by 10%, and the improvement is the best among all faults. It shows that after applying the algorithm in this paper, the fault diagnosis sensitivity of the grid side distributed energy storage cloud group end region layered time-sharing configuration is high, which can improve the speed of analyzing the stability of layered time-sharing configuration.
This method, reference [6] method and reference [7] method are used to verify the power loss of grid energy storage. The energy storage is connected to the multi power distribution network, which can effectively reduce the change of distribution network current and improve the path current level. The power loss comparison results of different methods are shown in Fig. 9.
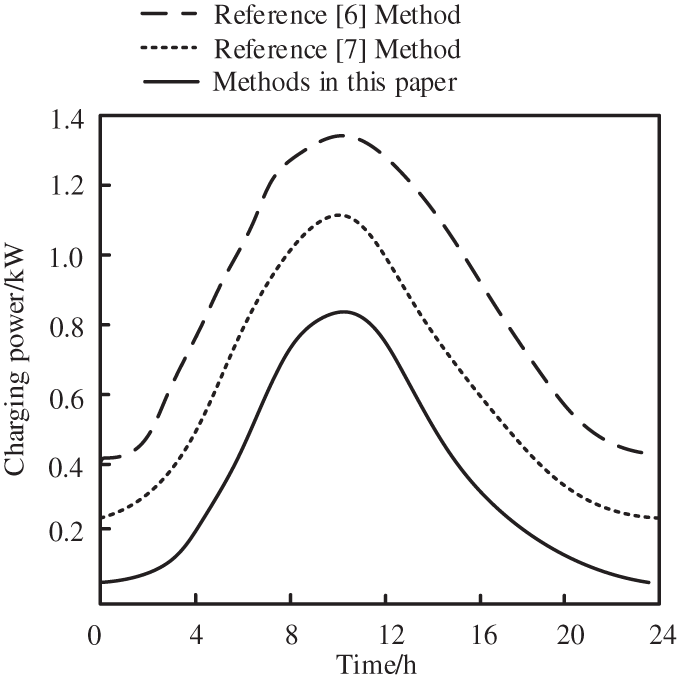
Figure 9: Comparison of power loss of power grid energy storage by different methods
It can be seen from the experimental results in Fig. 8 that the maximum power loss of this method is lower than 1.0 kW, while the power loss of the reference [6] method and the reference [7] method is greater than 1.0 kW, and the power loss of this method is significantly lower than that of the other two methods. It can be concluded that this method can reduce the power loss of power grid energy storage.
The fluctuation trend of the active power of the day ahead load and the load of the distributed energy storage cloud group end area layered time-sharing configuration on the grid side at each time before the day is similar; After the application of this algorithm, the best distributed energy storage configuration scheme on the grid side can be determined, which can ensure the utilization of electric energy, reduce the power loss of the network, and ensure the stability of voltage at the same time; After the algorithm control in this paper, under different output power, the results of indirect and direct carbon emissions decreased significantly, with the highest values of 1,051,000 and 945,000 tons. Therefore, this algorithm has good applicability and can effectively reduce carbon emissions; Compared with before the application of this algorithm, after the application of this algorithm, the grid side distributed energy storage cloud group end region layered time-sharing configuration has higher sensitivity to judge various fault types; It shows that after applying the algorithm in this paper, the fault diagnosis sensitivity of layered time-sharing configuration is high, which can improve the speed of analyzing the stability of distributed energy storage cloud group end region layered time-sharing configuration on the power grid side.
Some achievements have been made in the research of grid side distributed energy storage cloud group end region layered time-sharing configuration, but there are still some problems that have not been discussed in depth, and there are still research values in many aspects, including the following points:
(1) Optimize the scheduling of controllable energy efficiency loads among individual users. With the improvement of residents’ living standards, there will be many new devices for controllable loads, such as electric vehicles, intelligent devices, etc. How to centrally optimize and manage more controllable energy efficiency loads, so as to further reduce power costs and achieve the purpose of peak shaving and valley filling while ensuring users’ normal life and comfort.
(2) The evaluation index for the optimal dispatching of the cloud group end area of distributed energy storage on the power grid side can be reflected by the indoor temperature and water heater temperature difference before and after optimization. The evaluation of user satisfaction is relatively simple. Therefore, how to establish a more comprehensive user satisfaction evaluation index or system is very important and needs further research and discussion.
(3) The grid side distributed energy storage cloud group end area layered time-sharing configuration equipment used is the most widely commercialized electrochemical battery. However, there is no research on electromagnetic energy storage equipment in the future development prospects, such as superconducting and super capacitor energy storage equipment. How to coordinate and optimize the configuration of a variety of energy storage equipment is also a problem worth studying in the future.
Funding Statement: The study was supported by State Grid Corporation Limited Science and Technology Project Funding (Contract No. SGCQSQ00YJJS2200380).
Conflicts of Interest: The authors declare that they have no conflicts of interest to report regarding the present study.
References
1. Khan, M., Jarvis, L., Young, E. A., Swanson, A. G., Stephen, R. G. (2020). Design, construction, and testing of a desktop superconducting series reactor toward the grid installation of a prototype unit. IEEE Transactions on Applied Superconductivity, 30(5), 1–7. DOI 10.1109/TASC.2020.2968921. [Google Scholar] [CrossRef]
2. Mahdy, A., Hasanien, H. M., Helmy, W., Turky, R. A., Aleem, S. A. (2022). Transient stability improvement of wave energy conversion systems connected to power grid using anti-windup-coot optimization strategy. Energy, 245(1), 1–10. DOI 10.1016/j.energy.2022.123321. [Google Scholar] [CrossRef]
3. Liu, Y., Xu, B., Botterud, A., Zhang, N., Kang, C. (2021). Bounding regression errors in data-driven power grid steady-state models. IEEE Transactions on Power Systems, 36(2), 1023–1033. DOI 10.1109/TPWRS.2020.3017684. [Google Scholar] [CrossRef]
4. Fahmy, H. (2022). The rise in investors’ awareness of climate risks after the paris agreement and the clean energy-oil-technology prices nexus. Energy Economics, 106(1), 38–48. [Google Scholar]
5. Conlon, T., Waite, M., Wu, Y., Modi, V., Lund, H. et al. (2022). Assessing trade-offs among electrification and grid decarbonization in a clean energy transition: Application to New York State. Energy, 249(6), 11–19. DOI 10.1016/j.energy.2022.123787. [Google Scholar] [CrossRef]
6. Bai, H., Yu, L., Liang, S., Zhang, B., Chen, G. C. et al. (2020). Optimized configuration of grid-side energy storage considering the value of multi-stage distribution network operation efficiency improvement. Proceedings of the CSU-EPSA, 32(3), 7–13. [Google Scholar]
7. Guo, W., Xiu, X. Q., Li, W. Q., Li, J. L. (2020). Siting and configuration methods for grid-side energy storage system considering multi-attribute comprehensive indices and economy. Electric Power Construction, 41(4), 53–62. [Google Scholar]
8. Fabrice, K., Damour, C., Grondin, D., Hilairet, M., Benne, M. (2022). Multistage power and energy management strategy for hybrid microgrid with photovoltaic production and hydrogen storage. Applied Energy, 323(7), 119549. DOI 10.1016/j.apenergy.2022.119549. [Google Scholar] [CrossRef]
9. Abadi S. A. G., K., Habibi, S. I., Khalili, T., Bidram, A. (2022). A model predictive control strategy for performance improvement of hybrid energy storage systems in DC microgrids. IEEE Access, 10, 25400–25421. DOI 10.1109/ACCESS.2022.3155668. [Google Scholar] [CrossRef]
10. Tang, X., Zhang, T. (2021). Facial expression recognition algorithm based on convolution neural network and multi-feature fusion. Journal of Physics: Conference Series, 1883(1), 12–18. DOI 10.1088/1742-6596/1883/1/012018. [Google Scholar] [CrossRef]
11. Wu, S., Wang, Q., Zeng, Q., Zhang, Y., Shao, Y. et al. (2022). Automatic extraction of outcrop cavity based on a multiscale regional convolution neural network. Computers & Geosciences, 160(3), 105–138. DOI 10.1016/j.cageo.2022.105038. [Google Scholar] [CrossRef]
12. Zakeri, B., Gissey, G. C., Dodds, P. E., Subkhankulova, D. (2021). Centralized vs. distributed energy storage–benefits for residential users. Energy, 236(1), 121–126. [Google Scholar]
13. Nousdilis, A., Kryonidis, G., Kontis, E., Christoforidis, G. C., Papagiannis, G. (2020). An exponential droop control strategy for distributed energy storage systems integrated with photovoltaics. IEEE Transactions on Power Systems, 36(4), 3317–3328. DOI 10.1109/TPWRS.2020.3045619. [Google Scholar] [CrossRef]
14. Parsons, S. G., Duffy-Deno, K. T. (2021). Are telecommunications regulators correct in their beliefs that network size affects origination/termination? Telecommunications Policy, 45(2), 102–118. DOI 10.1016/j.telpol.2020.102078. [Google Scholar] [CrossRef]
15. Zarei, A., Pahlevani, P., Lucani, D. E. (2020). An analytical model for sparse network codes: Field size considerations. IEEE Communications Letters, 24(4), 729–733. DOI 10.1109/LCOMM.2020.2965928. [Google Scholar] [CrossRef]
16. Claus, M. (2021). On continuity in risk-averse bilevel stochastic linear programming with random lower level objective function. Operations Research Letters, 49(3), 412–417. DOI 10.1016/j.orl.2021.04.007. [Google Scholar] [CrossRef]
17. Wang, W. Q., Zhang, H., Jin, F. (2020). Topology modeling and simulation of regional power network in four-dimensional coordinate system. Computer Simulation, 37(11), 109–112, 141. [Google Scholar]
Cite This Article
 Copyright © 2023 The Author(s). Published by Tech Science Press.
This work is licensed under a Creative Commons Attribution 4.0 International License , which permits unrestricted use, distribution, and reproduction in any medium, provided the original work is properly cited.
 Downloads
 Citation Tools