
 Submit a Paper
 Propose a Special lssue
 Open Access
ARTICLE

Recognition of Hybrid PQ Disturbances Based on Multi-Resolution S-Transform and Decision Tree
1 School of Automation and Electrical Engineering, Lanzhou Jiaotong University, Lanzhou, 730070, China
2 Key Lab of Opt-Electronic Technology and Intelligent Control of Ministry of Education, Lanzhou Jiaotong University, Lanzhou, 730070, China
* Corresponding Author: Di Liao. Email:
Energy Engineering 2023, 120(5), 1133-1148. https://doi.org/10.32604/ee.2023.025900
Received 04 August 2022; Accepted 26 September 2022; Issue published 20 February 2023
 View Full Text
 Download PDF
Abstract
Aiming at the problems of multiple types of power quality composite disturbances, strong feature correlation and high recognition error rate, a method of power quality composite disturbances identification based on multi-resolution S-transform and decision tree was proposed. Firstly, according to IEEE standard, the signal models of seven single power quality disturbances and 17 combined power quality disturbances are given, and the disturbance waveform samples are generated in batches. Then, in order to improve the recognition accuracy, the adjustment factor is introduced to obtain the controllable time-frequency resolution through multi-resolution S-transform time-frequency domain analysis. On this basis, five disturbance time-frequency domain features are extracted, which quantitatively reflect the characteristics of the analyzed power quality disturbance signal, which is less than the traditional method based on S-transform. Finally, three classifiers such as K-nearest neighbor, support vector machine and decision tree algorithm are used to effectively complete the identification of power quality composite disturbances. Simulation results show that the classification accuracy of decision tree algorithm is higher than that of K-nearest neighbor and support vector machine. Finally, the proposed method is compared with other commonly used recognition algorithms. Experimental results show that the proposed method is effective in terms of detection accuracy, especially for combined PQ interference.Keywords
With the continuous development of power grid, a variety of nonlinear, impact loads and power electronic equipment are constantly increasing, and the power quality problem is becoming increasingly serious, which has become a highly concerned issue in the world [1]. Accurate detection and effective identification of Power Quality disturbance (PQD) signal is an important basis for implementing the assessment, prediction, diagnosis, maintenance and management of Power Quality problem, and also a premise and key factor to improve and enhance Power Quality.
In the complex power grid environment, the power quality disturbance signal is non-stationary, and most of the disturbances are represented by the combination of multiple disturbances, that is, the composite power quality disturbance. The characteristic quantity of the composite disturbance is not simply superimposed by a single power quality disturbance, but cross coupling between time-frequency domain characteristics, which requires the signal analysis method to have high efficiency [2]. Therefore, in recent years, composite PQD identification has become a hot and difficult point in the field of power quality.
Generally speaking, PQD is mainly composed of three parts: disturbance signal detection, feature extraction and disturbance identification as shown in Fig. 1 [3]. At present, common signal processing technologies include Fast Fourier transform (FFT) [4], short time Fourier transform (STFT) [5], wavelet transform (WT) [6–8], Hilbert Huang transform (HHT) [9,10], S-transform (ST) [11,12]. FFT is widely used in the field of power quality detection because of its many advantages such as orthogonal and complete. However, FFT is only suitable for stationary signal analysis because of the contradiction of localization in time domain and frequency domain. It cannot meet the requirements of analyzing power quality disturbance signals with non-stationary characteristics such as transient and abrupt change [4]. Although STFT overcomes the defect that FFT and its improved algorithm cannot conduct local analysis to some extent, its window function length is fixed, which makes the STFT analysis results of the same signal using different window functions are far from each other [5]. WT has the ability of time-frequency analysis and is suitable for the analysis of non-stationary signals with mutation characteristics, but it is susceptible to noise, and has problems such as large computation amount and difficulty in generating function selection [7]. HHT is another commonly used method for non-stationary signal analysis. It is sensitive to singularities of signals and has good dynamic performance in analyzing transient power quality problems, but it also suffers from poor anti-noise performance and long time consuming for high-order spline interpolation [10]. As a combination of WT and STFT, S transform not only has good time-frequency analysis ability, but also the transform result is directly related to its Fourier transform, which does not need to meet the wavelet admissibility condition, so it is very suitable for the extraction of power quality disturbance signal features, but it requires a large amount of calculation. The main classification and recognition methods of power quality disturbance signal feature vectors are Fuzzy Logic (FL) [13], support vector machine (SVM) [14,15], K-nearest neighbor (KNN) [16–22] and decision tree (DT) [23–26]. Both FL and KNN methods have the advantages of simple principle and easy to understand, but with the increase of disturbance signal types, the fault tolerance and complexity of the system will greatly limit its classification ability [13]. Although SVM algorithm is simple, when the number of samples increases and there is mutual aliasing among samples, the number of support vectors will increase and the training difficulty will increase [15]. Compared with other methods, Decision trees require less data preparation in the process of preprocessing, do not need to normalize the data, and do not need to scale the data. Although the classification accuracy of DT depends on the selected features, DT is easier to construct and its real-time processing ability is better than other methods. If the features can be clearly distinguished, the efficiency of DT method is very high.
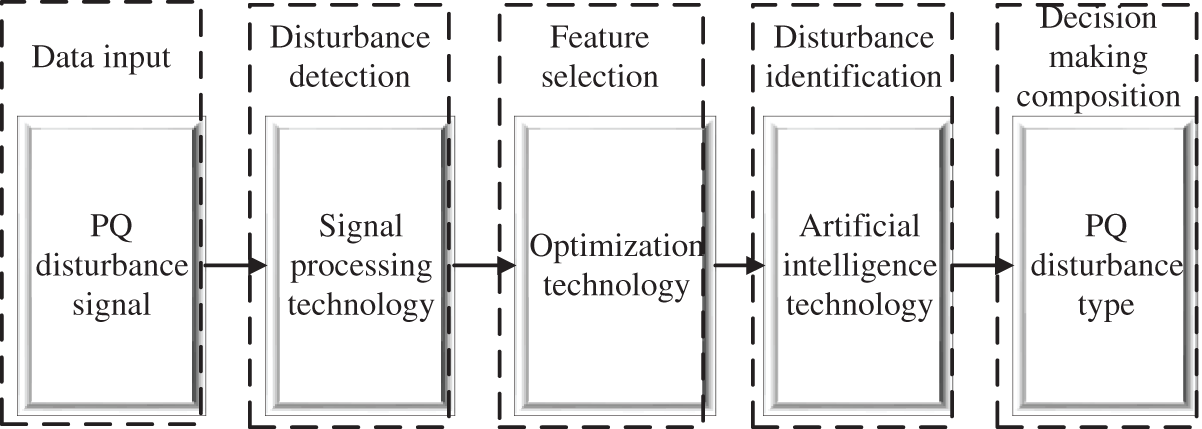
Figure 1: Block diagram of power quality disturbance identification
In order to realize accurate identification of power quality composite disturbances, this paper proposes a power quality disturbance signal identification method based on multi-resolution S-transform (MST) and decision tree. MST algorithm is an improved algorithm of ST, which can achieve controllable time-frequency resolution through parameter adjustment window function. In addition, this method has been successfully applied to the research of seismic signal processing. MST was used to analyze the time-frequency characteristics of PQ signals, and five characteristic statistics of each PQ signal were obtained. On this basis, DT classifier is used to classify PQ signals according to feature statistics. Due to the effectiveness of MST, the efficiency of DT classifier can be guaranteed. And compared with other power quality disturbance identification algorithms, simulation and comparison results show that the proposed algorithm can accurately and quickly classify and identify power quality disturbance signals.
2 PQDS Signal Model and Waveform
According to IEEE-1159 and literature [27–30] the signal models and parameter ranges of 7 single power quality disturbances and 17 power quality composite disturbances are given. The basic frequencies of the disturbance models studied are 50 Hz. The 17 power quality composite disturbances include: (1) 12 kinds of dual disturbances, including harmonic + sag, harmonic + swell, harmonic + interrupt, harmonic + flicker, Impulsive Transient (IT) + sag, IT + voltage swell, IT + flicker, IT + harmonic, Oscillatory Transient (OT) + sag, OT + swell, OT + flicker, OT + harmonic; (2) Three kinds of triple disturbances, including harmonic + OT + sag, harmonic + OT + swell, harmonic + IT + flicker; (3) There are two kinds of quadruple disturbances, including harmonic + OT + sag + IT, IT + OT + swell + flicker. Parameters are randomly generated within a given range. The power quality disturbance signal model is shown in Table 1.

According to the above power quality disturbance signal model, Matlab 2018a is used to simulate the power quality signal, and the waveform is shown in Fig. 2.
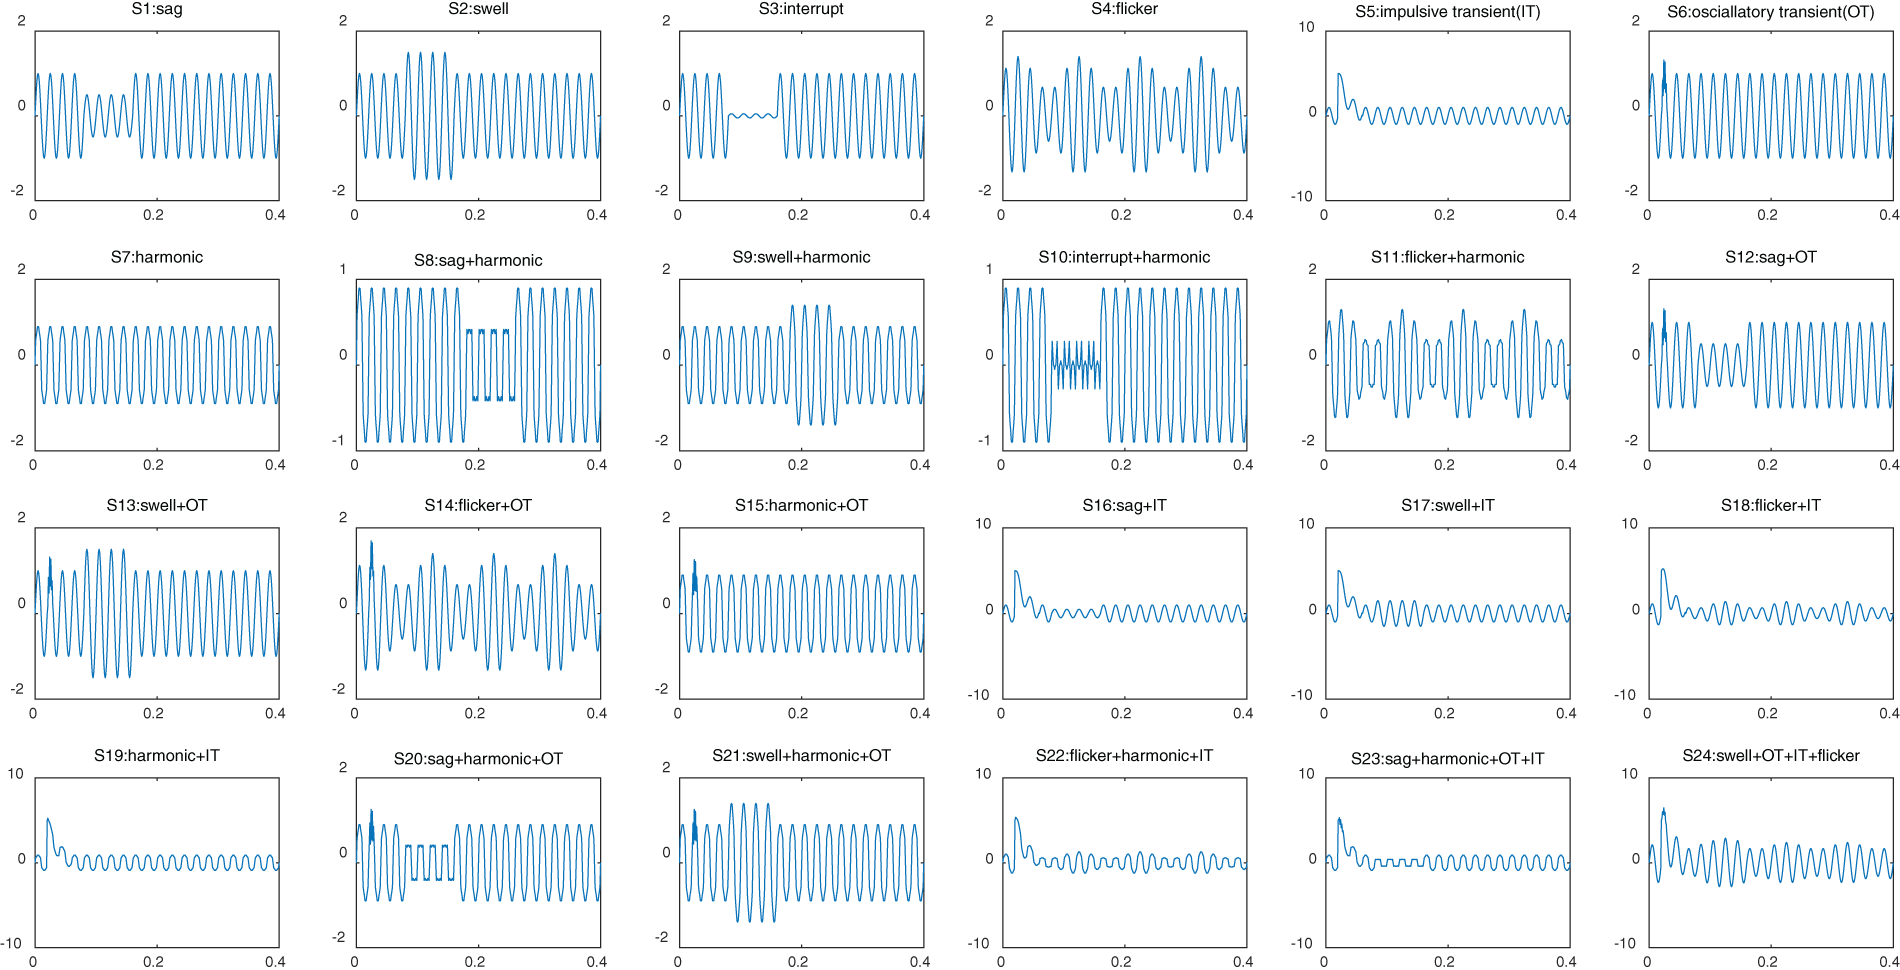
Figure 2: 24 power quality disturbance waveforms
3 Power Quality Disturbance Analysis and Feature Extraction
3.1 Principle of Multi-Resolution S-Transform
From the perspective of single disturbance, the characteristics of voltage sag, rise, interruption and flicker are mainly concentrated in the low-frequency part, and the fundamental frequency distortion characteristics are different; Harmonics are mainly concentrated in the intermediate frequency part; The oscillation is mainly concentrated in the high-frequency part. The composite disturbance has the characteristics of different disturbance types at the same time, which are reflected in different frequency domains. Therefore, features can be extracted from different frequency domains for disturbance recognition. Compared with other methods, feature extraction in frequency domain can obtain more targeted features through the multi-resolution characteristics of MST.
According to Heisenberg uncertainty principle, the time width and frequency width of the signal cannot tend to infinity at the same time, and for a specific given signal, the product of time width and frequency width is a constant. The misjudgment of voltage interruption signal as voltage sag signal in document [21] is caused by the insufficient time resolution of S-transform near the fundamental frequency. In order to overcome the defect of S-transformation, literature [31] introduced a single regulating factor λ Adjust the time-frequency resolution of S-transform. For transient disturbance signals such as voltage rise, fall or interruption in the low frequency band, a higher time resolution is required to identify such signals, and for harmonic disturbances in the high frequency band, a higher frequency resolution is required to identify them. However, the actual power quality disturbances are often multiple disturbances occurring at the same time, and the composite disturbances have the characteristics of different disturbance types at the same time, which are reflected in different frequency domains. Therefore, the time-frequency domain of the disturbance signal is divided into three different regions, and three different adjustment factors are introduced to change the time resolution and frequency resolution of the corresponding region.
The discrete form of MST is expressed as
where T is the sampling interval and N is the total number of sampling points. k, m and n are integers between 0 and N−1.
The corresponding relationship between n and λx can be estimated as [32]
where n represents the reserved frequency point obtained after threshold filtering, λx is the MST window width adjustment factor. Therefore, MST adaptively sets the window width adjustment factor of the high-frequency part, and judges whether the signal contains fundamental frequency disturbance (sag or interruption) through the fundamental frequency fast Fourier spectrum value
3.2 Feature Extraction of Disturbance Signal
From the perspective of disturbance analysis, low-frequency disturbance analysis includes signal amplitude change and start and end point positioning, which requires MST to have a higher time resolution; The analysis purpose of intermediate frequency disturbances such as harmonics is to determine whether the signal contains harmonic components, which requires higher frequency domain resolution; High frequency features are used to identify oscillations and compound disturbances with oscillations, and the influence of high-frequency energy and noise of other types of disturbance signals should be avoided. Therefore, the setting values of window width adjustment factors in different frequency domains need to be introduced, respectively.
Power quality disturbances can be mainly divided into instantaneous disturbances and steady-state disturbances. Instantaneous disturbances refer to unexpected changes in the amplitude characteristics of disturbance signals, such as voltage sag, voltage sag and voltage interruption, while steady-state disturbances represent significant degradation of the components of disturbance signals, such as voltage flicker and harmonics. Specifically, the characteristics of flicker interference are always included in the low frequency, while the characteristics of sag, surge and interruption signal can be reflected by the fundamental frequency content (50 or 60 Hz). In addition, when analyzing frequency components from 100 to 700 Hz and above 700 Hz, harmonic and transient interference should be detected respectively.
Time frequency analysis of power quality signals the two-dimensional matrix of MST contains a large amount of signal time-frequency information, and the characteristics of each power quality signal should be reflected by its energy and frequency characteristics. In order to effectively extract the time-frequency information of the signal, the following five features are extracted according to the distribution characteristics of power quality disturbances in the time-frequency domain:
Feature 1: minimum amplitude of fundamental frequency component
Feature 2: maximum amplitude of fundamental frequency component
where R(m) and R0 refer to the average value of PQ interference and fundamental frequency content of standard signal. Specifically, R(m) can be obtained in the following ways, where the expression of J(t) is
where J(tm) represents the time position tm The fundamental frequency curve around m, while in this study, N is set to 50. Smst (t, f) is the time-frequency matrix of MST.
Features 1 and 2 describe the evolution trend of the fundamental frequency component. The energy distribution of power quality signal shows obvious expansion and depression trends, which can accurately describe the characteristics of power quality signal.
Feature 3: correlation coefficient of fundamental frequency component, periodic fluctuation mode is an important feature for detecting flicker events. In addition, scintillation events with different amplitude ranges have similar characteristic fluctuation characteristics. Therefore, flicker events should be effectively identified by checking whether there are obvious periodic fluctuations. On this basis, the correlation coefficient between the scintillation event and the fundamental frequency component is defined as feature 3, and the expression is as follows:
where, J(t) and J0(t) represent the fundamental frequency components of the analysis signal and flicker interference, respectively.
Feature 4: energy of row vector corresponding to frequency f
Feature 5: root mean square of row vector corresponding to frequency f
where t is the sampling point, and N is the number of sampling points of the interference signal.
The time-frequency diagram of the composite disturbance waveform formed by the superposition of two different kinds of disturbances after multi-resolution S-transform can accurately distinguish the transient component and the steady-state component at the same time, and can visually see the amplitude changes of the disturbance signal in time domain and frequency domain. Taking ten typical PQDS as examples, the time-frequency three-dimensional view of the results obtained by using MST fast algorithm is shown in Fig. 3.

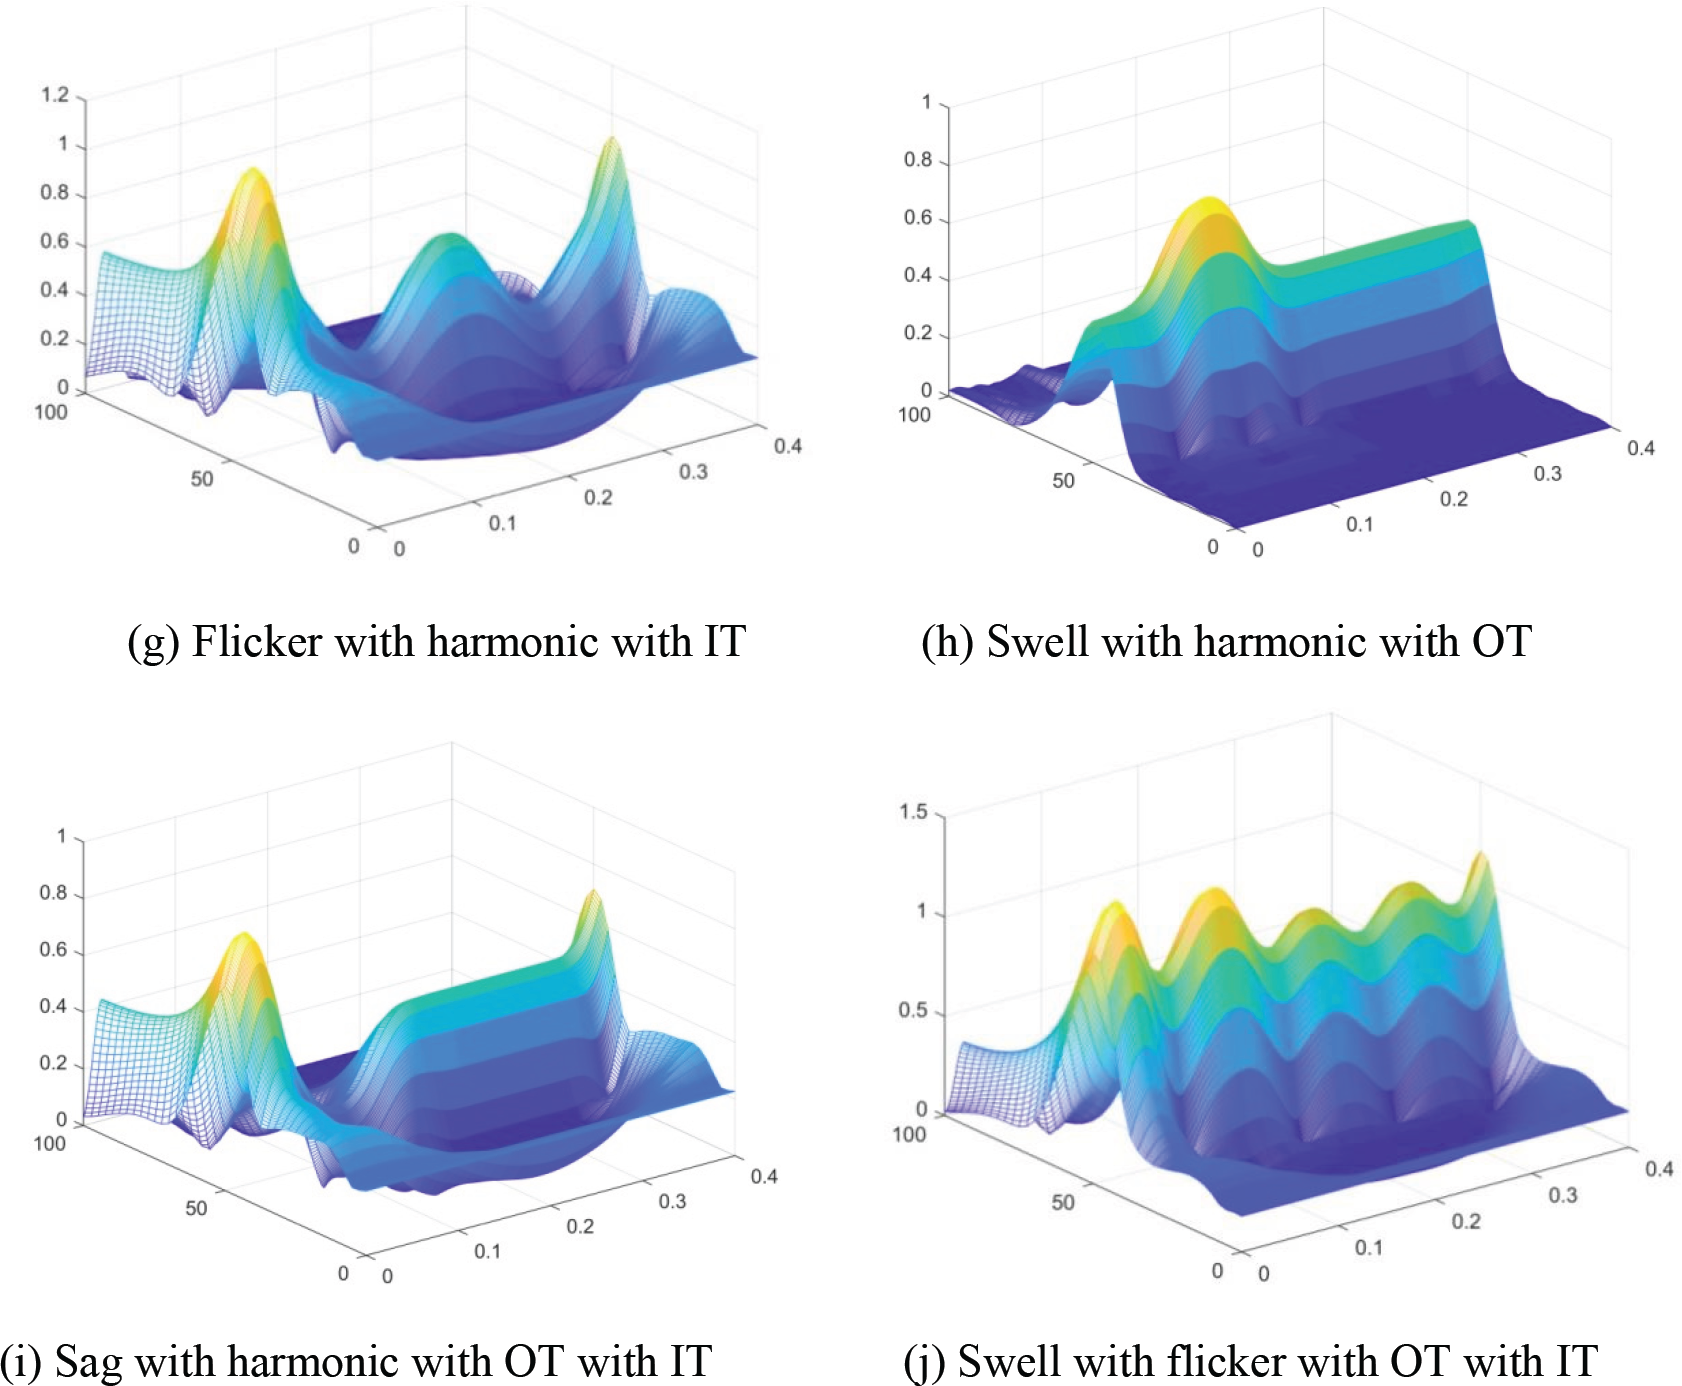
Figure 3: Time-frequency three-dimensional view of composite disturbance MST
In Fig. 3, the characteristics of various power quality disturbance signals can be extracted from the time-frequency matrix of the result of the signal MST fast algorithm. Specifically, the amplitude of time-domain characteristic curve of voltage sag and voltage interruption decreases first and then increases with time; The change trend of voltage transient rise is just the opposite, that is, the amplitude of time-domain characteristic curve of the signal rises first and then decreases; The amplitude of time domain characteristic curve of flicker fluctuates up and down; With the increase of frequency, some spikes can be seen in the frequency domain characteristic curves of fundamental wave and higher harmonic.
4 Power Quality Disturbance Identification Method
In order to identify power quality events such as voltage sag, voltage sag, voltage interruption, voltage flicker, voltage harmonics, voltage sag with harmonics, voltage sag with harmonics and voltage interruption with harmonics, five disturbance time-frequency characteristics are extracted through multi-resolution S-transform time-frequency domain analysis. In addition, three classification methods are studied to identify power quality composite disturbance signals. These classifiers are k-nearest neighbor algorithm (KNN), support vector machine algorithm (SVM) and decision tree algorithm (DT).
K-nearest neighbor (KNN) algorithm is one of the simplest methods in data mining classification technology, and has been widely used in many fields. The core idea of KNN algorithm is that if most of the k nearest samples in the feature space belong to a certain category, the sample also belongs to this category and has the characteristics of samples in this category. In determining the classification decision, this method only determines the category of the samples to be divided according to the category of the nearest one or several samples. KNN algorithm is only related to a very small number of adjacent samples in class decision-making. KNN algorithm assigns space to the nearest neighbor training data to classify the new test data and identify single and complex interference [33]. The algorithm is based on Euclidean distance. The formula of Euclidean distance is as follows:
Parameter Dj(Xi, Yj) is the dependence based on Euclidean distance between the ith p-dimensional input eigenvector Xi and the jth p-dimensional eigenvector Yj in the training set [23]. KNN algorithm classifies the new input vector (Xi) into classes with minimum K similarity parameters among all members. As the number of symbols increases, the accuracy of the traditional KNN algorithm based on Euclidean distance decreases. Therefore, in order to improve the accuracy of KNN classification, the weighted KNN classification method is very useful. The main advantages of this method are as follows: this method is easy to understand and implement, can deal with electrical measurement with oscillation trend, and can be realized in real time. In addition, KNN algorithm is easy to deal with multi class data sets, and the nonparametric nature of KNN provides advantages in some cases where data is very unusual.
4.2 Support Vector Machine Algorithm
Support vector machine (SVM) is a data mining method based on statistical learning theory, which can successfully deal with many problems such as regression problems (time series analysis) and pattern recognition (classification problems, discriminant analysis) [34]. The mechanism of SVM is to find an optimal classification hyperplane that meets the classification requirements, so that the hyperplane can maximize the blank area on both sides of the hyperplane while ensuring the classification accuracy. In theory, support vector machine can achieve the optimal classification of linearly separable data. The distance between these hyperplanes and the nearest samples of each class is equal, resulting in a large margin on each side. The data located on these edge ridges identifies the hyperplane and is named support vector.
In order to find the location of the separation hyperplane, the following data sets must be considered:
where w is an n-dimensional vector pointing to the hyperplane, and the b parameter is a scalar. The hyperplane is located based on w and b, so it satisfies
The construction idea of decision tree (DT) is as follows: if all the samples in the training sample set are of the same kind, they will be regarded as Leaf nodes; otherwise, according to certain branch division rules, the sample set will be subdivided successively until Leaf nodes. For the same sample set, many decision trees can be generated, and branching rule is crucial to obtain an “optimal” tree [24] Two methods are commonly used, such as Gain ratio standard and Gini index.
Gain ratio:
Gini index:
The input data to a decision tree algorithm is a data set that includes symbols and the data entered with their symbolic values. Based on this problem, the decision tree classifier can induce a set of data, which is represented as a tree by distribution. In addition, when generating decision trees, only symbols that are sufficiently dependent on the classification problem are selected. When learning a decision tree, the tree is used to predict new sample results. In addition, the decision tree learning algorithm is called supervised learning method, and each sample in the dataset is classified according to a specific category [26].
Decision tree (DT) classification is based on decision rules, so binary tree graphs are used to discover correlations between input and output components. The decision tree consists of internal nodes, branches, and terminal nodes. Internal nodes display tests on symbols, branches represent test results, and terminal nodes define class labels. At each node, decisions are made based on the rules obtained from the data. Decision tree learning is a predictive model that describes the observations of a project to arrive at a target number for the project. The method is also used in data mining, machine learning and statistics. Compared with other classification methods, decision tree is relatively fast and more accurate.
4.4 Identification of Disturbance Signal
Fig. 4 shows the principle framework of power quality composite disturbance classification. Firstly, according to the IEEE-1459 power quality disturbance standard [20], 24 kinds of disturbances were generated by simulation, including 7 kinds of single disturbances and 17 kinds of composite disturbances. Then, for the power quality disturbance waveform dataset generated in batches, using MST time-frequency domain analysis, five kinds of disturbance time-frequency domain features are extracted to quantitatively reflect the characteristics of the analyzed power quality disturbance signals. The feature sample set was randomly selected and divided into two parts, 70% of which was used as the training set and the remaining 30% as the test set. Secondly, the extracted feature vectors are read into the classifier in the form of matrix, and the 70% feature vector training set is trained by SVM classifier, DT classifier and KNN classifier respectively to construct the classification model. Finally, for the remaining 30% sample set of feature vectors, the three classifiers obtained by the above training are used successively to identify the disturbance signals.
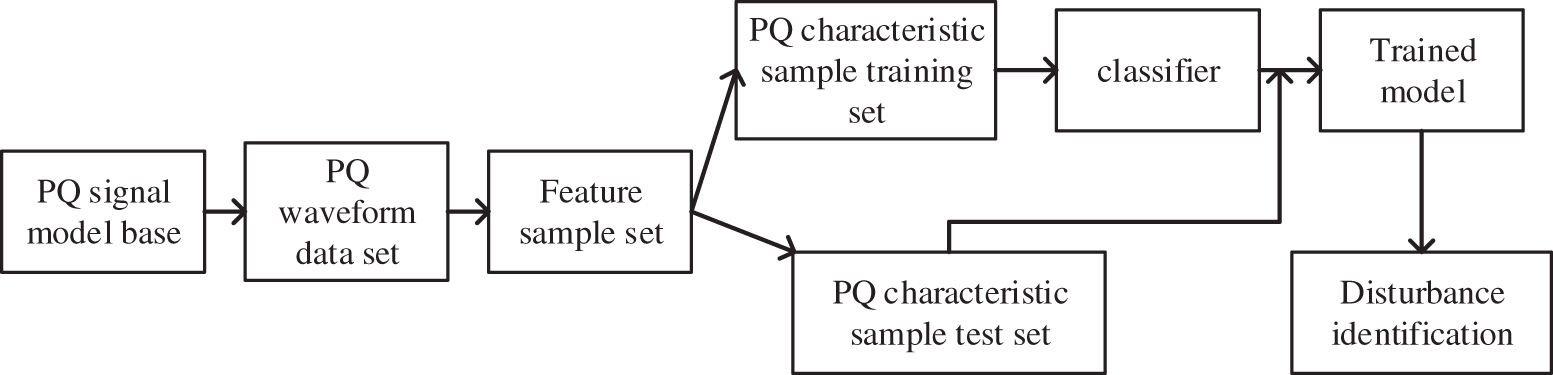
Figure 4: Principle framework of power quality composite disturbance classification
In addition, when constructing the training set and test set of disturbance recognition, the whole feature sample set of disturbance recognition was randomly divided into two independent parts with a ratio of 70% to 30%. In this way, random extraction and random validation can ensure that the model trained on the training dataset does not underfit. Due to the relative independence of the validation set and the training set, overfitting of the model to the training data can be avoided to a certain extent. Compared with other two algorithms, the results show that DT algorithm can accurately and quickly classify and identify power quality disturbance signals.
According to IEEE-1459 standard and literature, 24 power quality disturbance databases are automatically generated by using MATLAB 2018a software. The database contains 7 single disturbances and 17 composite disturbances. The sampling frequency of the research signal is 3.2 kHz and the sampling time is 0.4 s. During the simulation, the setting parameters of the disturbance signal are randomly generated within the required range.
Figs. 5–7 summarize the results of power quality disturbance detection and identification through three classification algorithms. Diagonal elements of confusion matrix are the correct classification of PQD, and non diagonal elements are the wrong classification of PQD. From the confusion matrix, it can be seen that most categories are correctly classified, the accuracy of single disturbance classification is high, and the accuracy of mixed disturbance classification is relatively low, especially S16 (transient pulse + voltage sag), S17 (transient pulse + voltage rise), S18 (transient pulse + voltage flicker), S23 (harmonic + transient oscillation + voltage sag + transient pulse) reflect that it is difficult to classify composite disturbances related to transient pulses.

Figure 5: Power quality event detection confusion matrix based on SVM classifier
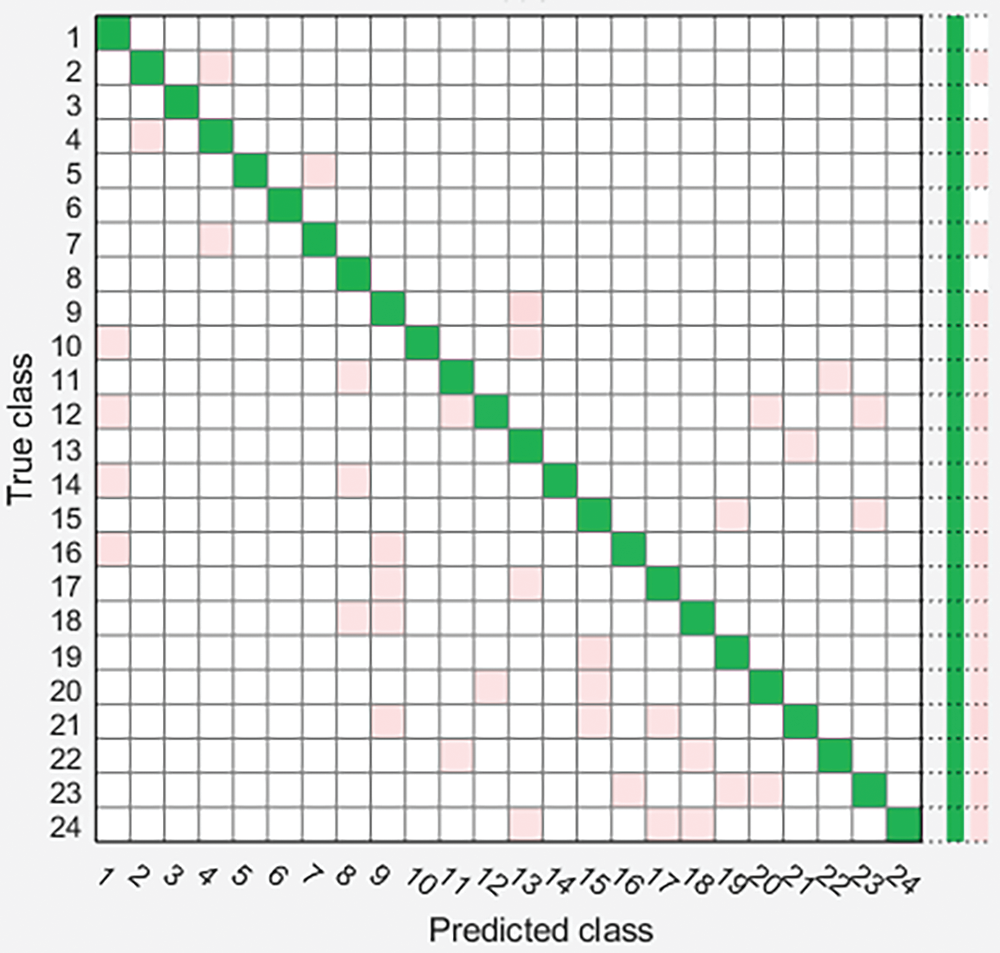
Figure 6: Power quality event detection confusion matrix based on DT classifier
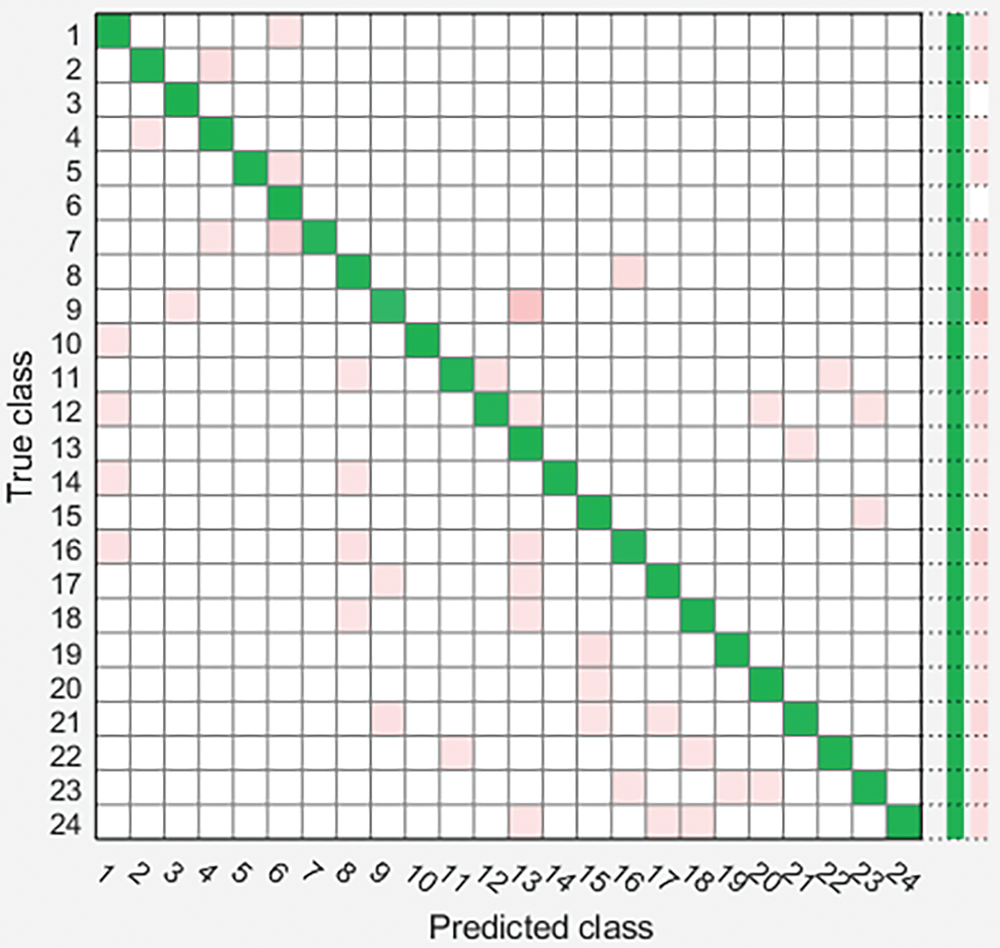
Figure 7: Power quality disturbance detection confusion matrix based on KNN classifier
Fig. 5 classifies PQD using support vector machine classifier. Its confusion matrix shows that most disturbances are incorrectly classified as voltage sag, harmonic, pulse + voltage sag, transient pulse + voltage sag and harmonic + transient oscillation + voltage sag, with an overall accuracy of 95.9%. Fig. 6 uses decision tree classifier to classify PQD. The overall accuracy of DT classifier is 97.5%. Fig. 7 uses KNN classifier to classify PQD. The overall accuracy of KNN classifier is 96.6%, showing medium performance in automatic classification of PQ interference. In addition, compared with the other two classifiers, the decision tree classifier is more accurate and has higher performance in detecting and identifying PQ interference. The comparison of different PQ interference detection methods is summarized in Table 2 below.

It can be seen from Table 2 that the results of MST and decision tree classifiers are compared with other methods in the existing literature. Literature [20] used S-transform for detection and probabilistic neural network classifier to extract 11 PQDS features using 4 feature statistics, with an accuracy of 94.70%. Literature [28] used MST for detection, decision tree for classification, and 5 feature statistics to extract 16 PQDS features, with an accuracy of 99.97%. Literature [24] used S-transformation for detection, chaos integrated decision tree for classification, and 9 feature statistics to extract 23 PQDS features, with an accuracy of 91.9%. In this paper, GST transform is used for detection, and five feature statistics are used to extract the characteristics of the composite disturbance signal, which reduces the amount of calculation and the calculation cost is relatively small compared with the literature [24]. Compared with literature [28], more composite disturbance signals are detected by using the same characteristic statistics. Therefore, in terms of overall performance, the method proposed in this paper has better comprehensive performance.
In this paper, a method for identifying power quality composite disturbances based on MST and DT is proposed. The 24 power quality disturbance signal models and their waveforms were analyzed in the time-frequency domain (MST). According to the characteristics of different types of disturbances, five kinds of disturbance features were extracted. KNN, SVM and DT classifiers were used to effectively identify complex power quality composite disturbances. The following conclusions are obtained:
(1) Compared with the traditional S-transform, MST only needs to extract 5 feature statistics, which is less than most other popular methods, and the calculation cost is relatively small.
(2) Three classifiers are used for testing, and it is found that the DT algorithm has the highest accuracy (97.5%). In conclusion, the proposed method can effectively identify power quality disturbances, especially for power quality composite disturbances.
(3) The characteristics of the composite disturbances with transient pulse power quality are strongly correlated, and the identification error rate of the related composite disturbances is high, and the identification difficulty is great. The design optimization of the related features still needs to be further studied in the future.
Acknowledgement: This work was financially supported by National Natural Science Foundation of China (No. 52067013); the Key Natural Science Fund Project of Gansu Provincial Department of Science and Technology (No. 21JR7RA280); the Tianyou Innovation Team Science Foundation of Intelligent Power supply and State Perception for Rail Transit (No. TY202010); and the Natural Science Foundation of Gansu Province (No. 20JR5RA395).
Funding Statement: The National Natural Science Foundation of China (No. 52067013); the Key Natural Science Fund Project of Gansu Provincial Department of Science and Technology (No. 21JR7RA280); the Tianyou Innovation Team Science Foundation of Intelligent Power Supply and State Perception for Rail Transit (No. TY202010); and the Natural Science Foundation of Gansu Province (No. 20JR5RA395).
Conflicts of Interest: The authors declare that they have no conflicts of interest to report regarding the present study.
References
1. Yu, Q., Chen, X., Li, X., Zhou, C., Li, Z. (2022). Using grey target theory for power quality evaluation based on power quality monitoring data. Energy Engineering, 119(1), 359–369. DOI 10.32604/EE.2022.015397. [Google Scholar] [CrossRef]
2. Nantian, H., Hua, P., Guowei, C. (2017). Feature selection and optimal decision tree construction of complex power quality disturbances. Proceedings of the CSEE, 37(3), 776–785. [Google Scholar]
3. Wang, F., Quan, X. Q., Ren, L. T. (2021). Summary of research on power quality disturbance detection and identification methods. Chinese Journal of Electrical Engineering, 41(12), 4104–4121. [Google Scholar]
4. Barros, J., Diego, R. I. (2006). A new method for measurement of harmonic groups in power systems using wavelet analysis in the IEC standard framework. Electric Power Systems Research, 76(4), 200–208. DOI 10.1016/j.epsr.2005.06.004. [Google Scholar] [CrossRef]
5. Karasu, S., Saraç, Z. (2019). Investigation of power quality disturbances by using 2D discrete orthonormal S-transform, machine learning and multi-objective evolutionary algorithms. Swarm and Evolutionary Computation, 44(8), 1060–1072. DOI 10.1016/j.swevo.2018.11.002. [Google Scholar] [CrossRef]
6. Karasu, S., Saraç, Z. (2022). The effects on classifier performance of 2D discrete wavelet transform analysis and whale optimization algorithm for recognition of power quality disturbances. Cognitive Systems Research, 75, 1–15. [Google Scholar]
7. Kumar, R., Bansal, H. O. (2019). Hardware in the loop implementation of wavelet based strategy in shunt active power filter to mitigate power quality issues. Electric Power Systems Research, 169, 92–104. DOI 10.1016/j.epsr.2019.01.001. [Google Scholar] [CrossRef]
8. Forghani, M., Afsharnia, S. (2006). Online wavelet transform-based control strategy for UPQC control system. IEEE Transactions on Power Delivery, 22(1), 481–491. DOI 10.1109/TPWRD.2006.883026. [Google Scholar] [CrossRef]
9. Sahani, M., Dash, P. K. (2019). FPGA-based online power quality disturbances monitoring using reduced-sample HHT and class-specific weighted RVFLN. IEEE Transactions on Industrial Informatics, 15(8), 4614–4623. DOI 10.1109/TII.2019.2892873. [Google Scholar] [CrossRef]
10. Swarnkar, N. K., Mahela, O. P., Khan, B., Lalwani, M. (2022). Identification and classification of multiple power quality disturbances using a parallel algorithm and decision rules. Energy Engineering, 119(2), 473–497. DOI 10.32604/ee.2022.017703. [Google Scholar] [CrossRef]
11. Yang, J. F., Jiang, S., Shi, G. G. (2019). Classification of composite power quality disturbances based on piecewise-modified S transform. Power System Protection and Control, 47(9), 64–71. [Google Scholar]
12. Xu, L. W., Li, K. C., Luo, Y. (2019). Classification of complex power quality disturbances based on incomplete S-transform and gradient boosting decision tree. Power System Protection and Control, 47(6), 24–31. [Google Scholar]
13. Yang, H., Liu, S., Xiao, X. (2006). Classification of voltage dips using time-frequency contour and amplitude envelope vectors by S-transform. Transactions of China Electro Technical Society, 21(8), 75–79. [Google Scholar]
14. Qu, H. Z., Li, X. M., Chen, C. (2018). Classification of power quality disturbances using convolution neural network. Engineering Journal of Wuhan University, 51(6), 534–539. DOI 10.14188/j.1671-8844.2018-06-011. [Google Scholar] [CrossRef]
15. Xue, Z. G., Huang, C. R., Zhang, J. D., Zhi, H., Gu, F. (2020). Classification of power quality disturbances based on wavelet transform and limit learning machine. Electrical Technology, 15, 41–43. DOI 10.19768/j.cnki.dgjs.2020.15.011. [Google Scholar] [CrossRef]
16. Yang, X. M., Guo, L. M., Xiao, X. Y., Zhang, J. (2020). Composite disturbance classification of power quality based on adjustable quality factor wavelet transform and random forest feature selection algorithm. Power Grid Technology, 44(8), 3014–3020. DOI 10.13335/j.1000-3673.pst.2019.1569. [Google Scholar] [CrossRef]
17. Naik, C. A., Kundu, P. (2014). Power quality disturbance classification employing S-transform and three-module artificial neural network. International Transactions on Electrical Energy Systems, 24(9), 1301–1322. DOI 10.1002/etep.1778. [Google Scholar] [CrossRef]
18. He, J. L., Wang, G. P., Liu, D. (2017). Localization and identification of power quality disturbance in distribution network system based on lifting wavelet and improved BP neural network. Power System Protection and Control, 45(10), 69–76. [Google Scholar]
19. Chen, X., Li, K., Xiao, J., Meng, Q., Cai, D. (2017). A method of real-time power quality disturbance classification. Transactions of China Electrotechnical Society, 32(3), 45–55. DOI 10.19595/j.cnki.1000-6753.tces.2017.03.006. [Google Scholar] [CrossRef]
20. Wang, H. H., Wang, P., Liu, T. (2017). Power quality disturbance classification using the S-transform and probabilistic neural network. Energies, 10(1), 107. DOI 10.3390/en10010107. [Google Scholar] [CrossRef]
21. Karasu, S., Saraç, Z. (2020). Classification of power quality disturbances by 2D-Riesz transform, multi-objective grey wolf optimizer and machine learning methods. Digital Signal Processing, 101(4), 102711. DOI 10.1016/j.dsp.2020.102711. [Google Scholar] [CrossRef]
22. Akbarpour, A., Nafar, M., Simab, M. (2022). Multiple power quality disturbances detection and classification with fluctuations of amplitude and decision tree algorithm. Electrical Engineering, 104(4), 2333–2343. DOI 10.1007/s00202-021-01481-5. [Google Scholar] [CrossRef]
23. Li, Z. M., Lü, G. Y., Chen, N., Pei, Z. Y., Ding, Y. H. et al. (2021). Identification of power quality composite disturbances based on chaotic integrated decision tree. Power System Protection and Control, 49(21), 18–27. DOI 10.19783/j.cnki.pspc.211072. [Google Scholar] [CrossRef]
24. Hawryluk, M., Wilk-Kołodziejczyk, D., Regulski, K., Głowacki, M. (2019). Development of an approximation model of selected properties of model materials used for simulations of bulk metal plastic forming processes using induction of decision trees. Archives of Metallurgy and Materials, 1073–1085. DOI 10.24425/amm.2019.129497. [Google Scholar] [CrossRef]
25. Huang, N. T., Wang, D., Lin, L., Cai, G. W., Huang, G. L. et al. (2019). Power quality disturbances classification using rotation forest and multi-resolution fast S-transform with data compression in time domain. IET Generation, Transmission & Distribution, 13(22), 5091–5101. DOI 10.1049/iet-gtd.2018.5439. [Google Scholar] [CrossRef]
26. Li, J. M., Lin, H. J., Liang, C. B., Teng, Z. S., Cheng, D. (2019). Power quality disturbance detection method based on dual resolution S-transform and learning vector quantization neural network. Acta Electrotechnics, 34(16), 3453–3463. DOI 10.19595/j.cnki.1000-6753.tces.180900. [Google Scholar] [CrossRef]
27. Zhong, T., Zhong, S., Cai, G., Li, Y., Yang, B. et al. (2019). Power quality disturbance recognition based on multiresolution S-transform and decision tree. IEEE Access, 7, 88380–88392. DOI 10.1109/ACCESS.2019.2924918. [Google Scholar] [CrossRef]
28. Huang, C. J., Zhou, T. (2018). A new method for power quality disturbance detection based on variational modal decomposition. Power Automation Equipment, 38(3), 116–123. DOI 10.16081/j.issn.1006-6047.2018.03.016. [Google Scholar] [CrossRef]
29. Ren, Z. H., Wang, B. L. (2014). Voltage flicker detection based on multi-resolution S-transform. Power Automation Equipment, 34(1), 27–31. [Google Scholar]
30. Hu, Z. C. (2021). Research on power quality disturbance identification method based on high time-frequency generalized S-transform and IGWO-SVM (Master Thesis). Hefei University of Technology, China. [Google Scholar]
31. Huang, N. T., Zhang, W. H., Xu, D. G., Cai, G. W., Liu, C. et al. (2015). Power quality disturbance identification using multi-resolution generalized S-transform. Journal of Harbin Institute of Technology, 47(9), 51–56. [Google Scholar]
32. Xiao, Y., Zhao, Y., Tu, Z. D., Q. B., Chang, R. M. (2019). Topology verification method of low voltage distribution network based on improved Pearson correlation coefficient. Power System Protection and Control, 47(11), 37–43. DOI 10.19783/j.cnki.pspc.180912. [Google Scholar] [CrossRef]
33. Ding, S. F., Q, B., T, H. Y. (2011). Overview of support vector machine theory and algorithm research. Journal of University of Electronic Science and Technology, 40(1), 2–10. [Google Scholar]
34. Wu, Y. P., Tao, G. Q. (2022). Application of a new loss function-based support vector machine algorithm in quality control of measurement observation data. Mathematical Problems in Engineering, 2022, 7266719. DOI 10.1155/2022/7266719. [Google Scholar] [CrossRef]
Cite This Article
 Copyright © 2023 The Author(s). Published by Tech Science Press.
This work is licensed under a Creative Commons Attribution 4.0 International License , which permits unrestricted use, distribution, and reproduction in any medium, provided the original work is properly cited.
 Downloads
 Citation Tools