
 Submit a Paper
 Propose a Special lssue
 Open Access
ARTICLE

Research on Multi-Objective Optimization Model of Industrial Microgrid Considering Demand Response Technology and User Satisfaction
1
Dongguan Power Supply Bureau, Dongguan, 523000, China
2
Guangdong Electric Power Design and Research Institute, Guangzhou, 510000, China
* Corresponding Author: Junhui Li. Email:
Energy Engineering 2023, 120(4), 869-884. https://doi.org/10.32604/ee.2023.021320
Received 07 January 2022; Accepted 22 June 2022; Issue published 13 February 2023
 View Full Text
 Download PDF
Abstract
In the process of wind power, coal power, and energy storage equipment participating in the operation of industrial microgrids, the stable operation of wind-storage industrial microgrids is guaranteed by considering demand response technology and user satisfaction. This paper firstly sorts out the status quo of microgrid operation optimization, and determines the main requirements for user satisfaction considering three types of load characteristics, demand response technology, power consumption benefit loss, user balance power purchase price and wind power consumption evaluation indicators in the system. Secondly, the operation architecture of the windstorage industrial microgrid is designed, and the multi-objective optimization model of the wind-storage industrial microgrid is established with the comprehensive operating cost and user satisfaction as the target variables, and the corresponding solution method is mentioned. Finally, a typical wind-storage industrial microgrid is selected for simulation analysis, and the results show that, (1) Considering the demand response technology, the comprehensive operating cost of the wind-storage industrial microgrid per day is 5292.63 yuan, the user satisfaction index is 0.953, and the wind power consumption rate reaches 100%. (2) By setting four scenarios, it highlights that the grid-connected operation mode is superior to the off-grid operation mode. Considering the demand response technology, the load curve can be optimized, and the time-of-use electricity price can be fully used to coordinate the operation of each unit, which enhances the wind power consumption capacity. The compromise solution of the system comprehensive operating cost and user satisfaction under the confidence level of 0.95 is obtained, namely (5343.22, 0.94). (3) The frontier curve shows that in the process of model solving, it is impossible to optimize any sub-objective by changing the control variables, which proves that there is a close relationship between the comprehensive operating cost of the system and the confidence level, which can provide effective guidance for the optimal operation of industrial microgrids.Keywords
Nomenclature
| PD-IM-MOPSP | particle swarm optimization with improved adaptive weight change |
| NSGA-II | improved non-dominated sorting genetic algorithm |
| e.g., | |
| the load level of the microgrid during the period | |
| the class I load which can be shifted | |
| the class II load which can be interrupted | |
| the class III load which can be fixed | |
| the operation and scheduling period of the industrial microgrid | |
| the weight coefficients of the sub-indexes | |
| the weight coefficients of the sub-indexes | |
| the weight coefficients of the sub-indexes | |
| the users’ power utility index | |
| the average power purchase price index | |
| the index of the wind-power consumption rate in the microgrid | |
| the objective function | |
| the operation cost of the thermal power units | |
| the operation cost of the equipment operation | |
| the operation cost of the environmental protection conversion costs | |
| the operation cost of the exchange-power cost-effective with external networks | |
| the depreciation cost of the energy storage equipment | |
| the operation and maintenance cost of the energy storage equipment | |
| the weight coefficients of the comprehensive operating cost | |
| the user satisfaction index | |
| the number of thermal power units | |
| the set of equipment requiring O&M | |
| the pollutant category, with a total of | |
| the conversion cost coefficient corresponding to the type-θ environment | |
| the amount of energy storage in the wind storage industrial microgrid | |
| the installation cost of the energy storage equipment |
As an important part of smart grid, microgrid can significantly improve the utilization rate of intermittent renewable energy such as wind power and photovoltaics, and alleviate the problems between energy consumption and environmental protection [1,2]. Various industrial users are one of the main load subjects of energy consumption and greenhouse gas emissions [3]. In the face of a variety of industrial users, by considering the access of wind power, photovoltaics, other distributed energy sources, and equipped with energy storage equipment of the corresponding capacity, the design of the industrial microgrid operation system can make full use of the idle space to promote renewable energy generation. The consumption of electricity can reduce the loss caused by power transmission, so as to improve the economy of industrial electricity [4]. At the same time, with the gradual establishment of the industrial microgrid operation system, the connection between the demand side and the supply side will be better and closer, and the dispatching strategy of various energy loads can be adjusted in real time through demand side management technology [5]. Therefore, taking the industrial microgrid as the research object, it is very important to arrange the power purchase plan and demand side management plan of the operating system.
At present, a lot of research has been done on the optimization of microgrid considering user satisfaction and demand response technology. According to the operating characteristics of different furniture loads in the household microgrid, Tang et al. [6] established a day-ahead optimal scheduling model with the goal of maximizing user satisfaction, which effectively guided the energy consumption behavior of various users. From the perspective of energy management, Lu et al. [7] established an optimization model aiming at user satisfaction and power generation side revenue, which improved the microgrid revenue and achieved user satisfaction. From the perspective of demand-side management, Chen et al. [8] introduced the user satisfaction index, which improved the user experience while ensuring the economy and reliability of the microgrid system. Zeng et al. [9] established a multi-objective optimization model for microgrid operation aiming at economy and load satisfaction, which effectively realized the maximum utilization of renewable energy and improved the efficiency of microgrid operation. In order to improve the user-side power satisfaction of wind-storage DC microgrids, Ma et al. [10] proposed a coordinated control strategy for microgrid considering reliability, comfort and economy. Guo et al. [11] aimed to maximize the user and satisfaction index, and established a multi-attribute demand response strategy for household microgrids based on satisfaction. Liu et al. [12] proposed a two-layer multi-objective optimal scheduling scheme for microgrid considering user satisfaction in order to solve large-scale access of electric vehicles. Yang et al. [13] considered supply-side economic benefits and demand-side electricity satisfaction, and established a multi-objective optimal scheduling of microgrids with the goal of minimizing the total operating cost and maximizing user satisfaction, and realized the benefits of maximizing supply and demand. Although the above research results have achieved certain research results on the optimization of microgrid operation, the impact on users is not considered when formulating the microgrid operation plan and demand side management plan. It is particularly important to consider how user satisfaction directly affects the social and economic benefits of system operation in the optimization of microgrid operation.
Many scholars have carried out research on the multi-objective optimization and dispatching of microgrids for new energy sources such as wind power and photovoltaics. The methods for solving multi-objective optimization problems can be roughly divided into two types, namely the objective normalization method based on specific weight values [14] and the Pareto optimal solution set method [15–17]. Yang et al. [14] transformed the multi-objective into a single-objective optimization model with the help of the decision analysis table, and applied the rough set theory to calculate the weight of the objective function. Ma et al. [15] used the bird flock algorithm to solve the multi-objective optimization problem to avoid the calculation process falling into the local optimal situation. Zhao et al. [16] solved the multi-objective optimization problem by adopting the multi-objective particle swarm optimization with improved adaptive weight change (PD-IM-MOPSP) dominated by Pareto correlation degree. Liu et al. [17] used a multi-objective genetic algorithm (NSGA-II) to solve the model, which ensured that the non-dominated solutions were more uniformly distributed in the target space and improved the diversity of the population. Although it can be seen from the above research that the objective normalization method is difficult to objectively determine the weight of each objective function of the microgrid, resulting in the inability to clarify the interrelationships between the objectives. The Pareto optimal solution set selects the optimal operation scheme of the microgrid from the non-inferior solutions, and solves the non-inferior solution set. However, in practice, the global and local search capabilities of the solution algorithm lack the synergy to the objective function.
Based on this, this paper takes the wind-storage industrial microgrid as the research object. Based on the operation plan, power purchase plan, and demand-side management technology of each unit in the system, and considering the comprehensive operating cost of the system and user satisfaction, a wind-storage industrial microgrid is established. Multi-objective optimization model of power grid, and a solution method for multi-objective optimization model is proposed. Finally, a typical wind-storage industrial microgrid demonstration project is selected for simulation analysis, which verifies the validity and rationality of the proposed model, which better fits the coordinated operation belt of wind-storage industrial microgrid considering demand response technology and user satisfaction the actual working conditions.
2 Demand Response Technology and User Satisfaction Metrics
2.1 Demand Response Technology
According to the load characteristics of industrial microgrids, the system load can be summarized in three types, as indicated by formula (1). Different automatic demand response strategies can be adopted for each type of load.
where
As for the translational load,
where
In terms of the interruptible load, it is assumed that power tension occurs at the time instance
Under the automatic demand response management technology, The corresponding load level of the industrial microgrid period is shown in formula (4).
In the formula,
2.2 User Satisfaction Indicators
The satisfaction of industrial microgrid users' operation is affected by three main factors, namely, the loss of electricity efficiency caused by demand-side management technology, the user's balanced electricity purchase price, and the level of wind power consumption. The definition of user satisfaction is shown in formula (5).
where
3 Optimized Operation of Wind-Energy Storage Industrial Microgrid
3.1 Network Structure of the Microgrid
The research object of this work is the industrial microgrid. As a typical wind-energy storage system, it is composed of distributed wind power systems, thermal power units, energy storage equipment, Industrial microgrid, in grid-connected operation mode or off-grid operation mode, can meet the energy demand of various industrial loads, which is shown in Fig. 1.
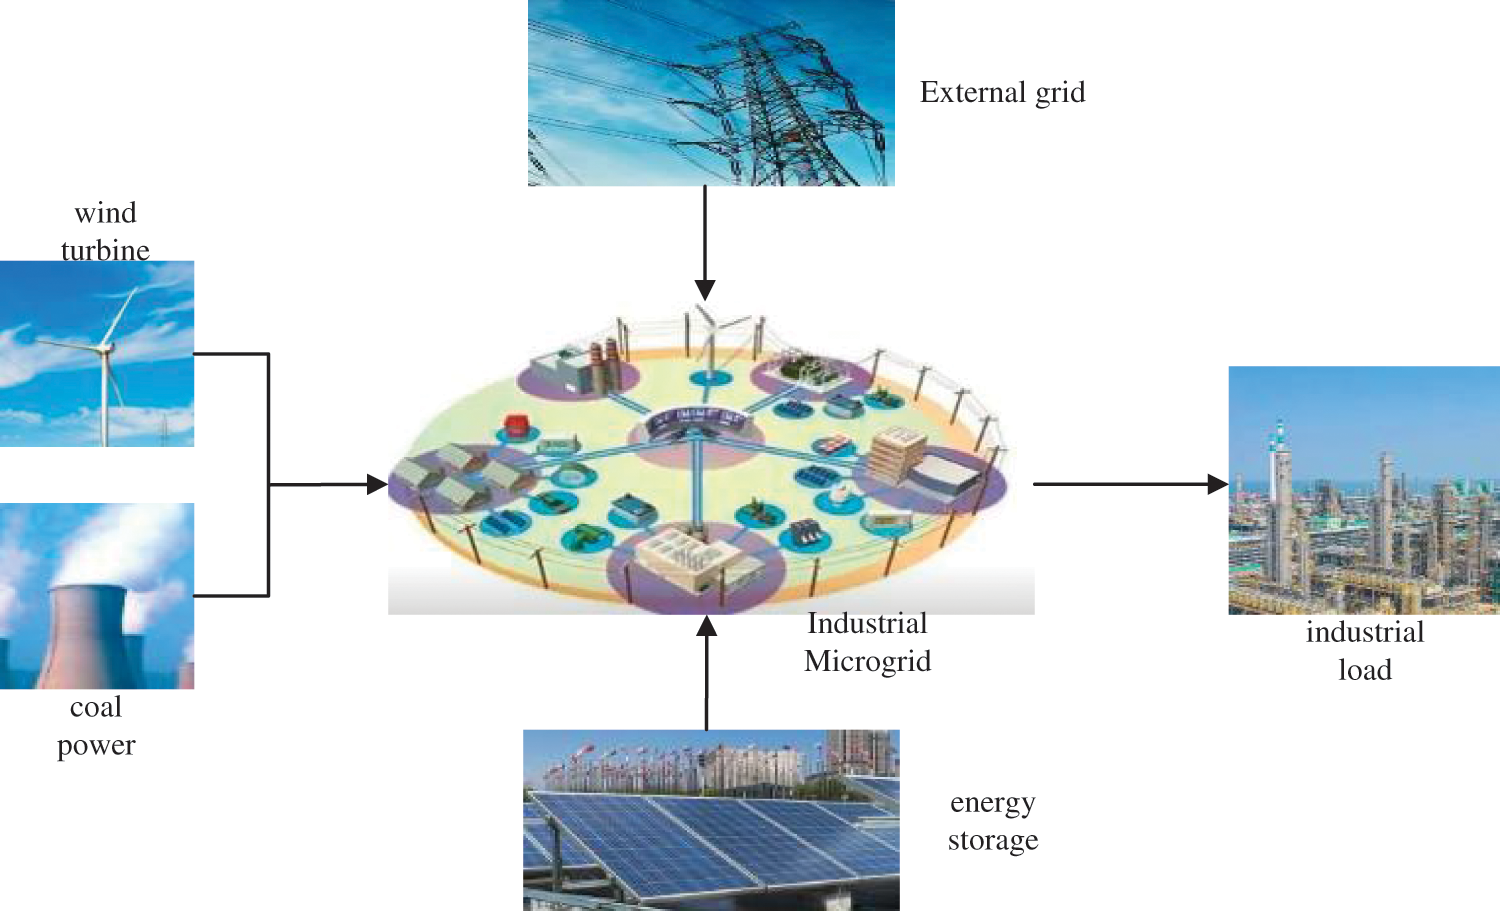
Figure 1: Simplified operation architecture diagram of industrial microgrid
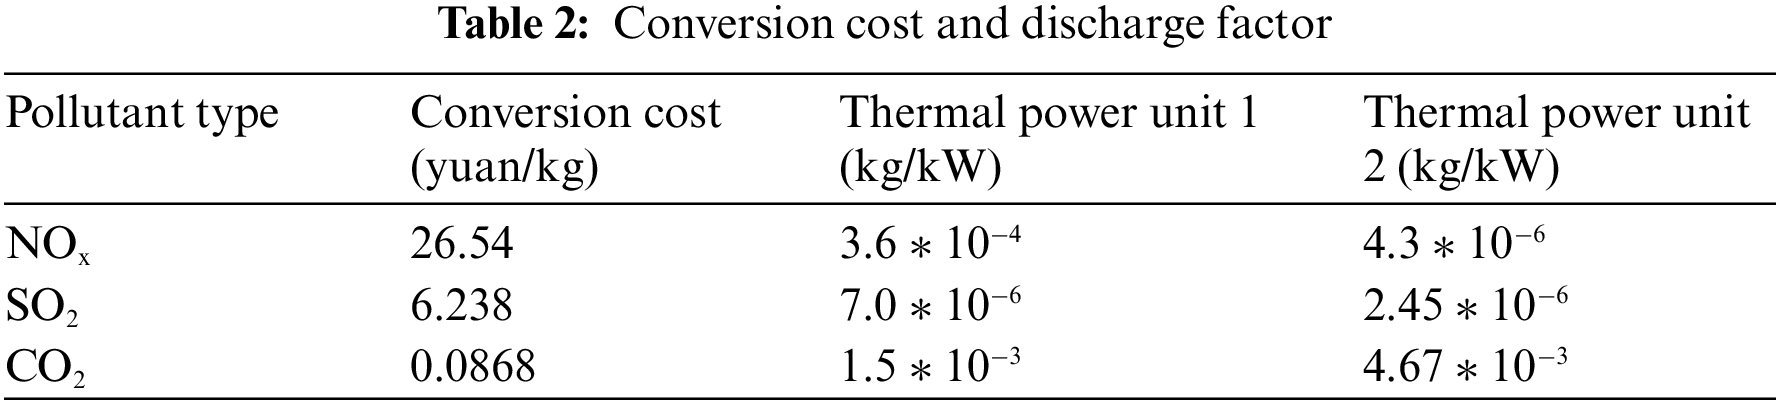
Based on the operation structure of wind-storage industrial microgrid, a multi-objective optimization model is established considering the two objective evaluation indicators of system comprehensive operation cost and user satisfaction. Among them, the comprehensive operating cost includes the operation cost of the thermal power units, the environmental conversion costs, the start-up and shutdown costs of the thermal power units, the fan operation, and maintenance costs, government wind power subsidy, and the battery cost. In another aspect, the objective function should include a weighed user satisfaction index, as shown in formula (9):
where
where
where
where
where
where
where
where
where
The following constraints are introduced for the wind storage industrial microgrid in operation:
(1) The system power balance constraint:
where
(2) Thermal power unit output constraint:
where
(3) Fan unit operation constraints. The constraint on abandoned power by the wind turbine is as follows:
(4) Start-stop constraints of the thermal power units [18]:
where
(5) Operation constraints of energy storage:
where
(6) The climbing constraints of the unit [19]:
where
3.4 Optimization Model Solution Method
The wind storage industrial microgrid optimization model established in this paper is a multi-objective problem. The improved non-inferior sorting multi-objective genetic algorithm (NSGA-II) adopts non-dominated sorting as the main mechanism and considers the degree of crowding, which ensures that the non-dominated solutions are better and uniformly distributed in the target space. NSGA-II can improve the diversity of the population, and at the same time, the elite retention strategy avoids the loss of excellent individuals [19]. Therefore, this paper adopts an improved non-inferior sorting multi-objective genetic algorithm (NSGA-II) with a fast and elite retention strategy to solve the model. After obtaining the Pareto solution set of wind storage industrial microgrid, the multi-objective algorithm is used to obtain the optimal. The optimal compromise solution is as follows:
In the formula,
The above objective functions are further weighted and averaged, and the obtained solutions are sorted to obtain the optimal compromise solution of the multi-objective functions of the wind-storage industrial microgrid, namely:
In the formula,
In order to verify the validity of the established model, this paper selects a typical wind storage industrial microgrid demonstration project, formulates the demand side management scheme and optimized operation plan of the system, and the operation structure follows Fig. 1. Wind storage industrial microgrid collects and manages all kinds of electric energy, with a 10 kV AC bus as the core. The system is equipped with a 1000 kWh energy storage capacity. The upper limit of charging and discharging power of the energy storage is 150 kW, and the charging and discharging efficiency factors

The installation capacity of the wind storage industrial microgrid is 300 KW. The wind power output curve and the load curve of the system in a typical operating day are shown in Fig. 2.
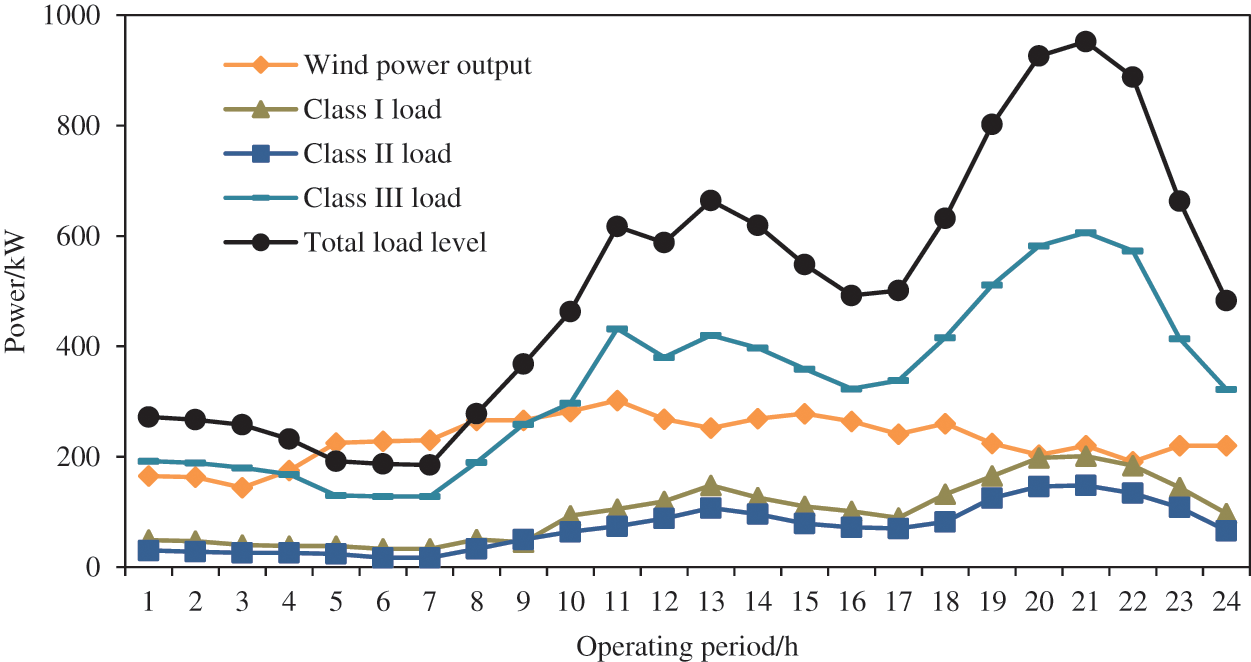
Figure 2: Wind power output and load level of the industrial microgrid
It can be learned from the figure that there are evident peak-valley characteristics for the load in the wind storage industrial microgrid, and the total load in each time period of a day is distributed in the peak period in the middle period and the end period respectively. The wind power output fluctuates significantly in each period of a day, but the output distribution is relatively uniform.
This paper adopts the improved non-inferior sorting multi-objective genetic algorithm (NSGA-II), the population size is set to 200, the crossover probability and mutation probability are 0.9 and 0.1, respectively, and the maximum number of iterations is 100. In addition, this paper uses Matlab R2014a for programming, applies the commercial solver CPLEX, and solves the model in the test environment of Intel Core i5-6200U, 8 G memory, and supports Windows 10 Professional Edition.
4.2 Results Comparison and Discussion Analysis
By running the model established in this paper, demand-side management schemes in each period can be obtained, as shown in Fig. 3. The figure shows the load translation scheme of class I load and the interruption scheme of class II load. In addition, the comprehensive operation plan of the system is shown in Fig. 4, which includes output plan for coal-fired power units 1 and 2, energy storage charging and discharging power plan. The start/stop characteristic plan of the thermal power unit is shown in Fig. 5.
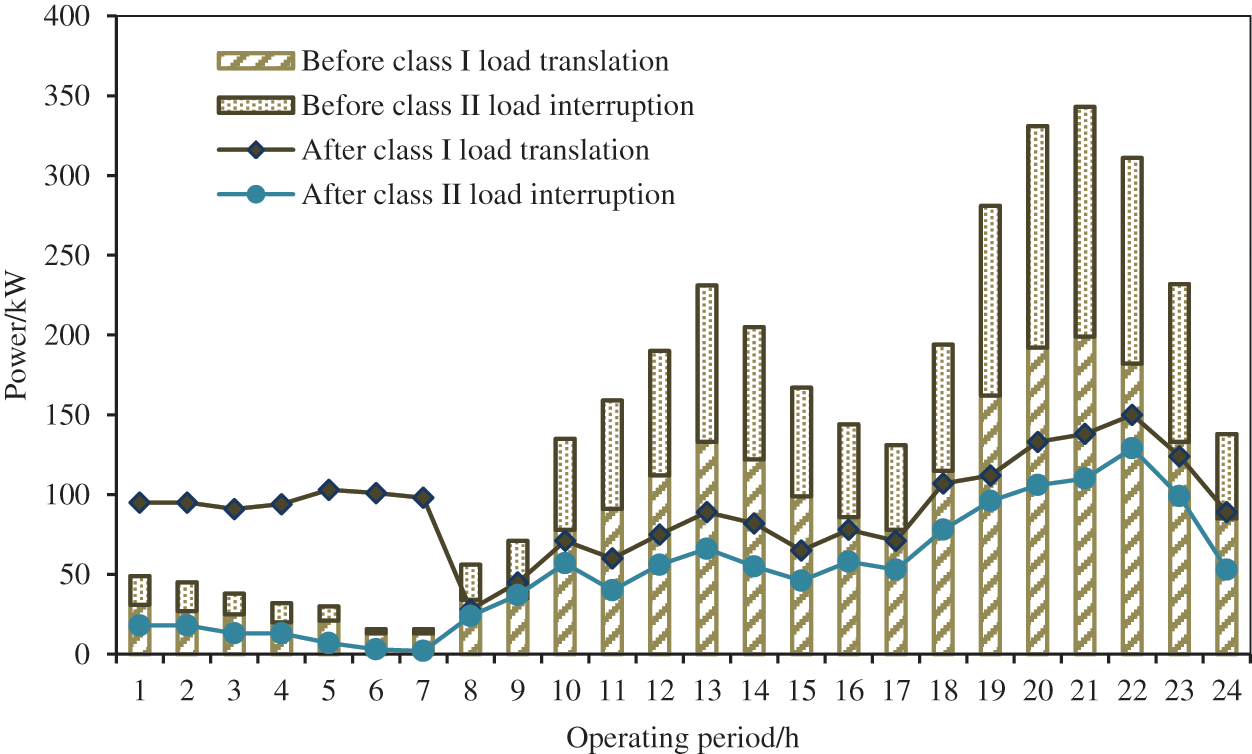
Figure 3: Demand-side management scheme for the industrial microgrid
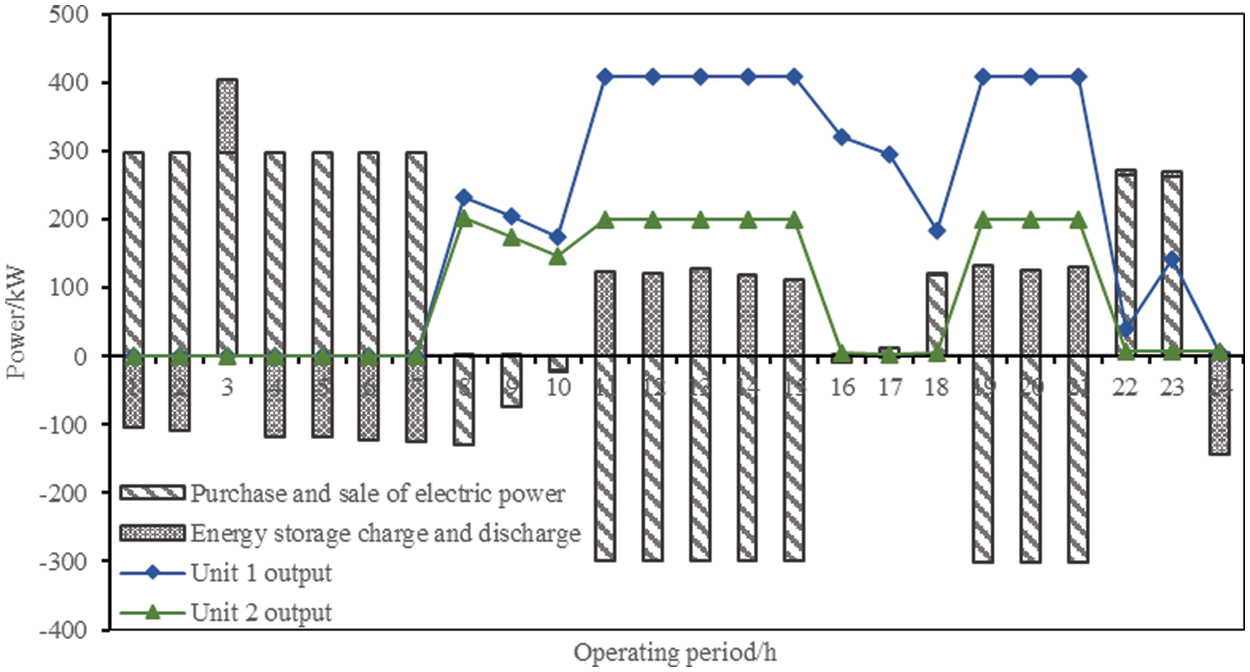
Figure 4: Optimal operation of industrial microgrid based on demand-side management
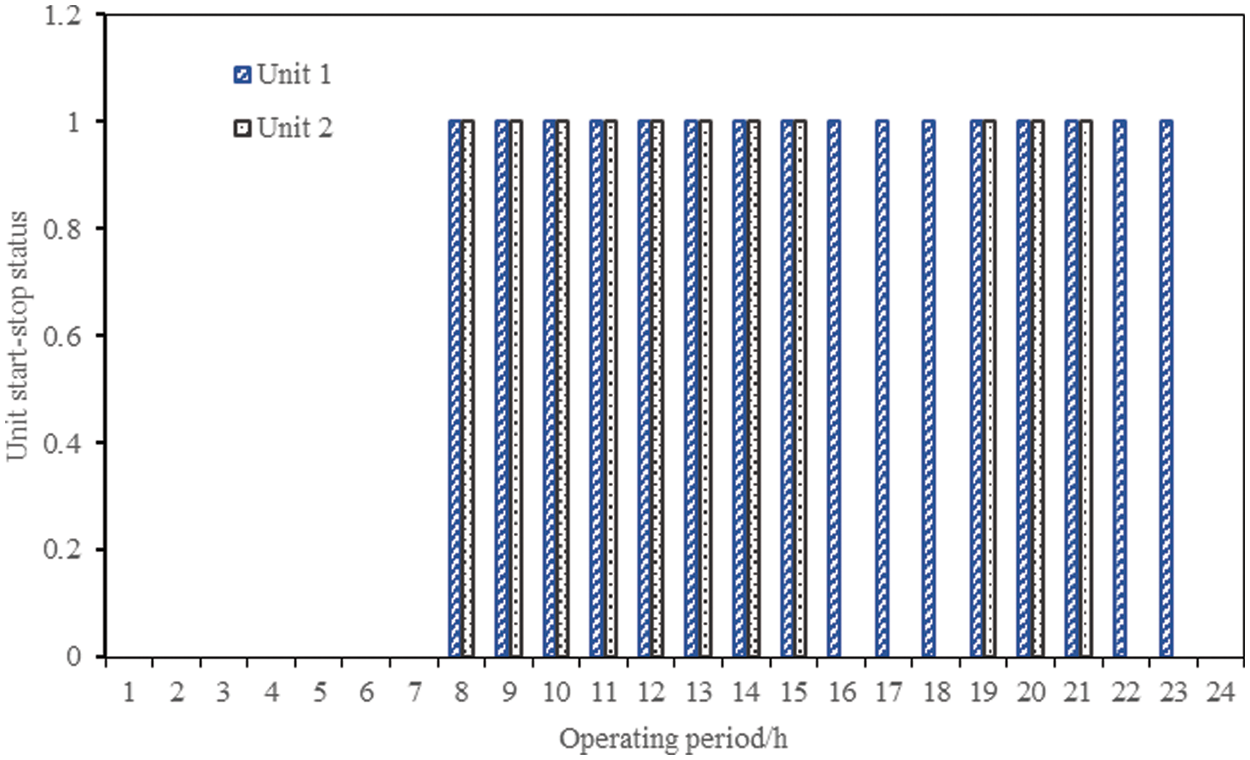
Figure 5: Unit start-up and shutdown plan
It can be learned from the above operation plan figure that the demand-side management plan and the optimized operation plan suggested by the model fully adapt to the load characteristics of the system. From the 1th to the 8th period, the TOU price level was low, and the wind storage industrial microgrid purchases electricity online. When the load demand was met, the energy storage was fully charged to prepare for the subsequent discharge, and the unit did not need to work in this period. From the 9th to the 18th period, the system ushered in the first load peak and the TOU price level also reached the peak. The energy storage discharged fully and the unit generated power. The wind storage industrial microgrid used wind power and the relatively low-cost thermal power unit to net the electricity to obtain benefits. In the 19th period, the load entered the trough. The unit output declined rapidly, yet did not shut down completely considering the start-stop cost it might have. In the second load peak period from the 20th to the 22th period, the operation plan of the wind storage industrial microgrid was similar to the first load peak period. In the last load trough period, the energy storage entered the charging state, the machine stopped, and the wind storage industrial microgrid purchased electricity totally from the external.
Based on the aforementioned operation scheme, the comprehensive operation cost of the wind storage industrial microgrid is 5292.63 yuan per day, the user satisfaction index is 0.953 and the absorption rate of wind power reaches 100%.
4.2.2 Analysis of the Relationship between Comprehensive Operating Costs and User Satisfaction
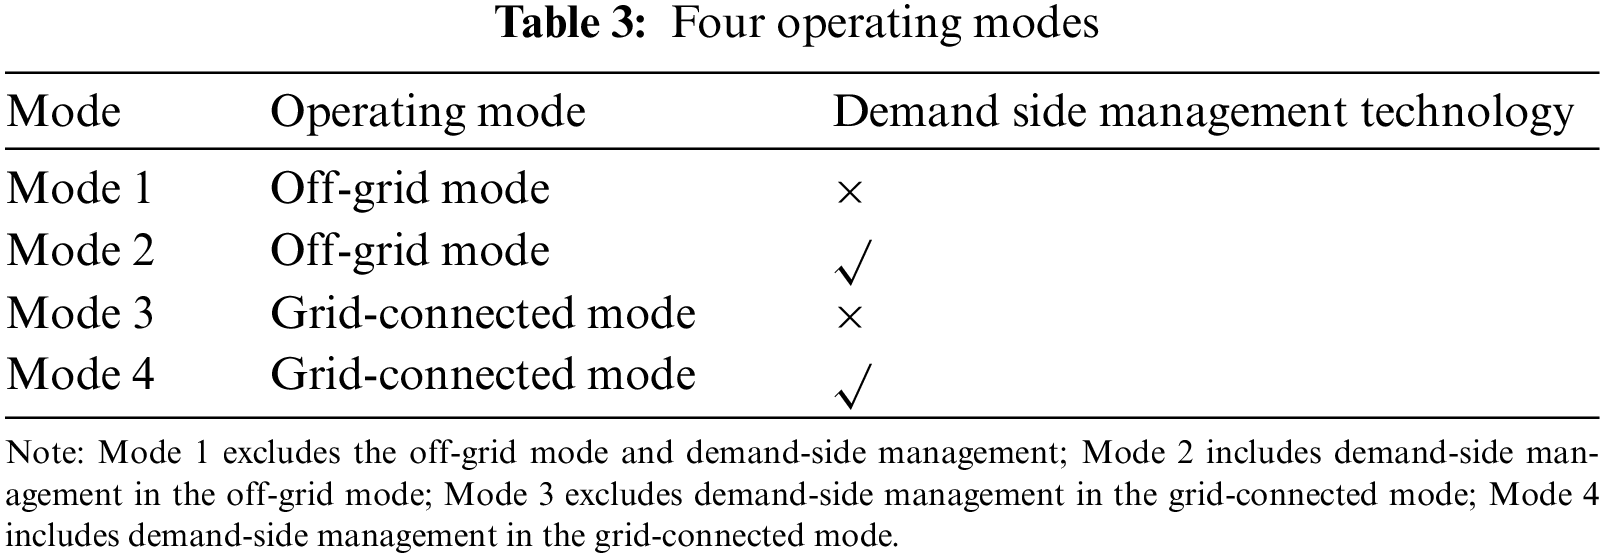
To compare the operating indexes between the grid-connected mode and the off-grid mode, and to consider whether an automatic demand-response scheme is adopted or not, four operating modes were configured to run the model established in this paper, in Table 3:
The operating indicators under these modes are listed in Table 4.
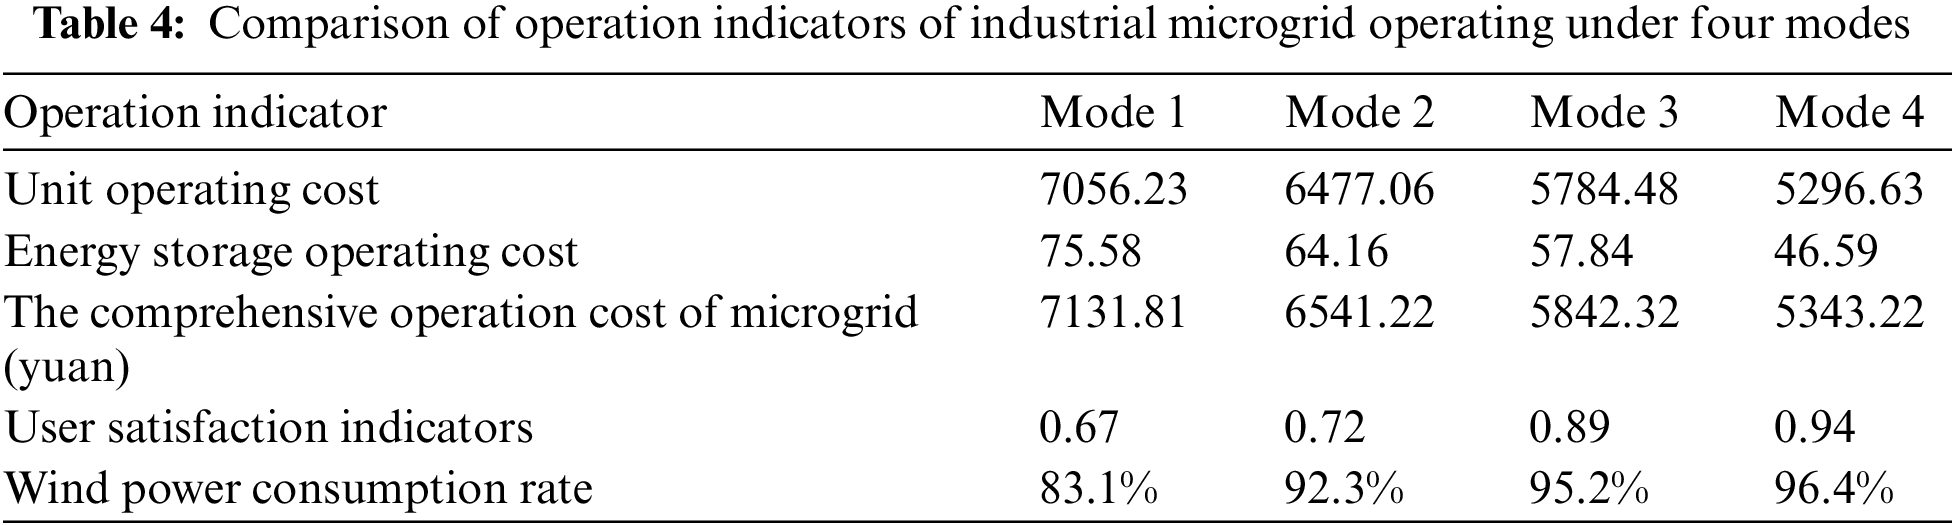
As can be seen from Table 4, the integrated operation cost of the wind storage industrial microgrid in grid-connected mode is lower than the off-grid mode, and the user satisfaction and wind power consumption rate are higher. In one aspect, it is because the wind storage industrial microgrid can obtain electrical energy from the external network in the grid-connected mode, which reduces the operating cost of the generator set; in another aspect, it is because the energy storage operation cost is saved in grid-connected mode due to low requirements for energy storage, which can achieve peak shaving and valley filling. Compared with the DSM method, wind storage industrial microgrid also has lower comprehensive operation cost, higher user satisfaction, and higher wind power consumption rate when it adopts DSM. Through demand-side management, the wind storage industrial microgrid can optimize the load curve, make full use of the domestic and external grid electricity during the period when TOU price is low, and improve the wind power consumption capacity. In the grid-connected mode, energy storage further exerts the economic benefits of peak shaving and valley filling to reduce operating costs.
Taking Mode 4 as an example, efficient frontier analysis was performed on the multi-objective function. The value combination of the sub-targets is obtained through different weight coefficients values, and the effective frontier curve is obtained by fitting, which is shown in Fig. 6.

Figure 6: Pareto frontiers for multi-objective optimal scheduling
As can be seen from Fig. 6, with the increase in the comprehensive operating cost of wind-storage industrial microgrids, user satisfaction also continues to improve. The upper half of the frontier curve is the region where the multi-objective model cannot obtain the optimal solution, and the lower half of the frontier curve is the region where the model can obtain the optimal solution. Based on the meaning of the frontier curve, it can be seen that the optimal solution of the model is on the curve, and it is impossible to optimize any word target of the wind-storage industrial microgrid by changing the control variables. At this time, the optimal compromise solution of the wind-storage industrial microgrid is obtained by using the multi-objective algorithm as (5343.22, 0.94).
In fact, the above results are calculated when the confidence of the objective function and constraints is selected as 0.95, and different confidence levels will also have a direct impact on the operation of wind-storage industrial microgrids. Take operation Mode 4 as an example, different confidence levels of the objective function and the constraint conditions are set, corresponding to which the relationship between the comprehensive operation cost and the reliability of the wind-storage industrial microgrid is shown in Fig. 7.
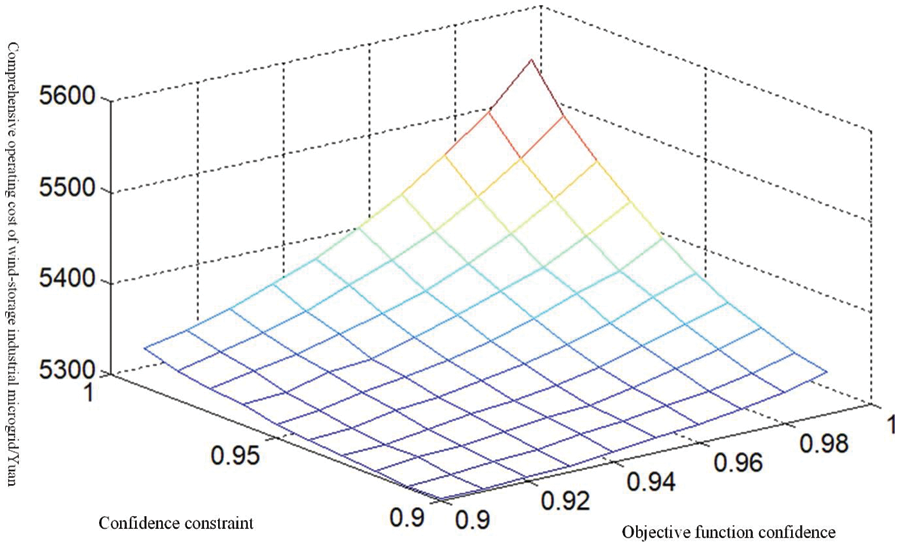
Figure 7: Relationship between the comprehensive operation cost and the reliability of the microgrid
It can be seen from Fig. 7 that the comprehensive operation cost of the wind storage industrial microgrid is closely related to the confidence level. With the increase of confidence, the comprehensive operation cost keeps rising. This is mainly because when the confidence increases, the operation scheme of the system must satisfy the objective function value, and as a result, the establishment of the constraints becomes increasingly strict. Therefore, the wind storage industrial microgrid operation plan has to be conservative at the expense of the economy. Confidence analysis can reveal the contradiction between model economics and reliability and provide guidance for decision-makers with different risk preferences.
In this paper, a multi-objective optimization model of wind storage industrial microgrid considering demand response technology and user satisfaction is established, and the research conclusions are as follows:
(1) On the load side, by considering the demand response technology, three user satisfaction evaluation indicators are determined: the power consumption benefit loss, the user balance power purchase price, and the wind power consumption level in the system. Considering the operation cost of thermal power unit, environmental conversion cost and energy storage operation cost, a multi-objective optimization model of wind storage industrial microgrid is established.
(2) A typical wind storage industrial microgrid demonstration project is selected for simulation analysis. It shows that considering the demand response technology, the comprehensive operating cost of wind storage industrial microgrid is 5292.63 yuan a day, the user satisfaction index is 0.953, and the wind power consumption rate reaches 100%.
(3) By setting four scenarios, it highlights that the grid-connected operation mode is superior to the off-grid operation mode. The wind storage industrial microgrid can optimize the load curve by considering the demand response technology, make full use of the time-of-use electricity price to coordinate the operation of each unit, and enhance the wind power consumption. ability, and a compromise solution between the system's comprehensive operating cost and user satisfaction is obtained with a confidence level of 0.95.
(4) In the process of model solving, it is impossible to optimize any sub-objective by changing the control variables, which proves that there is a close relationship between the comprehensive operating cost of the system and the confidence level.
Acknowledgement: The completion of this paper has been helped by all author. We would like to express our gratitude to them for their help and guidance.
Funding Statement: The authors received no specific funding for this study.
Conflicts of Interest: The authors declare that they have no conflicts of interest to report regarding the present study.
References
1. Mohamed M. A. (2022). A relaxed consensus plus innovation based effective negotiation approach for energy cooperation between smart grid and microgrid. Energy, 252(8), 123996. DOI 10.1016/j.energy.2022.123996. [Google Scholar] [CrossRef]
2. Lai, Y., Chu, X., Peng, H., Jiang, Z. Q., Chen, W. (2021). Economic operation of industrial microgrid considering various flexible loads. Electric Engineering, 1(55), 55–62. [Google Scholar]
3. Yang, S. B., Tan, Z. F., Lin, H. Y., Li, P., De, G. et al. (2020). A two-stage optimization model for park integrated energy system operation and benefit allocation considering the effect of time-of-use energy price. Energy, 195(15), 117013.1–117013.17. DOI 10.1016/j.energy.2020.117013. [Google Scholar] [CrossRef]
4. Hu, C. Y., Yang, J. J. (2022). Control strategy of group energy storage in industrial microgrid. Science Technology and Engineering, 22(3), 1032–1038. [Google Scholar]
5. Chen, J. X., Deng, G. D., Zhang, L., Ahmadpour, A. (2022). Demand side energy management for smart homes using a novel learning technique-economic analysis aspects. Sustainable Energy Technologies and Assessments, 52(8), 102023.1–102023.13. DOI 10.1016/j.seta.2022.102023. [Google Scholar] [CrossRef]
6. Tang, W., Gao, F. (2017). Optimal operation of household microgrid day-ahead energy considering user satisfaction. High Voltage Engineering, 43(1), 140–148. [Google Scholar]
7. Lu, X. J., Cao, K., Gao, Y. B. (2021). Quantum particle swarm optimization for microgrid system with consideration of consumer satisfaction and benefit of generation side. Journal of Measurement Science and Instrumentation, 12(1), 83–92. [Google Scholar]
8. Chen, H. P., Gao, L., Zhang, Z. (2021). Multi-objective optimal scheduling of a microgrid with uncertainties of renewable power generation considering user satisfaction. International Journal of Electrical Power & Energy Systems, 131(10), 107142. DOI 10.1016/j.ijepes.2021.107142. [Google Scholar] [CrossRef]
9. Zeng, J., Xu, D. D., Liu, J. F., Li, C. D. (2016). Multi-objective optimal operation of microgrid considering dynamic loads. Proceedings of the CSEE, 36(12), 3325–3333. [Google Scholar]
10. Ma, Y. C., Wang, S. T., Liu, R. M., Liu, G. C., Tian, G. Z. (2022). Research on coordinated control strategy of DC microgrid with wind-energy storage based on user-side satisfaction. Power System Technology, 46(8), 1–10. [Google Scholar]
11. Guo, X. L., Zhao, Y., Qu, N., Liu, Y. W., Li, J. F. et al. (2021). Multi-attribute demand response strategy of household microgrid based on satisfaction. Acta Energiae Solaris Sinica, 42(7), 21–27. [Google Scholar]
12. Liu, M. H., Tian, S., Liang, Y. D. (2022). Double-level multi-objective optimal scheduling of microgrid considering customer satisfaction of electric vehicles. Distributed Energy, 7(2), 18–25. [Google Scholar]
13. Yang, H. H., Tang, P. P., Huang, W. T. (2021). Multi-objective optimal dispatch of microgrid based on demand side management considering user satisfaction. Electrical Measurement & Instrumentation, 2(3), 1–8. [Google Scholar]
14. Yang, L. J., Pan, W., Tian, W. X. (2022). Multi objective optimization model of microgrid considering demand response and uncertainty of wind power and photovoltaic. Power Demand Side Management, 24(3), 1–8. [Google Scholar]
15. Ma, X. Y., Mu, Y. F., Zhang, Y., Zang, C. X., Li, S. R. et al. (2022). Multi-objective microgrid optimal dispatching based on improved bird swarm algorithm. Global Energy Interconnection, 5(2), 154–167. DOI 10.1016/j.gloei.2022.04.013. [Google Scholar] [CrossRef]
16. Zhao, Z. Z., Wang, W. Q., Wang, H. Y., Fan, X. C. (2022). Microgrid multi objective optimization operation based on PD-IM-MOPSO algorithm. Modern Electronics Technique, 45(9), 116–123. [Google Scholar]
17. Liu, M. H., Tian, S., Liang, Y. D. (2022). Double-level multi-objective optimal scheduling of microgrid considering customer satisfaction of electric vehicles. Distributed Energy, 7(2), 18–25. [Google Scholar]
18. Zhao, D. M., Zhang, S., Wang, H. X. (2022). Low carbon economy scheduling of multi-energy combined peak shaving system considering nuclear power participation. Journal of North China Electric Power University (Natural Science Edition), 49(3), 9–19. [Google Scholar]
19. Ma, J., Li, Q. Y., Wang, L. L., Yu, H. Z., Guo, X. Z. et al. (2021). Optimization of grid dynamic investment strategy for urban distribution system considering GIS information. Electric Power Construction, 42(11), 54–62. [Google Scholar]
20. Tan, Z. F., De, G., Li, M. L., Lin, H. Y., Yang, S. B. et al. (2020). Combined electricity-heat-cooling-gas load forecasting model for integrated energy system based on multi-task learning and least square support vector machine. Journal of Cleaner Production, 248(3), 119252. DOI 10.1016/j.jclepro.2019.119252. [Google Scholar] [CrossRef]
Cite This Article
 Copyright © 2023 The Author(s). Published by Tech Science Press.
This work is licensed under a Creative Commons Attribution 4.0 International License , which permits unrestricted use, distribution, and reproduction in any medium, provided the original work is properly cited.
 Downloads
 Citation Tools