
 Submit a Paper
 Propose a Special lssue
 Open Access
ARTICLE

Identification of Type of a Fault in Distribution System Using Shallow Neural Network with Distributed Generation
Department of Electrical and Electronics & Communication Engineering, DIT University, Dehradun, 248001, India
* Corresponding Author: Saurabh Awasthi. Email:
Energy Engineering 2023, 120(4), 811-829. https://doi.org/10.32604/ee.2023.026863
Received 29 September 2022; Accepted 12 December 2022; Issue published 13 February 2023
 View Full Text
 Download PDF
Abstract
A distributed generation system (DG) has several benefits over a traditional centralized power system. However, the protection area in the case of the distributed generator requires special attention as it encounters stability loss, failure re-closure, fluctuations in voltage, etc. And thereby, it demands immediate attention in identifying the location & type of a fault without delay especially when occurred in a small, distributed generation system, as it would adversely affect the overall system and its operation. In the past, several methods were proposed for classification and localisation of a fault in a distributed generation system. Many of those methods were accurate in identifying location, but the accuracy in identifying the type of fault was not up to the acceptable mark. The proposed work here uses a shallow artificial neural network (sANN) model for identifying a particular type of fault that could happen in a specific distribution network when used in conjunction with distributed generators. Firstly, a distribution network consisting of two similar distributed generators (DG1 and DG2), one grid, and a 100 Km distribution line is modeled. Thereafter, different voltages and currents corresponding to various faults (line to line, line to ground) at different locations are tabulated, resulting in a matrix of 500 × 18 inputs. Secondly, the sANN is formulated for identifying the types of faults in the system in which the above-obtained data is used to train, validate, and test the neural network. The overall result shows an unprecedented almost zero percent error in identifying the type of the faults.Keywords
Nomenclature
| Per Unit value | |
| YΔ | Star-Delta |
There exist two ways of producing electrical power, i.e., via centralized generation and distributed generation (DG) system [1]. In the former one, electrical energy is generated at some large power stations whereas in distributed generation system (DG) the generation is primarily done through renewable energy resources near the load centres via small units [2]. A distributed generator offers many advantages when compared to a conventional system like enhancement in rural electrification, reduced Transmission and distribution expenses, improved energy efficiency, better reliability & security, ease in installation, and lesser environmental constraints [3]. However, one of the major issues that originates due to DG system is that it alters the radial nature of the existing distribution network and cause power to flow in reverse direction. Further DG system also increases the fault current level and affects the relay operation in the event of a fault. This problem becomes even more challenging if the fault prevails significantly for some duration. Thus, identifying the type of a fault and its location becomes highly important as any delay will not only propose a threat to the healthy components but also results in reduced power generation. Beside it can also imposes hindrance while carrying out switch-gear schemes [4].
In recent years, many authors have proposed several optimization algorithms and artificial intelligence tools like graph theory, genetic algorithm, artificial neural network (ANN), problem and fuzzy logic for solving optimization problems and identifying the fault type and its location in a distribution network when incorporated with DG [5–27]. Even so, the problem still requires extensive and reliable methods for better results as many of the methods were either conducted with lot many assumptions or under a particular set of conditions which cannot be generalized to all types of distributed generation system. The need of extensive and reliable methods is important to obtain better result as it is extremely critical to clear the fault as soon as it occurs in a distribution network. This will require an accurate data regarding the type of the fault and its location. An incorrect location or an incorrect type of the fault will deteriorate the conditions further and may result in power outage as well as hefty financial loss.
A method wherein the direction of current is taken as input for fault identification was proposed by Calderaro et al. [8]. However, the method requires umpteen number of sensors for localizing fault even for smaller sections. Javadian et al. [9] proposed a multi-layer perceptron orthodox method of splitting the system into different radial zones in which the protection of each such zone is to be carried out using a circuit breaker. Hence the scheme requires major alteration for better results. Most of such methods focus on measurements of current and voltage corresponding to different DGs, Pérez et al. [14] and Dashtdar et al. [15] proposed different methodologies to identify the fault location using support vector mechanics, Neural networks, smart meters, etc. Both these methods showed good accuracy in identifying the location of faults. However, the proposed methods were not able to identify the type of fault accurately.
As most of the methods proposed in the past, showed good accuracy in identifying the location of the fault, however the reliability in identifying the type of fault still requires a major improvement. The proposed method emphasizes more on the fault type identification, as for clearing the fault determining its type is equally important as its location. A small delay in identifying the type can cause the whole system to malfunction and ultimately power outage for a longer duration which means no further generation within that timeline. This would have a negative impact on the economy and growth. The major advantage with the proposed scheme is not only it helps in clearing the fault precisely but also ensures quicker response that improve the power optimization and thereby the economic growth.
In this paper, the emphasis has been laid out on identifying the type of the fault only using a shallow Neural Network. The proposed scheme uses a real-time distributed generation system with two distributed generators and a utility grid. An equivalent model is then made using MATLAB Simulink. Such systems are difficult to protect in the event of a fault as the conventional relaying cannot be easily adapted for a distributed generation system in a distribution network. The shallow Artificial Neural Network requires data for training, validation, and testing which is to be collected through artificially creating short circuit faults at various locations at 2 km each within the distribution network. The data so recorded would then be formulated in a desired matrix form for ANN training and validation. Out of the total recorded data, around 70% would be used for ANN training, while 15% each is kept for validation, and testing. The results corresponding to training, validation and testing and relative percentage error between the actual values and calculated values would then be compared to depict the effectiveness of the scheme. The results of the conducted study would also be compared with [20] to give a better insight into the successful training, testing & validation.
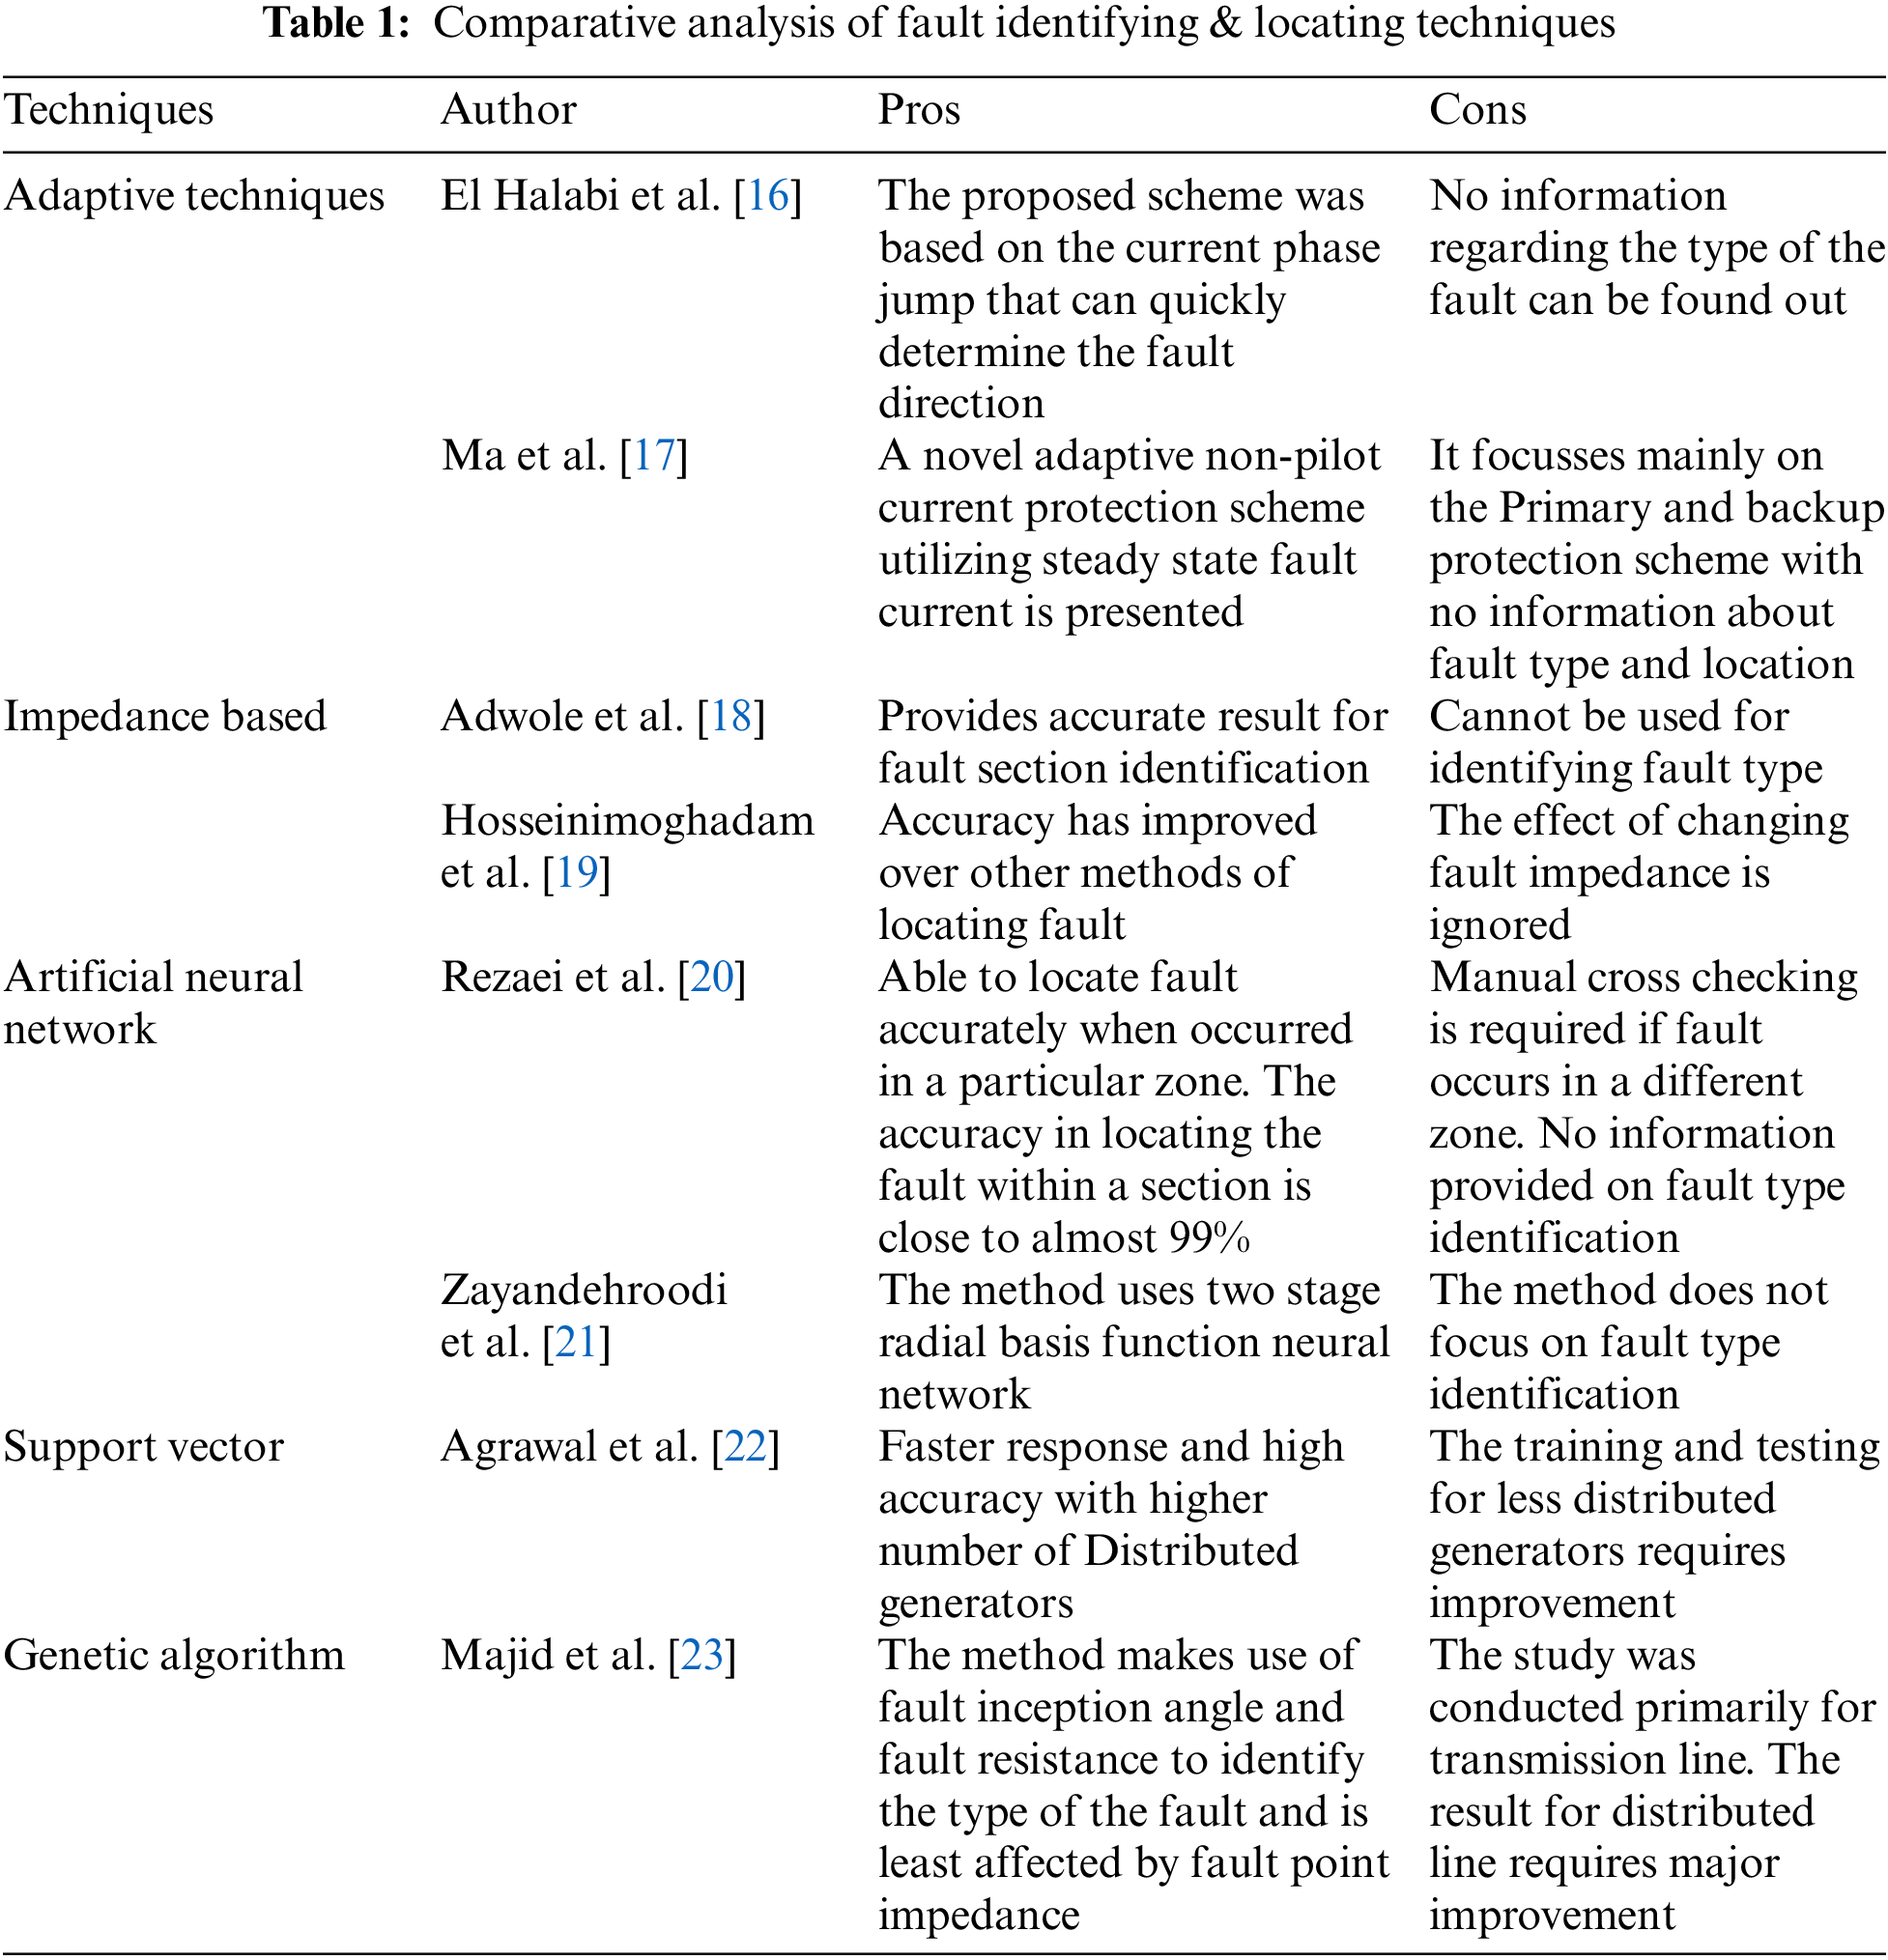
Table 1 discuss the various important techniques and their pros and cons for identifying fault and their location.
In a distribution system, faults are the unexpected deviations from the standard operating conditions. There may exist different reasons for their occurrence like a short circuit between physical contact, trees falling on the overhead lines, physical contact of birds or animals with the lines, etc. These faults may exist for a while or may remain until diagnosed and cleared. Accordingly, they are termed temporary faults and permanent faults, respectively. The temporary faults may eventually become permanent faults if not cleared in time. The permanent fault may occur mainly due to the failure of cable insulation failure, wires falling on the earth or objects coming in contact with the lines.
There are mainly four types of short circuit faults that may occur in a distribution system which are shown in Table 2. All these faults are characterized by an increase in current, reduction in voltage, frequency, and power factor.
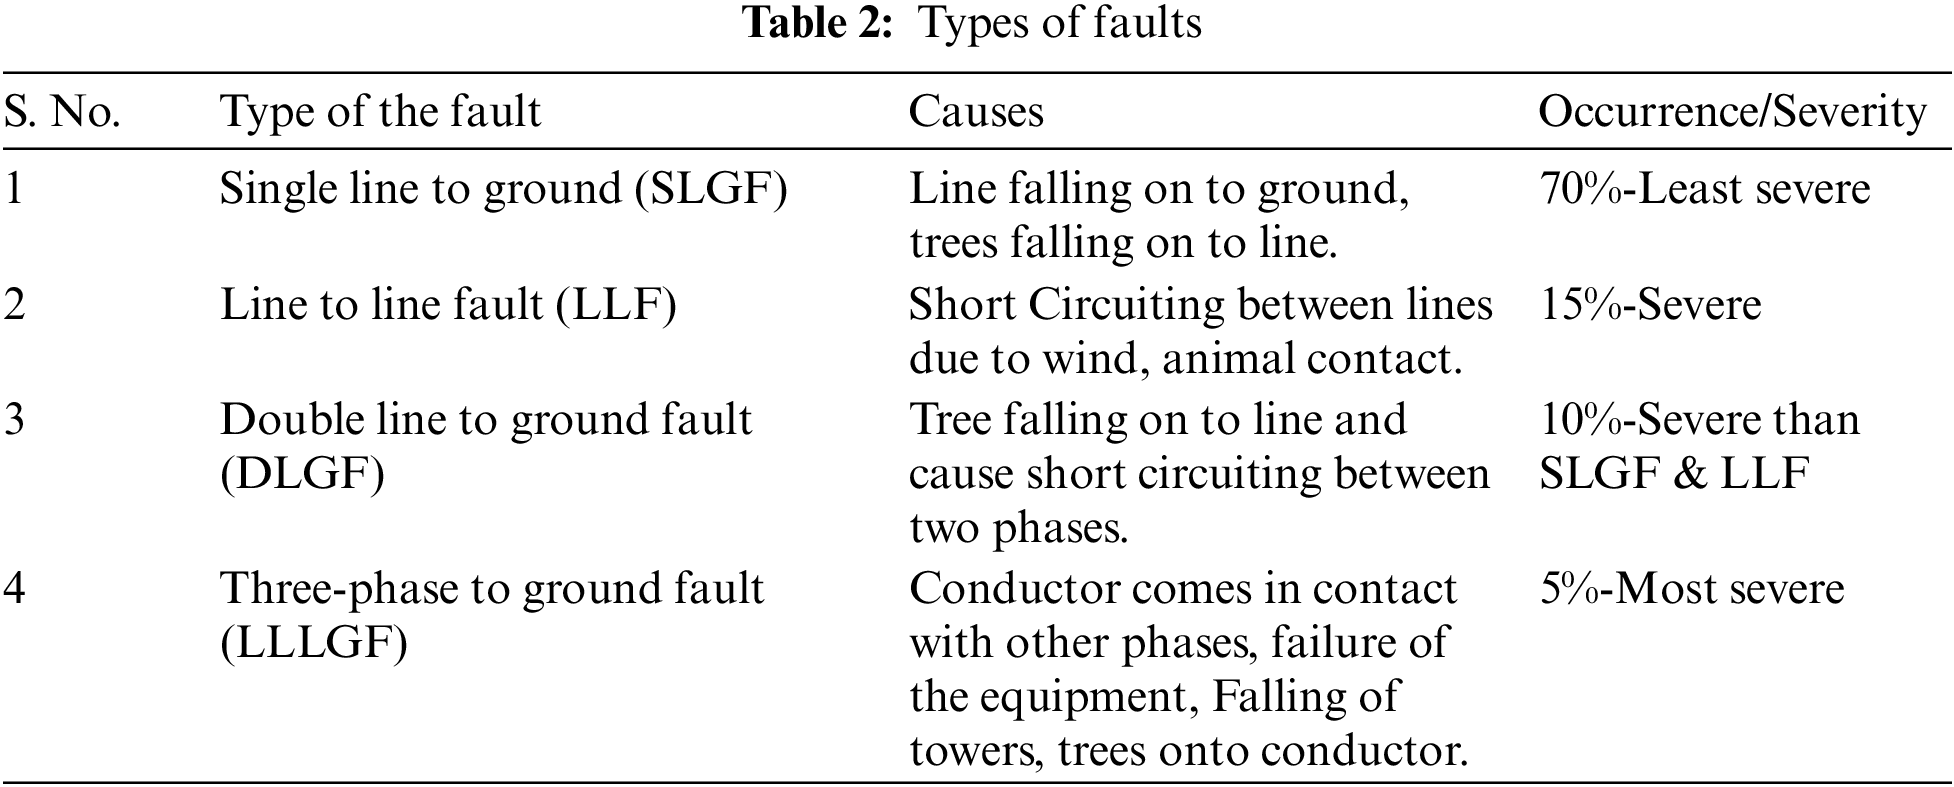
Of all these faults, SLGF is the most common but least severe and LLLF is the least common but most severe fault and requires immediate attention. Due to the occurrence of these faults, the generators must be disconnected from the system via circuit breaker which in turn causes a power outage and deteriorates the power quality.
1.2 Artificial Neural Network for Fault Classification
Once the data gets stored and transformed into the required matrix form, the next step is to train the artificial neural network. This calculation will be performed by an artificial neural network program. To identify the type of fault, it becomes necessary to successfully train the neural network through collected data and once the training is completed, testing and validation are to be carried out.
1.2.1 Artificial Neural Network (ANN)
It is defined as an information processing epitome that works the same way as our biological nervous systems. It includes millions of neurons that are complicatedly inter-connected and operate in a coalition with one another to solve specific problems. The major application of an artificial neural network is primarily in the field of pattern classification. Fig. 1 shows an elementary artificial neuron.

Figure 1: An artificial neuron
As learning in organic systems includes alterations in the synaptic network which can be realized among different neurons, the include synapses like input which upon multiplication by signal strength or weight derives a mathematical relationship that further causes neurons to activate. The other identity functions determined the output of the ANN which many times depends upon a particular threshold.
One of the most important internal functions of an ANN network is the activation function which is defined as a weighted sum, i.e., Sum of inputs x when multiplied by their proportionate weights Wji is represented in Eq. (1) as:
Similarly, the output function is a sigmoidal function that is given by Eq. (2):
The Backpropagation algorithm is mainly used for this purpose. There is one hidden layer used with as many as 34 neurons in it. The number of neurons in the hidden layer is selected based on the minimum RMS error encountered simultaneously in all three phases during validation and testing.
The parameters which affect the overall accuracy of an ANN are inter-relation among different neurons, activation functions, and the method via which weights can be determined. The network accepts inputs through input layer neurons whereas the network output is delineated through output layer neurons.
Some intermediate hidden layers are also present within the structure. Since this algorithmic program uses the concept of supervised learning, hence input-output samples are required to be analysed one after another. A simple neural network diagram is shown in Fig. 2.
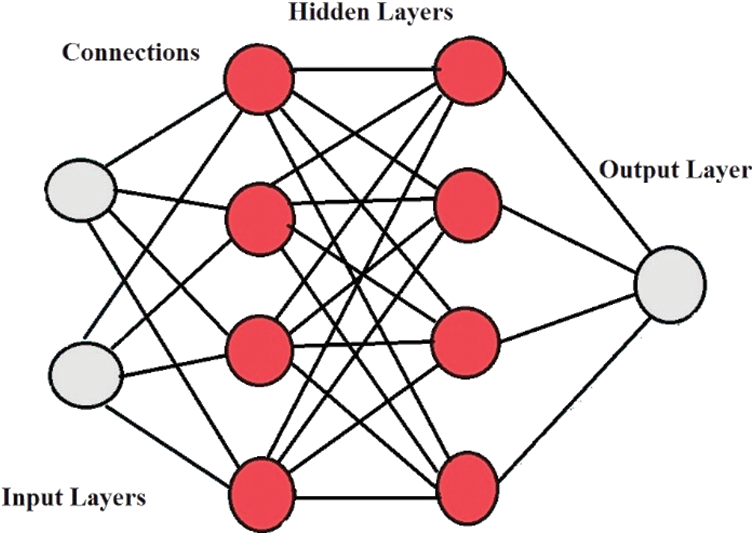
Figure 2: Simple neural network diagram
The content of the paper is organized as:
Section 1: Introduction.
Section 2: Methodology.
Section 3: System configuration and modelling.
Section 4: Neural Network designing for fault classification.
Section 5: Result and Discussion.
Section 6: Conclusion.
The protection procedure mainly consists of three major steps, System Modelling, Data recording, and ANN designing for training and testing as shown in Fig. 3.
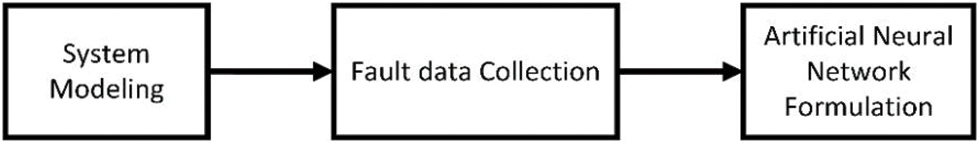
Figure 3: Protection procedure block diagram
It involves collecting data on the proposed system for which analysis is to be carried out. The next step is to define the input variables and their rated value which is then followed by making a corresponding model of the system on MATLAB Simulink as shown in Fig. 4.
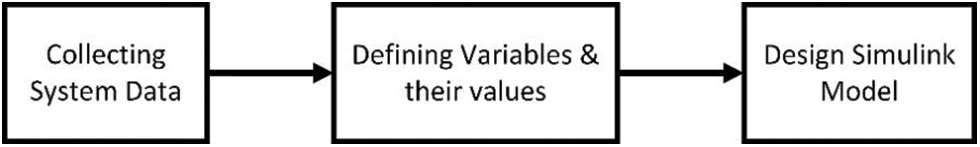
Figure 4: System modelling
The modelling can also be done on other platforms such as ETAP. In the proposed scheme an elementary distribution network is modelled using two distributed generators and a utility grid on MATLAB Simulink only. The rating of all the sources and corresponding transformers matches a real-time system.
The purpose of this step is to run the load flow and short circuit test and record the corresponding data in matrix form [20]. Normally during steady-state operation, the net current via each source must be corresponding to the existing load only. However, during faulty conditions, this current exceeds the load current value and eventually becomes several times that of its rated value. To differentiate between the healthy and faulty conditions and to measure the degree of severity of these faults, the net current through all the sources is compared. The block diagram for offline calculation is shown in Fig. 5.
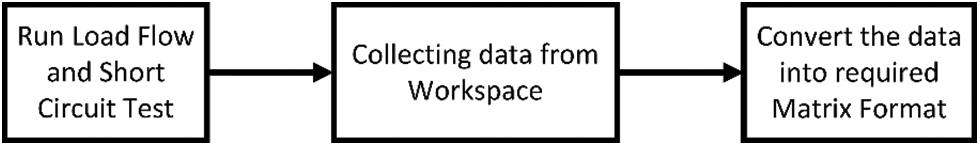
Figure 5: Fault data collection
Identification of a given fault is attributed on account of the high value of pre- and post-current before and after the fault has occurred. The normalization value of current for ten different types of faults can be calculated using Eq. (3):
where Imin, Imax are the minimum & maximum value of fault current for a specific type of fault.
After successfully recording the steady state and fault data, the next step is to define a suitable Neural Network structure followed by training, validation and testing as shown in Fig. 6. To open the correct unhealthy section, verification of the direction of input current via breaker is obligatory.

Figure 6: ANN formulation
3 System Configuration and Modeling
The system considered here is a distribution network incorporated with two DGs along and a grid which is equivalently modeled in MATLAB Simulink as shown in Fig. 7. Here two distributed generators having star-grounded configuration is interconnected to the grid via delta-grounded star distribution transformers.
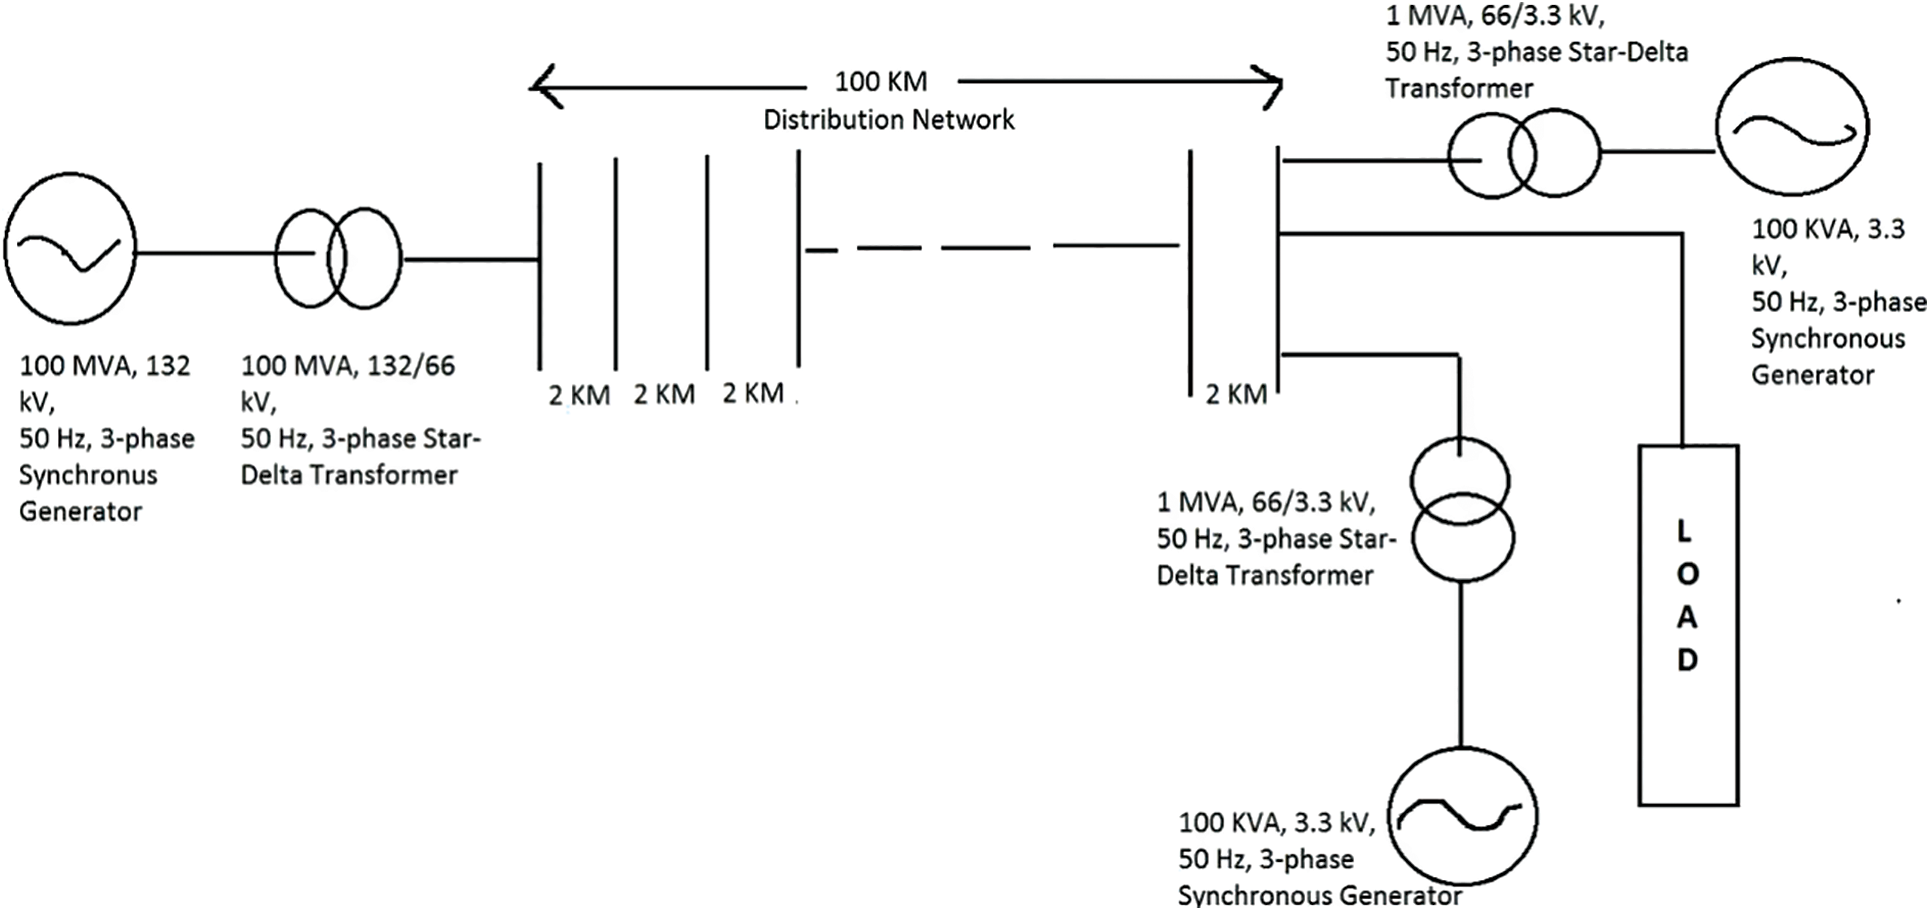
Figure 7: Single-line diagram of the proposed test system
The grid is rated at the voltage level of 132 kV at the power frequency of 50 Hz. The SC MVA level of the grid is taken at 100 MVA with reactance to resistance ratio of 7. A transformer of rating 100 MVA 132/66 kV is stepping down this voltage at the distribution level.
A V-I measurement toolbox has been connected with this transformer to measure and record the voltage & current parameters. The distribution network of 100 km distance is terminated through two distributed generators of rating 100 kVA at 3.3 kV. The entire distribution network is split into 50 zones of 2 km each.
The corresponding Simulink model on MATLAB is shown in Fig. 8. A common scope to all three sources ensures measurement of three-phase current and voltage. A 10 kW 3-phase load is connected for extracting power. Since it is not practically possible to carry out the calculations on a real system, hence modeling of the system becomes mandatory.

Figure 8: Simulink model of the test system
Once modelling of the system is done, the next step is to carry out load flow and short circuit tests at various locations. The reference point chosen here is the utility grid. In recent years, many authors have proposed several techniques to conduct load flow and short circuit tests [28–30]. To carry out these tests, fault data corresponding to each 2 km is taken. In this case with generators 1 and 2, a total of 50 locations have been taken into consideration for carrying out fault analysis. A 3-phase fault box is used to conduct and record data corresponding to the load flow and short circuit tests. The load flow and magnitude of voltage and current of all three sources can be recorded via scope data. The simulation and sample time are selected as 0.2 & 0.00002 s, respectively. This will ensure 500 values of voltage & current for all the three sources to be recorded.
The instantaneous value of all these quantities can be checked from the scope results which indicates all the quantities are equally displaced from each other by 120 degrees as shown in Fig. 9.

Figure 9: Scope results: steady state
The magnitude and phase angle of current and voltage for all three sources under steady state are already stored in the workspace and have eventually been used for training purpose. A similar approach has been adopted to carry out the short circuit tests and likewise, the already save data has been extracted from the workspace.
Similarly, short circuit analysis can be done at this location using the same procedure and data can be collected from the scopedata1 stored in the workspace. For example, three phase fault (ABC-G) can be performed by selecting all three phases-A,B,C and Ground variable in the 3-phase fault box. Fig. 10 shows the scope results corresponding to a 3-phase fault at DG2.
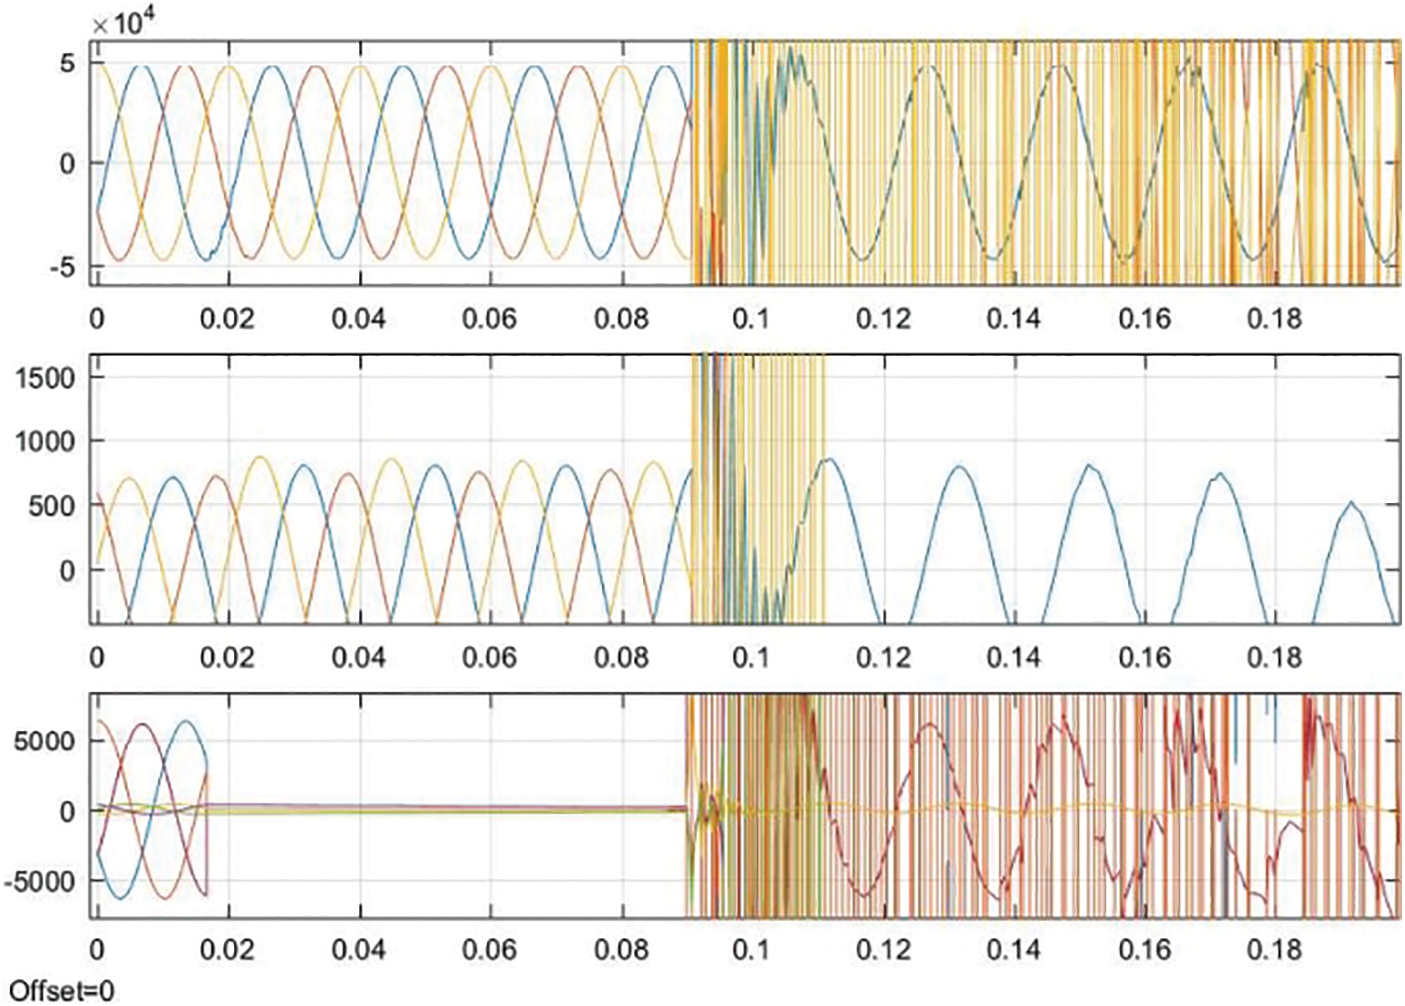
Figure 10: Scope results for a 3-phase fault at DG2
The short circuit test for other marked locations such as 2, 4, 6, 8 km, and so on can be executed. The data corresponding to all such locations for all types of the fault has been recorded and transformed into a matrix form for training purposes.
4 Neural Network Designing for Fault Classification
After recording the short circuit test data, the next step is to design a shallow ANN that can be trained and validated using the faults data at different locations in the desired form. The steps involved are as follows:
• Designing the structure of the Neural Network in terms of number of Neurons in the hidden layers, Input & Output Layers.
• Artificial Neural Network training through the data collected earlier.
• Validation & testing once the training is completed.
• Identification of fault and its location using the validation process.
The input variables are phase voltage and current of the Utility Grid, Distributed generators 1 & 2 and hence there are 18 inputs (9 voltage & 9 current). As a result, the size of the input matrix is 500 * 18. The output corresponding to the recorded input can be any one of the four possible outcomes (SLGF, LLF, LLGF, and LLLGF) which makes the target matrix size 500 × 4. Out of the total recorded data, around 70% has been used for ANN training, while 15% each is kept for validation and testing. Thus, the total number of input and output are 18 & 4, respectively.
The toolbox itself splits the recorded data for validation, training, and testing. By default, around 70% (samples) have been used for training purposes. Around 15% which are samples of the total have been kept reserved for deriving generalized values. Once the generalization does not improve anymore, the training would stop. As it does not have any impact on training, thus the result obtained would have independent characteristics. Here around 15% (samples) have been taken for this purpose.
It may be noted that the allocation for training, validation, and testing can be altered as per the need. Based on the minimum error convergence criteria. The number of neurons in the hidden layer is selected as 34 as shown in Fig. 11.
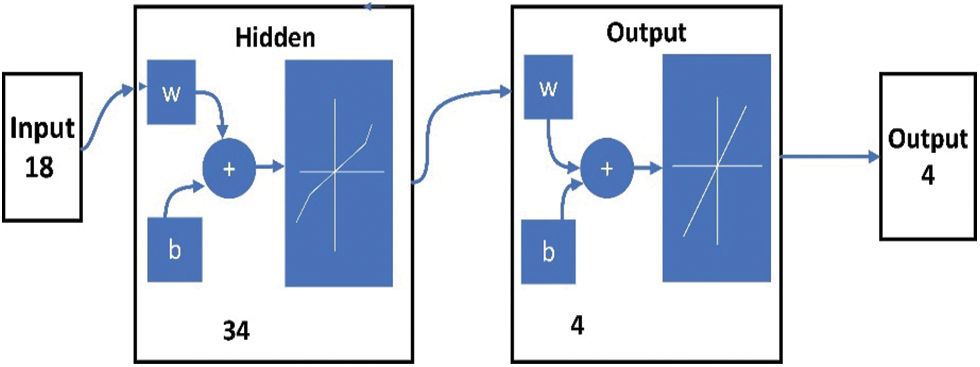
Figure 11: Neural network structure for test system
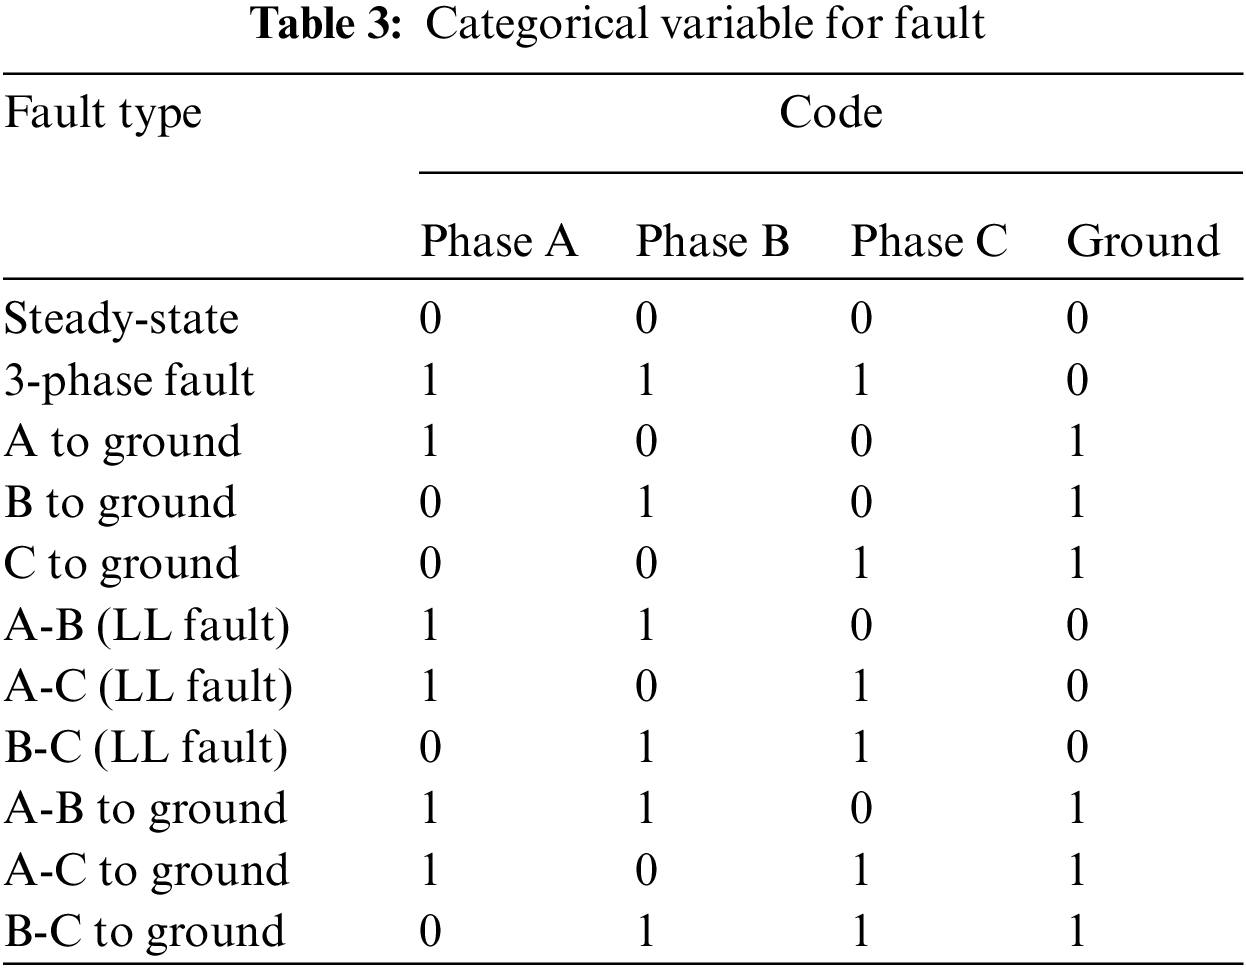
The identification of a given type of fault can be done using the coding as shown in Table 3.
The outcomes of the proposed methodology on the test system involving two DGs and a grid together forming a distribution network can be studied in Figs. 12–19.
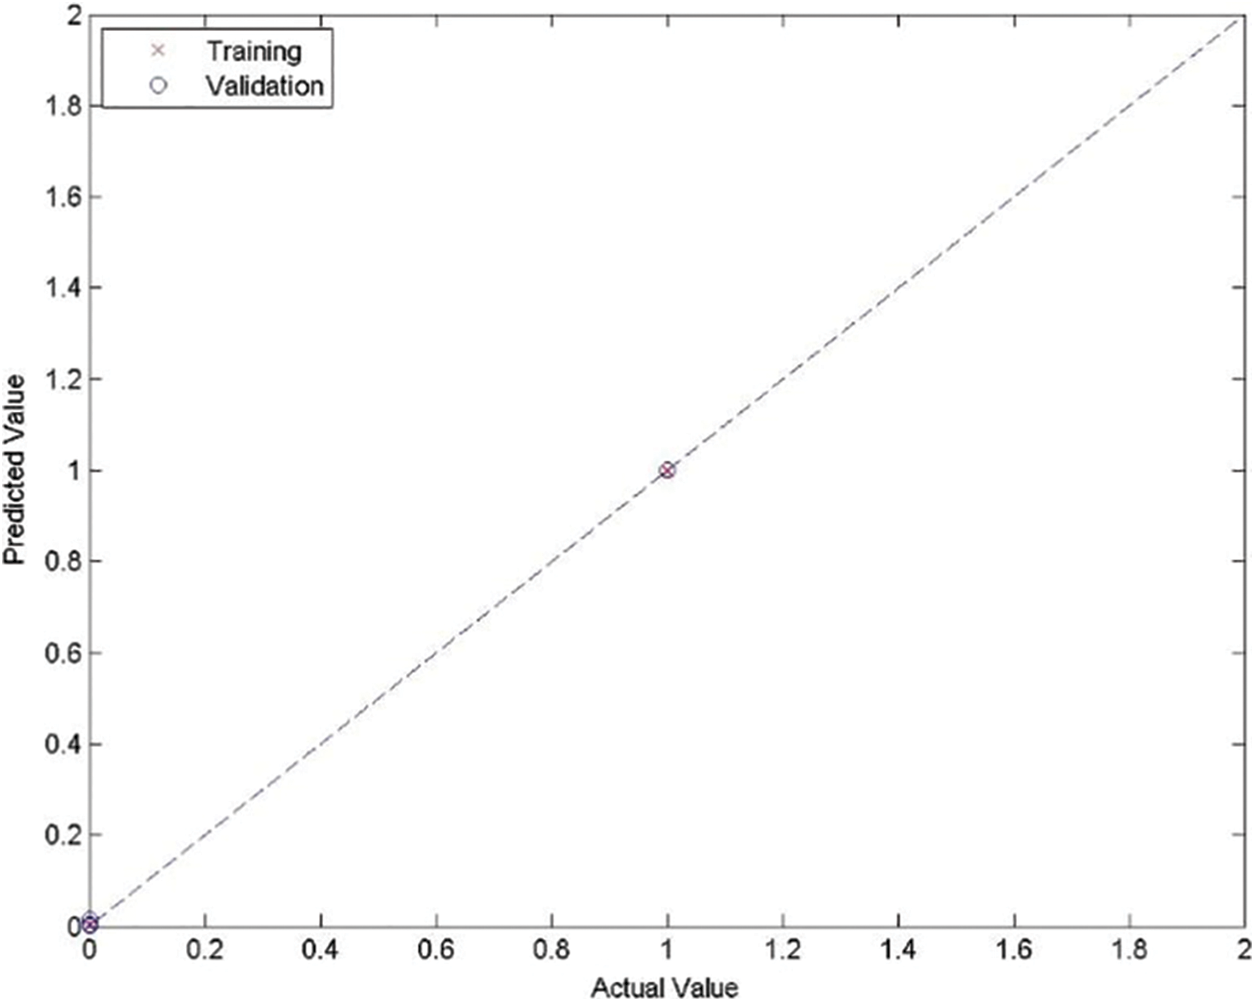
Figure 12: Predicted vs. actual training & validation-Phase A

Figure 13: Predicted vs. actual training & validation-Phase B

Figure 14: Predicted vs. actual training & validation-Phase C

Figure 15: Predicted vs. actual training & validation for ground
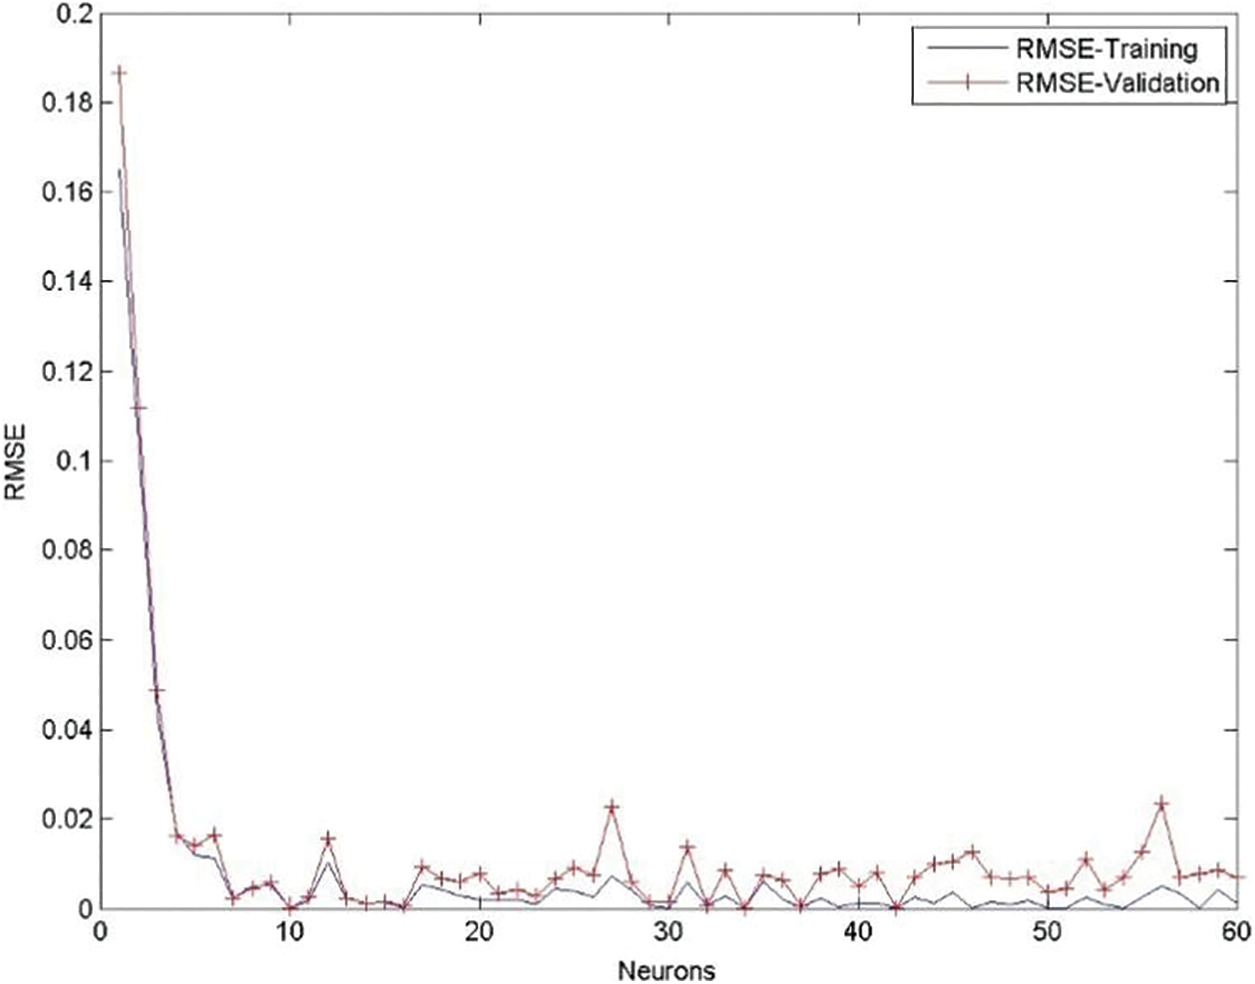
Figure 16: RMSE vs. neurons for phase A
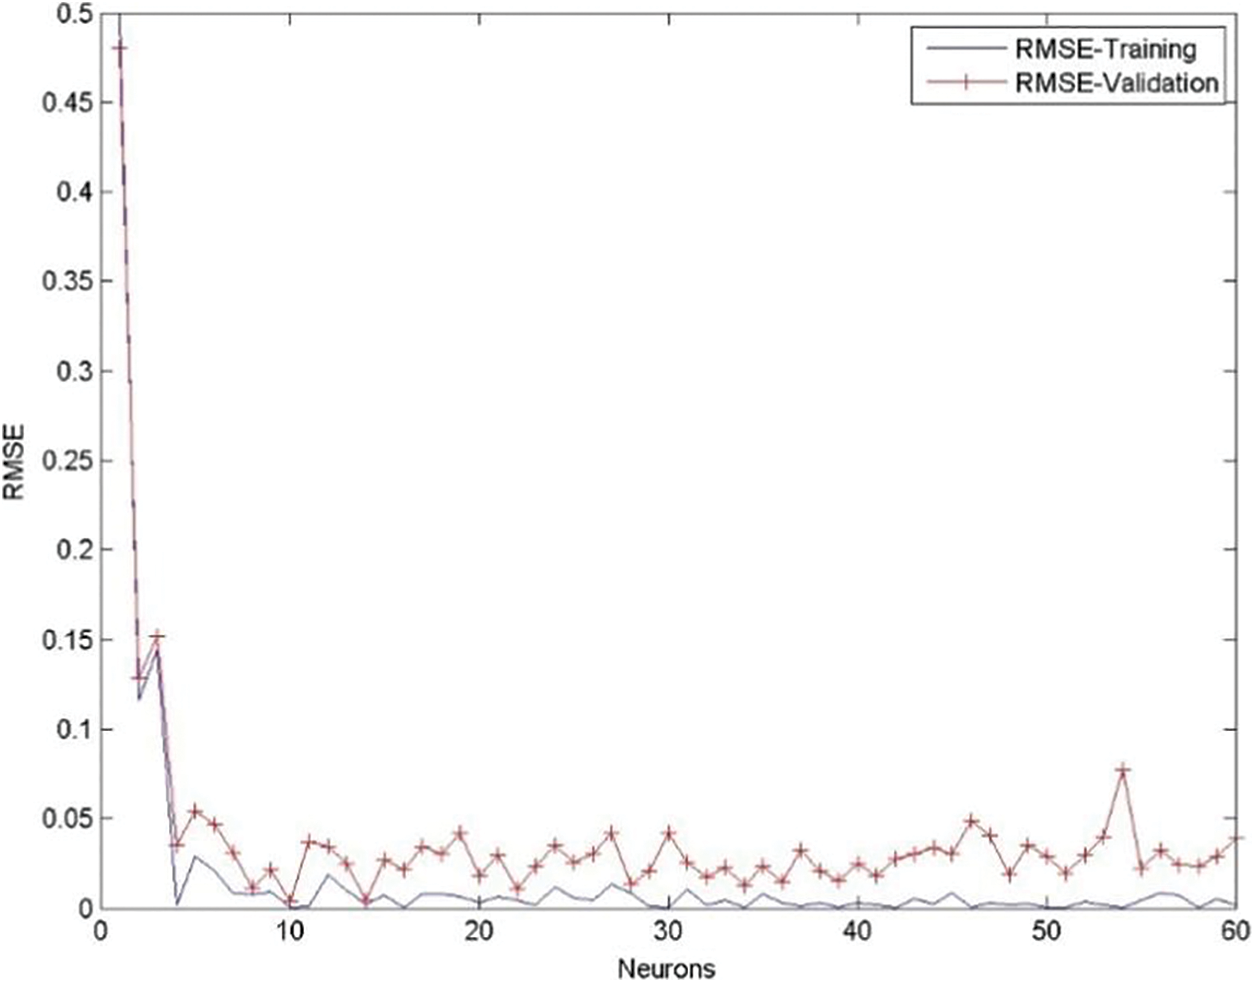
Figure 17: RMSE vs. neurons for phase B

Figure 18: RMSE vs. neurons for phase C
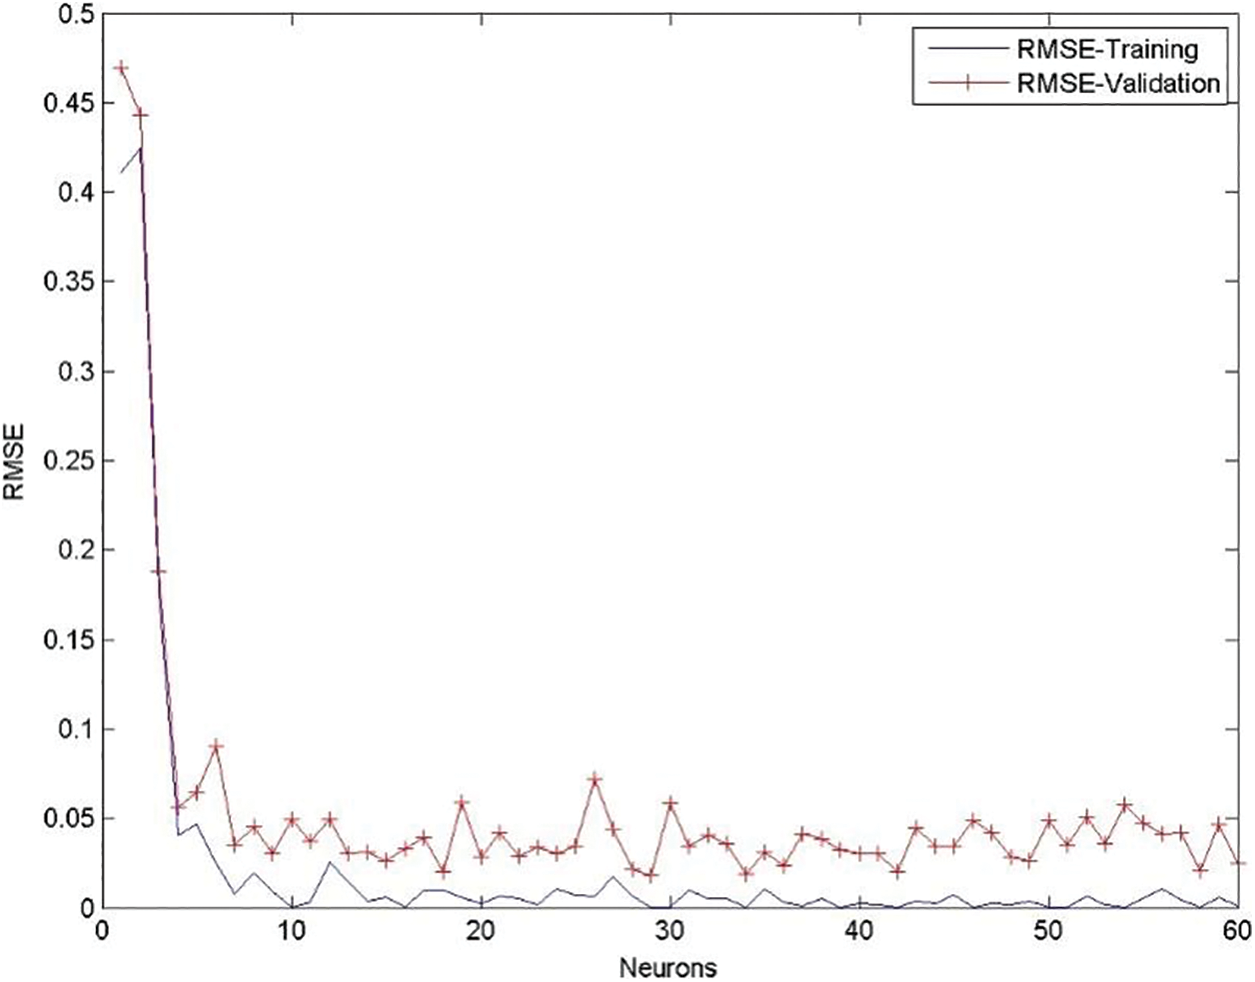
Figure 19: RMSE vs. neurons for Ground
It can be seen from Fig. 12 that the predicted vs. actual training and validation for phase A is a straight-line characteristic showing linearity in prediction and actual results.
Although there are very few outliers, the characteristics are linear showing excellent relation between the predicted value and actual value.
A similar type of results was obtained for phases B, C, and ground also with very few outliers which can be studied through Figs. 13–15, respectively.
Overall, the accuracy of the scheme is close to 100 percent for all four outputs. Except for one of the values, the curve is a perfectly straight line showing the linearity between predicted value and actual value.
The root means square error for phases A, B, C and ground indicate close proximity between the error during training and validation.
These errors are minimum at various neurons in the hidden layers such as at 10 neurons, 15 neurons, 22 neurons, 34 neurons and so on. However, the error is minimum for all the phases at 34 neurons in the hidden layer. And hence the number of neurons in the hidden layer is chosen as 34.
The RMSE for training and validation for all the phases and ground comes out to be approximately less than 0.02 percent. These errors against different neurons for phases A, B, C, and D can be seen in Figs. 16–19, respectively.
The maximum error encountered from zero to 60 neurons is still well below 0.2% during starting transient period. Once it gets settled the error never exceeds 0.02% for A, and 0.05% for phases B, C, and ground.
RMSE is the main parameter that depicts the effectiveness of pattern recognition. The RMS error for different stages corresponding to phases A, B, C, and D are given in Table 4.
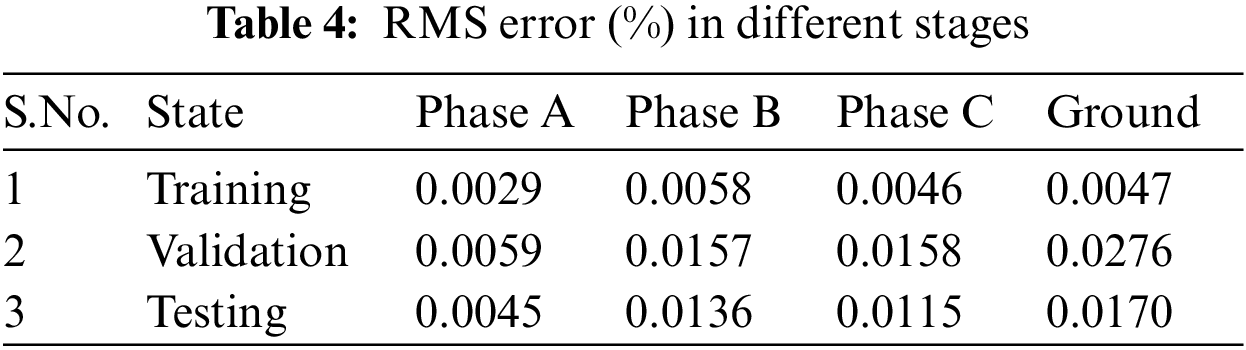
During training the error for phases A, B, C and ground is coming out as 0.0029%, 0.0058%, 0.0046%, and 0.0047%, respectively. Similar kinds of results are coming for the validation and testing stage as well.
The result the of conducted study have also been compared with one of the best fault identification methodologies as proposed by [20] for a similar distribution network incorporated with 2 distributed generators for a network of 50 km in Table 5 to depict the effectiveness of the study.
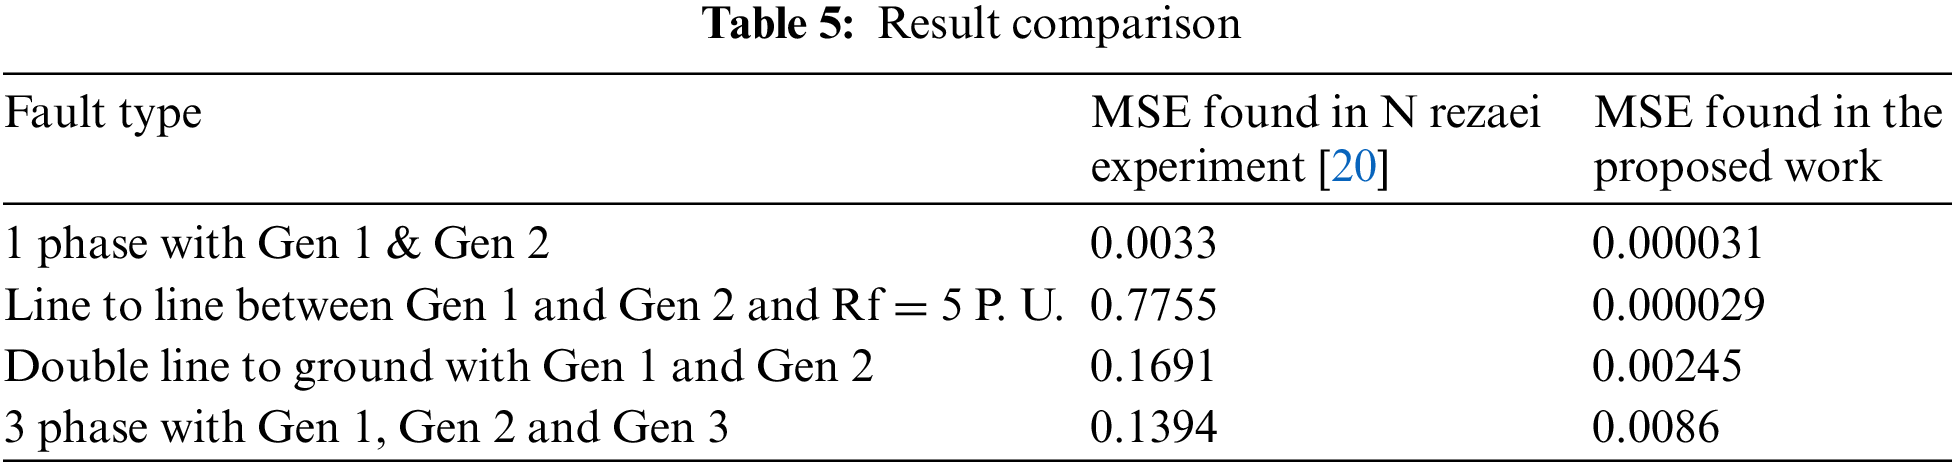
All the other methods explained earlier laid out emphasis only on clearing the fault without giving much importance to the speed and accuracy. The method proposed by [20] focuses mainly on how the system can be restored into its normal operation, however the accuracy of the scheme was merely 1/10th of the proposed work.
When training, testing, and validation are conducted, these errors all return 0, demonstrating great accuracy in recognising the type of issue.
This paper presented an artificial intelligence-based methodology to identify the type of fault. A Shallow Neural Network has been used for this purpose. The Neural Network have been trained through the fault data which has been recorded through MATLAB Simulink. To record fault data, a distribution network with two distributed generators is incorporated. The results of the proposed method as shown in Table 4 along with the linear characteristics between actual and calculated values (Figs. 12–15) concludes that the proposed work helps in mitigating the protection challenges encountered in distribution network systems when incorporated with distributed generation system.
The technical indicator for successful testing and validation is MSE (Mean Square Error). For a successful result, its value must be very close to zero. In this case, it comes out to be nearly zero percent as shown from the RMSE characteristics (Figs. 16–19) depicting 100% accuracy in identifying the type of the fault.
The results of the proposed scheme have also been compared with one of the past research works [20] in Table 5 and it has been found that the proposed methodology yields far better results irrespective of the size of the system. The accuracy of the proposed scheme comes out to be 0.000031, 0.000029, 0.0024, 0.0086 for single line to ground, line to line, Double line to ground, 3 phase fault which is very less in comparison to one of the schemes proposed earlier on a similar type of system.
Hence, it can be concluded that among all the artificial intelligence-based methods proposed to date, this scheme has shown the best results in identifying the type of fault in a distribution network with distributed generation system. The proposed scheme helps in restoring the system very quickly so that not only it prevents further damage to the healthy components but also ensures least interruption in power generation which would raise the per capita energy consumption and improves socioeconomic conditions of the country.
Funding Statement: The authors received no specific funding for this study.
Conflicts of Interest: The authors declare that they have no conflicts of interest to report regarding the present study.
References
1. Putrus, G., Bentley, E. (2016). Integration of distributed renewable energy systems into the smart grid. Electric Renewable Energy Systems, 44(3), 487–518. DOI 10.1016/B978-0-12-804448-3.00020-7. [Google Scholar] [CrossRef]
2. Shrestha, A., Bishwokarma, R., Chapagain, A., Banjara, S., Aryal, S. et al. (2019). Peer-to-peer energy trading in micro/mini-grids for local energy communities: A review and case study of Nepal. IEEE Access, 7, 131911–131928. DOI 10.1109/ACCESS.2019.2940751. [Google Scholar] [CrossRef]
3. Chiradeja, P., Ramakumar, R. (2004). An approach to quantify the technical benefits of distributed generation. IEEE Transactions on Energy Conversion, 19(4), 764–773. DOI 10.1109/TEC.2004.827704. [Google Scholar] [CrossRef]
4. Bastiao, F., Cruz, P., Fiteiro, R. (2008). Impact of distributed generation on distribution networks. 2008 5th International Conference on the European Electricity Market, pp. 1–6. Lisboa, Portugal, IEEE. [Google Scholar]
5. Gururajapathy, S. S., Mokhlis, H., Illias, H. A. (2017). Fault location and detection techniques in power distribution systems with distributed generation: A review. Renewable and Sustainable Energy Reviews, 74(3), 949–958. DOI 10.1016/j.rser.2017.03.021. [Google Scholar] [CrossRef]
6. Alwash, S. F., Ramachandaramurthy, V. K., Mithulananthan, N. (2014). Fault-location scheme for power distribution system with distributed generation. IEEE Transactions on Power Delivery, 30(3), 1187–1195. DOI 10.1109/TPWRD.2014.2372045. [Google Scholar] [CrossRef]
7. Calderaro, V., Conio, G., Galdi, V., Massa, G., Piccolo, A. (2013). Optimal decentralized voltage control for distribution systems with inverter-based distributed generators. IEEE Transactions on Power Systems, 29(1), 230–241. DOI 10.1109/TPWRS.2013.2280276. [Google Scholar] [CrossRef]
8. Calderaro, V., Hadjicostis, C. N., Piccolo, A., Siano, P. (2011). Failure identification in smart grids based on petri net modeling. IEEE Transactions on Industrial Electronics, 58(10), 4613–4623. DOI 10.1109/TIE.2011.2109335. [Google Scholar] [CrossRef]
9. Javadian, S. A. M., Haghifam, M. R., Bathaee, S. M. T., Firoozabad, M. F. (2013). Adaptive centralized protection scheme for distribution systems with DG using risk analysis for protective devices placement. International Journal of Electrical Power & Energy Systems, 44(1), 337–345. DOI 10.1016/j.ijepes.2012.07.056. [Google Scholar] [CrossRef]
10. Yang, H., Liu, X., Guo, Y., Zhang, P. (2020). Fault location of active distribution networks based on the golden section method. Mathematical Problems in Engineering, 2020(18), 1–9. DOI 10.1155/2020/6937319. [Google Scholar] [CrossRef]
11. Marvik, J. I., Petterteig, A., Hoidalen, H. K. (2007). Analysis of fault detection and location in medium voltage radial networks with distributed generation. 2007 IEEE Lausanne Power Tech, pp. 1191–1196. Lausanne, Switzerland, IEEE. [Google Scholar]
12. Brahma, S. M. (2011). Fault location in power distribution system with penetration of distributed generation. IEEE Transactions on Power Delivery, 26(3), 1545–1553. DOI 10.1109/TPWRD.2011.2106146. [Google Scholar] [CrossRef]
13. Zhu, G. F., Lu, Y. P. (2008). Development of fault location algorithm for distribution networks with DG. 2008 IEEE International Conference on Sustainable Energy Technologies, pp. 164–168. IEEE. [Google Scholar]
14. Pérez, R., Vásquez, C. (2016). Fault location in distribution systems with distributed generation using support vector machines and smart meters. 2016 IEEE Ecuador Technical Chapters Meeting (ETCM), pp. 1–6. Guayaquil, Ecuador, IEEE. [Google Scholar]
15. Dashtdar, M., Dashti, R., Shaker, H. R. (2018). Distribution network fault section identification and fault location using artificial neural network. 2018 5th International Conference on Electrical and Electronic Engineering (ICEEE), pp. 273–278. Istanbul, Turkey, IEEE. [Google Scholar]
16. El Halabi, N., Garcia-Gracia, M., Comech, M. P., Oyarbide, E. (2012). Distributed generation network design considering ground capacitive couplings. Renewable Energy, 45(11), 119–127. DOI 10.1016/j.renene.2012.02.024. [Google Scholar] [CrossRef]
17. Ma, J., Wang, X., Zhang, Y., Yang, Q., Phadke, A. G. (2012). A novel adaptive current protection scheme for distribution systems with distributed generation. International Journal of Electrical Power & Energy Systems, 43(1), 1460–1466. DOI 10.1016/j.ijepes.2012.07.024. [Google Scholar] [CrossRef]
18. Adewole, A. C., Tzoneva, R., Behardien, S. (2016). Distribution network fault section identification and fault location using wavelet entropy and neural networks. Applied Soft Computing, 46(28), 296–306. DOI 10.1016/j.asoc.2016.05.013. [Google Scholar] [CrossRef]
19. Hosseinimoghadam, S. M. S., Dashtdar, M., Dashtdar, M. (2021). Fault location in distribution networks with the presence of distributed generation units based on the impedance matrix. Journal of the Institution of Engineers (IndiaSeries B, 102(2), 227–236. DOI 10.1007/s40031-020-00520-2. [Google Scholar] [CrossRef]
20. Rezaei, N., Haghifam, M. R. (2008). Protection scheme for a distribution system with distributed generation using neural networks. International Journal of Electrical Power & Energy Systems, 30(4), 235–241. DOI 10.1016/j.ijepes.2007.07.006. [Google Scholar] [CrossRef]
21. Zayandehroodi, H., Mohamed, A., Farhoodnea, M., Mohammadjafari, M. (2013). An optimal radial basis function neural network for fault location in a distribution network with high penetration of DG units. Measurement, 46(9), 3319–3327. DOI 10.1016/j.measurement.2013.05.002. [Google Scholar] [CrossRef]
22. Agrawal, R., Thukaram, D. (2013). Identification of fault location in power distribution system with distributed generation using support vector machines. 2013 IEEE PES Innovative Smart Grid Technologies Conference (ISGT), pp. 1–6. Washington, DC, USA, IEEE. [Google Scholar]
23. Majidi, M., Etezadi-Amoli, M., Fadali, M. S. (2014). A novel method for single and simultaneous fault location in distribution networks. IEEE Transactions on Power Systems, 30(6), 3368–3376. DOI 10.1109/TPWRS.2014.2375816. [Google Scholar] [CrossRef]
24. Mora-Flórez, J. J., Herrera-Orozco, R. A., Bedoya-Cadena, A. F. (2015). Fault location considering load uncertainty and distributed generation in power distribution systems. IET Generation, Transmission & Distribution, 9(3), 287–295. DOI 10.1049/iet-gtd.2014.0325. [Google Scholar] [CrossRef]
25. Yu, K., Zeng, J., Zeng, X., Liu, F., Zu, Y. et al. (2021). A novel traveling wave fault location method for transmission network based on time linear dependence. International Journal of Electrical Power & Energy Systems, 126(5), 106608. DOI 10.1016/j.ijepes.2020.106608. [Google Scholar] [CrossRef]
26. Fan, W., Liao, Y. (2018). Fault identification and location for distribution network with distributed generations. International Journal of Emerging Electric Power Systems, 19(3). DOI 10.1515/ijeeps-2018-0048. [Google Scholar] [CrossRef]
27. Gazzana, D. S., Ferreira, G. D., Bretas, A. S., Bettiol, A. L., Carniato, A. et al. (2014). An integrated technique for fault location and section identification in distribution systems. Electric Power Systems Research, 115, 65–73. DOI 10.1016/j.epsr.2014.02.002. [Google Scholar] [CrossRef]
28. Sun, H., Nikovski, D., Ohno, T., Takano, T., Kojima, Y. (2011). A fast and robust load flow method for distribution systems with distributed generations. Energy Procedia, 12, 236–244. DOI 10.1016/j.egypro.2011.10.033. [Google Scholar] [CrossRef]
29. Olamaei, J., Ghasemabadi, M. A., Kapourchali, M. H. (2011). An efficient method for load flow analysis of distribution networks including PV nodes. 2011 2nd International Conference on Electric Power and Energy Conversion Systems (EPECS), pp. 1–6. Sharjah, United Arab Emirates, IEEE. [Google Scholar]
30. Teng, J. H. (2009). Unsymmetrical short-circuit fault analysis for weakly meshed distribution systems. IEEE Transactions on Power Systems, 25(1), 96–105. DOI 10.1109/TPWRS.2009.2036485. [Google Scholar] [CrossRef]
Cite This Article
 Copyright © 2023 The Author(s). Published by Tech Science Press.
This work is licensed under a Creative Commons Attribution 4.0 International License , which permits unrestricted use, distribution, and reproduction in any medium, provided the original work is properly cited.
 Downloads
 Citation Tools