
 Submit a Paper
 Propose a Special lssue
 Open Access
ARTICLE

Feasibility Analysis of Typical Cryogenic Processes for Hydrogen-Mixed Natural Gas Separation
1 School of Mechanical Engineering, Southwest Petroleum University, Chengdu, 610500, China
2 Petro China West Pipeline Company, Urumqi, 830013, China
3 School of Intelligent Manufacturing, Chengdu Technological University, Chengdu, 611730, China
* Corresponding Author: Lin Wang. Email:
(This article belongs to the Special Issue: Multiphase Flow Theory in Oil and Gas Gathering and Transportation Process)
Energy Engineering 2023, 120(4), 911-930. https://doi.org/10.32604/ee.2023.026002
Received 09 August 2022; Accepted 25 October 2023; Issue published 13 February 2023
 View Full Text
 Download PDF
Abstract
Hydrogen energy is a crucial carrier for the growth of the energy system and its low-carbon transformation. Using natural gas as a carrier of hydrogen transport and the natural gas pipeline network for transportation is a significant step toward realizing large-scale and long-distance hydrogen transport. Hydrogen-mixed natural gas is mainly separated into hydrogen and natural gas by physical methods at present. High purity of hydrogen recovery, but the recovery rate is low. At the same time, compared with natural gas, liquefied natural gas is more economical and flexible. This study analyzes three typical cryogenic separation processes. The results show that the hydrogen separation efficiency and specific energy consumption increase and the liquefaction rate and energy consumption decrease as the hydrogen ratio increases. The energy consumption and specific energy consumption of C3-MRC are lower than the MRC and the cascade liquefaction processes. Besides, as the pressure increases in the C3-MRC liquefaction process, the liquefaction and hydrogen separation efficiency increase and subsequently drop. Different hydrogen content has the highest hydrogen separation efficiency and liquefaction efficiency under different feed gas pressure conditions. The total exergy losses of the C3-MRC are the least in different hydrogen fractions, which are 37.59% and 21.77% less in the 25% hydrogen fraction, and 37.89% and 21.37% less in the 30% hydrogen fraction. Moreover, the exergy efficiency of C3-MRC are 87.68% and 88.06% when the hydrogen fraction are 25% and 30%, higher than the other two processes, which implies that in 25% and 30% fractions, making it more suitable for separate the hydrogen by the cryogenic separation.Keywords
Hydrogen is an excellent source of renewable energy. There are numerous and different hydrogen energy resources, approximately 96% of hydrogen is sourced from fossil fuels [1]. After pressurization, hydrogen is often carried using liquid hydrogen tank truck and long tube trailer. Despite the fact that the technology is established and the specifications are flawless, there are issues with high input costs and low efficiency [2]. Whether considering the input cost or the transportation distance and greenhouse emissions during transportation, the use of pipelines to transport hydrogen is the best choice [3]. Pipeline transportation techniques are primarily classified as hydrogen-mixed natural gas transportation and hydrogen special pipeline. However, there are challenges, such as a huge amount of engineering and a high investment cost to construct a hydrogen transportation pipeline network on its own. Injecting hydrogen into the natural gas pipeline network can make full use of the existing natural gas infrastructure to achieve long-distance, large-scale transportation and the utilization of hydrogen energy [4].
Hydrogen-mixed natural gas is an excellent alternative to hydrogen transition fuel since it is very inexpensive and operates safely. The ‘CertifHy’ project’s review of the natural gas market found that the total amount of hydrogen that can be transported is 800–8000 tons per day when the hydrogen mixing ratio of the natural gas pipeline is 0.01–0.05 [5]. It has the potential to minimize NOx and HC emissions. CO and CO2 emissions are statistically substantially lower than compressed natural gas (CNG) [6]. The emissions of the gas network may be decreased by around 4MtCO2/y, and the emissions of the entire system can be reduced by approximately 0.025 [7]. At present, hydrogen-mixed natural gas is not only transported to terminals such as household gas through the natural gas pipeline network, but also can be supplied to natural gas vehicles, gas turbines, fuel cells, and other directions for utilization [8].
The current research directions about hydrogen-mixed natural gas mainly focus on the combustion performance of hydrogen-mixed natural gas, the influence of hydrogen fraction on natural gas pipelines, the hydrogen-mixed natural gas engines, and so on. Hydrogen blend can enhance and advance the combustion of the CNG engine NOx emission increased with increase of hydrogen in hydrogen-mixed natural gas, but HC, and soot emissions decreased [9,10]. 15% hydrogen blend accounts for the least amount of CO2 emission, which is a major Green House Gas, while 5% hydrogen fraction and pure CNG blend accounts for higher emissions [11,12]. Huang et al. [13] investigated the effect of hydrogen-mixed natural gas on pipe gas interchangeability. The volume fraction of hydrogen in the mixture was within 0.23, and the pipeline’s gas transmission capacity remained unchanged, so end users’ fuel equipment did not need to be changed. Wang et al. [14] found that when hydrogen fraction is between 0.1–0.27, hydrogen-mixed natural gas meets the calorific value standard of second and third-class natural gas. At the beginning of 2022, Jingmen Green Power Plant of State Power Investment Corporation has achieved 15% hydrogen-mixed combustion transformation, and will implement the 30% hydrogen-mixed plan by the end of the year [15].
In future development, the hydrogen concentration in hydrogen-mixed natural gas will steadily grow. Terminals that use hydrogen-mixed natural gas directly will have equipment damage and a safety effect due to high hydrogen concentration. Hydrogen-mixed natural gas can be separated after transit by natural gas pipeline into hydrogen and natural gas for end users with high purity hydrogen demands, in addition to direct usage in the terminal. At the moment, hydrogen-mixed natural gas is mostly split into hydrogen and natural gas using physical techniques. High pure hydrogen may be recovered via Pressure Swing Adsorption (PSA), but it is very energy intensive, expensive and needs additional component [16,17]. Besides, the efficiency is very low for small scale applications. The hydrogen content of hydrogen-mixed natural gas is low, which requires repeated adsorption and vacuum desorption of the adsorption bed, and the process is complex, the recovery rate is low [18–20]. The coupling of membrane technology and PSA can be achieved by using membrane separation to remove most of the hydrocarbons, and then PSA can improve the efficiency and concentration of hydrogen recovery on the basis of membrane separation or PSA alone [21]. PSA and membrane separation technology have limited hydrogen content and separation efficiency.
Based on efficiency, pipeline transportation and compressed natural gas are best suited for shorter distances, liquefied natural gas (LNG) and natural gas hydrate are best suited for long-distance transportation [22]. Transporting natural gas in liquid form is easier, more economical, and more flexible than pipeline gas, which is the basic premise behind the formation and growth of the LNG industry [23–25]. Cryogenic separation technique is established and consumes little energy, which is useful in large-scale manufacturing, is better suited for purifying low-hydrogen feed gas. Lin et al. [26] studied the optimization of the dehydrogenation process of synthetic natural gas using the single mixed refrigerant liquefaction process. It can produce by-products rich in methane, ethylene, propane, and other hydrocarbons in addition to the needed hydrogen products [27]. If hydrogen content is high, membrane or PSA is more suitable. When the hydrogen level is low, cryogenic separation is preferable [28].
Towards the aforementioned researches, the separation and use of hydrogen and natural gas can increase the use direction of hydrogen-mixed natural gas. LNG is more economical and flexible than other forms of natural gas. In this paper, the feasibility of liquefaction of hydrogen-mixed natural gas after transportation is simulated and analyzed. Based on the above-mentioned safety range of 0.1–0.3 hydrogen fraction used in researches, analyzed the exergy, energy consumption, hydrogen separation, and liquefaction rate produced by the cryogenic separation process for various volume fractions of hydrogen
2 Cryogenic Separation Process Description
Natural gas liquefaction can take numerous forms, and the size of an LNG facility is mainly dictated by the equipment utilized and the liquefaction cycle. The cascade liquefaction process, closed mixed refrigerant liquefaction process (MRC), and propane-mixed refrigerant liquefaction process (C3-MRC) are the most common basic load natural gas liquefaction facilities today. For the basic load LNG plant, with the passage of time and the progress of the process, the LNG plant is gradually simplified from the cascade liquefaction process to MRC and then further optimized to C3-MRC [29]. Based on the above three liquefaction processes, this paper will calculate the exergy, energy consumption and efficiency of cryogenic separation under different hydrogen fraction, to provide theoretical support for the cryogenic separation and practice of hydrogen-mixed natural gas transmission terminals.
2.1 Cascade Cryogenic Separation Process
The cascade cryogenic separation process shown in Fig. 1 is mainly composed of three independent refrigeration cycles. The refrigerants are methane, ethylene and propane, respectively. The technology is mature and the energy consumption is low.
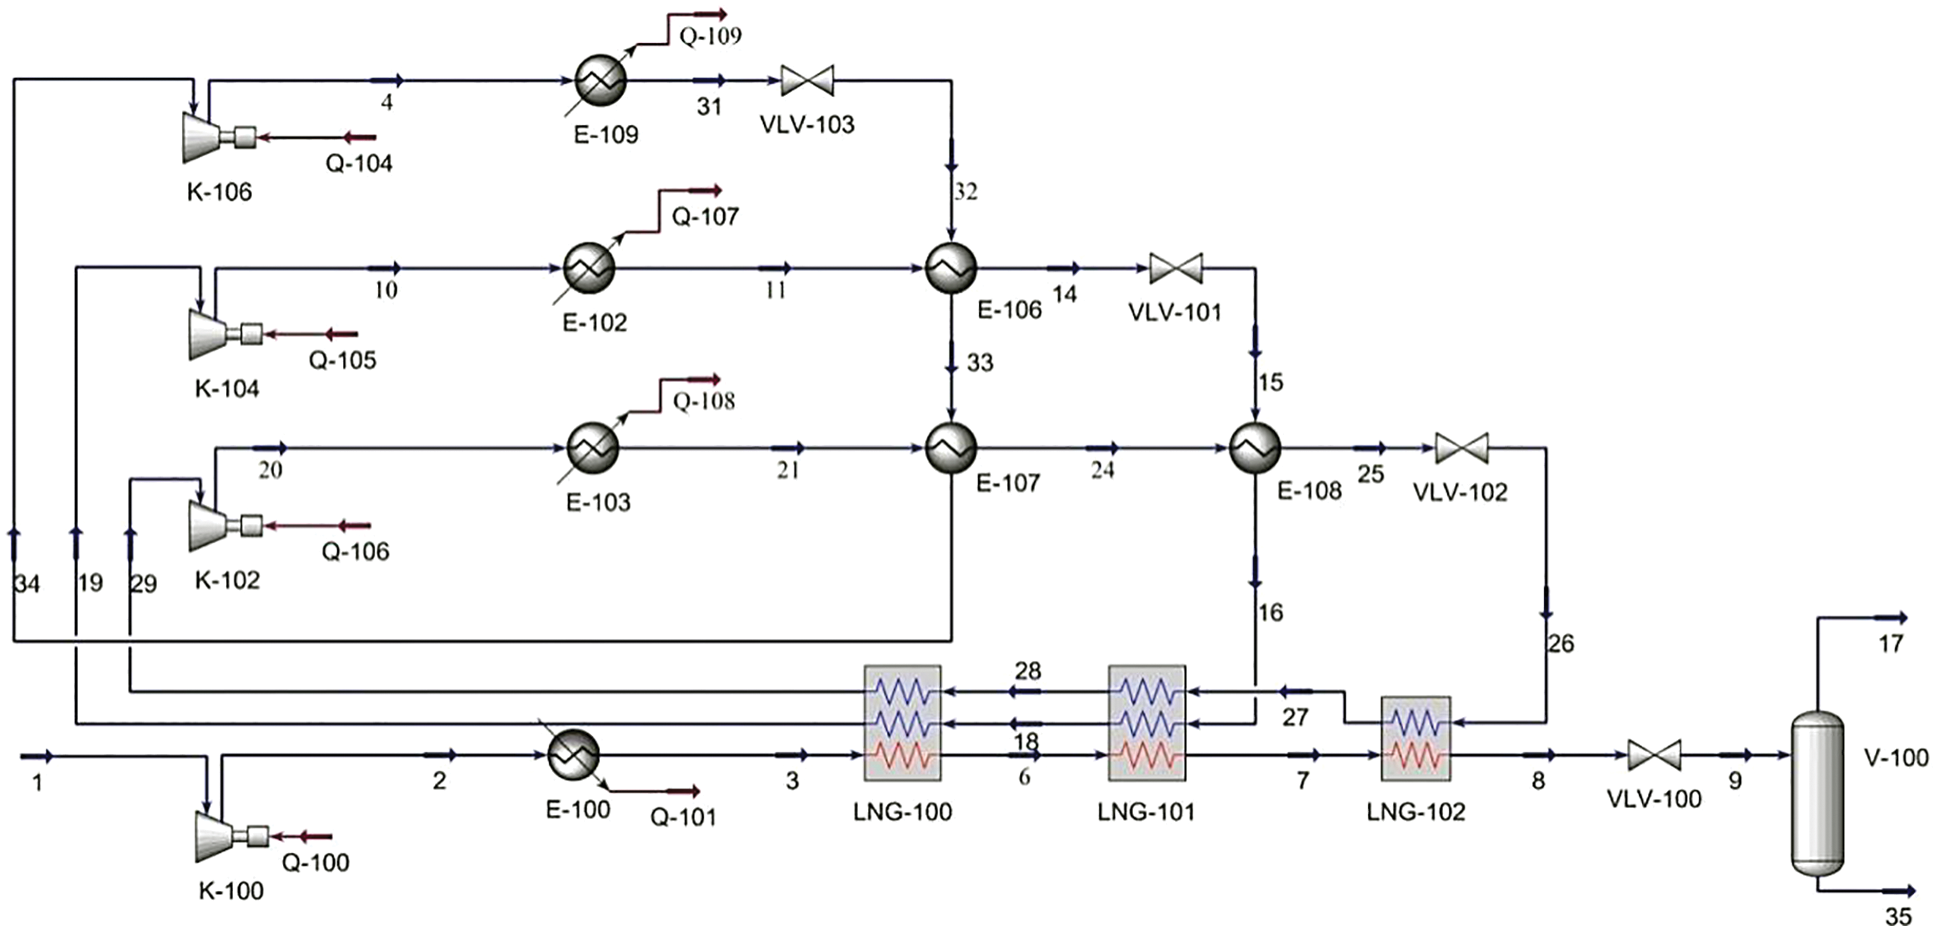
Figure 1: Process flow diagram of cascade cycle
In the hydrogen-mixed natural gas cryogenic separation process, the feed gas 1 passes through the compressor and enters the condenser to cool the temperature, then passes through the LNG heat exchanger LNG-100 and LNG-101 successively to exchange heat with refrigerant methane and ethylene, and then exchange heat with methane in LNG-102. After the throttle valve VLV-100 is throttled and depressurized and cooled to −158°C, it enters the V-100 for separation to obtain LNG and hydrogen-containing phase 17.
The pressure of methane 29 is increased in the compressor K-102 during the methane refrigeration cycle, and the temperature is dropped to 35°C (methane 21) after being cooled by water in E-103. Then it is precooled by heat exchangers with propane and ethylene through E-107 and E-108, before being cooled to −156°C by the throttle valve.
In the ethylene refrigeration cycle, ethylene 19 first flows via the compressor K-104 to boost pressure, then through the water cooling in E-102, and finally through the heat exchanger E-106 to exchange heat with propane for pre-cooling. After being throttled and cooled to −98°C by VLV-101, ethylene 19 enters the LNG-101 and LNG-100 heat exchangers to chill natural gas.
Propane 34 is boosted by compressor K-106 and cooled by water from condenser E-109. After the throttle is reduced to −35°C, propane 34 is precooled by heat exchangers E-106 and E-107.
2.2 Closed Mixed Refrigerant Cryogenic Separation Process
The closed mixed refrigerant cryogenic separation process shown in Fig. 2 has fewer units and lower input costs than the cascade cryogenic separation process. The refrigerant in the refrigeration cycle is composed of N2, CH4, C2H6, C3H8, i-C4H10 and n-C5H12, which can be extracted from natural gas itself. However, the energy consumption of MRC is higher than that of cascade cryogenic separation process, and the ratio of mixed refrigerant needs to be further studied and adjusted.
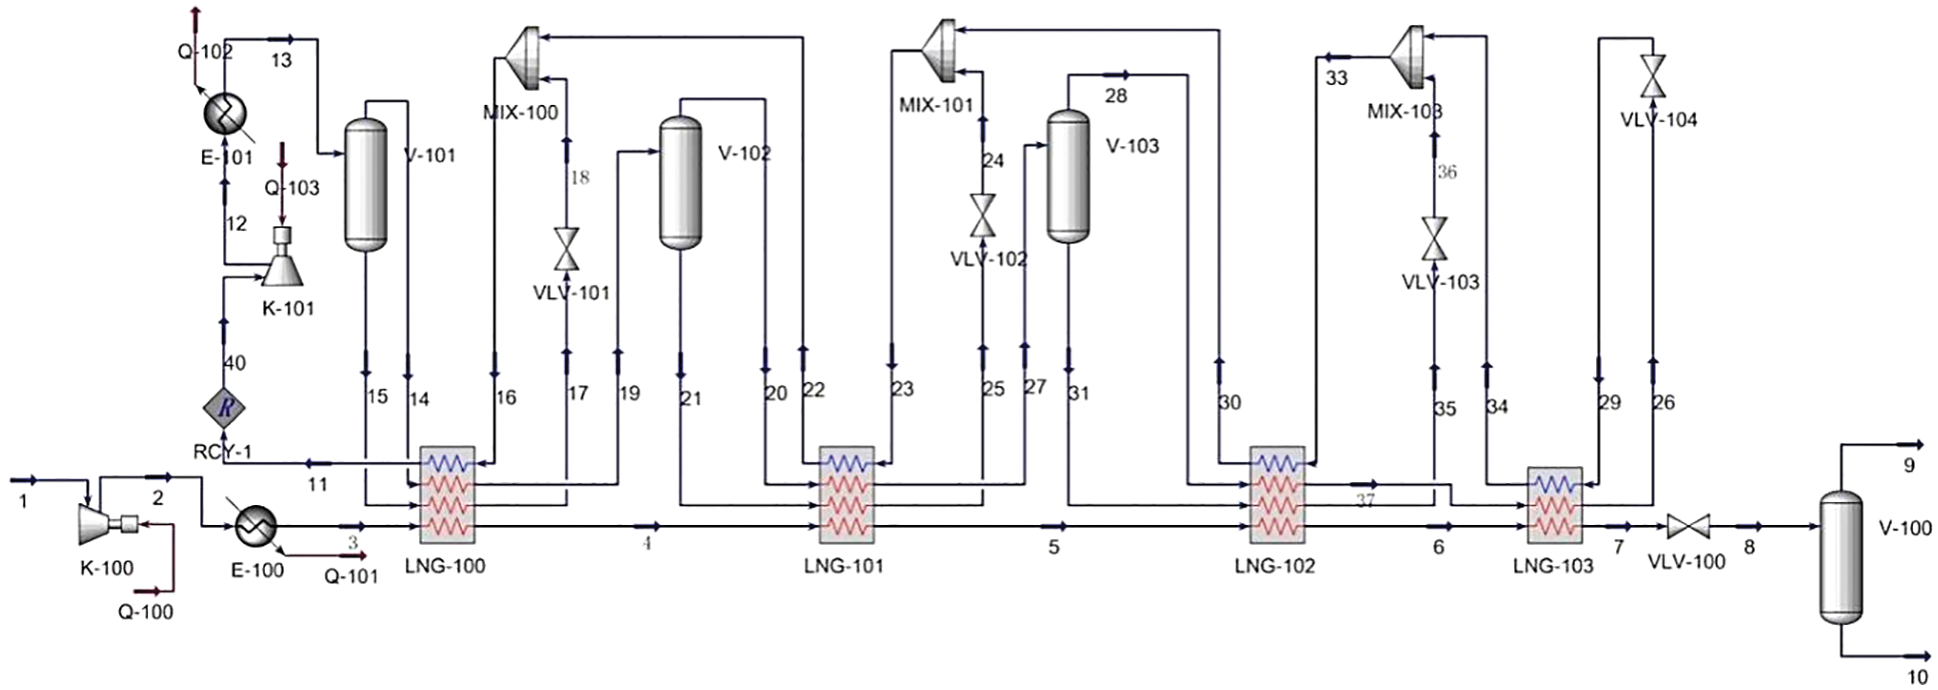
Figure 2: Process flow diagram of MRC
In the process of hydrogen-mixed natural gas cryogenic separation, the pretreated feed gas 1 passes through the compressor K-101 to increase the pressure, passes through the condenser E-101 to cool down to 25°C, enters into four LNG heat exchangers successively for cooling and liquefaction, and finally passes through VLV-100 to throttle down the temperature and pressure to −158°C, and enters V-100 to separate LNG and hydrogen-containing phase 9.
During the refrigeration cycle, compressor K-101 pressurizes refrigerant 11 to 26 bar and then cools it with water via condenser E-100. The gas phase 14 and liquid phase 15 separated by V-101 enter the LNG-100 heat exchanger, respectively. The liquid part is reduced to liquid phase 18 by throttling valve and mixed with reflux gas phase 22 in subsequent flow to provide cooling capacity for LNG-100 heat exchanger. The gas phase 14 is cooled by the LNG-100 heat exchanger, and then the gas phase 20 and liquid phase 21 are obtained by the separator V-102 and flow into the LNG-101 heat exchanger respectively. The liquid phase 21 is mixed with the reflux gas 30 after the heat exchanger, throttling, cooling and pressure reduction to provide cold capacity for the heat exchanger LNG-101, and the hydrogen-mixed natural gas is further cooled.
The gas phase 20 is cooled by the LNG-101 heat exchanger, and then the gas phase 28 and liquid phase 31 are obtained by the separator V-103 and flow into the LNG-102 heat exchanger respectively. The liquid phase 35 after cooling by the heat exchanger is mixed with the reflux gas 30 by the throttle valve VLV-103 to provide cold capacity for LNG-102. After heat exchange, the gas phase 37 is undercooled by the LNG-103 heat exchanger to obtain refrigerant 26, and then returned to the heat exchanger LNG-103 to cool hydrogen-mixed natural gas and refrigerant.
2.3 Propane Pre-Cooled Mixed Refrigerant Cryogenic Separation Process
More than 80% of the existing basic load LNG cryogenic separation units use propane pre-cooling and mixed refrigerant cryogenic separation process shown in Fig. 3. Combined with the advantages of cascade cryogenic separation process and mixed refrigerant cryogenic separation process, compared with MRC, the input cost is lower, the energy consumption is also less, and efficiency.
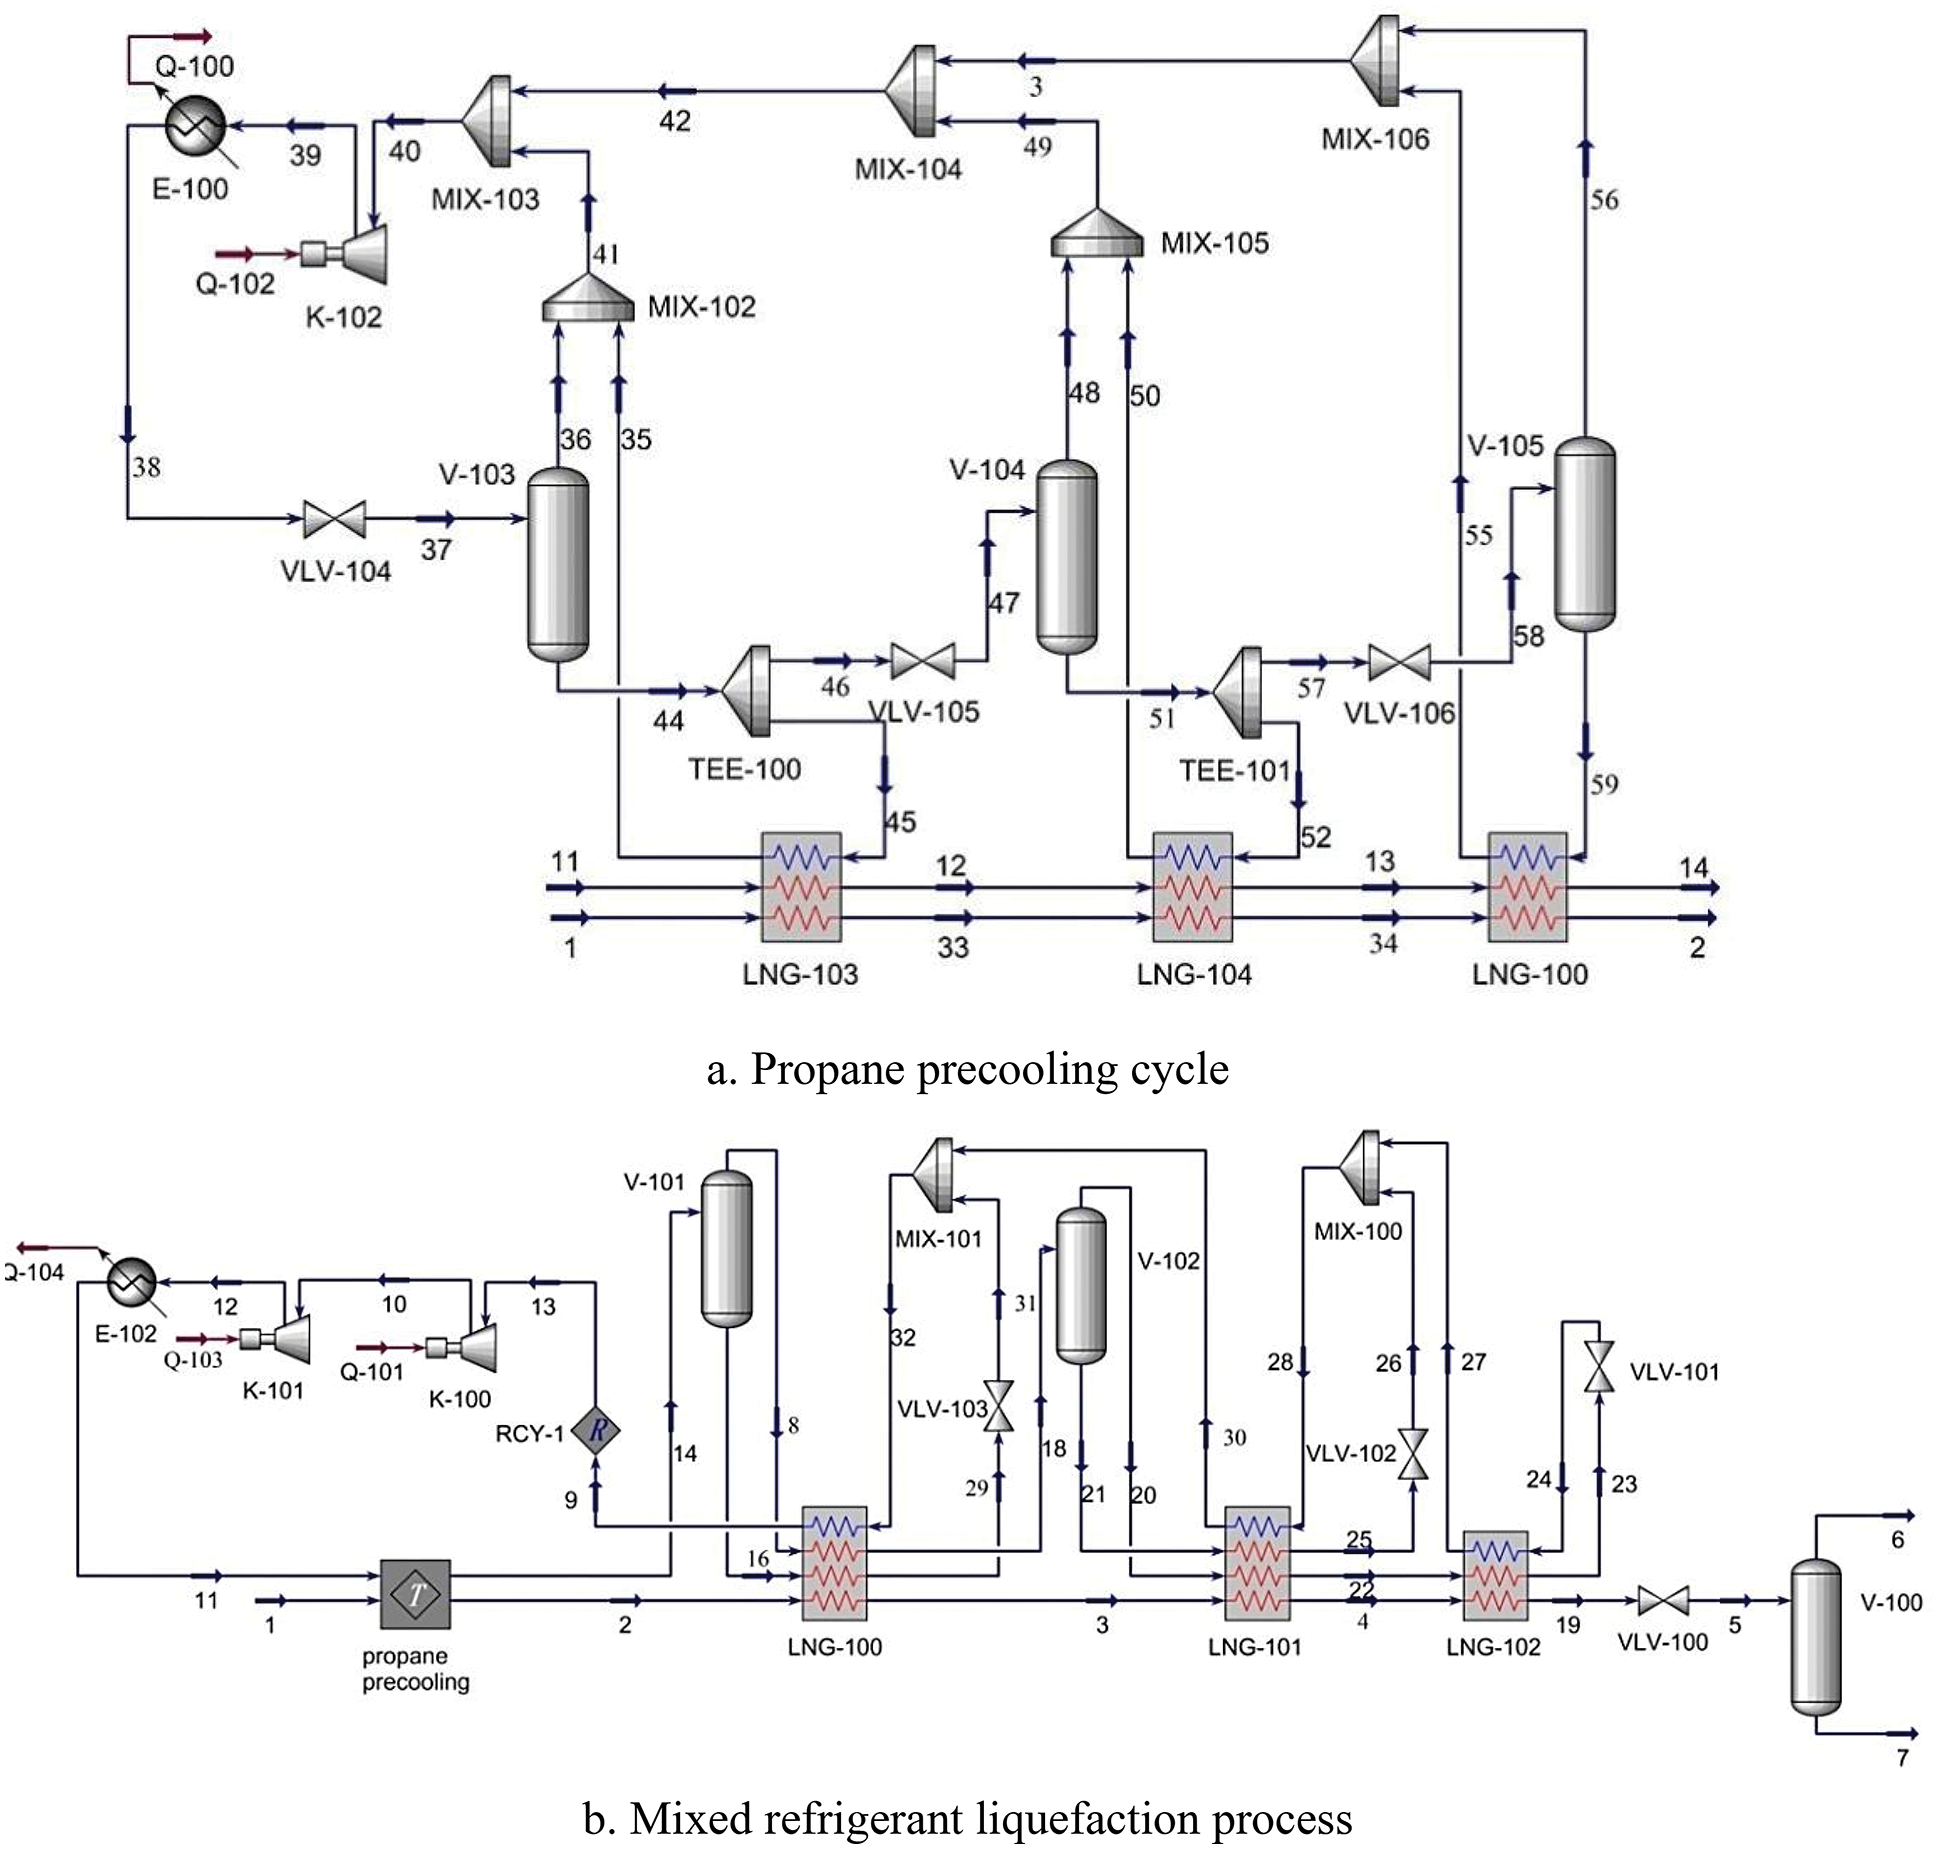
Figure 3: Process flow diagram of C3-MRC
The hydrogen-mixed natural gas is first pre-cooled by propane, then enters the LNG heat exchanger for cooling and undercooling, and finally enters the throttle valve for step-down cooling to −158°C, and then enters V-100 for separation to obtain LNG and hydrogen-containing phase 6.
The mixed refrigerant 9 is compressed to high pressure by compressors K-100 and K-101, and then cooled with water to remove part of the heat, and then precooled with propane. After pre-cooling, the liquid phase enters the gas-liquid separator and is separated into gas phase 8, and the liquid phase enters the LNG-100 for heat transfer, throttled by the throttle valve and mixed with the reflux gas to provide cold capacity for LNG-100.
After heat transfer in LNG-100, separated by the gas-liquid separator into gas phase 20 and liquid phase 21, and enters the LNG-101 for cooling, respectively. The gas phase 20 enters LNG-101 and LNG-102 in turn for heat exchange, and then is throttled and cooled by the throttle valve to provide cold energy for LNG-102. Then it is mixed with the liquid phase 25 after being heated by LNG-101 to provide cold energy for LNG-101.
The energy consumption and specific energy consumption created by cryogenic separation are essential elements in determining the input cost. Hydrogen separation and liquefaction rates are important criteria in evaluating the effect of the cryogenic separation process. The major assessment indices of separation by the cryogenic separation process cycle are energy consumption, specific energy consumption, liquefaction rate, and hydrogen separation efficiency.
The equipment in the cryogenic separation process is mainly compressors. Therefore, the energy consumption generated by the cryogenic separation process is defined as the sum of energy consumption of all compressors:
where
Specific energy consumption (SPE) is a parameter which is used to evaluate the LNG process energy consumption, which is defined as the required power to produce 1 kgmol of LNG [30]. Specific energy consumption is represented by Eq. (2):
where
Exergy analysis is used to determine how well environmental inputs are utilised. It primarily focuses on calculating exergy losses and exergy efficiency for each component and the system as a whole. The created cryogenic separation process underwent an exergy study to determine how irreversible each of the working processes was. The flow’s chemical and physical exergy rates alone, neglecting potential energy and kinetic exergy rates, make up the overall exergy rate [31].
The exergy losses of equipment can be expressed as the difference between all exergy flows entering and exiting the equipment. The input-output efficiency, which is expressed as the ratio between all exergy flows out of and into the device. The consumption-generated efficiency is used to calculate the exergy efficiency of each device, which allows a more accurate measure of energy quality and deviation from ideal [32].
Overall exergy balance equation is defined as
The exergy of unit mass fluid is defined as
The total exergy considered as the exergy of the stream, which is defined as
The exergy losses of the cryogenic separation process are the sum of the exergy losses of each piece of equipment. The irreversibility analysis of the process is based on exergy efficiency. The input-output efficiency approach is used to compute the exergy efficiency of each component in the system, which is stated as the ratio of exergy departing and exergy flowing into the component [33]. The exergy efficiency of the cryogenic separation process can be defined as the ratio of the input and outlet exergy changes of the cryogenic separation process to the actual input power for the cryogenic separation process:
Compressors, heat exchangers, and coolers are three key equipments in the cryogenic separation processes. Here, the exergy loss and exergy efficiency of the three key equipments will be defined.
For the compressor,
where,
For heat exchanger,
where,
For coolers,
where,
The purpose of process is to separate hydrogen and natural gas in hydrogen-mixed natural gas, so the effect of the hydrogen separation is one of the important evaluation indexes of cryogenic separation process. It is defined that the ratio between the hydrogen content in gas phase separated by process and the hydrogen content in feed gas is the hydrogen separation rate:
where,
In order to ensure the separation rate of hydrogen, the liquefaction effect of natural gas should also be ensured. Therefore, the liquefaction rate of natural gas is also an important evaluation index of the cryogenic separation process. Similar to the separation rate of hydrogen, the ratio between the methane content in liquid phase obtained after cryogenic separation and the methane content in feedstock gas is defined as the liquefaction rate, which is expressed by Eq. (4):
where,
4.1 Analysis of Cryogenic Separation Process Results with Different Hydrogen Fraction
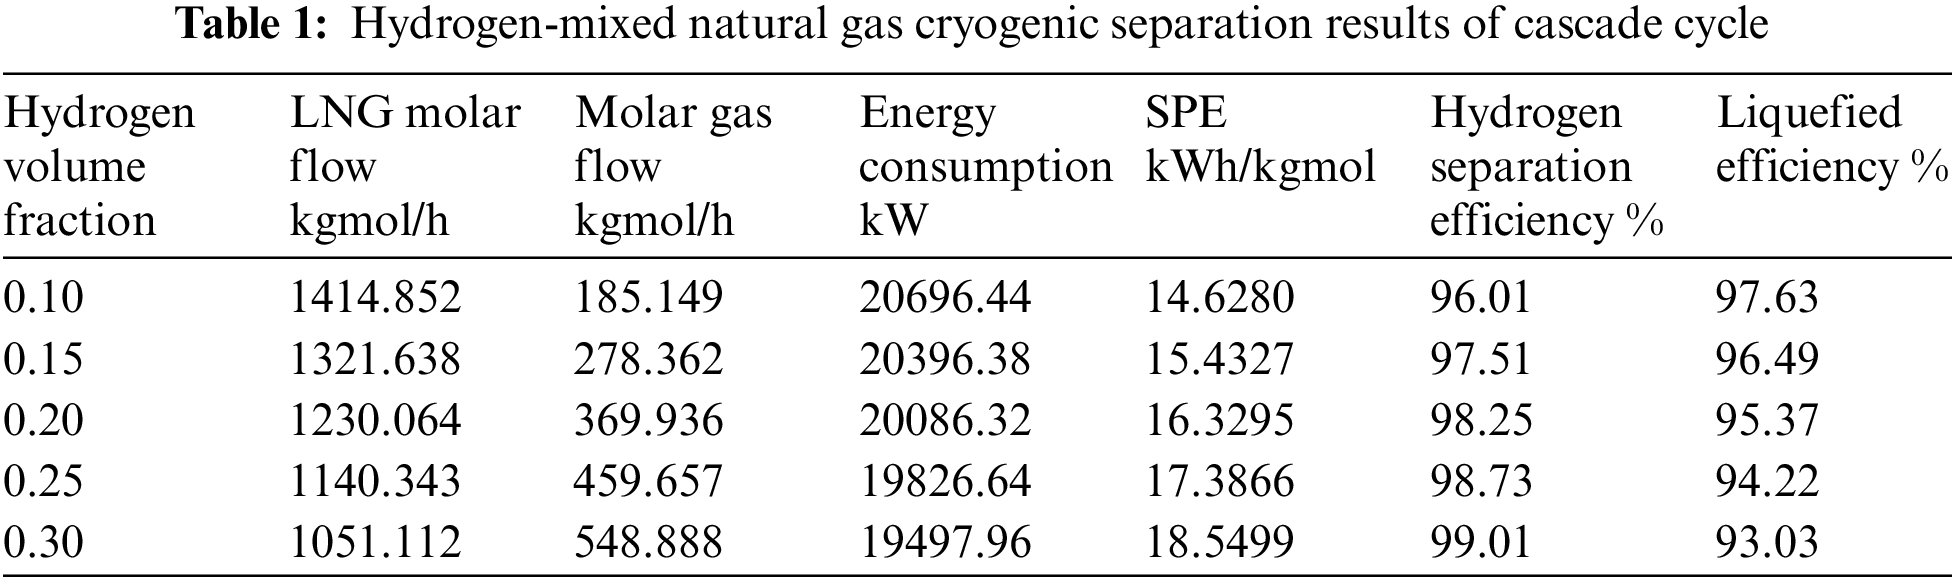
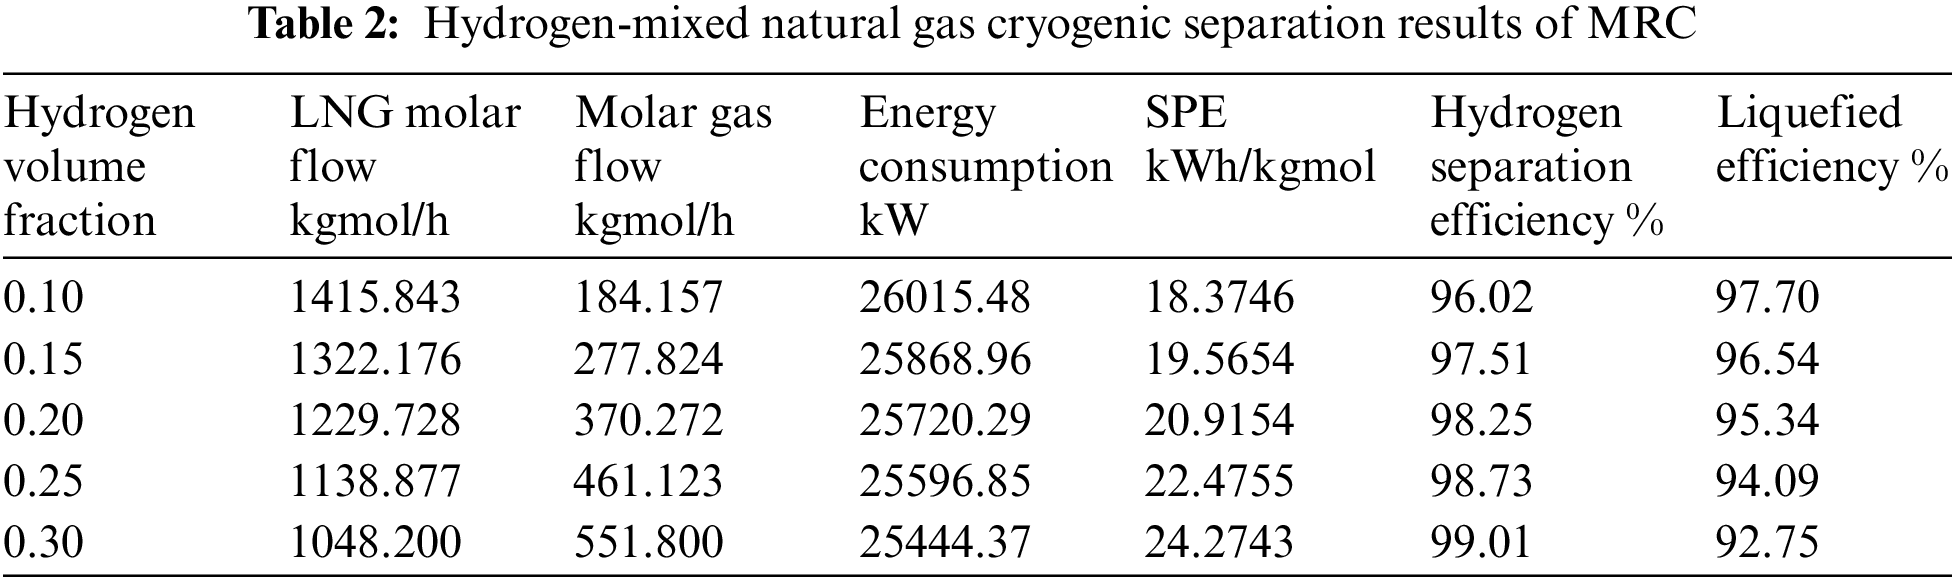
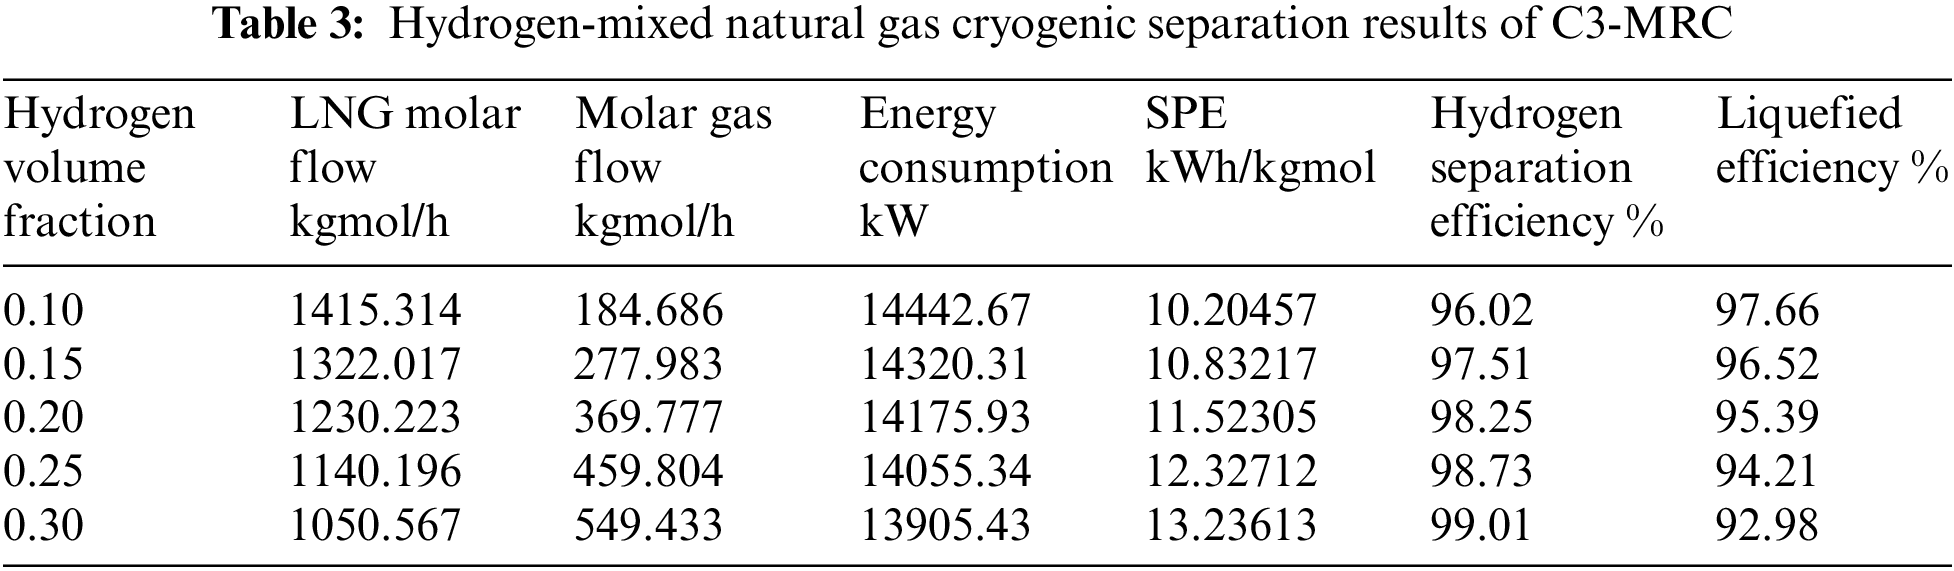
The simulation software ASPEN HYSYS was used to simulate the cryogenic separation of hydrogen-mixed natural gas with different hydrogen fraction under the conditions of pressure of 40 bar, temperature of 25°C and molar flow rate of 1600 kgmol/h. The separation results of three different cryogenic separation processes under different hydrogen fractions are shown in the Tables 1–3.
According to the Fig. 4, following cooling and pressure reduction via the throttle valve, there is minimal variation in LNG liquefaction efficiency and hydrogen separation efficiency between all three procedures under the same temperature and pressure settings. As the hydrogen fraction increases, the separation efficiency of hydrogen increases, and the liquefaction rate decreases.
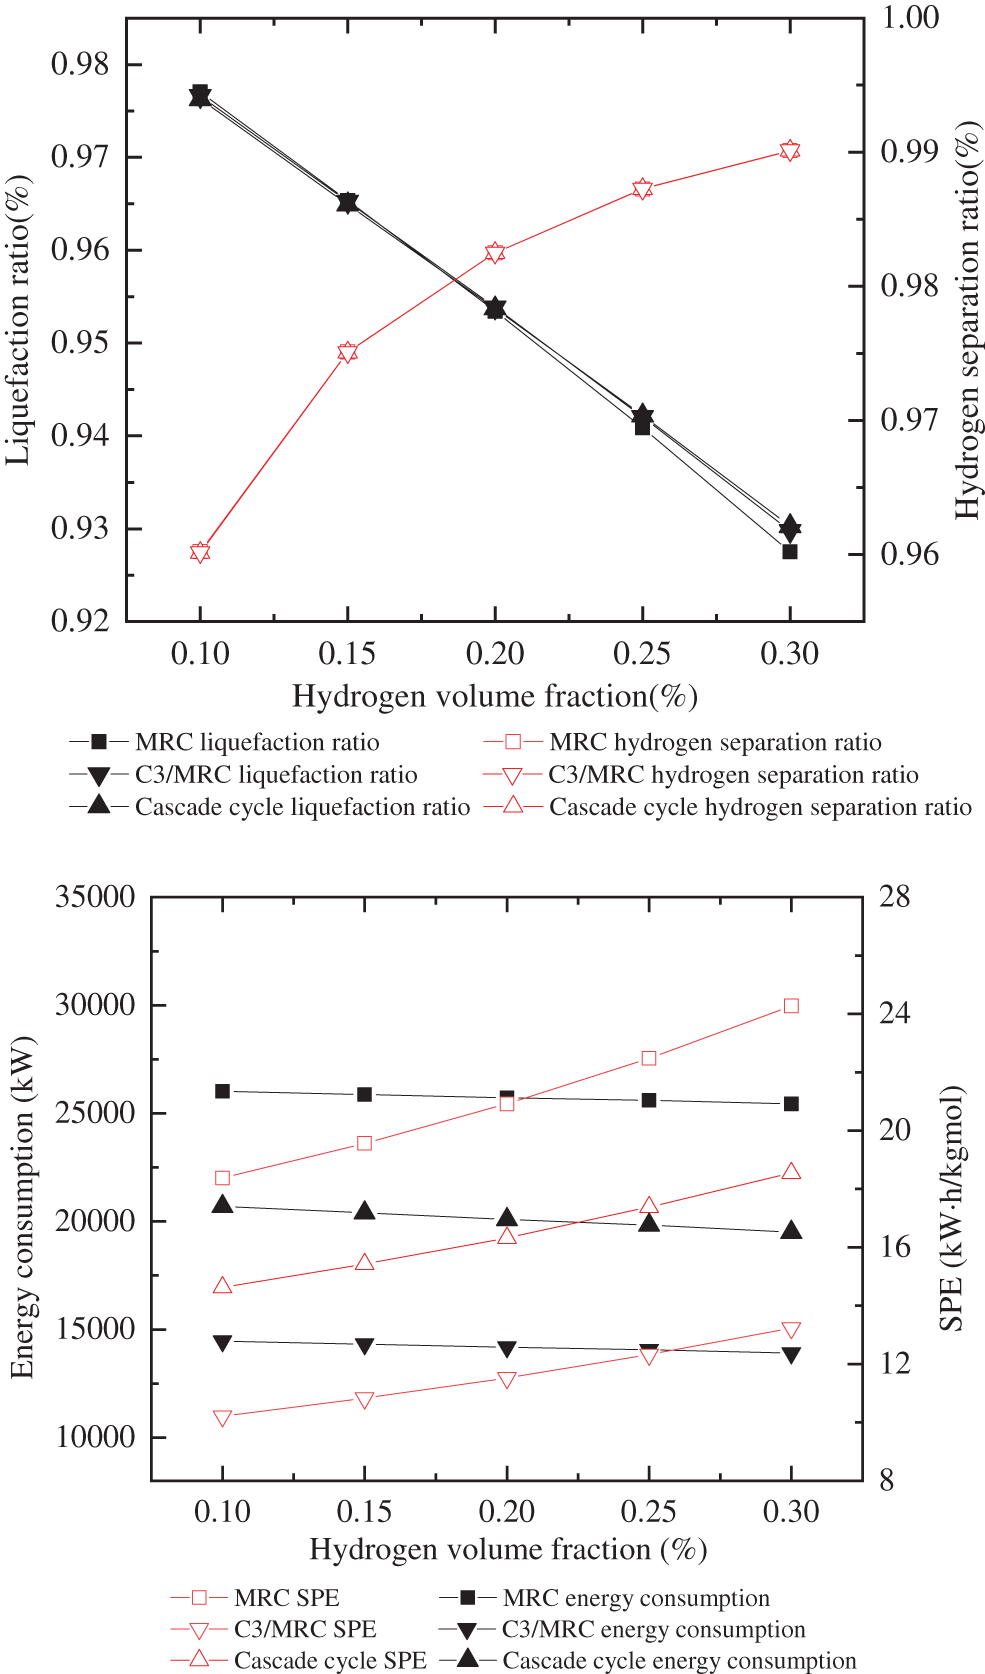
Figure 4: Comparison of cryogenic separation process results with different hydrogen fraction
Under the same conditions of reducing pressure by throttle valve to isothermal and isobaric, when hydrogen fraction is 10% and 15%, the liquefaction efficiency of MRC is 97.702% and 96.535%, the hydrogen separation rate is 96.021% and 97.51%, respectively. Compared with the other two cryogenic separation processes, the liquefaction efficiency and hydrogen separation efficiency of closed mixed refrigerant are higher. When hydrogen fraction is 20%, the liquefaction efficiency and hydrogen separation efficiency of propane precooling mixed refrigerant liquefaction process are the highest, which are 98.25% and 95.39%. When the ratio of hydrogen content reaches 25%, 30%, the cascade cryogenic separation process has the highest liquefaction and hydrogen separation efficiency. The C3-MRC process consumes less energy and has a lower SPE than the other two types.
Furthermore, when the hydrogen fraction of hydrogen-mixed natural gas grows, the hydrogen content increases, as does the gas phase molar flow following the cascade process, the liquid phase molar flow falls, resulting in lower energy consumption. As the hydrogen fraction increases, the content of hydrocarbons decreases. Because of the less proportion of hydrocarbons in the liquid phase obtained after cryogenic separation, and the energy required for liquefaction of hydrocarbons decreases. Because the liquid molar flow also decreases, the SPE increases. Witkowski et al. [34] analyzed the compression and transportation of hydrogen-mixed natural gas in existing natural gas pipelines and found that during the compression process, with the increase of hydrogen concentration, the total mass of the stream and the output of compressor energy consumption will be significantly reduced.
Exergy analysis is done on three hydrogen separation processes in different hydrogen volume fractions. Fig. 5 depicts the exergy losses and exergy efficiency of the three operations. The exergy losses of the three separation methods, independent of the hydrogen percentage, show that MRC has the largest exergy losses of the three. The coolers’ exergy losses are also the largest during the liquation cycle. Furthermore, when the hydrogen volume percentage grows, the exergy losses of three different types of liquation processes diminish. Although the number of compressors varies between the three cryogenic separation procedures, the exergy losses of the compressors are around 0.267–0.291 MW. The exergy losses of the heat exchangers in C3-MRC and MRC are more than the enthalpy difference of the compressor, but the converse is true in the cascade cryogenic separation process. Exergy losses should be reduced by altering the input and output stream temperatures of the coolers.
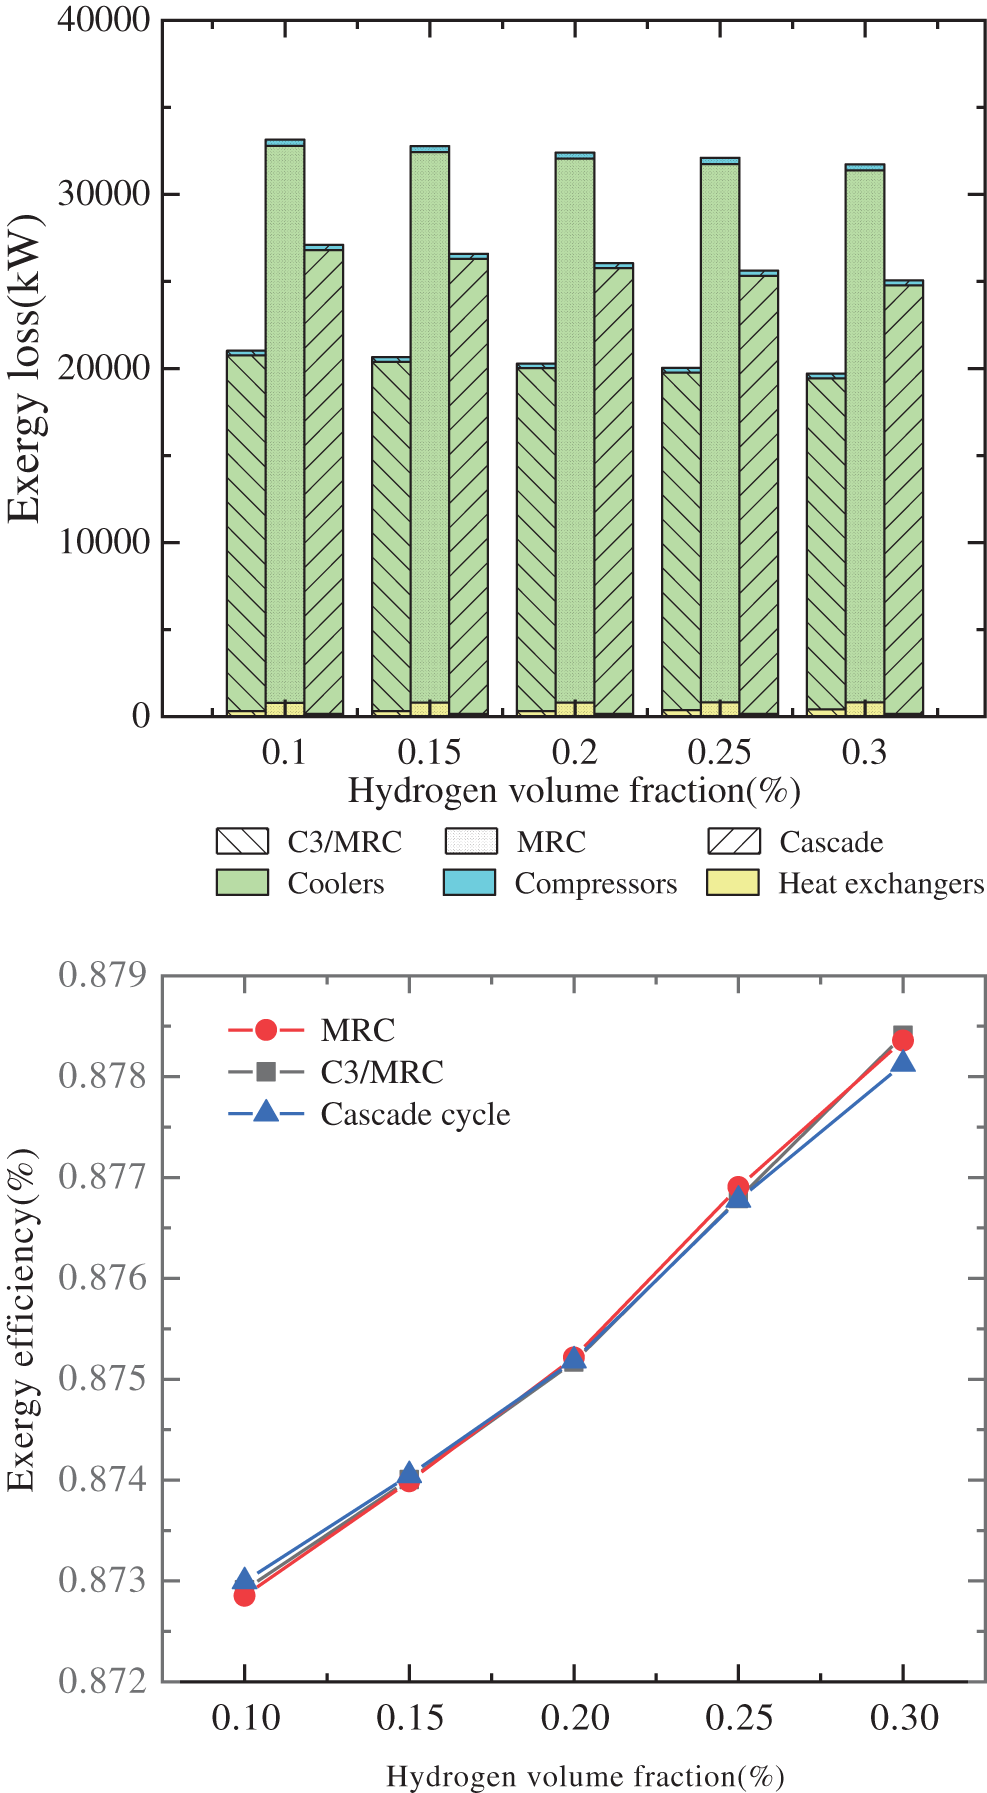
Figure 5: Exergy losses and exergy efficiency of each cryogenic separation process in different hydrogen fraction
The total exergy losses of C3-MRC liquation process are the least in different hydrogen fractions, which are 36.6% and 22.47% less than the other two liquation processes in 10% hydrogen fraction, 37% and 22.32% less in 15% fraction, 37.4% and 22.15% less in 20%, 37.59% and 21.77% less in 25% fraction, and 37.89% and 21.37% less in 30% hydrogen fraction.
Moreover, the exergy efficiency of C3-MRC are 87.68% and 88.06%, higher than the MRC and the cascade cryogenic separation process when the hydrogen fraction are 25% and 30%, which implies that in 25% and 30% fraction, C3-MRC is the most suitable cryogenic separation processes to separate the hydrogen from hydrogen-mixed natural gas.
4.3 Univariate Analysis of the Effect on Feed Gas Conditions
The conditions of the feed gas and the process equipment have a major impact on the energy consumption and liquefaction efficiency in the process of liquefaction and separation process. The following will analyze the different inlet temperatures, pressures, and flow rates of the feed gas.
4.3.1 Influence of Feed Gas Temperature on Cryogenic Separation Process
In the cryogenic separation process, due to the need of heat exchange with methane, ethylene, propane, condenser, heat exchanger, LNG heat exchanger and other heat exchange equipment, so the selection of feed gas temperature has a certain impact on the energy consumption of the overall cryogenic separation process.
Set the temperature as 10°C, 15°C, 20°C, 25°C, 30°C, and 35°C, the pressure of the feedstock gas was 40 bar, and the flow rate was 1600 kgmol/h.
Fig. 6 shows that, through modeling of feed gas temperature change, the liquefaction and hydrogen separation efficiency of the three processes under the same hydrogen percentage remain stable. The energy consumption and SPE rise with temperature. With the temperature increasing, the total amount of cooling required for LNG increases. Therefore, the enthalpy difference decreases, the refrigerant flow increases, and the energy consumption increase.
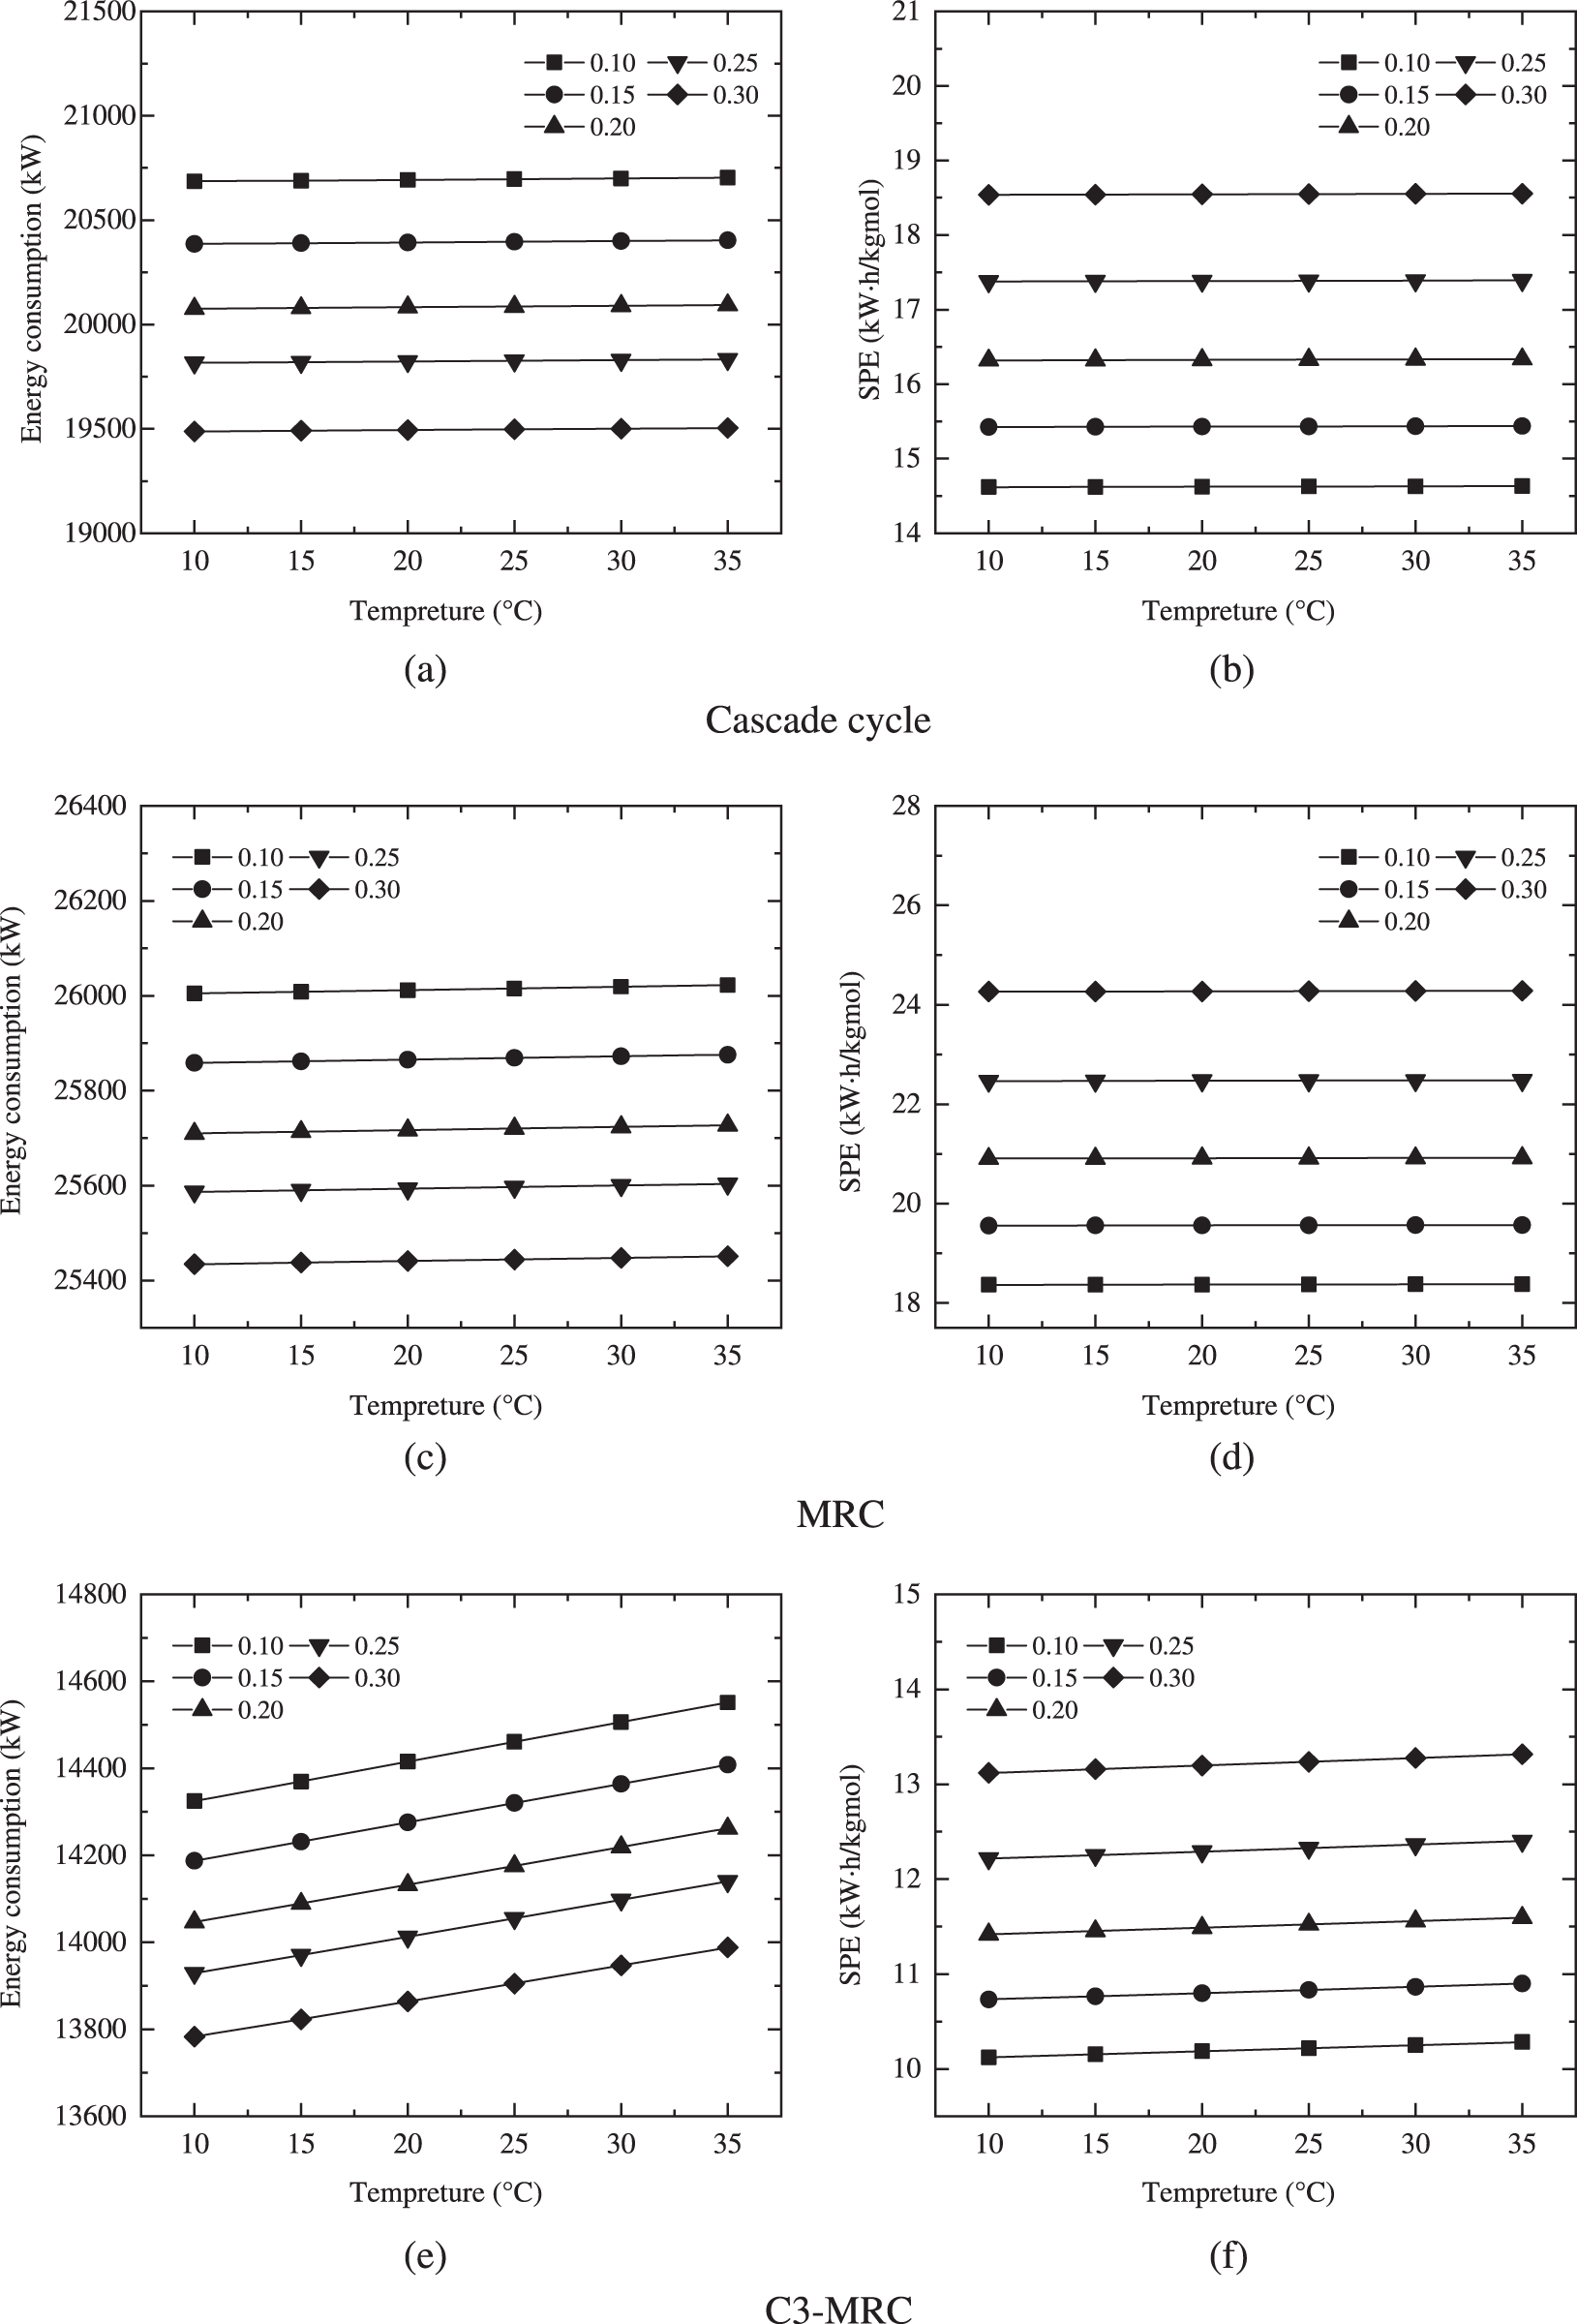
Figure 6: Variations of the energy consumption and SPE of different cryogenic separation processes
In the cascade cycle and the MRC, the feed gas temperature rises, raises the input temperature of the compressor, increasing compressor energy consumption and the total energy consumption of the cryogenic separation process. The temperature of the feed gas rises in the C3-MRC process, as does the temperature of the compressor in the propane cycle, the energy of the compressor in the propane precooling cycle, and the energy consumption and SPE of the entire process.
When the hydrogen fraction of C3-MRC is 0.3 and the temperature is 35°C, the energy consumption and SPE are 14140.18 kW and 12.40153 kWh/kgmol, which are still less than the minimum values of the other two cryogenic separation processes under temperature change.
4.3.2 Influence of Feed Gas Flow Rate on Cryogenic Separation Process
The flow rate is set as 1300, 1400, 1500, 1600, 1700, 1800 kgmol/h, temperature is 25°C, pressure is 40 bar. Comparate analysis of the hydrogen mixing ratio of different feed gases was carried out.
As seen in Fig. 7, increasing the feed gas flow increases the overall energy consumption of the cryogenic separation process. The efficiency of liquefaction and hydrogen separation unchanged. At the same time, because the range of change in energy consumption are minor as compared to the liquid molar flow rate after cryogenic separation, the SPE reduces as the feed gas flow rate increases. In comparison, the change in flow rate has less of an effect on the C3-MRC.
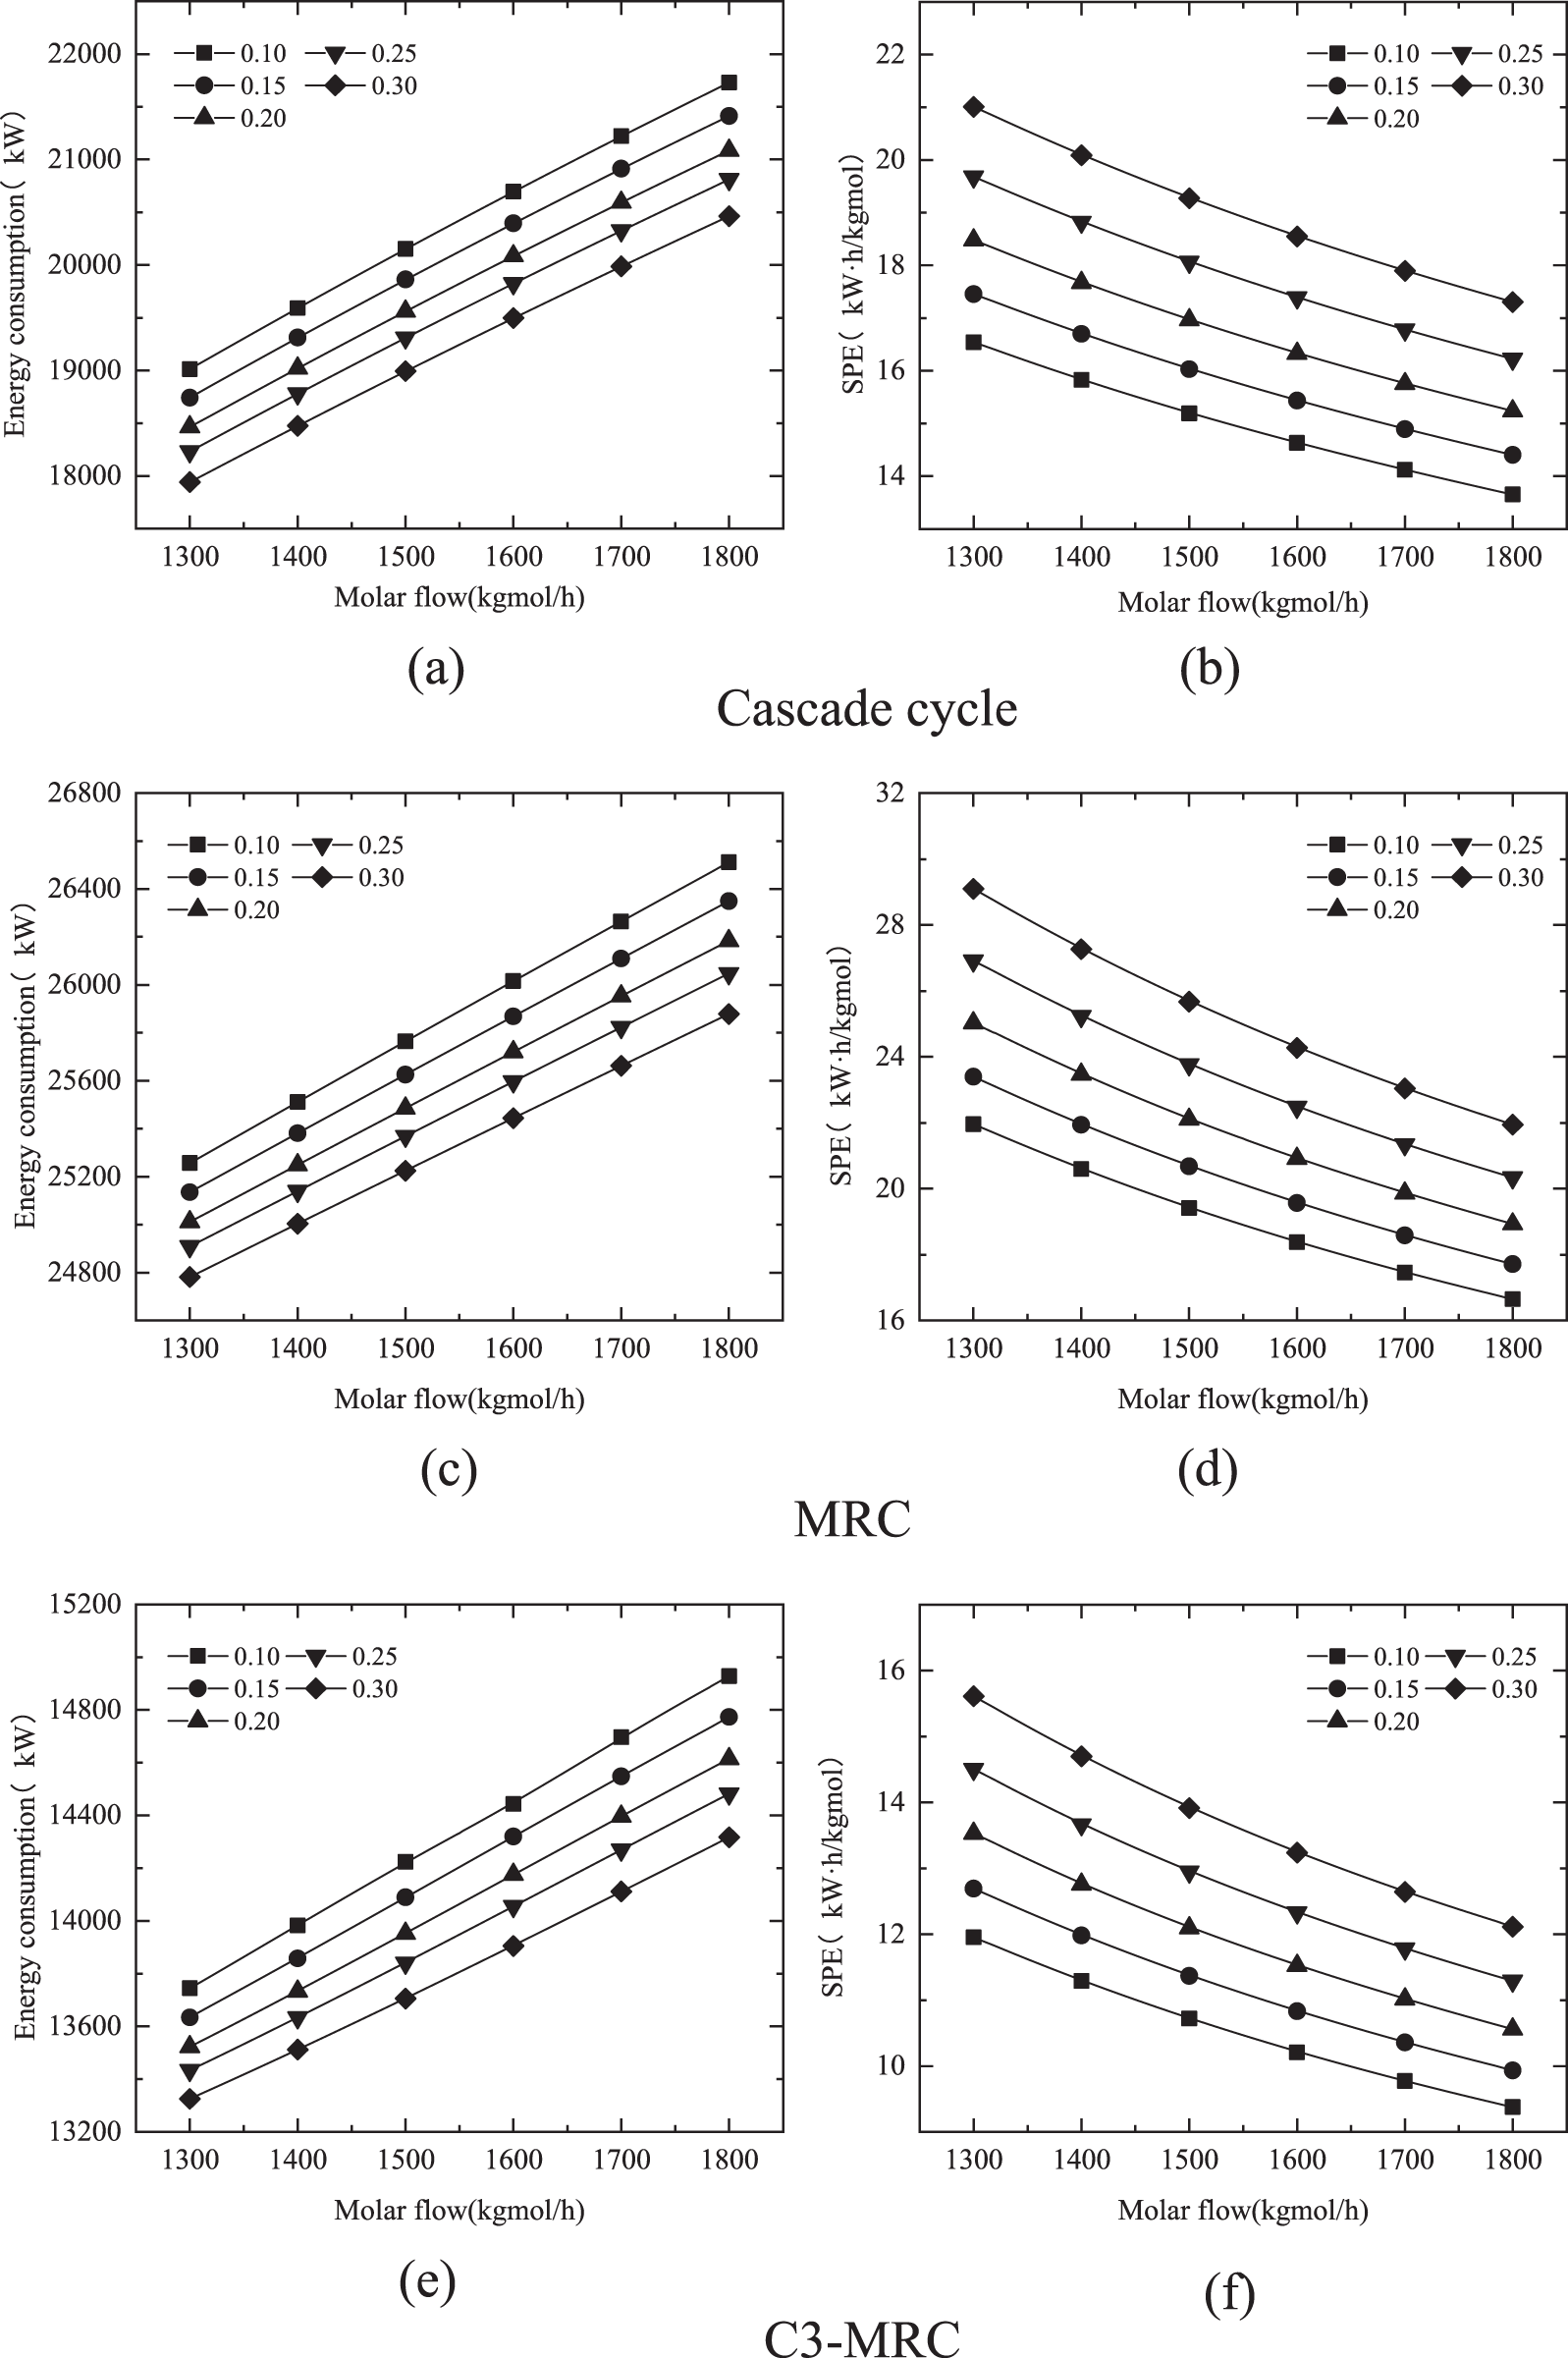
Figure 7: Variations of the energy consumption and SPE of different liquefaction processes by molar flow change
Under the condition that the flow rate is 1800 kgmol/h and the hydrogen fraction is 0.1, the energy consumption and specific energy consumption are 14482.14 kW and 11.29018 kWh/kgmol respectively are relatively lower when compared to the cascade cycle and MRC at 1300 kgmol/h and 0.1 hydrogen ratio.
4.3.3 Influence of Feed Gas Pressure on Cryogenic Separation Process
The temperature of the inlet feed gas is set as 25°C, the flow rate is 1600 kgmol/h. The pressure of the feed gas is set as 37, 38, 39, 40, 41 and 42 bar. Compared and analyzed the liquefaction rate, hydrogen separation rate, energy consumption and SPE of the whole cryogenic separation process with different hydrogen fractions as described above.
The enthalpy of the desired state remains constant after the natural gas is liquefied as the hydrogen-mixed natural gas intake pressure increases. As a result, the enthalpy difference between the intake and outlet states reduces, reducing the cooling capacity required to liquefy natural gas, the refrigerant flow, and the compressor’s power consumption proportionately to the refrigerant flow.
Furthermore, in the cascade cycle and MRC cryogenic separation procedures, the feed gas is compressed first. Under various feed gas pressure settings, as feed gas pressure grows, the pressure difference between the compressor’s intake and output decreases, as does the energy consumed by the cryogenic separation process and the specific power consumption. The Fig. 8 shows that the hydrogen separation and liquefaction efficiency do not vary when the pressure conditions of the input gas are modified in the simulation, and the molar flow rate of the LNG created after cryogenic separation remains unchanged. When a result, as power consumption is lowered, so does SPE.
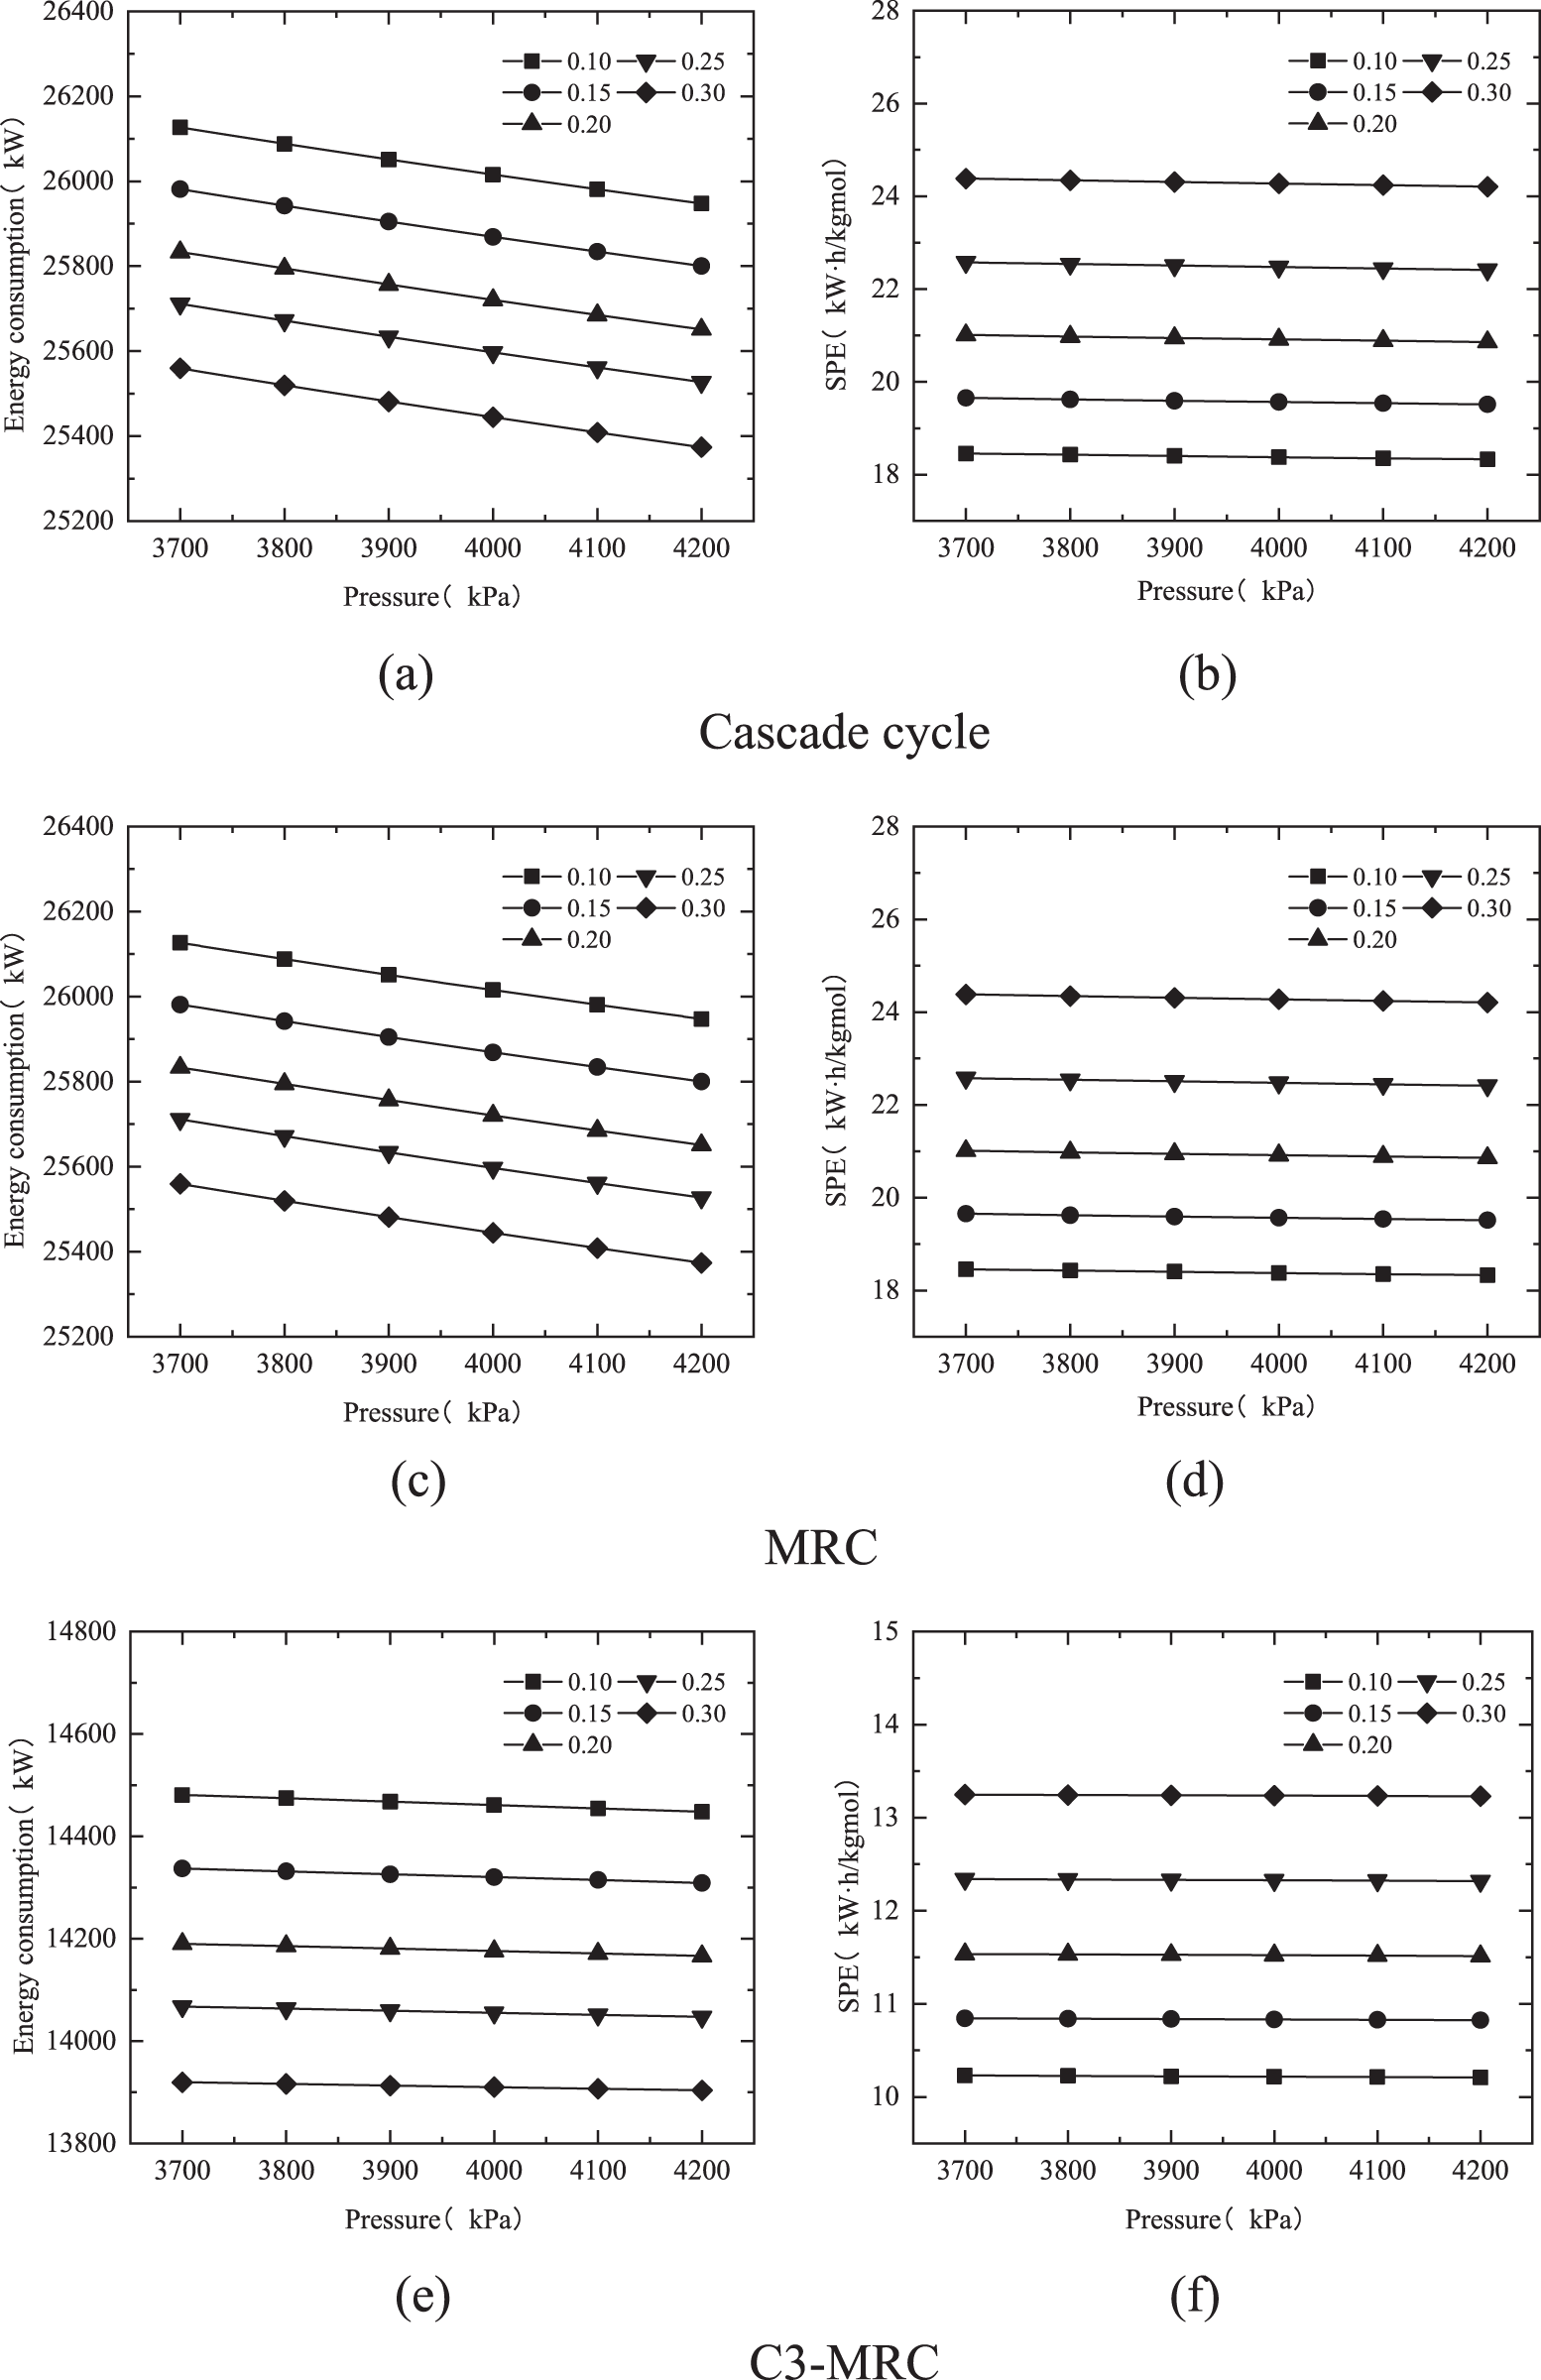
Figure 8: Variations of the energy consumption and SPE of different cryogenic separation processes by pressure
The energy consumption variance due by pressure change is less in the C3-MRC process than in the other two cryogenic separation processes. The temperature of propane entering the compressor in the propane precooling cycle rises as the feed gas pressure rises. The temperature of propane entering the compressor drops by around 0.1°C for every 100 kPa increase, resulting in a 3 kW increase in compressor energy usage. However, in the mixed refrigerant cryogenic separation cycle, as the feed gas pressure rises, the temperature of the refrigerant entering the two compressors falls, and so does the energy usage. The energy usage of the three compressors lowers as the pressure rises.
The pressure simulation of 37–42 bar in C3-MRC demonstrates that pressure fluctuations impact the liquefaction efficiency and hydrogen separation efficiency of the process. Unlike the other two cryogenic separation methods, the hydrogen-mixed natural gas in C3-MRC is pre-cooled by the three LNG heat exchangers in the propane pre-cooling process before exchanging heat with the heat exchanger in the mixed refrigerant cycle. With increasing pressure, the flow rate of hydrogen decreased first and then increased, and the flow rate of hydrogen increased first and then decreased after separate by cryogenic separation process. The contents of hydrogen and methane in the liquid phase and gas phase after cryogenic separation increased first and then decreased. So the liquefaction rate and hydrogen separation efficiency increase and subsequently drops as pressure increases, and the maximum inflection point appears at particular pressure settings. After extending the pressure fluctuation range to 30–50 bar, it was discovered that the maximum inflection point of liquefaction and hydrogen separation efficiency of the C3-MRC process rises with increasing hydrogen proportion, as does the maximum pressure value, shown in Fig. 9.
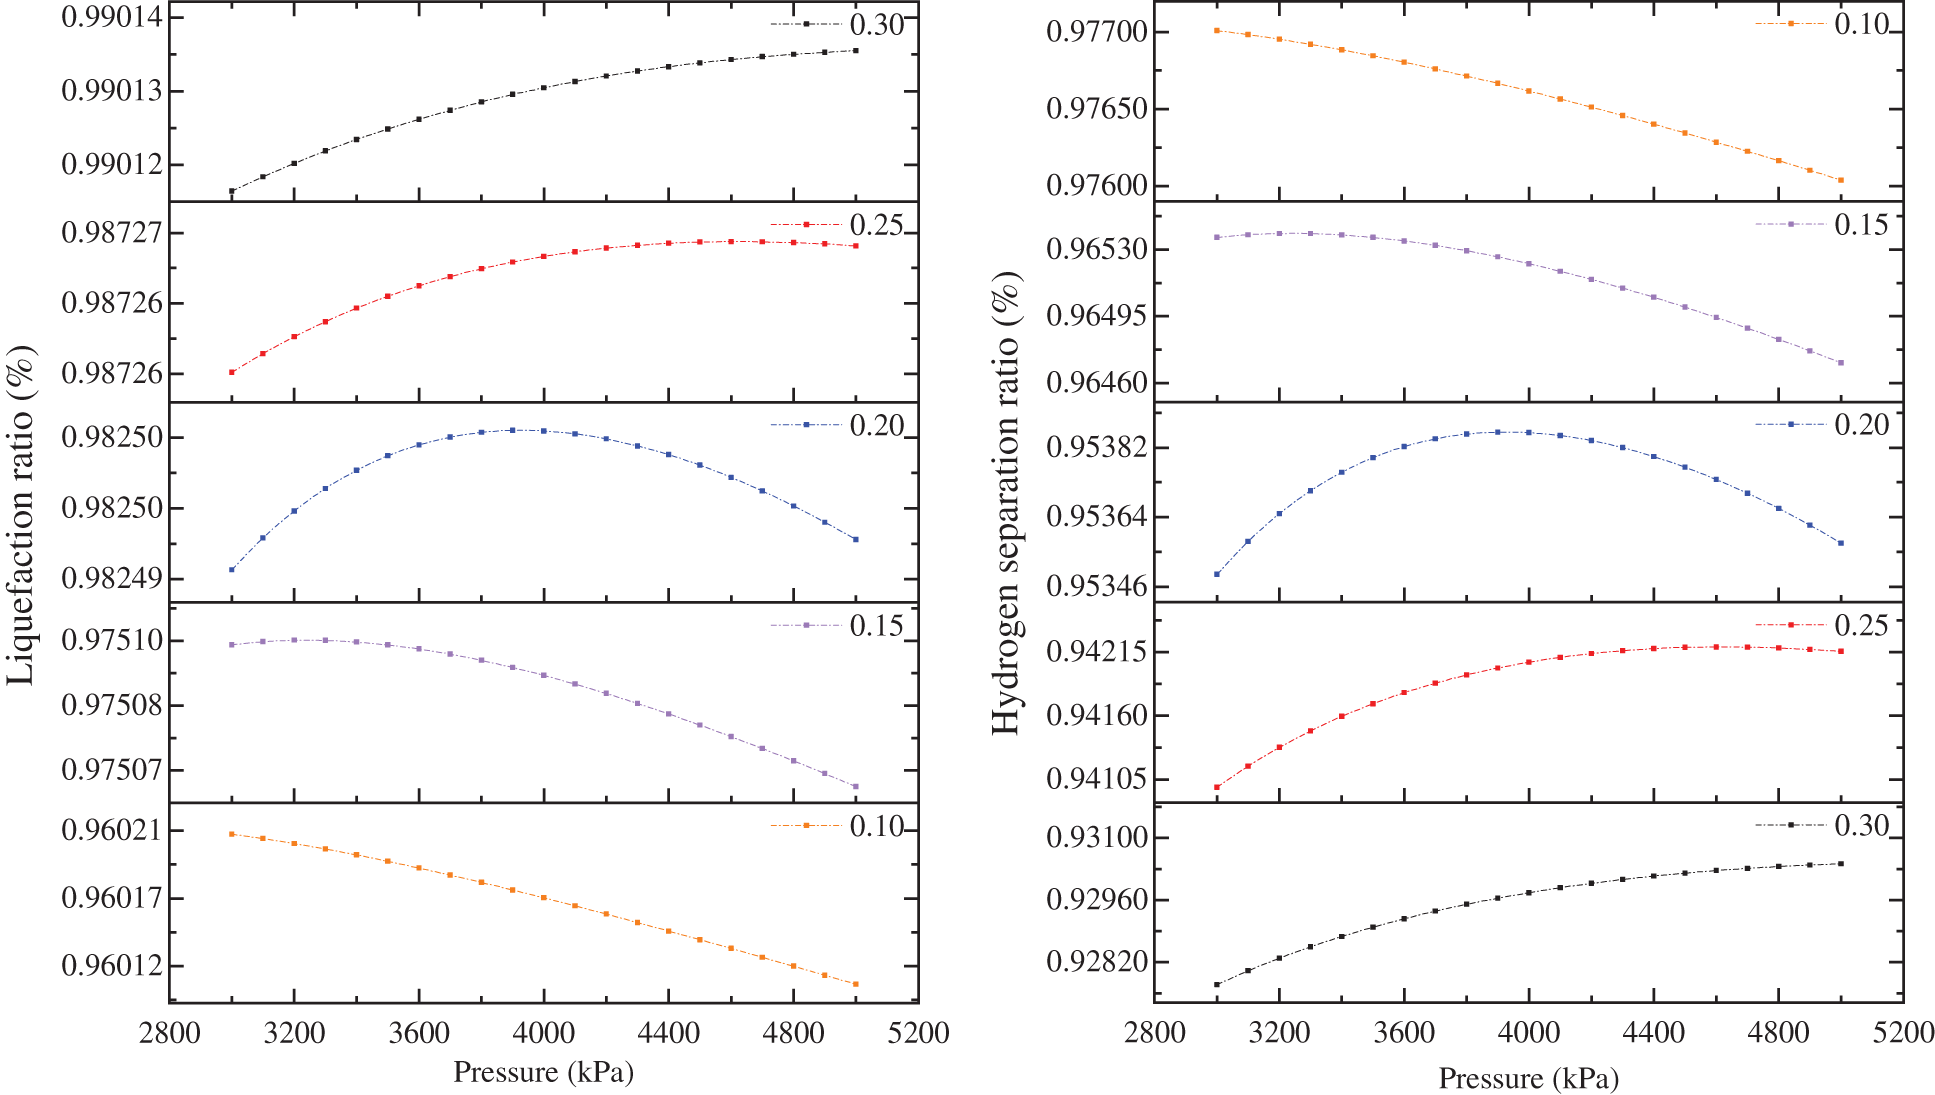
Figure 9: Variations of the hydrogen separation and liquefaction efficiency of C3-MRC process by pressure
Overall, efficiency changes curves for C3-MRC were illustrated in Fig. 8. There are inflection points in the cryogenic separation process when the hydrogen mixing ratio is 0.15 and the pressure is 30 bar, and the highest values of liquefaction and hydrogen separation efficiency are 0.965384 and 0.975096, respectively. When the hydrogen fraction is 0.2, the liquefaction and hydrogen separation efficiency of the cryogenic separation process under the pressure of 39 bar appear the maximum value of 0.95386 and 0.982502. When the hydrogen mixing ratio is 0.25, the maximum liquefaction and hydrogen separation efficiency of the cryogenic separation process are 0.942104 and 0.987269 under the pressure of 41 bar.
It is an efficient method of achieving large-scale hydrogen transport by delivering natural gas and hydrogen in the form of hydrogen-mixed natural gas through the pipe network. The present research directions for hydrogen-mixed natural gas are mostly focused on the directly utilized in the terminal and the effect of natural gas pipelines, such as hydrogen-mixed natural gas combustion performance, the influence of hydrogen fraction on natural gas pipelines, and hydrogen-mixed natural gas engines. The hydrogen-mixed natural gas is now separated mostly using physical methods such as membrane separation, PSA, and PSA-membrane coupling technologies. Although it is simple to use and has a high purity of hydrogen recovery, the recovery rate is modest. This study proposes liquefaction to separate the hydrogen-mixed natural gas. The energy consumption, hydrogen separation, and liquefaction rate produced by the cryogenic separation process for various volume fractions of hydrogen were examined based on the above-mentioned safety range of 0.1–0.3 hydrogen fraction employed in investigations. Further investigate the impact of intake feed gas pressure, temperature, and flow on the cryogenic separation process, and conduct a single factor analysis.
The hydrogen separation efficiency and specific energy consumption rise as the hydrogen fraction increases, while the natural gas liquefaction rate and energy consumption drop. As the pressure in the C3-MRC cryogenic separation process rises, the liquefaction and hydrogen separation efficiency rises and then falls. Under varied feed gas pressure settings, variable hydrogen content has the highest hydrogen separation rate and liquefaction rate. The 15%, 20%, and 25% hydrogen portions of hydrogen-mixed natural gas hydrogen separation efficiency and liquefaction efficiency are maximum at pressures of 32, 39, and 41 bar.
Under the same circumstances, the C3-MRC cryogenic separation process consumes 28.65% less energy and has a 45.57% lower SPE than the other two procedures. Furthermore, the C3-MRC has the lowest total exergy losses in different hydrogen fractions, which are 37.59% and 21.77% less in the 25% hydrogen fraction, and 37.89% and 21.37% less in the 30% hydrogen fraction. Furthermore, the exergy efficiency of C3-MRC is 87.68% and 88.06% when the hydrogen fraction is 25% and 30%, respectively, which indicates that in 25% and 30% fractions, it is better appropriate for cryogenic separation.
Funding Statement: The authors thank the supports from the Science and Technology Innovation Seedling Project of Sichuan Province, China (No. 2021079), and the School-Level Key Program of Chengdu Technological University, China (No. 210518).
Conflicts of Interest: The authors declare that they have no conflicts of interest to report regarding the present study.
References
1. Liu, B., Liu, S., Guo, S., Zhang, S. (2020). Economic study of a large-scale renewable hydrogen application utilizing surplus renewable energy and natural gas pipeline transportation in China. International Journal of Hydrogen Energy, 45(3), 1385–1398. DOI 10.1016/j.ijhydene.2019.11.056. [Google Scholar] [CrossRef]
2. Jingfa, L., Yue, S., Heng, Z. (2021). Research progresses on pipeline transportation of hydrogen-blended natural gas. Natural Gas Industry, 41(4), 137–152. DOI 10.3787/j.issn.1000-0976.2021.04.015. [Google Scholar] [CrossRef]
3. Di Lullo, G., Giwa, T., Okunlola, A., Davis, M., Mehedi, T. et al. (2022). Large-scale long-distance land-based hydrogen transportation systems: A comparative techno-economic andgreenhouse gas emission assessment. International Journal of Hydrogen Energy, 7(83), 35293–35319. DOI 10.1016/j.ijhydene.2022.08.131. [Google Scholar] [CrossRef]
4. Sorgulu, F., Dincer, I. (2022). Analysis and techno-economic assessment of renewable hydrogen production and blending into natural gas for better sustainability. International Journal of Hydrogen Energy, 47(46), 19977–19988. DOI 10.1016/j.ijhydene.2022.04.133. [Google Scholar] [CrossRef]
5. Atanasiu, M. (2015). The status of SOFC R&D in the fuel cell and hydrogen joint undertaking program. ECS Transactions, 68(1), 3–14. DOI 10.1149/06801.0003ecst. [Google Scholar] [CrossRef]
6. Fan, Z., Ma, T., Li, W., Wang, S., Mao, Z. et al. (2017). A comparison of hydrogen-enriched natural gas (HCNG) and compressed natural gas (CNGBased on ANOVA models. International Journal of Hydrogen Energy, 42(50), 30029–30036. DOI 10.1016/j.ijhydene.2017.08.187. [Google Scholar] [CrossRef]
7. Quarton, C. J., Samsatli, S. (2020). Should we inject hydrogen into gas grids? Practicalities and whole-system value chain optimisation. Applied Energy, 275(6396), 115172. DOI 10.1016/j.apenergy.2020.115172. [Google Scholar] [CrossRef]
8. Chengshang, Z., Tongwen, H., Huang, L., Yong, L. (2021). Research progress of hydrogen transport technology for blended hydrogen natural gas. Journal of Central South University (Science and Technology), 52(1), 31–43. DOI 10.11817/j.issn.1672-7207.2021.01.004. [Google Scholar] [CrossRef]
9. Zareei, J., Haseeb, M., Ghadamkheir, K., Farkhondeh, S. A., Yazdani, A. et al. (2020). The effect of hydrogen addition to compressed natural gas on performance and emissions of a DI diesel engine by a numerical study. International Journal of Hydrogen Energy, 45(58), 34241–34253. DOI 10.1016/j.ijhydene.2020.09.027. [Google Scholar] [CrossRef]
10. Hao, D., Mehra, R. K., Luo, S., Nie, Z., Ren, X. et al. (2020). Experimental study of Hydrogen-mixed natural gas (HCNG) engine and application of support vector machine (SVM) on prediction of engine performance at specific condition. International Journal of Hydrogen Energy, 45(8), 5309–5325. DOI 10.1016/j.ijhydene.2019.04.039. [Google Scholar] [CrossRef]
11. Pandey, V., Guluwadi, S., Tafesse, G. H. (2022). Performance and emission study of low HCNG fuel blend in SI engine with fixed ignition timing. Cogent Engineering, 9(1), 2010925. DOI 10.1080/23311916.2021.2010925. [Google Scholar] [CrossRef]
12. Prasad, R. K., Agarwal, A. K. (2021). Effect of hydrogen enrichment of compressed natural gas on combustible limit and flame kernel evolution in a constant volume combustion chamber using laser ignition. Fuel, 302(8), 121112. DOI 10.1016/j.fuel.2021.121112. [Google Scholar] [CrossRef]
13. Huang, M., Wu, Y., Wen, X. Z., Liu, W. B., Guan, Y. W. (2013). Feasibility analysis of hydrogen transport in natural gas pipeline. Gas & Heat, 33(4), 39–42. DOI 10.3969/j.issn.1000-4416.2013.04.010. [Google Scholar] [CrossRef]
14. Wang, W., Wang, Q. Y., Deng, H. Q., Cheng, G. X., Li, Y. (2020). Feasibility analysis on the transportation of hydrogen-natural gas mixtures in natural gas pipelines. Natural Gas Industry, 40(3), 130–136. DOI CNKI:SUN:TRQG.0.2020-03-025. [Google Scholar]
15. Shen, D. D., Yao, C. H., Liu, J. J. (2022). Application and key technology research on HCNG under background of carbon neutrality. Shanghai Energy Conservation, (3), 277–282. DOI 10.13770/j.cnki.issn2095-705x.2022.03.006. [Google Scholar] [CrossRef]
16. Yang, J., Lee, C. H., Chang, J. W. (1997). Separation of hydrogen mixtures by a two-bed pressure swing adsorption process using zeolite 5A. Industrial and Engineering Chemistry, 36(7), 2789e98. DOI 10.1021/ie960728h. [Google Scholar] [CrossRef]
17. di Marcoberardino, G., Vitali, D., Spinelli, F., Binotti, M. (2018). Green hydrogen production from raw biogas: A techno-economic investigation of conventional processes using pressure swing adsorption unit. Processes, 6(3), 19. DOI 10.3390/pr6030019. [Google Scholar] [CrossRef]
18. Yue, Q., Suyang, Z., Wei, G., Guangsheng, P., Xiaogang, C. (2022). Application prospect analysis of hydrogen-mixed natural gas technologies under the target of carbon emission peak and carbon neutrality. Proceedings of the CSEE, 42(4), 1301–1321. DOI 10.13334/j.0258-8013.pcsee.211614. [Google Scholar] [CrossRef]
19. Nordio, M., Wassie, S. A., Annaland, M. V. S., Tanaka, D. A. P., Sole, J. L. V. et al. (2021). Techno-economic evaluation on a hybrid technology for low hydrogen concentration separation and purification from natural gas grid. International Journal of Hydrogen Energy, 46(45), 23417–23435. DOI 10.1016/j.ijhydene.2020.05.009. [Google Scholar] [CrossRef]
20. Zhang, Z. J., Zheng, B. G. (2018). Study on pressure swing adsorption method for purifying hydrogen. Chemical Engineering Design Communications, 44(5), 155. [Google Scholar]
21. Liemberger, W., Halmschlager, D., Miltner, M., Harasek, M. (2019). Efficient extraction of hydrogen transported as co-stream in the natural gas grid–The importance of process design. Applied Energy, 233(2), 747–763. DOI 10.1016/j.apenergy.2018.10.047. [Google Scholar] [CrossRef]
22. Rajnauth, J. J., Ayeni, K. B., Barrufet, M. A. (2008). Gas transportation: Present and future. CIPC/SPE Gas Technology Symposium 2008 Joint Conference, OnePetro, Calgary. DOI 10.2118/114935-MS. [Google Scholar] [CrossRef]
23. Vatani, A., Mehrpooya, M., Palizdar, A. (2014). Energy and exergy analyses of five conventional liquefied natural gas processes. International Journal of Energy Research, 38(14), 1843–1863. DOI 10.1002/er.3193. [Google Scholar] [CrossRef]
24. Geng, J. B., Ji, Q., Fan, Y. (2014). A dynamic analysis on global natural gas trade network. Applied Energy, 132(2), 23–33. DOI 10.1016/j.apenergy.2014.06.064. [Google Scholar] [CrossRef]
25. Vatani, A., Mehrpooya, M., Palizdar, A. (2014). Energy and exergy analyses of five conventional liquefied natural gas processes. International Journal of Energy Research, 38(14), 1843–1863. DOI 10.1002/er.3193. [Google Scholar] [CrossRef]
26. Lin, W., Xu, J., Zhang, L., Gu, A. (2017). Synthetic natural gas (SNG) liquefaction processes with hydrogen separation. International Journal of Hydrogen Energy, 42(29), 18417–18424. DOI 10.1016/j.ijhydene.2017.04.141. [Google Scholar] [CrossRef]
27. Wang, Y. F., Zhang, L. (2015). Hydrogen purification process and technology selection. Chemical Engineering Research and Design, 25, 14–17. DOI 10.3969/j.issn.1007-6247.2015.02.005. [Google Scholar] [CrossRef]
28. Shen, G. L., Chen, Y., Wu, M. (2003). Selection of recovery process for hydrogen in domestic refinery gases. Chemical Engineering of Oil and Gas, 15(4), 193–196+4. DOI 10.1007/BF02974893. [Google Scholar] [CrossRef]
29. Gu, A. Z. (2018). LNG technical manual. China: China Machine Press. [Google Scholar]
30. Ghorbani, B., Hamedi, M. H., Amidpour, M., Mehrpooya, M. (2016). Cascade refrigeration systems in integrated cryogenic natural gas process (natural gas liquids (NGLliquefied natural gas (LNG) and nitrogen rejection unit (NRU)). Energy, 115(2), 88–106. DOI 10.1016/j.energy.2016.09.005. [Google Scholar] [CrossRef]
31. Bian, J., Yang, J., Liu, Y., Li, Y., Cao, X. (2022). Analysis and efficiency enhancement for energy-saving re-liquefaction processes of boil-off gas without external refrigeration cycle on LNG carriers. Energy, 239, 122082. DOI 10.1016/j.energy.2021.122082. [Google Scholar] [CrossRef]
32. Bian, J., Yang, J., Li, Y., Chen, Z., Liang, F. et al. (2021). Thermodynamic and economic analysis of a novel hydrogen liquefaction process with LNG precooling and dual-pressure Brayton cycle. Energy Conversion and Management, 250(5), 114904. DOI 10.1016/j.enconman.2021.114904. [Google Scholar] [CrossRef]
33. Yin, L., Ju, Y. (2020). Comparison and analysis of two processes for BOG re-liquefaction in LNG carrier with normal-temperature compressor. International Journal of Refrigeration, 115(2–3), 9–17. DOI 10.1016/j.ijrefrig.2020.03.008. [Google Scholar] [CrossRef]
34. Witkowski, A., Rusin, A., Massjkut, M., Stolecka, K. (2018). Analysis of compression and transport of the methane/hydrogen mixture in existing natural gas pipelines. International Journal of Pressure Vessels and Piping, 166(10–11), 24–34. DOI 10.1016/j.ijpvp.2018.08.002. [Google Scholar] [CrossRef]
Cite This Article
 Copyright © 2023 The Author(s). Published by Tech Science Press.
This work is licensed under a Creative Commons Attribution 4.0 International License , which permits unrestricted use, distribution, and reproduction in any medium, provided the original work is properly cited.
 Downloads
 Citation Tools