
 Submit a Paper
 Propose a Special lssue
 Open Access
ARTICLE

Optimal Configuration Method for the Installed Capacity of the Solar-Thermal Power Stations
1 School of New Energy and Power Engineering, Lanzhou Jiaotong University, Lanzhou, China
2 Electric Power Research Institute, State Grid Gansu Electric Power Company, Lanzhou, China
* Corresponding Author: Haiying Dong. Email:
Energy Engineering 2023, 120(4), 949-963. https://doi.org/10.32604/ee.2023.025668
Received 25 July 2022; Accepted 14 October 2022; Issue published 13 February 2023
 View Full Text
 Download PDF
Abstract
Because of the randomness of wind power and photovoltaic (PV) output of new energy bases, the problem of peak regulation capability and voltage stability of ultra-high voltage direct current (UHVDC) transmission lines, we proposed an optimum allocation method of installed capacity of the solar-thermal power station based on chance constrained programming in this work. Firstly, we established the uncertainty model of wind power and PV based on the chance constrained planning theory. Then we used the K-medoids clustering method to cluster the scenarios considering the actual operation scenarios throughout the year. Secondly, we established the optimal configuration model based on the objective function of the strongest transient voltage stability and the lowest overall cost of operation. Finally, by quantitative analysis of actual wind power and photovoltaic new energy base, this work verified the feasibility of the proposed method. As a result of the simulations, we found that using the optimal configuration method of solar-thermal power stations could ensure an accurate allocation of installed capacity. When the installed capacity of the solar-thermal power station is 1 × 10⁶ kW, the transient voltage recovery index (TVRI) is 0.359, which has a strong voltage support capacity for the system. Based on the results of this work, the optimal configuration of the installed capacity of the solar-thermal power plant can improve peak shaving performance, transient voltage support capability, and new energy consumption while satisfying the Direct Current (DC) outgoing transmission premise.Keywords
According to the roadmap for the development of renewable energy in China, it is planned that the installed capacity of the solar-thermal power station will reach 500 GW by 2050 [1]. The solar-thermal power will replace part of the thermal power peak shaving power supply and promote the development of new energy bases. Due to the obvious uncertainty and volatility of wind power and photovoltaic (PV) [2–4], large-scale grid connection will have an impact on system operation [5–7]. Gansu has a large proportion of new energy installed capacity, and the power grid is fragile. Taking Jiuquan-Hunan ±800 kV ultra-high voltage direct current (UHVDC) transmission as an example, its power transmission capacity is insufficient, the construction of peak regulating power supply is not synchronous, and it cannot meet the DC transmission demand of Hunan in evening peak hours [8]. The solar-thermal power station uses the same turbine as conventional thermal power, which can improve the rotational inertia of the power system and the safety and stability of the system [9]. How configure the installed capacity of the solar-thermal power station to enhance the peak load regulation effect and transient voltage support capacity on the premise of meeting the DC transmission demand is the key to building a renewable energy base.
At present, there has been much research on the capacity optimization configuration of solar-thermal power stations. In the literature [10], a two-level optimal dispatching model was developed for the participation of a high energy-carrying load as a dispatchable resource in the new energy complementary power generation system, taking into account the wind and light resource consumption, and the model was solved by NSGA-II and binary particle swarm algorithm. The results show that the participation of the solar-thermal power plant reduces the output power fluctuation by 65.8% and the wind and light abandonment by 86.3%. In the literature [11], a source-grid-load multi-time coordinated optimization method considering wind-light-thermal combined DC outfeed was proposed. To minimize the comprehensive operating cost of the system, the source-grid-load two-stage day-ahead-intra-day multi-time optimization scheduling method is constructed; the simulation verifies that the scheduling method can effectively promote the scenery consumption of a high percentage of the new energy grid and reduce the system operating cost. The literature [12] combined a hydro-wind-photovoltaic complementary power plant and analyzes the scheduling strategy for integrated operation through multi-objective optimization to maximize power generation, minimize output power fluctuations, and minimize deviations between power generation and planned output. The literature [13–15] analyzed the fluctuation characteristics of wind power transmission, the operation characteristics of wind power grid connected transmission end, and UHVDC transmission, which provides a certain idea for wind power DC transmission. Literature [16–19] considered the impact of regulation demand, multiple operation scenarios, and demand response, and studies the planning of new energy systems including solar-thermal power stations. Literature [20,21] clustered PV output scenarios based on K-means and K-medoids clustering algorithms. Literature [22–24] proposed that the combined power generation system including the solar-thermal power station, wind farm and electric load uses TVRI to measure the voltage recovery ability after a system failure. The results show that solar-thermal power stations can improve the transient stability of the system. Literature [25–28] discussed the operation mode of coordinated optimization of wind power and solar-thermal power. The thermal storage system is used to compensate for wind power, which shows that the combined solar-thermal and wind power generation system can effectively reduce power fluctuation. In literature [29–31], a multi-objective function was constructed to obtain the optimal output of the solar-thermal power station by considering the absorption rate of new energy, regional section limit and the schedulability of the solar-thermal power station. Literature [32–35] considered the uncertainties of wind power, PV and load, and established power prediction probability distribution functions by using the Copula function method.
The above-mentioned literature configures the capacity for the regulation demand, operation scenario, and demand response, but the current research on the capacity configuration of the solar-thermal power station does not involve the transient voltage support stability of the system under the DC transmission demand.
Given the above problems, this paper establishes the uncertainty model of PV and wind power based on the chance constrained programming theory. Taking the strongest transient voltage stability and the lowest comprehensive operation cost as the objective function. Take a new energy base as an example for simulation analysis. TVRI analyze the transient voltage stability under different solar-thermal power stations’ installed capacities, and according to the peak-to-valley difference and cumulative climbing amount analyzes the peak shaving effect after accessing solar-thermal power station.
2 PV and Wind Power Uncertainty Modeling and Scene Clustering
2.1 Chance Constrained Programming Theory
Chance constrained programming is a decision-making method that considers that the constraints cannot be fully satisfied in adverse environments. It describes random variables in the form of probability constraints. Based on this, the corresponding confidence level is given to ensure that the probability of the optimal solution meeting the constraints is greater than its given confidence level.
2.2 PV and Wind Power Uncertainty Modeling
2.2.1 PV Power Uncertainty Modeling
The uncertainty of PV output is mainly studied in the following three aspects: solar irradiance, PV output power and PV output prediction error. The expected value of PV forecast error is about 0, which can be described by normal distribution [36].
Suppose that the random variable of the output prediction error of PV power station is
2.2.2 Wind Power Uncertainty Modeling
Wind power is easily affected by meteorological factors, resulting in power uncertainty. From the literature [37], it is known that wind power output can be described by a normal distribution. If the random variable of wind farm output prediction error is
2.3 PV and Wind Power Scene Clustering
Considering the time series characteristics of wind power and PV output, using the K-medoids algorithm. K-medoids algorithm in this work can be described from Eq. (3). The annual operation scenarios are clustered and reduced to four typical scenarios, which are: large wind and solar (LWLS), small wind and solar (SWSS), large wind and small solar (LWSS), and small wind and large solar (SWLS).
where E is the sum of squares of the deviations of all objects in the data set; K is the original cluster; P is the sample in cluster;
3 Optimal Allocation Model of Installed Capacity of the Solar-Thermal Power Station Based on Chance Constrained Programming
The economic factor is a key role in the planning. Most studies in China and abroad take the minimum comprehensive operation cost of the system as the objective function.
This paper started from the overall benefits of the addition of the solar-thermal power station, which took into account the investment cost, operation cost, and transient stability. Taking solar-thermal power station installed capacity as the decision variable, the maximum transient voltage stability and the minimum comprehensive operation cost as the comprehensive objective function, the comprehensive objective function F in this work can be described from Eq. (4).
where F is the comprehensive optimization goal of maximum transient voltage stability and minimum comprehensive operation cost;
(1) Maximum objective of TVRI
TVRI is used to characterize the voltage recovery ability of the system after the failure of PV addition. The smaller TVRI is, the stronger the transient voltage recovery stability and the stronger the voltage support ability of the system. Hence,
where
(2) Minimum objective of comprehensive operating cost
The flexibility of the solar-thermal power station, on one hand, it can reduce the peak regulation pressure of conventional peak regulation units and reduce the peak regulation cost; on the other hand, it can improve the output of wind and PV energy and improve the economy of system operation. The sum of the solar-thermal power station peak regulation cost
where
The constraints of the model include the operational constraints of the solar-thermal power station, DC transmission line constraints and system operation constraints. The various constraint models are expressed below.
3.2.1 Operation Constraints of Solar-Thermal Power Station
(1) The internal power balance constraint of solar-thermal power station can be expressed from Eq. (10) [39].
where
(2) The constraint of thermal conduction working substance segment can be expressed from Eq. (11) [40].
where
(3) The capacity constraint of the thermal storage subsystem can be expressed from Eq. (12) [33].
where
(4) The constraint of power cycle subsystem can be expressed from Eq. (13).
where
(1) The power operation area constraint can be expressed from Eq. (14).
where
(2) The DC outgoing capacity constraint can be expressed from Eq. (15).
where
(3) The upper and lower limits of power transmission adjustment constraint can be expressed from Eq. (16).
where
3.2.3 System Operation Constraints
(1) The system power balance constraint is as follows:
where
(2) The spinning reserve constraints as given by Eqs. (18) and (19).
where
(3) The upper and lower limit constraint of solar-thermal power station output power as shown in Eq. (20).
(4) The operation constraint of PV power station and wind farm as given by Eqs. (21) and (22).
where
3.3 Quantitative Analysis of Operation Characteristics of the Solar-Thermal Power Station
3.3.1 Transient Voltage Stability Recovery Index
To analyse the transient voltage stability of the system under different solar-thermal power station installed capacities, the TVRI index is used to analyse the transient voltage stability of the system under the three-phase grounding short-circuit fault [41]. The TVRI index can be defined by Eq. (23).
where
Using the peak-to-valley difference and cumulative climbing amount analyze the peak shaving effect after accessing the solar-thermal power station [38]. The peak-to-valley difference and cumulative climbing amount can be defined by Eqs. (24) and (25).
where
The solar-thermal power station installed capacity optimal allocation model proposed in this paper is a nonlinear programming problem. As shown in Eqs. (18) and (19), the spinning reserve constraint is a chance constraint in the form of uncertainty, which is subject to deterministic conversion. The converted expression is as follows:
where
After converting the chance constraint condition into the equivalent form and linearization, the CPLEX solver is called in the YALMIP to solve the model. The specific steps of model solving are as follows:
(1) Firstly, input the original data (wind power and PV output forecast data, basic parameters of the arithmetic system and mathematical model of the solar-thermal power station, etc.).
(2) Uncertainty modeling by probability distribution density function of the prediction errors of wind power and PV to obtain the set of scenarios considering the uncertainty of wind power and PV output.
(3) Then the 365 scenario sets considering wind power and PV uncertainty are effectively scenario clustered by the K-medoids clustering algorithm to obtain 4 typical scenarios.
(4) Finally, a multi-objective planning model is established in the MATLAB-YALMIP development environment with the maximum transient voltage stability and the minimum integrated operating cost as the integrated objective function, and the nonlinear planning model is transformed into a mixed integer linear planning problem (MILP), and the CPLEX solver is invoked to solve the planning model.
4.1 Brief Introduction of Example Analysis
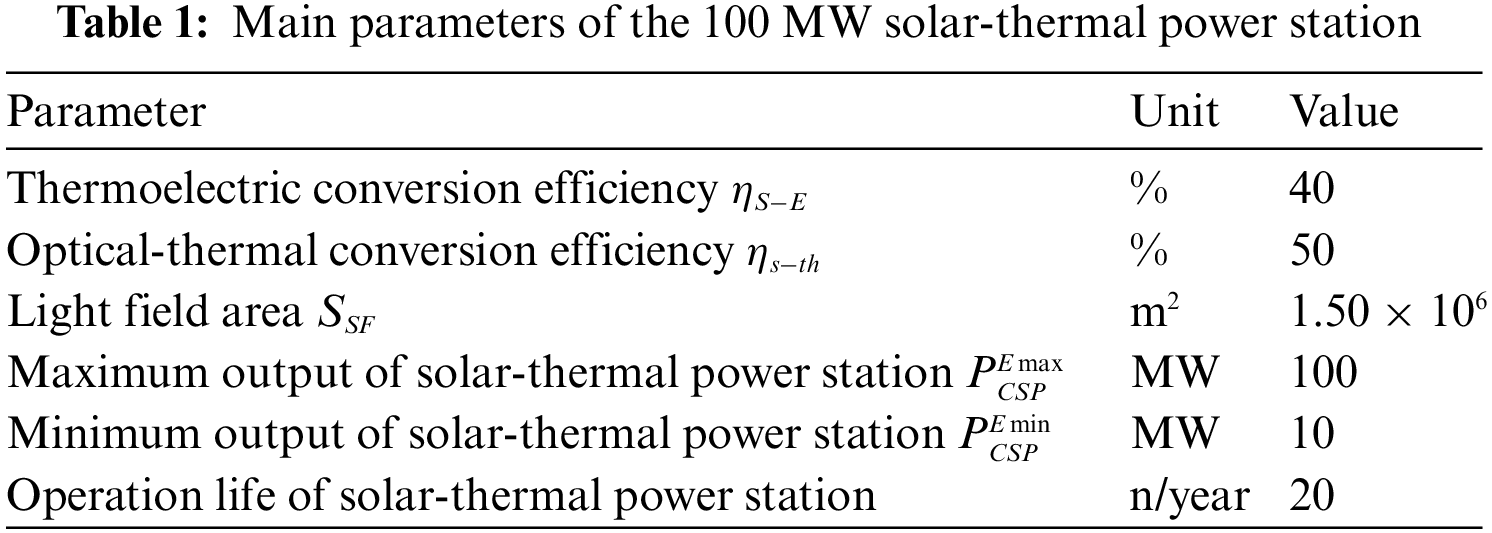
Take the improvement calculation of a new energy base in Gansu Province as an example. As of July 2021, the base has a design ±800 kV DC transmission capacity of 8 × 10⁶ kW, a design annual power transmission of 4 × 10¹⁰ kWh, and a total installed capacity of 1.33 × 10⁷ kW for wind and PV, including 1.045 × 10⁵ kW for wind power and 2.85 × 10⁴ kW for PV power. The solar-thermal power data comes from SAM software. The main parameters of 100 MW solar-thermal power station are shown in Table 1 [11], and the other parameters are shown in the literature [42].
The parameter settings in this paper are as follows:
The peak-shaving cost coefficients
4.2 Optimal Configuration Results of Installed Capacity of the Solar-Thermal Power Station
The initial 365 scene sets are clustered by K-medoids and reduced to 4 typical scenes. The clustering curve of wind power and PV output is shown in Fig. 1.
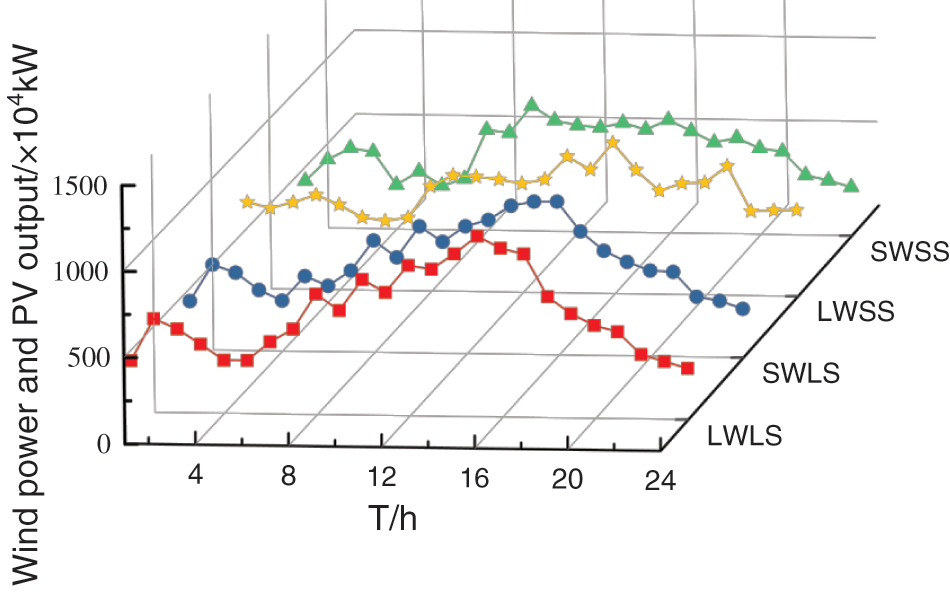
Figure 1: Clustering diagram of wind power and PV output
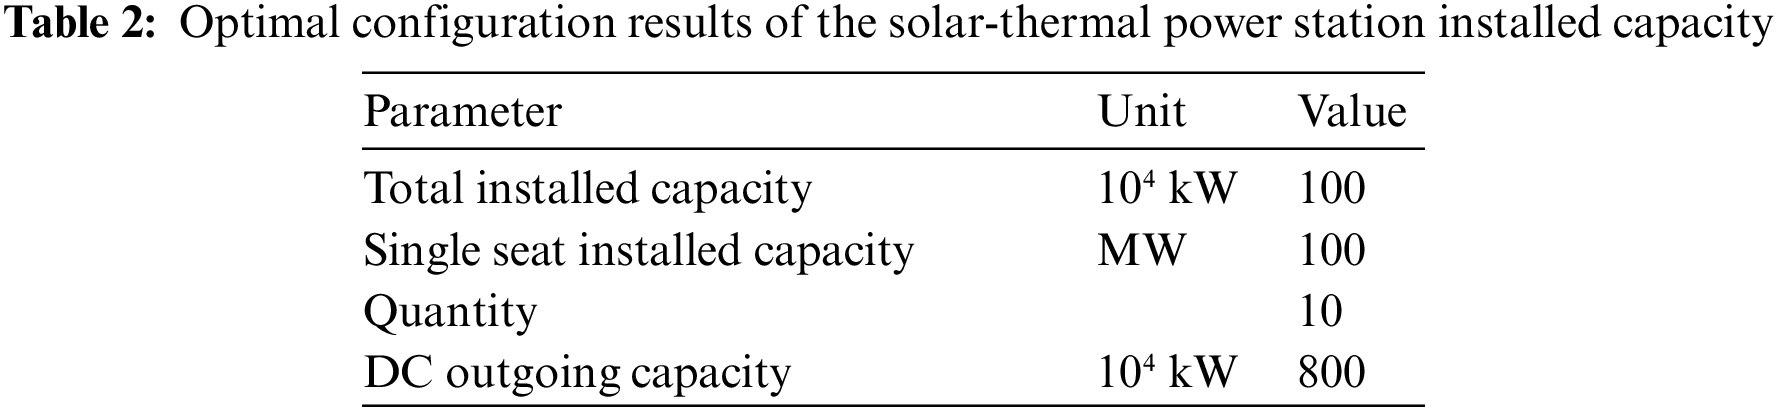
According to the configuration of the solar-thermal power station; its installed capacity is as shown in Table 2.
To evaluate the impact of the solar-thermal power station, the operation characteristics of the base are as shown in Fig. 2. Maintaining a certain installed capacity of wind power and PV in the base, when the installed capacity of the solar-thermal power station is increased from 2.5 × 10⁵ to 1.75 × 10⁶ kW, the curve of TVRI and comprehensive operation cost vary as shown in Fig. 2.
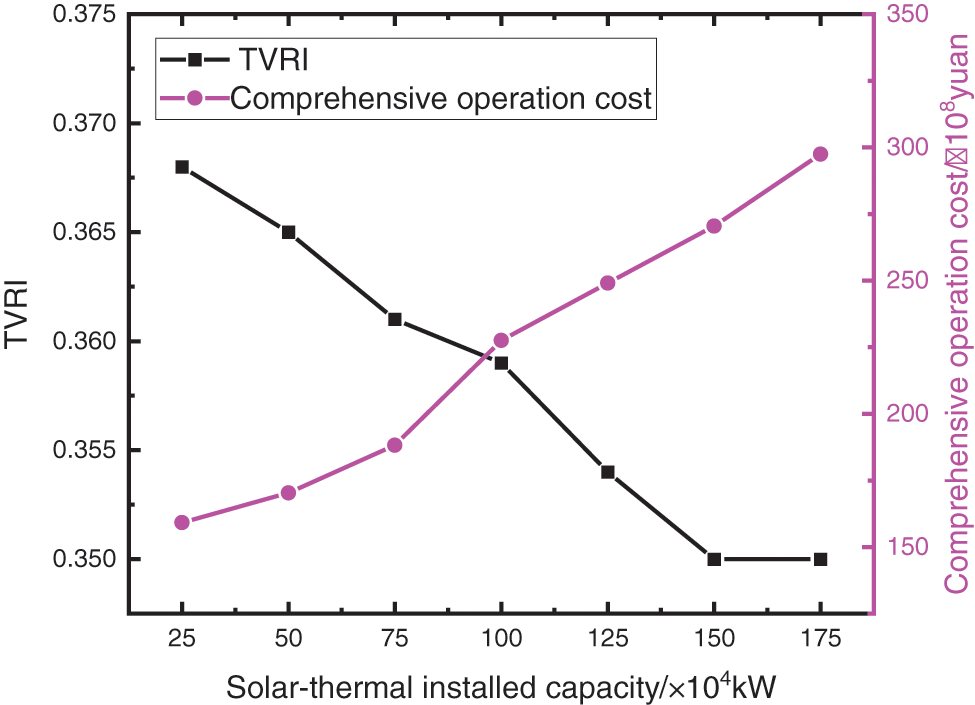
Figure 2: Results of optimum allocation of the installed capacity
It can be seen that with the increase of installed capacity, TVRI gradually decreases and then tends to be flat, indicating that the addition of the solar-thermal power station can improve the voltage stability of the base. The comprehensive operation cost increases gradually with the increase of installed capacity. This is because the larger the installed capacity of the solar-thermal power station, the higher the investment cost, and the lower the operation cost and peak regulation cost. When the installed capacity exceeds 1 × 10⁶ kW, the investment cost is too high, so the comprehensive cost increases significantly. In the double objective optimization model with the strongest transient voltage stability and the lowest comprehensive operation cost, when the installed capacity is 1 × 10⁶ kW, the TVRI is 0.359. Compared with the non-addition of the solar-thermal power station, the transient voltage stability recovery ability is greatly enhanced, and the comprehensive operation cost is 2.276 × 10¹⁰ yuan. At this time, it is the optimal solution, which can not only improve the transient stability of the system but also reduces the operation cost.
4.3 Quantitative Analysis of the Solar-Thermal Power Station
To study the impact of the solar-thermal power station on the DC power transmission of the base, Fig. 3 analyzes the system output and DC transmission demand curve of a 1 × 10⁶ kW solar-thermal power station in a typical scenario.
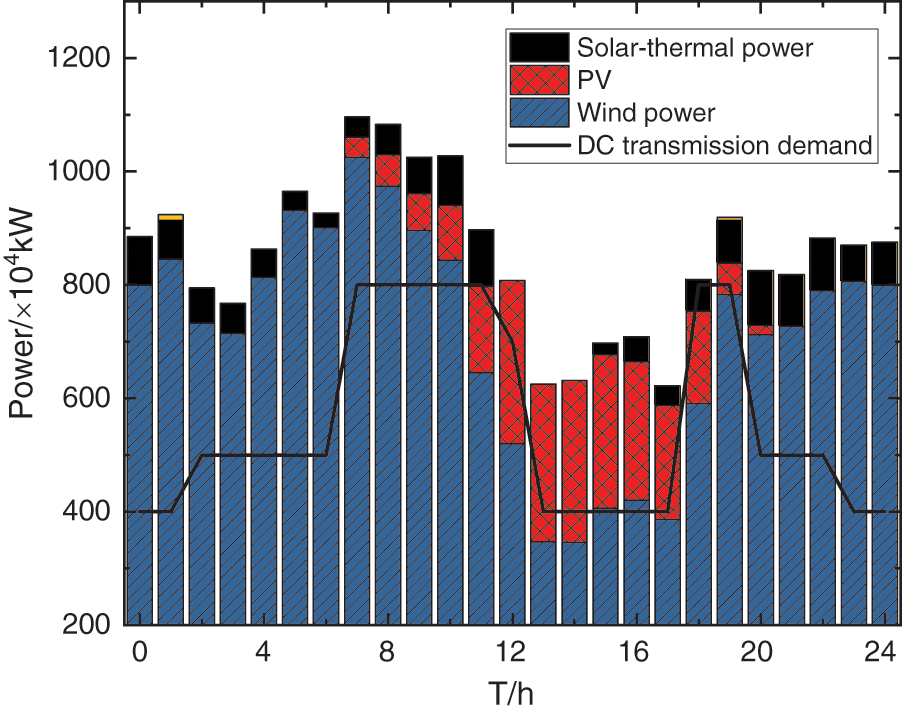
Figure 3: Wind power output, PV power output, and DC output curve
It can be seen that wind power and PV power are still the main output power sources in the base, and the addition of solar-thermal power can better meet the DC transmission demand. From 0:00 to 9:00, the irradiance is low and the wind power fluctuates greatly. At this time, the solar-thermal power stations use the stored heat to generate electricity. From 10:00 to 18:00, when PV is in the period of large power generation, the solar-thermal power station will store part of the heat and generate electricity. At this time, the solar-thermal power station undertakes the task of peak regulation. From 19:00 to 24:00, less PV power is generated, and the solar-thermal power station uses the stored thermal energy to generate power, to meet the demand of DC transmission and stabilize the fluctuation of wind power. The time from 7:00 to 12:00 and from 18:00 to 19:00 are in the peak period of export. The configuration scheme in this paper can better satisfy DC export demands at 19:00 if there are no solar-thermal power stations.
According to the fixed installed capacity of wind power and PV, we obtained the variation curves of DC export limit and new energy consumption under the different installed capacities of the solar-thermal power stations as shown in Fig. 4.
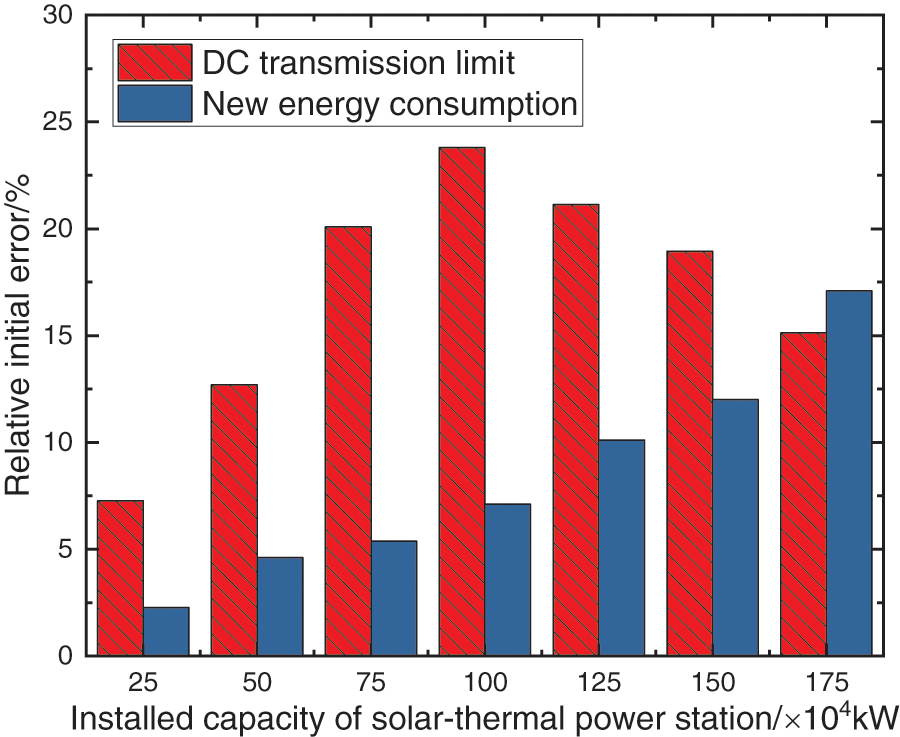
Figure 4: Change of DC transmission limit and new energy consumption
It is can be seen in Fig. 4, that with the increase of the solar-thermal power station installed capacity, the DC transmission limit shows a trend of first increasing and then decreasing. And new energy consumption is gradually increasing. This is because as the installed capacity of solar thermal power plants rises, the scheduling flexibility of solar-thermal power stations continues to improve, and the rotating reserve capacity they can provide increases with the system having a larger rotating reserve capacity to cope with fluctuations in scenery output, so the amount of renewable energy consumption increases accordingly. When the installed capacity is 1 × 10⁶ kW, the new energy consumption increases by 7.12% compared with that without solar-thermal addition, and the DC transmission limit increases by 23.75%.
4.3.1 Analysis of Transient Voltage Stability Recovery Index
TVRI was also analysed under different solar-thermal power stations installed capacity as shown in Table 3.
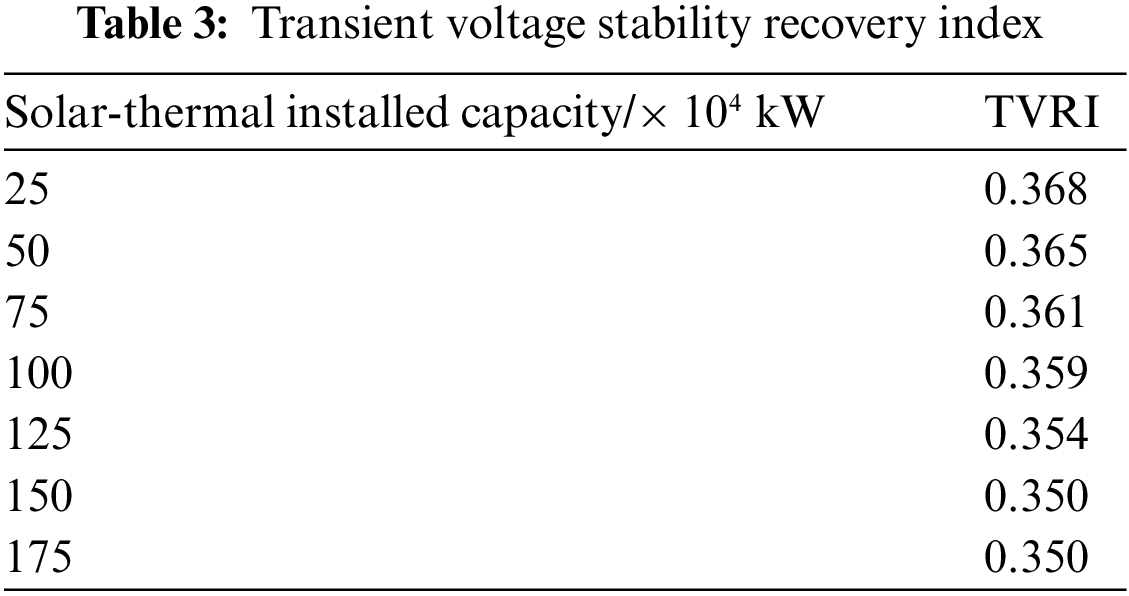
It can be seen from Table 3 and Fig. 2 that as the installed capacity gradually increases, TVRI gradually decreases and then tends to be stable, and the transient voltage recovery ability gradually increases. When it increases to a certain amount, the support ability of transient voltage caused by the addition of the solar-thermal power station reaches its peak. When the installed capacity is 1 × 10⁶ kW, TVRI is 0.359, and the transient voltage stability recovery ability is strong, that is, the voltage support ability of the system is strong.
4.3.2 Peak Shaving Index Analysis
According to formulas (24) and (25), the peak shaving effect of the solar-thermal power station with different installed capacities on the system is shown in Table 4. With the increase of the solar-thermal power station installed capacity, the peak shaving effect is enhanced. In the period of less new energy generation, the solar-thermal power station uses the stored thermal energy to generate electricity, share the peak shaving task, and reduce the peak-to-valley difference.
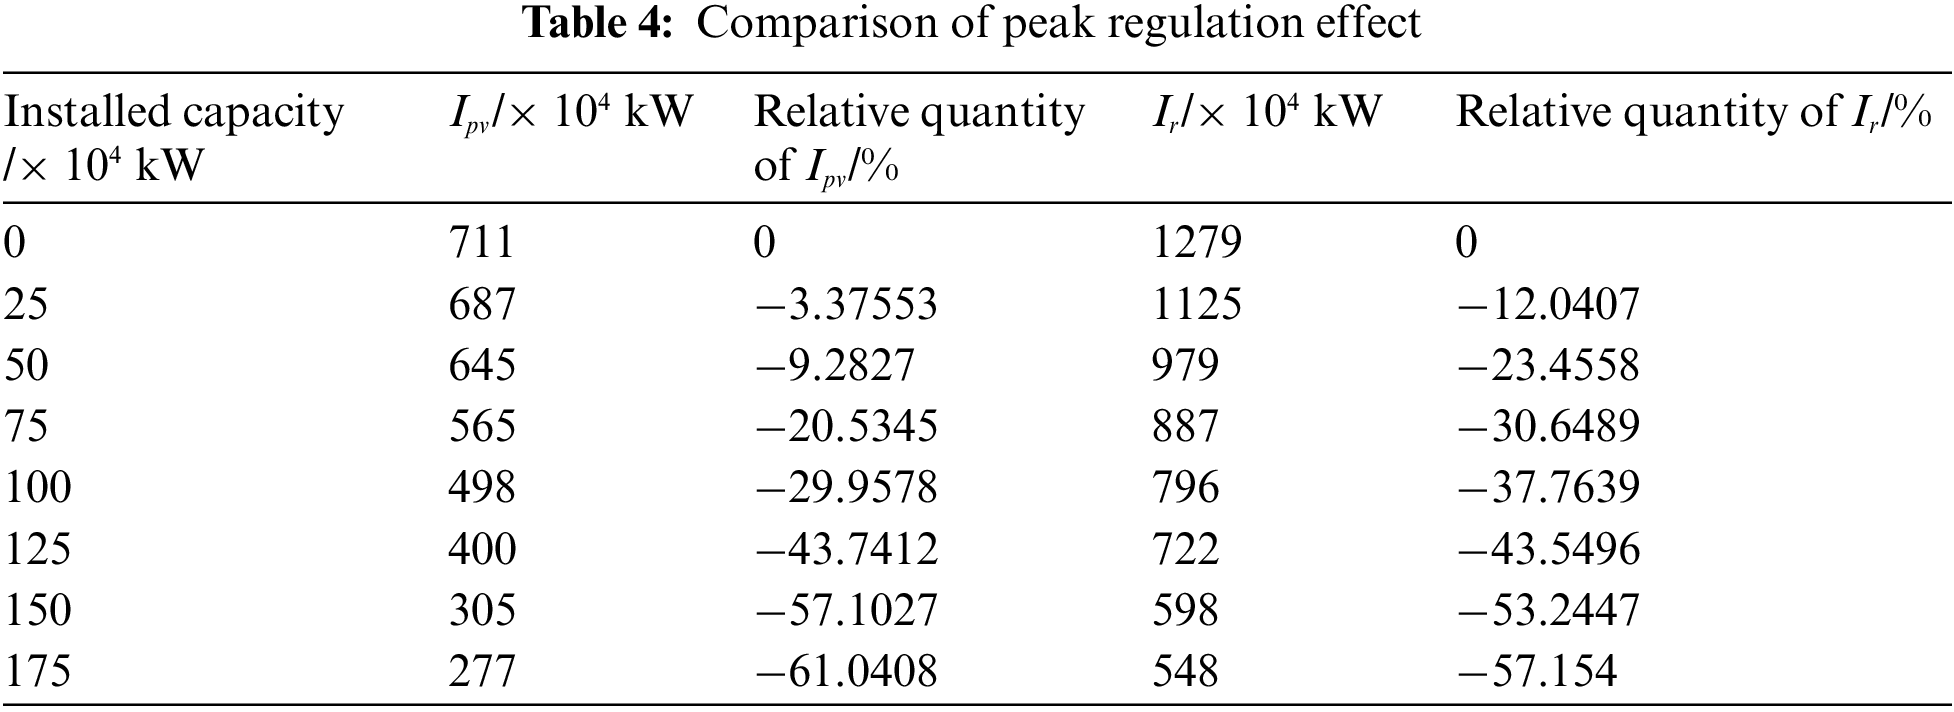
To sum up, when 1 × 10⁶ kW solar-thermal power stations are configured, the comprehensive operation cost is 2.276 × 10 10 yuan, TVRI is 0.359, and it can reduce the peak-to-valley difference by 29.96%, increase the DC output power by 23.75%, and increase the consumption of new energy by 7.12%. Therefore, the configuration method in this paper is reasonable.
To study the optimal allocation of the installed capacity of the solar-thermal power station in the new energy base, based on the chance constrained programming theory, this paper comprehensively considers the DC transmission demand, transient voltage stability, and peak shaving cost, proposes the optimal allocation method of the installed capacity of the solar-thermal power station, quantitatively analyzes the operating characteristics of the solar-thermal power station, and simulates and verifies it with an example of the actual new energy base, and draws the following conclusions:
1) Reasonable configuration of the solar-thermal power station installed capacity can improve the transient voltage support capacity, and improve the new energy consumption rate and DC transmission limit on the premise of meeting the DC transmission demand.
2) The introduction of the solar-thermal power station can improve the flexibility of the base, and improve the peak shaving capacity of traditional units by undertaking peak shaving tasks.
Funding Statement: This research was funded by Major Science and Technology Projects in Gansu Province (19ZD2GA003).
Conflicts of Interest: The authors declare that they have no conflicts of interest to report regarding the present article.
References
1. Li, H., Liu, D., Yao, D. Y. (2021). Development of China’s electric power system for carbon peak carbon neutrality. Proceedings of the CSEE, 41(18), 6245–6259. [Google Scholar]
2. Shu, Y. B., Zhang, Z. G., Guo, J. B., Zhang, Z. L. (2017). Study on key factors and solution of renewable energy accommodation. Proceedings of the CSEE, 37(1), 1–8. [Google Scholar]
3. Cui, Y., Zhang, J. R., Wang, Z., Wang, T., Zhao, Y. T. (2020). Day-ahead scheduling strategy of wind-PV-CSP hybrid Power generation system by considering PDR. Proceedings of the CSEE, 40(10), 3103–3114. [Google Scholar]
4. Liu, B., Zhang, Y. Q., Ma, L. W., Li, Z., Zhao, Q. (2021). Design and optimization of technical schemes of supply-side base integrated energy systems in Northwest China. Proceedings of the CSEE, 41(2), 568–581. [Google Scholar]
5. Nguyen, N., Mitra, J. (2017). Reliability of power system with high wind penetration under frequency stability constraint. IEEE Transactions on Power Systems, 33(1), 985–994. DOI 10.1109/TPWRS.2017.2707475. [Google Scholar] [CrossRef]
6. Cao, Y. J., Zhang, Y., Zhang, H. X., Shi, X. H., Terzija, V. (2017). Probabilistic optimal PV capacity planning for wind farm expansion based on NASA data. IEEE Transactions on Sustainable Energy, 8(3), 1291–1300. DOI 10.1109/TSTE.2017.2677466. [Google Scholar] [CrossRef]
7. Yan, G. G., Wang, Z. H., Li, J., Feng, L. M. (2014). Research on output power fluctuation characteristics of the clustering photovoltaic-wind joint power generation system based on continuous output analysis. 2014 International Conference on Power System Technology, pp. 2852–2857. Chengdu, China. [Google Scholar]
8. Zhang, B. L., Yu, J. S., Huang, W. L., Hao, R. H., Qi, Y. (2020). Challenges and reflections on the power grid of high proportion of new energy in Gansu province. Power System and Clean Energy, 36(4), 81–89+96. [Google Scholar]
9. Sun, X. Q., Wang, Y., Li, Q. H., Li, F. C., Yang, P. F. et al. (2022). Planning of solar thermal power station completely replacing thermal power in new power system. Power System Technology, 46(8), 2948–2954. [Google Scholar]
10. Xiong, W., Ma, Z. C., Zhang, X. Y., Wang, K., Zhou, Q. et al. (2020). Two-layer optimal dispatch of WF-PV-CSP hybrid power generation considering wind power and photovoltaic consumption. Acta Energiae Solaris Sinica, 43(7), 39–48. [Google Scholar]
11. Cui, Y., Li, C. G., Zhao, Y. T., Zhong, W. Z., Wang, M. C. et al. (2022). Source-grid-load multi-time interval optimization scheduling method considering wind-photovoltaic-photothermal combined DC transmission. Proceedings of the CSEE, 42(2), 559–573. [Google Scholar]
12. Xiong, H., Egusquiza, M., Ostergaard, P. A., Perez-Diaz, J., Sun, G. et al. (2021). Multi-objective optimization of a hydro-wind-photovoltaic power complementary plant with a vibration avoidance strategy. Applied Energy, 301(1), 117459.1–117459.17. DOI 10.1016/j.apenergy.2021.117459. [Google Scholar] [CrossRef]
13. Huang, L. H., Song, L. L., Zhou, R. W., Li, G. (2017). Analysis of wind power fluctuation characteristics in large wind power base. Proceedings of the CSEE, 37(6), 1599–1610. [Google Scholar]
14. Cui, Y., Zhang, H. Q., Zhao, Y. T., Zhang, J. T., Wang, M. C. (2019). An optimization method to determine power delivery capacity of combined wind-CSP system based on time-sharing energy complementation. Power System Technology, 43(11), 3875–3882. [Google Scholar]
15. Liu, Z. Y., Zhang, Q. P., Dong, C., Zhang, L., Wang, Z. D. (2014). Efficient and security transmission of wind, photovoltaic and thermal power of large-scale energy resource bases through UHVDC projects. Proceedings of the CSEE, 34(16), 2513–2522. [Google Scholar]
16. Wu, Y. H., Zhao, C. H., Li, S., Xie, D. (2021). Joint planning of concentrated solar power station and new energy based on bio-level programming model. The New Energy Control Technology, 43(6), 17–19+22. [Google Scholar]
17. Zhao, S. Q., Wu, Y., Li, Z. W., Wei, Z. Y., Lian, J. D. (2022). Analysis of power system peaking capacity and economy considering uncertainty of wind and solar output. Power System Technology, 46(5), 1752–1761. [Google Scholar]
18. An, M., Zhang, Z. Z., Chen, Z., Huang, R., Ding, K. et al. (2019). Stochastic production simulation study of power system with photothermal-photovoltaic combined power generation. Renewable Energy Resources, 37(11), 1603–1610. [Google Scholar]
19. Cui, Y., Zhang, H. Q., Zhong, W. Z., Zhao, Y. T., Zhang, J. T. et al. (2020). Multi-source optimal scheduling of renewable energy high-permeability power system with CSP plants considering demand response. High Voltage Engineering, 46(5), 1486–1496. [Google Scholar]
20. Ding, M., Xie, J. L., Shi, W. H. (2016). The generation method and application of wind resources/load typical scenario set for evaluation of wind power grid integration. Proceedings of the CSEE, 36(15), 4064–4072. [Google Scholar]
21. Wang, Q., Dong, W. L., Yang, L. (2015). A wind power/photovoltaic typical scenario set generation algorithm based on wasserstein distance metric and revised K-medoids cluster. Proceedings of the CSEE, 35(11), 2654–2661. [Google Scholar]
22. Pousinho, H. M. I., Silva, H., Mendes, V. M. F. Collares-Pereira, M., Pereira Cabrita, C. (2014). Self-scheduling for energy and spinning reserve of wind/CSP plants by a MILP approach. Energy, 78(1), 524–534. DOI 10.1016/j.energy.2014.10.039. [Google Scholar] [CrossRef]
23. Li, X. Y., Li, F. T., Yin, C. Y., Bai, H. B. (2021). Transient overvoltage calculation method of HVDC sending-end system under DC bipolar blocking. Power System Protection and Control, 49(1), 1–8. [Google Scholar]
24. Luo, Y., Yao, J., Zhang, T., Pei, J. X., Zhang, F. (2019). Coordinated control strategy of large-scale wind power generation sending system under mono-polar block fault. Transactions of China Electrotechnical Society, 34(19), 4108–4118. [Google Scholar]
25. Dong, H. Y., Zhang, H., Chen, Z., Huang, R., Ding, K. (2021). Research on reactive stratification coordination optimization control strategy of CSP-PV hybrid system. Acta Energiae Solaris Sinica, 42(6), 162–169. [Google Scholar]
26. Chen, R., Sun, H., Guo, Q., Li, Z., Deng, T. (2015). Reducing generation uncertainty by integrating CSP with wind power: An adaptive robust optimization-based analysis. IEEE Transactions on Sustainable Energy, 6(2), 583–594. DOI 10.1109/TSTE.2015.2396971. [Google Scholar] [CrossRef]
27. Xu, T., Zhang, N. (2017). Coordinated operation of concentrated solar power and wind resources for the provision of energy and reserve services. IEEE Transaction Power Systems, 32(2), 1260–1271. [Google Scholar]
28. Ma, B. T. (2019). Flexibility-oriented Unit commitment and its application to generation expansion planning in wind-CSP power systems (Ph.D. Thesis). Chongqing University, Chongqing, China. [Google Scholar]
29. Xue, Y. (2020). Research on optimal dispatching of new energy grid in high-permeability area under the connection of thermal power station connected (Ph.D. Thesis). Xi’an University of Technology, Xi’an, China. [Google Scholar]
30. Zhu, Z. Q., Ma, X. M., Gu, B., Liu, H. Z. (2020). Joint optimal scheduling model of clean energy considering CSP regulation. 5th Asia Conference on Power and Electrical Engineering (ACPEE), pp. 323–328. Chengdu, China. [Google Scholar]
31. Hou, B. C., Zhang, X. Y., Wang, K., Chen, W., Wang, X. L. (2019). Coordinated optimization scheduling of wind power, photovoltaic, photo-thermal and hydropower considering the schedulability of photo-thermal power stations. 2019 4th International Conference on Intelligent Green Building and Smart Grid (IGBSG), pp. 756–760. Hubei, China. [Google Scholar]
32. Lin, C. F., Bie, Z. H., Pan, C. Q., Liu, S. Y. (2020). Fast cumulant method for probabilistic power flow considering the nonlinear relationship of wind power generation. IEEE Transactions on Power Systems, 35(4), 2537–2548. DOI 10.1109/TPWRS.2019.2959404. [Google Scholar] [CrossRef]
33. Liu, W. P., Liu, Y. T. (2020). Optimal configuration of energy storage for wind farm black-start based on asymmetric copula function. Automation of Electric Power Systems, 44(19), 47–54. [Google Scholar]
34. Wu, F., Zhou, N. P., Ju, P., Zhang, X. P. (2018). Wind-wave coupling model for wave energy forecast. IEEE Transactions on Sustainable Energy, 10(2), 586–595. DOI 10.1109/TSTE.2018.2839358. [Google Scholar] [CrossRef]
35. Cui, M. J., Krishnan, V., Hodge, B. M., Zhang, J. (2018). A copula-based conditional probabilistic forecast model for wind power ramps. IEEE Transactions on Smart Grid, 10(4), 3870–3882. DOI 10.1109/TSG.2018.2841932. [Google Scholar] [CrossRef]
36. Lin, S. B., Han, M. X., Zhao, G. P., Niu, Z. H., Hu, X. D. (2013). Capacity allocation of energy storage in distributed photovoltaic power system based on stochastic prediction error. Proceedings of the CSEE, 33(4), 25–33+5. [Google Scholar]
37. Liu, Z. H., Wei, Z. N., Gao, S. Y., Cheng, L. X., Kang, T. et al. (2019). Adaptive-linearized probabilistic power flow calculation for power grid integrated with high proportion wind power in source-load interactive environment. Power System Technology, 43(11), 3926–3937. [Google Scholar]
38. Sha, Y., Zhou, M., Yang, H. J., Liu, S. W., Li, G. Y. et al. (2020). Interconnected power system optimal operation with renewable generation considering flexibility of concentrating solar power plants & HVDC tie-line. Power System Technology, 44(9), 3306–3313. [Google Scholar]
39. Yao, S. R. (2020). Concentrating solar power planning in new energy base considering multiple operation in multi scenarios (M.D. Thesis). North China Electric Power University, Beijing, China. [Google Scholar]
40. Liu, S., Shi, T., Guo, Y. S., Zhang, Y. Q., Li, J. X. (2019). Optimal dispatch model of grid-connected power base considering photovoltaic power and concentrating solar power. Electric Power, 52(4), 51–58. [Google Scholar]
41. Wang, X. L., Wang, Y. J., Zhou, H., Cai, K. Y. (2007). Optimal design of AQM routers with D-stable regions based on ITAE performance. Journal of Software, 18(12), 3092–3103. [Google Scholar]
42. Chen, R. Z., Song, H. B., Li, Z. S., Liu, Y. B. (2014). Grid dispatch model and interconnection benefit analysis of concentrating solar power plants with thermal storage. Automation of Electric Power Systems, 38(19), 1–7. [Google Scholar]
Cite This Article
 Copyright © 2023 The Author(s). Published by Tech Science Press.
This work is licensed under a Creative Commons Attribution 4.0 International License , which permits unrestricted use, distribution, and reproduction in any medium, provided the original work is properly cited.
 Downloads
 Citation Tools