
 Submit a Paper
 Propose a Special lssue
 Open Access
ARTICLE

Pilot Test for Nitrogen Foam Flooding in Low Permeability Reservoir
1 State Key Laboratory of Enhanced Oil Recovery, CNPC, Beijing, 100083, China
2 Research Institute of Petroleum Exploration and Development, CNPC, Beijing, 100083, China
3 Research Institute of Petroleum Exploration and Development, Xinjiang Oilfield Company, Karamay, 834000, China
4 Hebei Normal University, Shijiazhuang, 050024, China
* Corresponding Author: Hao Kang. Email:
(This article belongs to the Special Issue: Simulation of Flow and Transport Problems in Petroleum Engineering)
Energy Engineering 2023, 120(3), 763-774. https://doi.org/10.32604/ee.2023.025893
Received 04 August 2022; Accepted 05 September 2022; Issue published 03 January 2023
 View Full Text
 Download PDF
Abstract
Due to the characteristics of reservoir formation, the producing level of low permeability reservoir is relatively very low. It is hard to obtain high recovery through conventional development schemes. Considering the tight matrix, complex fracture system, low production level of producers, and low recovery factor of M block in Xinjiang oilfield, it is selected for on-site pilot test of nitrogen foam flooding. Detailed flooding scheme is made and the test results are evaluated respectively both for producers and injectors. The pressure index, filling degree, and fluid injection profile are found to be all improved in injectors after injection of nitrogen foam. The oil production, water cut and liquid production file are also improved in most of the producers, with the natural decline rate in the test area become slow. Results show that nitrogen foam flooding technology can be good technical storage for enhanced oil recovery in low permeability reservoir.
Keywords
There are lots of challenges in the development of low permeability reservoir. Zhao et al. [1] analyzed the key factors and technical problems affecting CO2 flooding efficiency and storage efficiency in China's low permeability reservoirs in view of the poor reservoir physical properties, high crude oil viscosity, high wax and colloid content, and high freezing point in China's petroliferous basins. On this basis, the research direction of developing low permeability reservoirs by CO2 injection in China is further proposed, which provides technical reference and guidance for the implementation of CO2 flooding in China. In view of tight matrix, complex fracture system, low production level of oil wells, low recovery factor and poor development effect in low permeability reservoirs, Wang et al. elaborated the application characteristics and adaptability of six EOR technologies, such as improving water drive, gas drive, chemical drive, etc., and defined the basis for promoting the progress of EOR technology in low permeability reservoirs and the research direction of EOR technology [2]. According to the characteristics of low porosity, low permeability and/or low saturation of complex oil and gas reservoirs, He et al. analyzed the limitations of conventional logging in such reservoirs, and put forward corresponding new logging theories and methods [3]. At the same time, the reserve in low permeability reservoir is relatively huge. Therefore, study on the development of low permeability reservoir is of great significance [4,5].
Nitrogen foam flooding is developed in recent years as a new technology for enhanced oil recovery (EOR). This technology has the advantages of both nitrogen flooding and foam flooding. It has become one of the most promising stimulation measures for the development of low permeability reservoir [6–8]. Until now, many scholars have conducted lots of research concerning the related issues of nitrogen flooding. Lv et al. [9] mainly focused on the safety problems of air flooding, they studied the explosion limits and the oxygen consumption in the practice of this technology and finally put forward corresponding countermeasures which can greatly increase the safety of this technology. Wang et al. [10] took the Wuliwan block in Changqing oilfield as the study object. Through the conduct of laboratory experiments, they studied the properties of oil in the low temperature oxidization process and the law of enhance oil recovery by air foam flooding. Zhao et al. built the geological model of Y2 block in Huaqing oilfield and studied the injection parameters of air foam flooding by means of numerical simulation [11]. Lei et al. [12] conducted series of experiments to evaluate the properties of foaming agents in air foam flooding, and they finally optimized the foaming agents which are suitable for fractured reservoir in the north Shanxi Province of China. Jiang et al. [13] built a double-layer risk assessment system for the air foam flooding and evaluated the risks in detail for this technique on site. Zhang et al. [14] studied the application of air foam flooding for enhanced oil recovery in heavy oil reservoir. Experiments concerning the mechanisms are conducted and the feasibility of this technology is proved. Chen et al. [15] confirmed the dynamical equation of air foam flooding through laboratory tests and theoretical analysis, and they finally studied the detailed mechanisms of this technique for enhanced oil recovery. Raj et al. [16] studied the foam generation and stabilization under reservoir conditions by using the mixture of surfactant and nanoparticles, and detailed results are obtained to improve the stability of foam. Liang et al. [17] introduced the application of nanofluids in oil industry, and the mechanisms of nanofluids in enhancing oil recovery (N-EOR) in terms of foam stabilization, emulsion stabilization, and so on are mainly summarized and reviewed. Janssen et al. [18] investigated the effect of drive–foam quality on oil–bank displacement through Alkaline/surfactant/foam (ASF) flooding, and the influencing factors of dispersive characteristics at the leading edge of the generated oil bank are finally suggested. Telmadarreie et al. [19] studied the effects of carbon dioxide (CO2) foam and CO2 PEF for EOR after solvent injection, and their performance was compared with gas injection. Their findings show that CO2 foam and PEF greatly increased heavy-oil recovery after solvent injection into the carbonite reservoir. Li et al. [20] developed a novel foam system for a series of laboratory experiments and successfully investigated the potential of foam flooding and its EOR mechanism in low-permeability reservoirs. All these studies concerning gas foam flooding are mainly conducted theoretically, and the pilot tests on site are rarely dealt with. In order for large-scale application to improve the exploitation of low permeability reservoir, it is necessary to firstly conduct pilot tests within suitable well groups [21,22].
The proved geological reserve for low permeability reservoir in Xinjiang oilfield is as high as 150 million tons. However, the reservoir development of M well block is at the middle-late stage. The water cut and development cost are high, but the oil production rate is relatively low. In recent years, the water injection efficiency gradually become lower while the remained geological reserve is still very significant. Moreover, the contradiction between layers become more serious, and ordinary profile control measures cannot effectively generate improved results. Therefore, the new techniques for enhanced oil recovery are urgently needed in this oilfield.
Foam flooding is naturally considered in this situation. Through the selection and synthesis of optimal foam formulation, the suitable well block is confirmed for pilot test. After that, the whole flooding scheme is drawn up and this study can be good references for enhanced oil recovery in low permeability reservoir.
2 Reservoir Characteristics and Development History
The reservoir is located in the Sannan Depression, and the top structure is a monocline with a dip angle of 2°–3°. The target formation is actually generated in the lithologic trap within this tectonic setting.
The reservoir is of delta deposit and three sand groups are developed as J2t1, J2t2, and J2t3 vertically. The main oil pay is in J2t2 sand group and the lithology is mainly feldspar rock-fragment sandstone. As for the clastic constituents, the quartz content is 28.5%, the feldspar content is 20.7% and the rock debris content is 50.6%.
Starting from 2004, the reservoir is firstly developed in inverted nine-spot pattern with 300 m × 425 m well spacing. In 2005, the production area is firstly enlarged and 9 rounds of production enlargement has been conducted in progression. The newly-built accumulative productivity reaches 123.1 × 10⁴ t and the proved reserves are all being put into production. Since 2012, two development adjustment zones are developed with different well patterns. Before the pilot test, there are totally 495 producers and 423 of them are operated. The average oil production is 1.5 t for a single well. Cumulative oil production has reached 1194.9 × 104 t, and cumulative gas production has reached 17.18 × 10⁸ m3. The rate of oil production is 0.8% and the recovery percent of reserves is 33% with water cut 91.3%. The recovery percent of recoverable reserves is 92.4%. There are totally 193 injectors and 168 of them are operated. The injection/production ratio per month is 0.85 and the cumulative injection/production ratio is 0.96. The cumulative injection water volume reaches 3819.9 × 104 m3. The formation pressure is 24.60 MPa now and the pressure maintenance level is 103.7%.
Currently, the water cut is relatively high and there are water production from all the main pay zones. The contradiction of different vertical layers become very serious. Among the layers, the main fluid production layer is J2t23, and the main water intake layer is actually J2t23 and J2t22. Generally, layer J2t21 is very hard to be exploited. In the plane view, there are great differences for percent of oil recovery. The water cut is much higher in some areas and the production results in the middle are generally much better than that at the border. There are great difficulties for steady production and many stimulation measures are taken but the improvements are very limited.
Screening criteria for pilot test unit of nitrogen foam flooding are as follows:
1. The formation should be with good closeness, and the isolated layers should be well developed at the top and bottom of formation;
2. The formation should be with positive rhythm and the connection among wells are good;
3. The well network is complete, the injection-production relationship is perfect, and the well conditions are good;
4. The remaining reserves are relatively high, the abilities of water adsorption and fluid production are strong;
5. Cumulative injection/production ratio is larger than 1, and the formation energy is well retained.
Based on principles above, the well groups with 6 injectors and 23 producers which are located at the middle part of the reservoir is selected as the pilot test unit. Detailed distribution of wells are as depicted in Fig. 1 below.
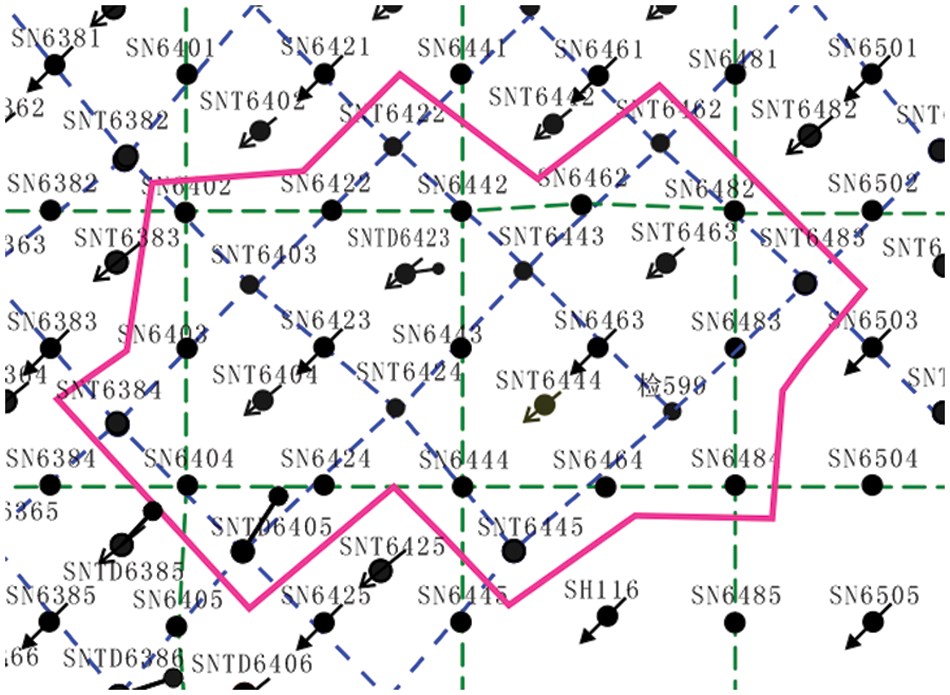
Figure 1: Location of nitrogen foam flooding pilot test area
The area of test unit is 1.71 km2 which accounts for 2.43% of the total reservoir area, and the geological reserve of test unit is 181.65 × 10⁴ t which accounts for 5.10% of the total reservoir reserve. The current water cut of the test unit is 89.7% and the recovery percent is 36.75%. As for the tectonic setting, the test unit is of a monocline with twist in some local structure, and the reservoir depth is at 2436∼2492 m with dip 2°∼3°.
Previous studies found that the main oil pay of J2t2 sand layer can be subdivided into three single sand layers: layer J2t21, layer J2t22, and layer J2t23. The sedimentary thickness of pilot test unit J2t2 ranges between 16.7 and 23.3 m, with the average sedimentary thickness as 21.1 m. To make it clear, the sectional view through well SN6403 to well J599 is as demonstrated in Fig. 2 below.
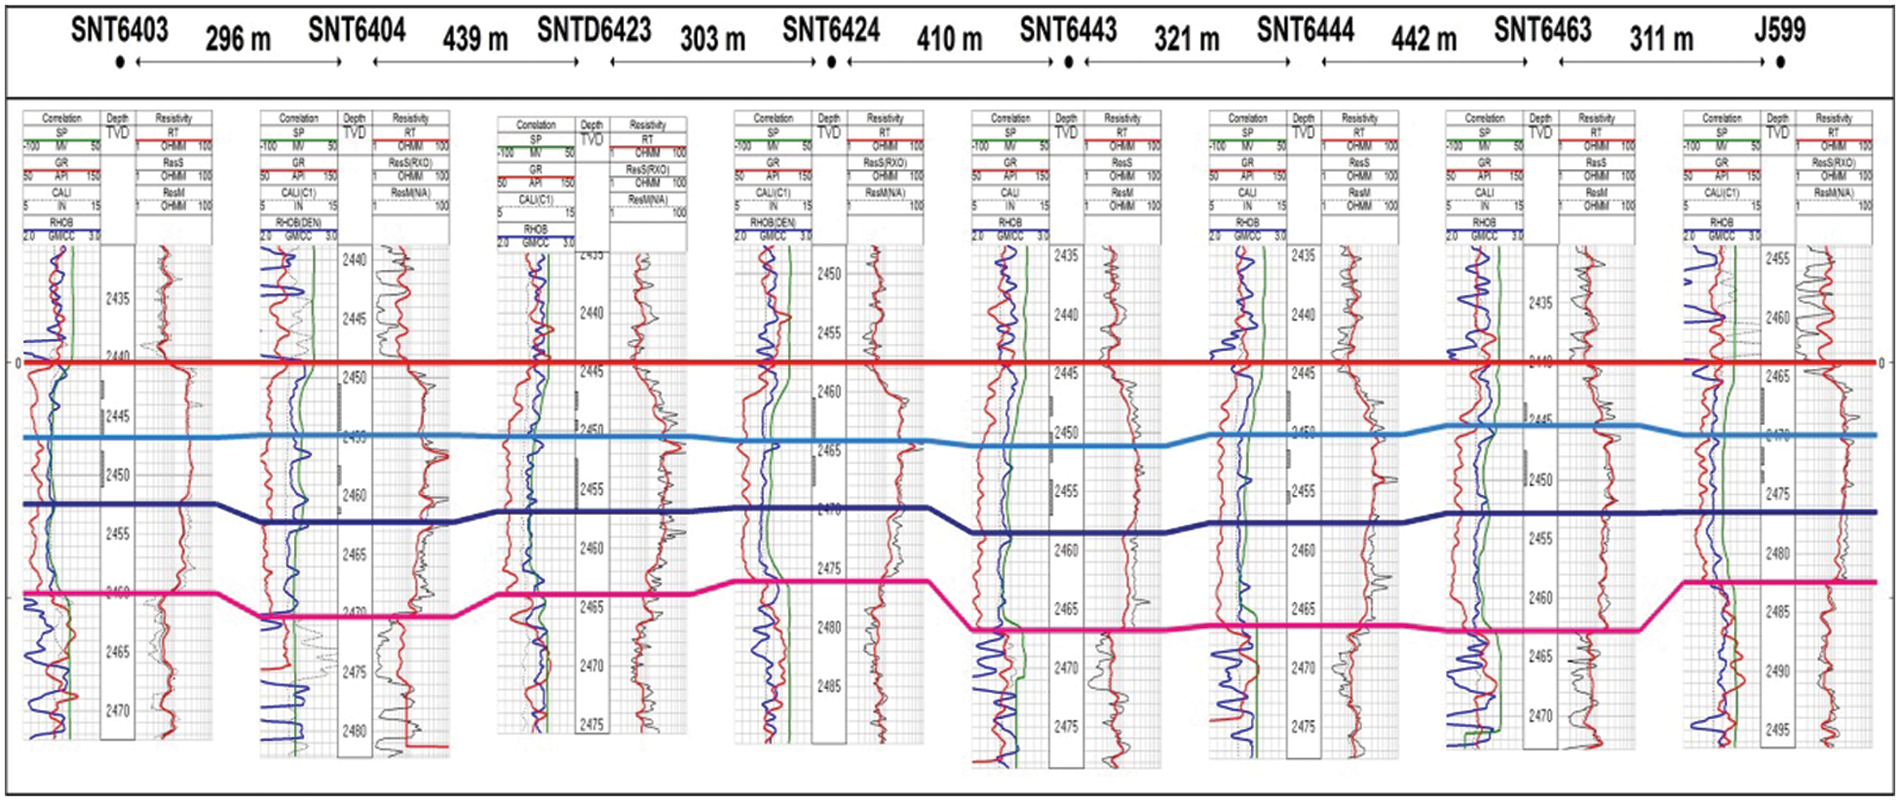
Figure 2: Sectional view through well SN6403 to well J599 in the test area with J2t2 layer in the middle
As for the sand body, the depth is 20.02 m and distributed with good connectivity. The depth of sub-layers J2t23, J2t22, and J2t21 are of little difference and their depth are all around 7 m. Vertically, the sand body are distributed in lump with steady depth and good connectivity. The sectional drawings of sand body are as demonstrated in Figs. 3 and 4. Specifically, Fig. 3 depicts the vertical drawing of sand body parallel to the source direction and Fig. 4 depicts the vertical drawing of sand body vertical to the source direction.
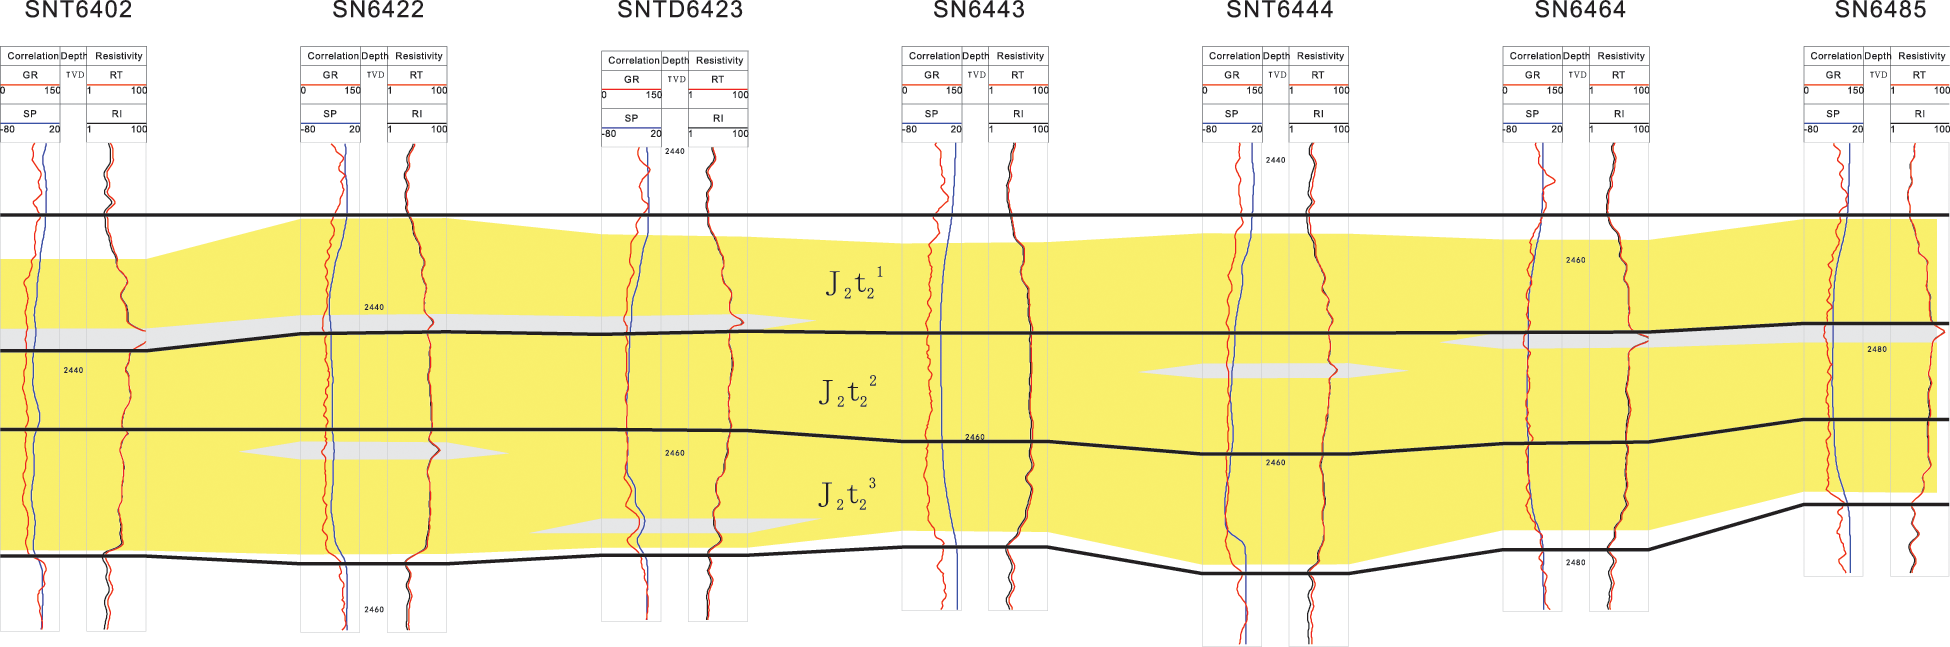
Figure 3: Sectional drawing of sand body in the test area (parallel to the source direction)
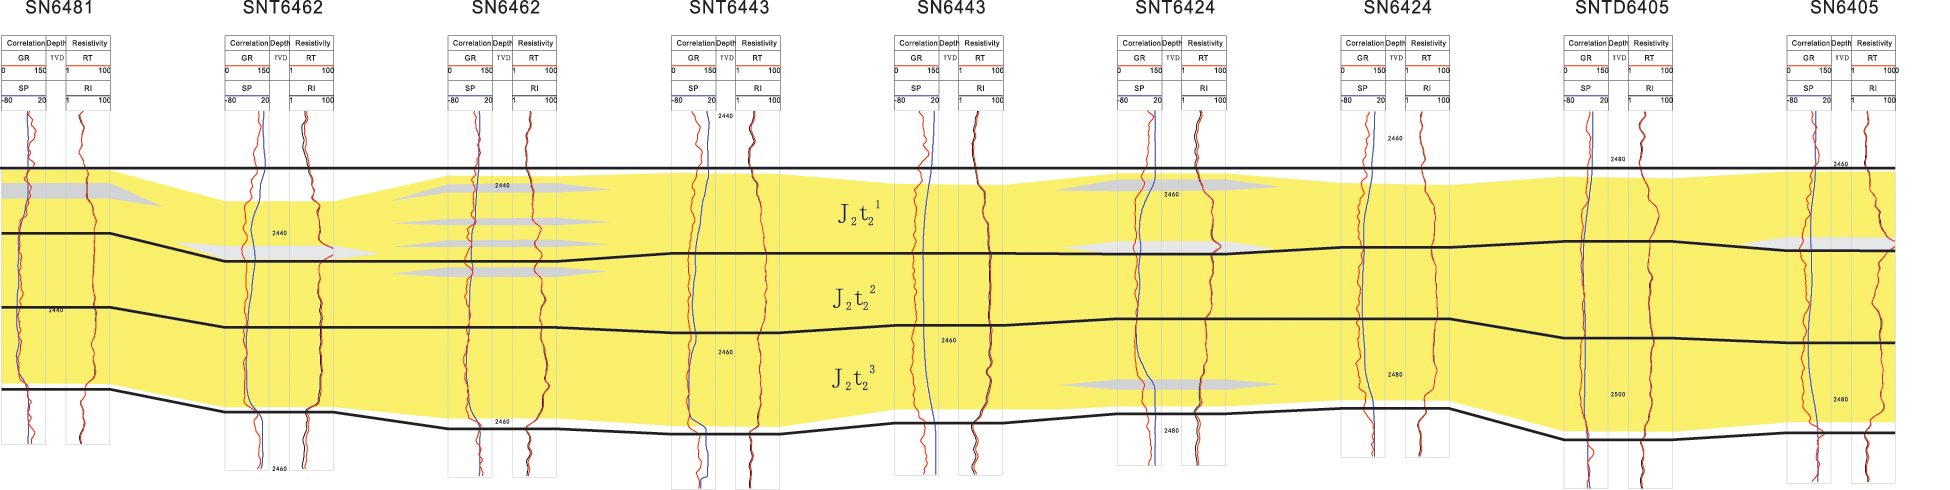
Figure 4: Sectional drawing of sand body in the test area (vertical to the source direction)
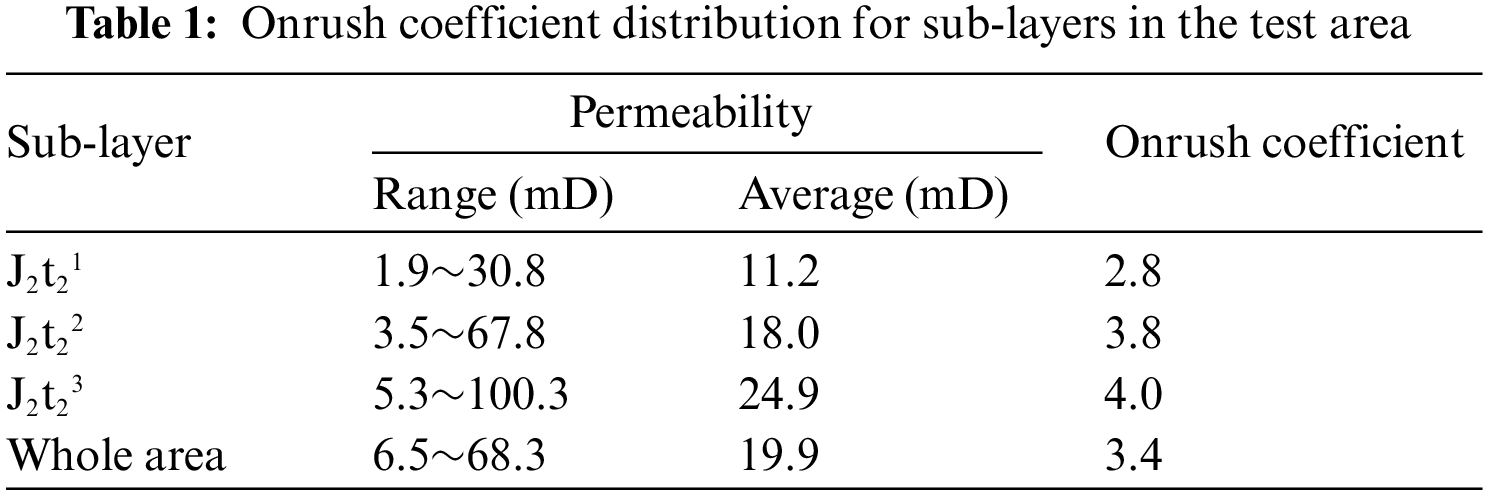
Based on the interpretation of well logging, the formation porosity in test area is calculated as between 12.2% and 17.2%, with the average porosity as 15.1%. Porosity distribution in the test area is as demonstrated in Fig. 5. Permeability distribution is as demonstrated in Fig. 6, and it ranges from 6.5 to 68.3 mD with the average permeability as 19.9 mD. Therefore, there is relatively big difference concerning properties on the horizontal view. In the vertical view, the porosity of J2t21, J2t22, and J2t23 are 14.4%, 14.9%, and 15.7%, respectively; the onrush coefficients of J2t21, J2t22, and J2t23 are 2.8, 3.8, and 4.0, respectively; the permeability of J2t21, J2t22, and J2t23 are 11.2, 18.0, and 24.9 mD, respectively. The formation is generally of positive rhythm with low permeability and porosity. Detailed data are as shown in Table 1 below.
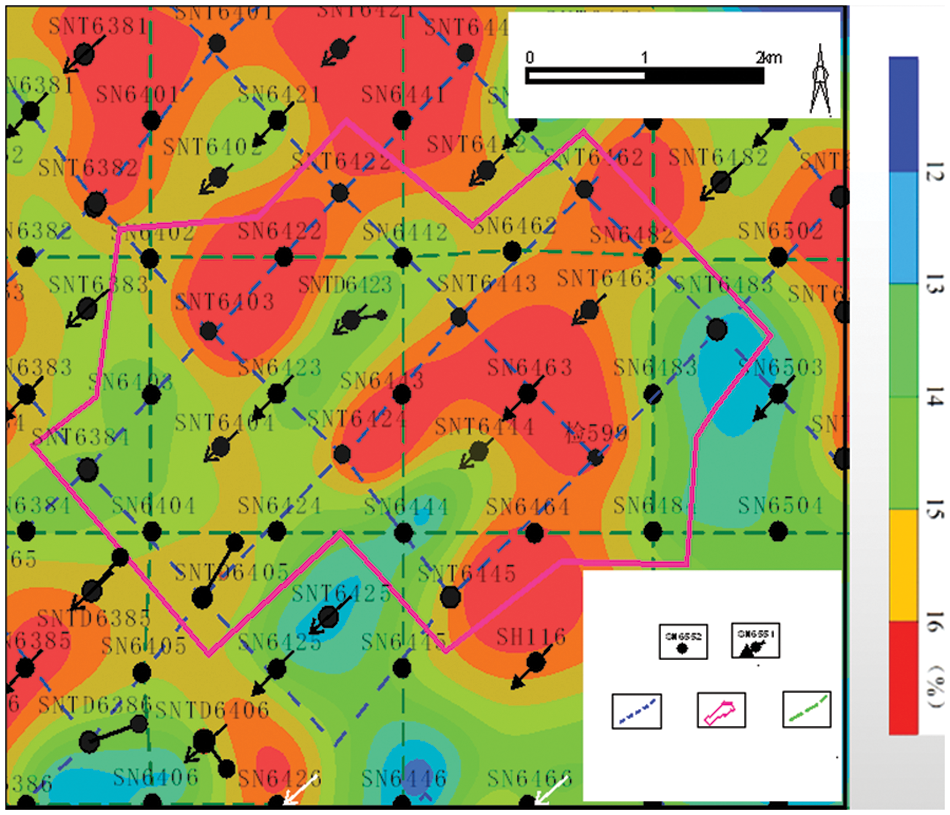
Figure 5: Horizontal distribution of porosity for sand group J2t2 in test area
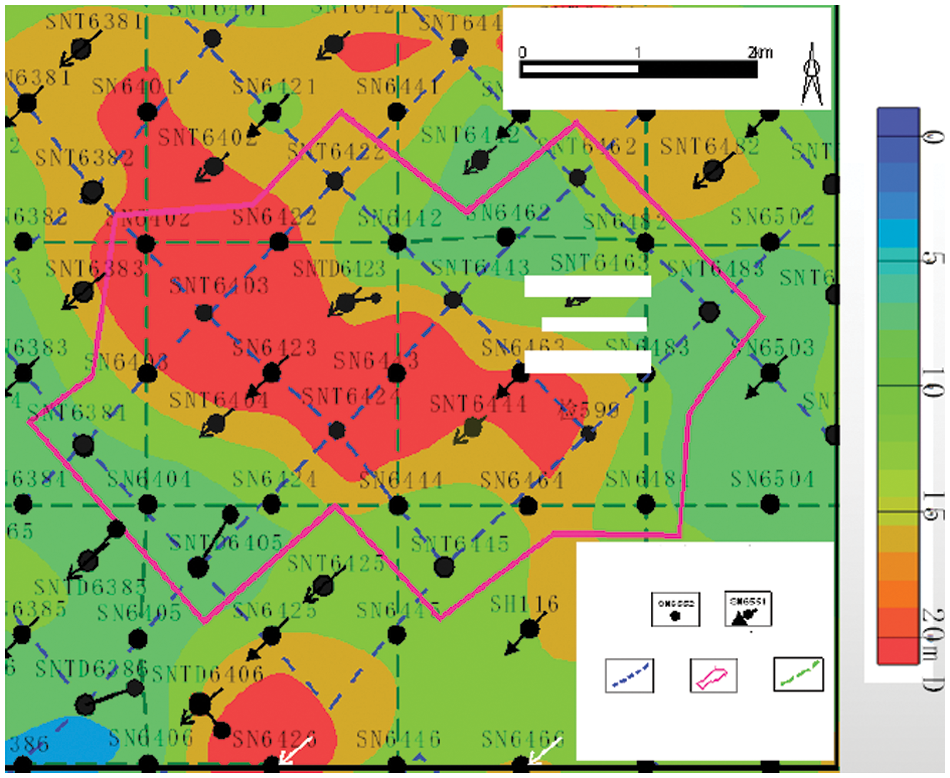
Figure 6: Horizontal distribution of permeability for sand group J2t2 in test area
4 Scheme of Pilot Injection Test
Based on evaluation above, two wells SN6423 and SN6463 are selected as the injection wells in the pilot test. Specifically, the injected agent formulation is 0.4%FP1688 + 0.15%WP324 + 1.0%WP247 in well SN6423 and the injected agent formulation is 0.4%FP1688 + 0.15%WP324 in well SN6463. The formulation in SN6463 is of low cost which can save the input of test and the formulation in SN6423 is of higher cost but it can have good prevention effects for channeling of injection fluids.
The purposes for pilot injection test include:
1. Monitoring the pressure change of injector and evaluating the injection capabilities of agent formulation;
2. Evaluating the operation conditions of injection equipment, well head, well casing and so on;
3. Detecting the quality of injected foam and foaming agent;
4. Analyzing the oil production, fluid production and gas production of producers, and inspecting the comprehensive EOR results of nitrogen foam flooding.
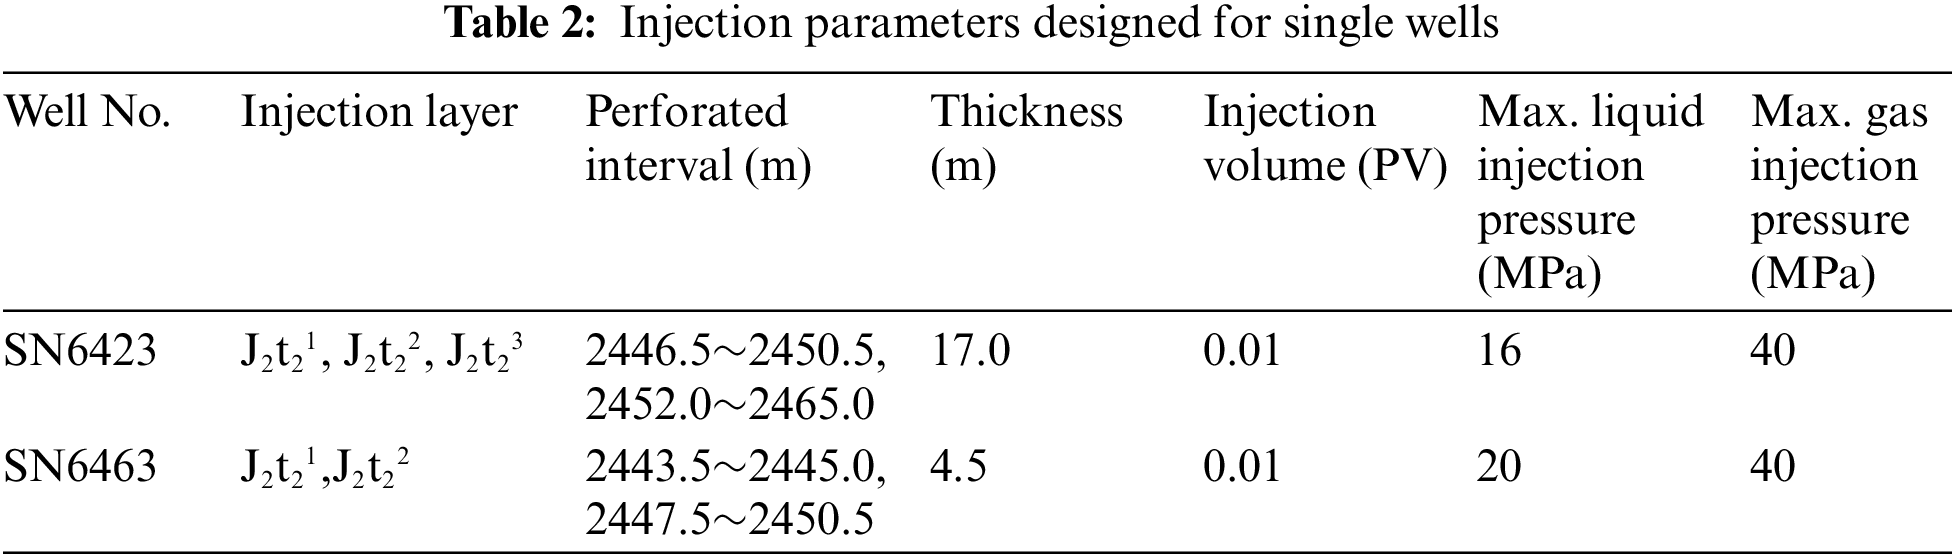
Based on the injection experiences in Jilin oilfield and Changqing oilfield of China, good results can be detected only after 2 to 3 months since injection. Therefore, the injection period is firstly designed as 4.5 months and the injection volume is initially designed as 0.01 pore volume underground. The nitrogen and liquid are injected alternatively with 2 days as a cycle. The underground gas/liquid ratio is set as 3:1 and the injection rate is the same as the water injection rate in the previous period. Detailed parameters for injection are as shown in Table 2 below. The injection layer for well SN6423 is J2t21, J2t22, and J2t23 with perforated interval 2446.5∼2450.5 m and 2452.0∼2465.0 m. The injection layer for well SN6463 is mainly focused on J2t21 and J2t22 with perforated interval 2443.5∼2445.0 m and 2447.5∼2450.5 m, because the pay thickness is only 4.5 m in this well. The maximum liquid injection pressure is set as 16 MPa in well SN6423, lower than that in well SN6463 as 20 MPa, so that the injection can tend to become even. The maximum gas injection pressure is set the same as 40 MPa in both wells.
After injection for nearly 1 year, the EOR results become obvious. In the following year, the injection is continued and the injection rate is doubled for well SN6463. Its liquid injection rate is increased from 25.3 to 50.6 m3/d and its gas injection rate is increased from 75.9 to 151.8 m3/d. Until now, the injection is operated under new parameters.
During the injection process, the content of gas from the casing in surrounding wells is also detected from time to time. As shown in Fig. 7, the detection are marked concerning each well with different colors for different dates. The horizontal abscissa represents the well number and the ordinate represents the nitrogen content in percentage detected. It is clearly demonstrated that the nitrogen content detected is relatively steady during the whole process, except that there is only early short period of sharp increase in well SN6402, and this adequately proves that gas breakthrough did not happen during the nitrogen foam flooding process.
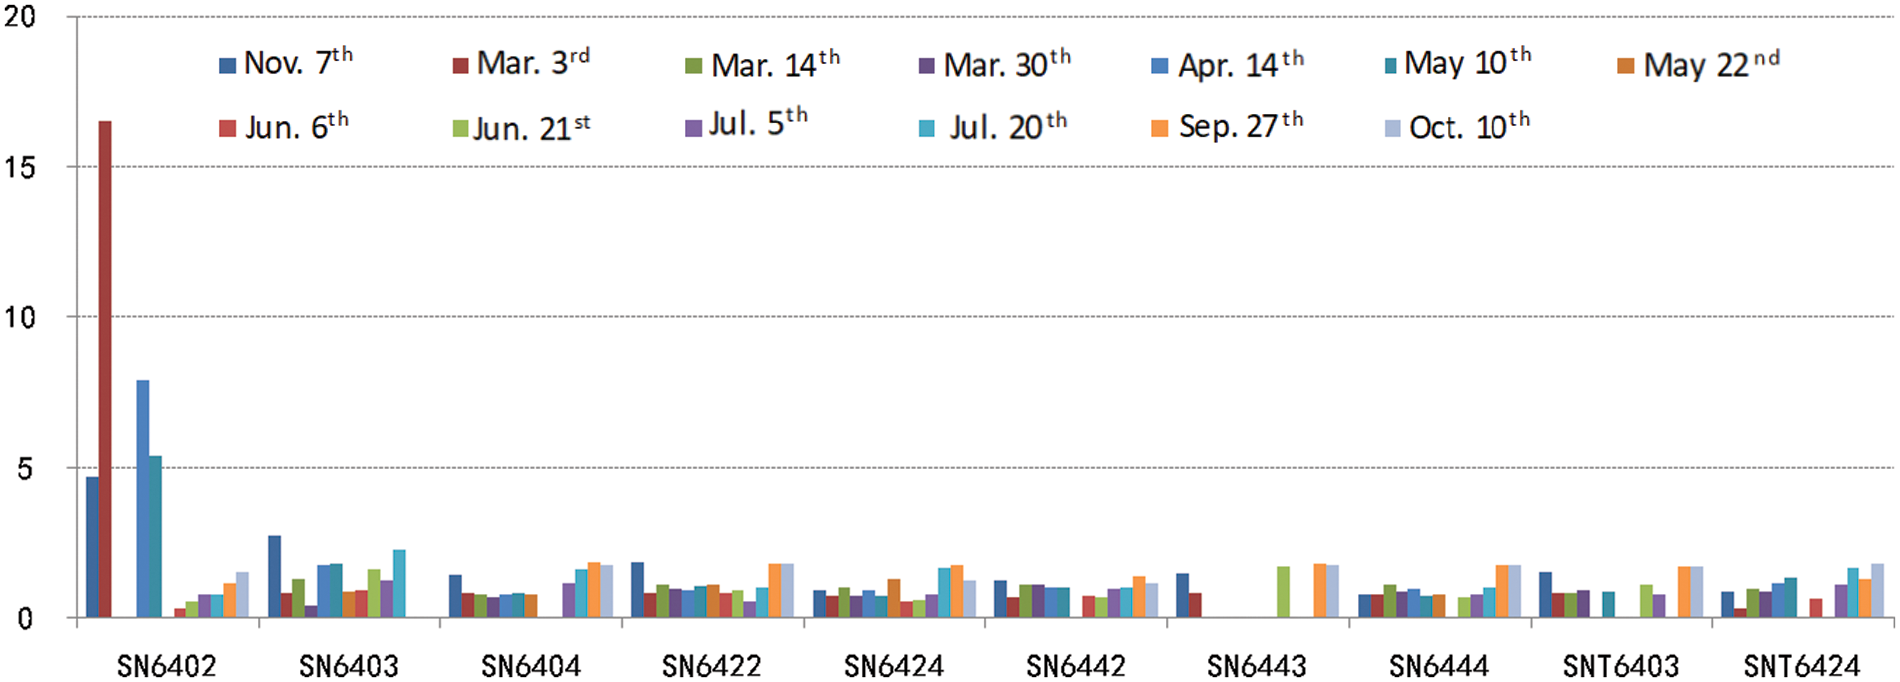
Figure 7: Nitrogen content detected from casing gas in SN6423 well group
The results of nitrogen foam flooding are detected promptly during the whole injection process. The comprehensive effects are summarized in four aspects:
(1) Pressure Index and Filling Degree Decreased Sharply after Injection
This part mainly refers to the results generated on injector SN6423. Fig. 8 is about the pressure index and filling degree of injector SN6423. The two columns on the left refer to the value of pressure index and the two columns on the right refer to the value of filling degree. The columns with blue color refer to the results just after the first round of injection and the columns with red color refer to the results after another 1 year. The pressure index and filling degree of Well SN6423 reached to 6.2 and 0.8 respectively just after the injection. This adequately proves that the agent formulation injected has good effects for profile adjustment. After another 1 year, the pressure index and filling degree decreased to 1.9 and 0.6, respectively. This shows that the plugging capabilities of foam become weak and the water adsorption abilities start to recover for layer J2t23.
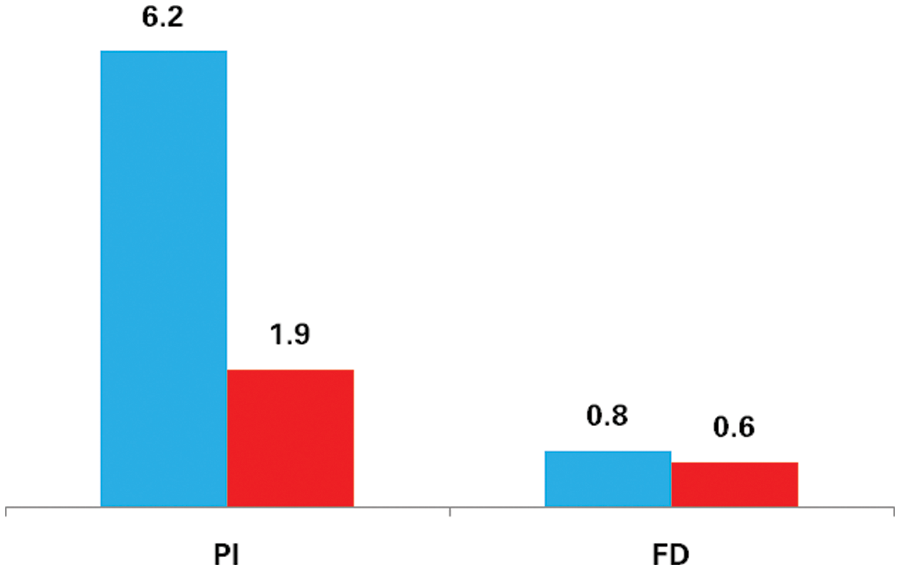
Figure 8: Pressure index and filling degree of well SN6423
(2) Fluid Injection Profile Is Improved
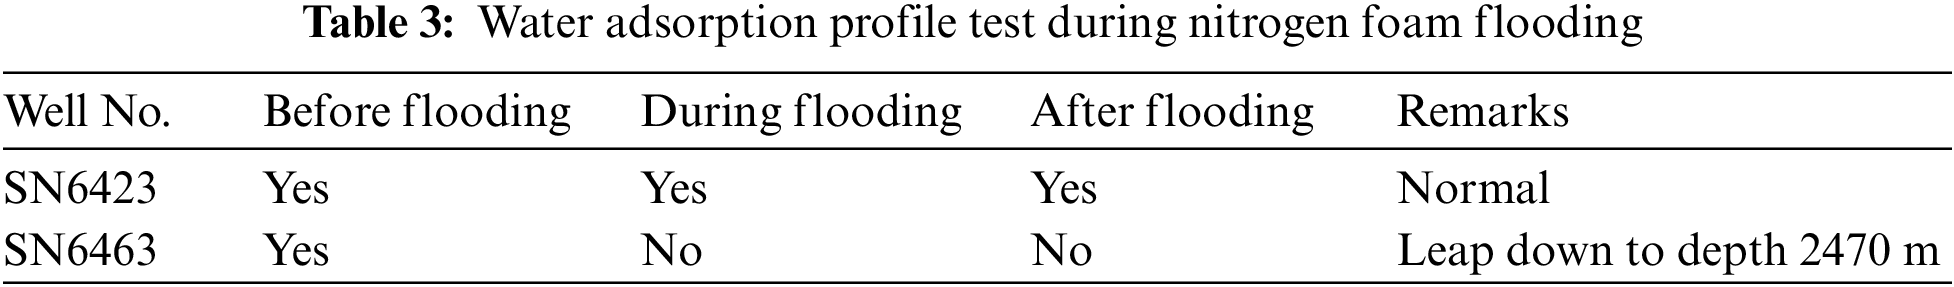
This evaluation also refers to the results generated on injectors. Detailed test records are as shown in Table 3 below. The water absorption profile of SN6463 had always been normal during the flooding. However, profile test showed that the injected water leap down to the depth of 2470 m after entering into the perforated layer, so the injection profile cannot be compared with that before the nitrogen foam flooding.
As for well SN6423, its water absorption percentage in different layers are as demonstrated on Fig. 9 below. The horizontal abscissa represents the water absorption percentage before and after foam flooding. The two bars on the top refer to the water absorption percentage of layers J2t21+2 and J2t23 before flooding. The two bars at the bottom refer to the water absorption percentage of layers J2t21+2 and J2t23 after flooding. From the bar chart, it is clear that the water absorption percentage of layer J2t21+2 increased from 13.3% to 48.6% after the flooding, and more reserves will be produced. The water absorption percentage of layer J2t23 decreased from 86.7% to 51.4% after the flooding, and the high permeability channels were effectively plugged after the flooding.
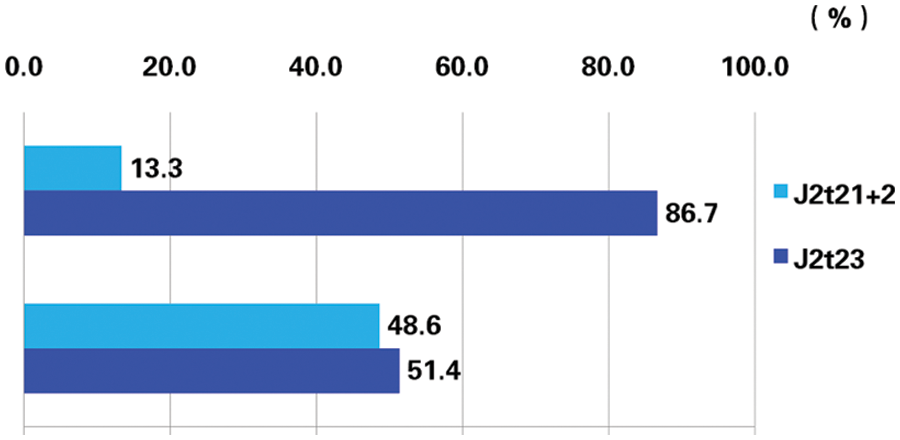
Figure 9: Bar chart of water absorption percentage before and after flooding in well SN6423
(3) Oil Increase and Water Decrease for Producers
The 2 injectors serves for 17 producers on site. 1 producer was closed due to abnormal well conditions and the other 16 producers all operate normally and the effects can be evaluated. Among the 16 producers, 8 producers operated with increased oil production and decreased water cut; water breakthrough was inhibited successfully within the other 4 producers and the water cut became relatively steady in these 4 wells. For the results in the overall, the oil production is increased and the liquid yield is decreased.
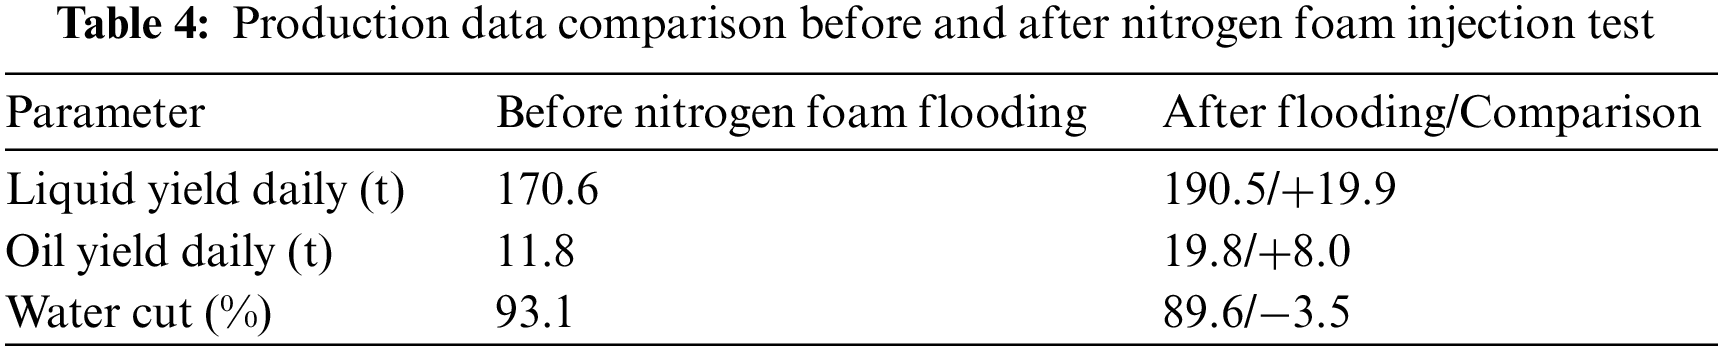
There are actually three characteristics for nitrogen foam flooding in this pilot test. First, the EOR results are obtained very quickly, and oil production increased only after 1 month of flooding. Second, the highest increase of oil production happened during the process of flooding. The oil production peak reached 23.9 t per day which is increased by 11.9 t per day. Third, the duration of effects last long which can reach as long as 18 months. Table 4 demonstrates the difference before and after nitrogen foam injection in detail. The daily liquid yield increases from 170.6 to 190.5 t; the daily oil yield increases from 11.8 to 19.8 t; the water cut decreased from 93.1% to 89.6%.
The oil production in the whole test area is also demonstrated in figure below. The horizontal abscissa represents the month, including 9 months before flooding test and 21 months after flooding test, and the vertical ordinate represents the oil increment of the month. From Fig. 10, it is clear to see the oil production trend with natural decline. The dots in small triangle shape refer to the oil production before flooding test and the dots in small square shape refer to the oil production after flooding test. It is easy to see that the natural decline rate tend to become slow after flooding and the oil increase peak happens after 3 months injection. Actually, the average oil increase for a month can reach above 260 t and the cumulative oil increase reach 4947 t for the whole area.
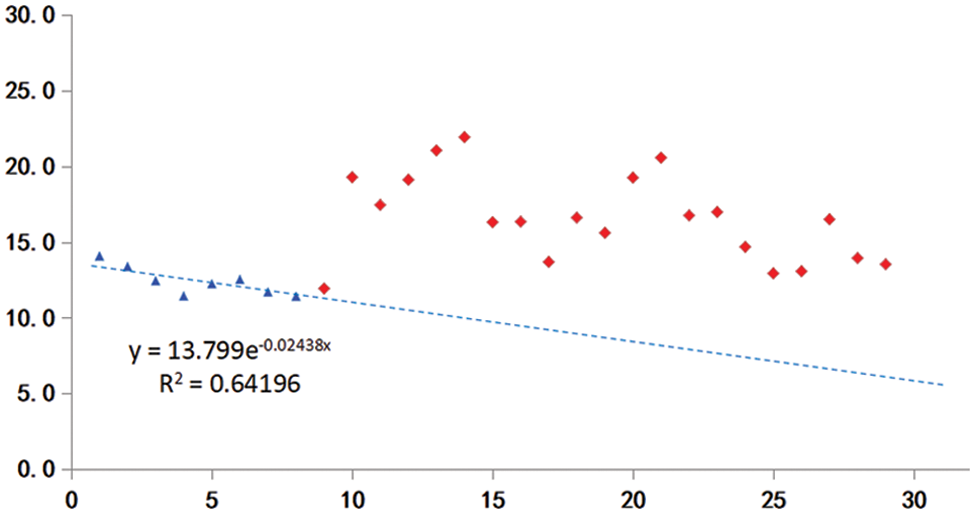
Figure 10: Oil production with natural decline in the test area
(4) Liquid Production Profile Tend to Become Even
Fig. 11 below demonstrates the liquid production profile before and after the flooding test. The horizontal abscissa represents the percentage of produced fluid in the high-permeability zone. The three bars on the top refer to the producing percentage of each layer before flooding. The three bars in the middle refer to the producing percentage of each layer just after flooding. The three bars at the bottom refer to the producing percentage of each layer after 1 year of flooding. It is cleat that the producing percentage of high permeability layer J2t23 reduced from 54.3% to 39.6% after flooding. At the same time, the producing percentage of the other two layers become larger and the total producing percentage of layers become even. After another 1 year, the effects is still retained relatively well with producing percentage evenly distributed among different layers.
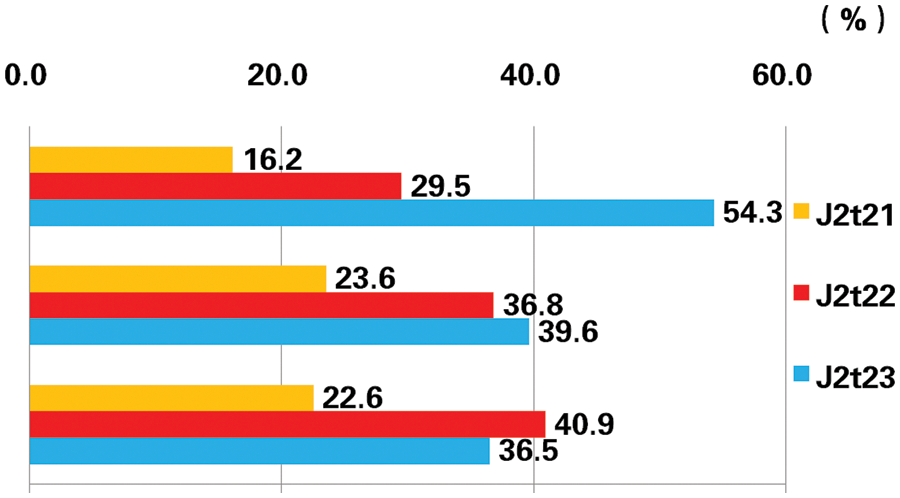
Figure 11: Producing status of liquid production profile
Based on development characteristics and historical backgrounds of M unit in Xinjiang oilfield, pilot test of nitrogen foam flooding is conducted for enhanced oil recovery. Injection scheme with important parameters is set step by step and the results concerning injectors and producers are all analyzed in detail.
• The pressure index and filling degree of injectors decreased sharply after injection of nitrogen foam.
• The fluid injection profile are improved in injectors.
• There are increased oil production and decreased water cut for most of the related producers. The natural decline rate in the test area tend to become slow.
• The liquid production profile in producers tend to become even for 3 layers.
This study proves that nitrogen foam flooding can be good technology with bright development prospects and can make great contribution for enhanced oil recovery in low permeability reservoirs.
Acknowledgement: I would like to thank the editorial and reviewer panel for their input and comments.
Funding Statement: This work is supported by the Prospective and Fundamental Project of CNPC “Study on the EOR Technology by Foam Flooding (2021DJ1603)”, and by Open Fund of State Key Laboratory of Enhanced Oil Recovery, CNPC (2022-KFKT-29).
Conflicts of Interest: The authors declare that they have no conflicts of interest to report regarding the present study.
References
1. Zhao, H., Liao, X. (2011). Key problems analysis on CO2 displacement and geological storage in low permeability oil reservoir China. Journal of Shanxi University of Science and Technology (Natural Science Edition), 29(1), 1–6. [Google Scholar]
2. Wang, C., Hong, L., Gao, R., Wang, W., Zhang, Z. et al. (2018). Status-quo and challenges of enhanced oil recovery in low permeability reservoirs. Unconventional Oil & Gas, 5(3), 102–108. [Google Scholar]
3. He, Y., Xiao, L., Mao, Z., Zhang, Y. (2005). The present challenges and research direction of well logging evaluation methods in low porosity, low permeability and low saturation reservoir. Progress in Geophysics, 20(2), 282–288. [Google Scholar]
4. Wang, G., Liao, R., Li, J., Yuan, X., Zhan, C. et al. (2007). The development situation and future of low permeability oil reservoirs of SINOPEC. Petroleum Geology and Recovery Efficiency, 14(3), 84–89. [Google Scholar]
5. Hu, W., Wei, Y., Bao, J. (2018). Development of the theory and technology for low permeability reservoirs in China. Petroleum Exploration and Development, 45(4), 646–656. [Google Scholar]
6. Li, X., Xu, J., Liu, X., Zheng, L., Pu, C. (2017). Plugging performance evaluation and field test of vibration-air foam flooding. Journal of Xi’an Shiyou University (Natural Science), 32(1), 83–88. [Google Scholar]
7. Liu, Z., Li, Z. (2015). An experimental study on anti-channeling technology with foam in CO2 flooding. Journal of Southwest Petroleum University (Science & Technology Edition), 37(5), 117–122. [Google Scholar]
8. Wu, Y., Zhang, Y., Duan, W. (2014). Experimental study on profile-controlling mechanisms of air foam flooding in tight oil reservoirs. Geoscience, 28(6), 1315–1321. [Google Scholar]
9. Lv, X., Yue, X., Wu, Y., Feng, J. (2005). Safety analysis of enhancing oil recovery by air-foam flooding. Petroleum Geology and Reservoir Efficiency, 12(5), 44–46. [Google Scholar]
10. Wang, J., Wang, T., Han, L., Ren, W. (2013). Experimental study of improved oil recovery through air foam flooding in ultra-low permeability reservoir. Journal of Southwest Petroleum University (Science & Technology Edition), 35(5), 130–134. [Google Scholar]
11. Zhao, J., Li, P., Du, X., Hu, J. (2016). Injection parameter optimization of air foam flooding in Y2 of Huaqing oilfield. Energy Chemical Industry, 37(5), 29–33. [Google Scholar]
12. Lei, J., Zhang, Y., Zeng, Y., Wang, Y., Guo, H. (2016). Indoor experimental screening of foaming agent for air foam flooding in a fractured tight reservoir. Zhongzhou Coal, 50(8), 161–164. [Google Scholar]
13. Jiang, H., Liao, K., Li, S., Yuan, S., Shi, Y. (2019). Quantitative risk evaluation method for air foam flooding field test. Mathematics in Practice and Theory, 49(4), 89–98. [Google Scholar]
14. Zhang, H., Zheng, J., Zhang, L., Ren, S., Chen, Y. (2014). A laboratory experimental study on air foam flooding in north Gaoqian viscous oil reservoir. Oilfield Chemistry, 31(4), 527–530. [Google Scholar]
15. Chen, Z., Yu, H., Zhang, F., Ren, S. (2012). Low temperature oxidation kinetics model and analysis of influence factors in air foam flooding of M15 block. Science Technology and Engineering, 12(18), 4363–4368. [Google Scholar]
16. Raj, I., Liang, T., Qu, M., Xiao, L., Hou, J. et al. (2020). An experimental investigation of MoS2 nanosheets stabilized foams for enhanced oil recovery application. Colloids and Surfaces A: Physicochemical and Engineering Aspects, 606(1), 125420. DOI 10.1016/j.colsurfa.2020.125420. [Google Scholar] [CrossRef]
17. Liang, T., Hou, J., Qu, M., Xi, J., Raj, I. (2022). Application of nanomaterial for enhanced oil recovery. Petroleum Science, 19(2), 882–899. DOI 10.1016/j.petsci.2021.11.011. [Google Scholar] [CrossRef]
18. Janssen M. T., Zitha P. L., Pilus R. M. (2019). Oil recovery by Alkaline/Surfactant/Foam flooding: Effect of drive-foam quality on oil-bank propagation. SPE Journal, 24(6), 2758–2775. DOI 10.2118/190235-PA. [Google Scholar] [CrossRef]
19. Telmadarreie, A., Trivedi, J. (2016). New insight on carbonate-heavy-oil recovery: Pore-scale mechanisms of post-solvent carbon dioxide foam/polymer-enhanced-foam flooding. SPE Journal, 21(5), 1655–1668. DOI 10.2118/174510-PA. [Google Scholar] [CrossRef]
20. Li, X., Chen, X., Xu, Z., Pu, C. (2022). A novel foam flooding for enhanced oil recovery in fractured low-permeability reservoirs: Performance evaluation and mechanism study. SPE Journal, 27(4), 2408–2424. DOI 10.2118/209623-PA. [Google Scholar] [CrossRef]
21. Zeng, X., Peng, P., Chen, D., Lou, Z., Gao, Z. (2002). Pilot field test of nitrogen injection in low permeability oil reservoir in Zhong-yuan oilfield. Petroleum Geology & Oilfield Development in Daqing, 21(3), 68–69. [Google Scholar]
22. Ma, J., Lu, H., Chen, J., Bian, Y., Liu, Z. (2004). Effect evaluation of microbe field test in Daqing’s marginal oilfields with ultra-low permeability. Petroleum Geology & Oilfield Development in Daqing, 23(6), 74–75. [Google Scholar]
Cite This Article
 Copyright © 2023 The Author(s). Published by Tech Science Press.
This work is licensed under a Creative Commons Attribution 4.0 International License , which permits unrestricted use, distribution, and reproduction in any medium, provided the original work is properly cited.
 Downloads
 Citation Tools