
 Submit a Paper
 Propose a Special lssue
 Open Access
ARTICLE

Identification Method for Users-Transformer Relationship in Station Area Based on Local Selective Combination in Parallel Outlier Ensembles Algorithm
1 State Grid Jiangsu Electric Power Co., Ltd., Nanjing, 210000, China
2 College of Energy and Electrical Engineering, Hohai University, Nanjing, 210000, China
3 Jiangsu Frontier Electric Power Technology Co., Ltd., Nanjing, 210000, China
* Corresponding Author: Junwei Niu. Email:
Energy Engineering 2023, 120(3), 681-700. https://doi.org/10.32604/ee.2023.024719
Received 06 June 2022; Accepted 29 August 2022; Issue published 03 January 2023
 View Full Text
 Download PDF
Abstract
In the power distribution system, the missing or incorrect file of users-transformer relationship (UTR) in low-voltage station area (LVSA) will affect the lean management of the LVSA, and the operation and maintenance of the distribution network. To effectively improve the lean management of LVSA, the paper proposes an identification method for the UTR based on Local Selective Combination in Parallel Outlier Ensembles algorithm (LSCP). Firstly, the voltage data is reconstructed based on the information entropy to highlight the differences in between. Then, the LSCP algorithm combines four base outlier detection algorithms, namely Isolation Forest (I-Forest), One-Class Support Vector Machine (OC-SVM), Copula-Based Outlier Detection (COPOD) and Local Outlier Factor (LOF), to construct the identification model of UTR. This model can accurately detect users’ differences in voltage data, and identify users with wrong UTR. Meanwhile, the key input parameter of the LSCP algorithm is determined automatically through the line loss rate, and the influence of artificial settings on recognition accuracy can be reduced. Finally, this method is verified in the actual LVSA where the recall and precision rates are 100% compared with other methods. Furthermore, the applicability to the LVSAs with difficult data acquisition and the voltage data error in transmission are analyzed. The proposed method adopts the ensemble learning framework and does not need to set the detection threshold manually. And it is applicable to the LVSAs with difficult data acquisition and high voltage similarity, which improves the stability and accuracy of UTR identification in LVSA.Keywords
Nomenclature
| UTR | Users-transformer relationship |
| LVSA | Low-voltage station area |
| LSCP | Local Selective Combination in Parallel Outlier Ensembles algorithm |
| I-Forest | Isolation Forest |
| OC-SVM | One-Class Support Vector Machine |
| COPOD | Copula-Based Outlier Detection |
| LOF | Local Outlier Factor |
| DTW | Dynamic time warping distance |
| MILP | Mixed integer linear programming |
| LVDN | Low-voltage distributed network |
| KNN | K-Nearest Neighbor |
The users-transformer relationship (UTR) refers to the subordinate relationship between the end user’s electricity meter and the transformer in the low-voltage station area (LVSA). The UTR of LVSA in China is shown in Fig. 1. The correct UTR is the guarantee for outage management [1], LVSA line loss calculation [2], line transformation, and other services [3]. The transformation and upgrading of low-voltage distribution lines make the relationship between users and transformer change frequently [4]. Delay or manual omission in the information update of power distribution system will lead to wrong UTR files in LVSA. The incorrect UTR affects the operation and maintenance of the distribution network [5], and causes the inconsistent measurement data of the marketing measurement system between users and the transformer, which will lead to the abnormal line loss of the LVSA and affect the lean management of the LVSA [6].

Figure 1: The UTR of LVSA in China
To solve the problems, such as abnormal line loss caused by the wrong UTR, it is necessary to identify the UTR in LVSA. Traditional engineering methods, including instantaneous power outage method [7] and pulse current method [8,9], etc., require manual on-site verification and have low accuracy and efficiency, which are not in line with the intelligent development goal of the distribution network. Therefore, it is urgent to put forward a new method of the UTR identification, which can meet the requirements of accuracy and intelligence and facilitate the digital transformation of the distribution network [10].
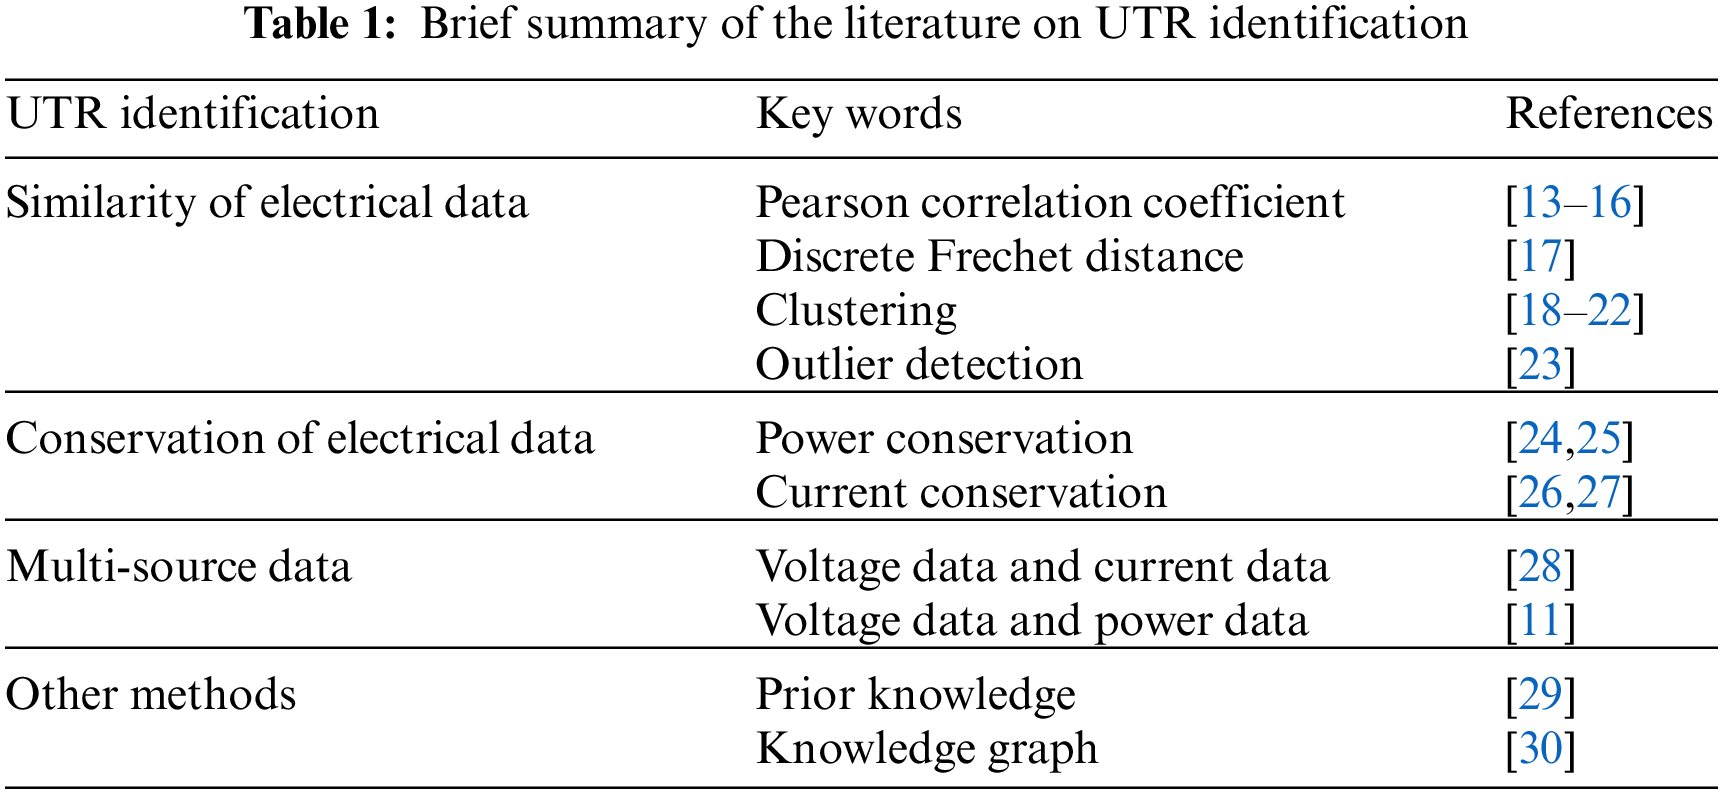
In recent years, with the popularity of smart meters, the acquisition system has accumulated massive electrical data of users, providing a basis for the UTR identification in the LVSA [11,12]. At present, the existing data-driven identification methods for UTR can be roughly divided into four categories, which are based on the similarity of electrical data, conservation of electrical data, multi-source data, and others.
1. Similarity of electrical data: the similarity of all customer voltage data was measured based on the Pearson correlation coefficient [13–16] and discrete Frechet distance [17]. UTR was identified according to the level of similarity. But the boundary between actual LVSAs voltage data is fuzzy, resulting in the similarity threshold difficult to determine. So, users with high similarity of voltage data cannot be distinguished. In [18], the voltage zero-crossing sequences were constructed from raw voltage data. Accordingly, an improved spectral clustering algorithm was proposed for UTR identification. In [19], the adaptive piecewise aggregate approximation algorithm was used to extract the features of voltage data, and the improved density-based spatial clustering of application with noise algorithm was used to get the users with wrong UTR. In [20–22], the dynamic time warping distance (DTW) algorithm was used to analyze the voltage data difference between users and transformer in LVSA, and the UTR was obtained by clustering algorithm according to the DTW distance. The clustering method needs to obtain the number and voltage data of adjacent LVSAs in advance, which is not suitable for the identification of UTR without the boundary of a single station, and is susceptible to the influence of noise data. In [23], an outlier detection algorithm was adopted to rectify the UTR, but this algorithm relies on the selection of the number of neighborhood data points, and is difficult to determine the parameter.
2. Conservation of electrical data: In [24,25], the objective function was constructed according to the power conservation and solved with an optimization algorithm to obtain the membership relationship of users in LVSA. In [26,27], a UTR identification model was constructed based on Kirchhoff’s law of current, and the mixed integer linear programming (MILP) algorithm was used to get the results. However, this method has complicated calculation and high requirements for data integrity. It is not applicable to the LVSA where data collection is difficult.
3. Multi-source data: In [28], principal component analysis and independent component analysis were used to extract features from voltage data. Then, the K-means clustering method is used to classify the voltage data into corresponding groups due to the users in the same LVSA have the same voltage characteristics. Finally, the Pearson correlation coefficient between the different groups of users’ total current and transformer’s current was compared to realize UTR identification. In [11], a multiple linear regression model using voltage and power data of users meters was established to estimate topology, line parameters, and user and line phasing connections in LVSA.
4. Other methods: In [29], a UTR identification algorithm that combines the data preprocessing with multi-dimensional prior knowledge based on voltage characteristics in low-voltage distributed network (LVDN) was proposed to get users with wrong UTR and their real UTR. Each LVDN has its own special structure. The prior knowledge of voltage characteristics extracted from a single LVDN may not be applicable to the identification of the UTR of massive LVSA. In [30], the knowledge graph of LVDN topology was constructed by integrating data in multiple LVDN information systems, and UTR in LVDN information system was verified based on the knowledge graph. However, the formation rules of the knowledge graph of the LVDN topology are complex, which require the fusion of multiple data. The disadvantage of the method lies in the difficulty of obtaining GIS data and the high requirements for the accuracy of data. Table 1 provides a brief summary of the literature on UTR identification.
Based on the voltage distribution characteristics in LVDN, the similarity of voltage data changes is low due to the fact that users in different LVSA belong to different outgoing lines and have a long electrical distance [31]. Based on the voltage data difference of users in different LVSAs, an outlier detection algorithm can be used to identify users with wrong UTR. Zimek et al. [32,33] have studied the ensemble method of outlier detection. Compared with a single outlier detection model, the ensemble method combines multiple outlier detection models to achieve better performance and reliability. The ensemble learning is also widely used in electricity theft detection [34], power dispatching data anomaly detection [35], and time series anomaly detection [36]. Therefore, to enhance the stability and accuracy of identification results, the outlier detection method with an ensemble framework is applied to the UTR identification.
Different electrical characteristics of different LVSAs, high similarity between individual LVSAs voltage data, and limited data, lead to low accuracy, weak applicability and low reliability of UTR identification in the existing methods. To solve these problems, this paper proposes a UTR identification method based on Local Selective Combination in Parallel Outlier Ensembles (LSCP) algorithm. The main contributions of the paper are listed as follows:
1. Information entropy is used to reconstruct the original voltage data to highlight the difference between data and reduce the impact of data noise.
2. Based on the voltage characteristics of the LVDN, an identification method of UTR based on the ensemble framework LSCP algorithm is proposed, which increases the accuracy and stability of identification results of UTR in the LVSA.
3. Based on the historical line loss rate data in LVSA, the key input parameter of the proposed model is determined automatically, which increases the accuracy of the identification result, avoids the artificial parameter setting, and is more suitable for the implementation of the UTR identification in the massive LVSAs.
The rest of this paper is organized as follows. Section 2 describes the mathematical model of the proposed ensemble learning outlier detection algorithm. Section 3 deduces the realization process of UTR identification based on the proposed model. The tests and results are illustrated in Section 4. Lastly, the conclusion of the study and the future work are drawn in Section 5.
2 Ensemble Learning Outlier Detection Model
The core function of the outlier detection method is to identify the data with different regularity from most data in the input dataset. Compared with the outlier detection algorithm of the general ensemble framework, the LSCP algorithm is a completely unsupervised outlier detection algorithm integrated with multiple outlier detection algorithms in parallel [37].
2.1 Introduction of LSCP Algorithm
To strengthen the stability and robustness of the identification result of the UTR in LVSA, we adopt the LSCP algorithm to identify the UTR. Fig. 2 is the overall framework of the LSCP algorithm, The characteristics of the LSCP algorithm are as follows: (1) Multiple base outlier detection models are calculated independently and executed in parallel; (2) According to the performance of the base outlier detection model, the combined base model is dynamically selected; (3) Feature sample subspaces are constructed from subsequences of different dimensions of randomly sampled data to emphasize local anomalies; (4) Support the base outlier detection model of heterogeneous or isomorphic.

Figure 2: The framework of the LSCP algorithm
The specific flow of outlier data detection by the LSCP algorithm is as follows:
1) Train base outlier detector
Enter the voltage dataset
2) Define data local space
For each piece of voltage data
T group random sampling is carried out to obtain T group feature subspace. In the adjacent samples of the feature subspace of data
The cardinality b of the local space of each data
3) Calculate the local anomaly score of data
After the local region of voltage data
4) Pseudo target
The maximum score of R base anomaly detector is taken as the pseudo target of the data sample in Eq. (3). The pseudo target of the data
5) Choose base detection model
The Pearson Correlation Coefficient is calculated between the local anomaly score matrix
6) Anomaly score of data
According to the selected x base detection models, the anomaly score matrix
7) Judge outlier data
After obtaining the anomaly scores matrix
where n is the number of samples in the test dataset, Y is the number of outlier data in the test dataset.
Table 2 summarizes the adjustable parameters when the LSCP algorithm is used to identify the UTR.
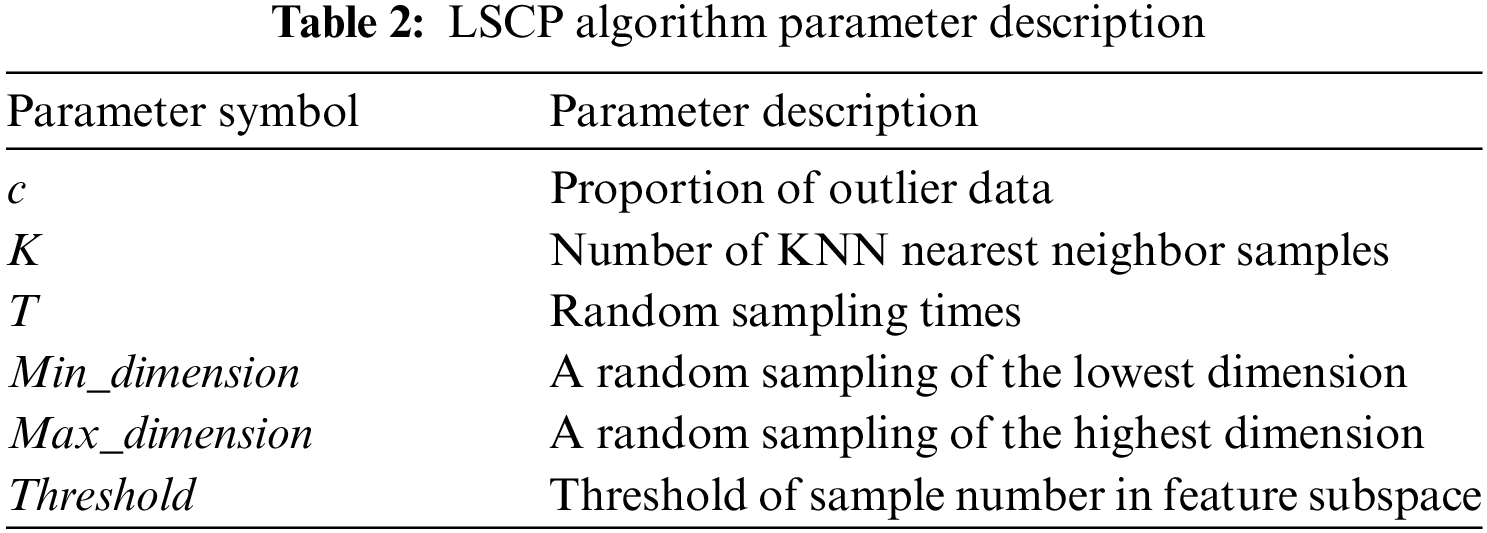
The proportion of outlier data c is a key input parameter, which controls the number of users with wrong UTR. Other parameters are mainly related to the local space construction of the dataset, such as the number of KNN nearest neighbor samples (K), random sampling times (T), random sampling of the lowest dimension (Min_ dimension), random sampling of the highest dimension (Max_ dimension), and threshold of sample number in feature subspace (Threshold).
2.2 Selection of Base Outlier Detection Model for LSCP Algorithm
In this paper, the ensemble learning LSCP algorithm is combined with heterogeneous base outlier detection model, and four classical outlier detection algorithms are used as the base model. The choice of the base detection is Isolation Forest (I-Forest), One-Class Support Vector Machine (OC-SVM), Copula-Based Outlier Detection (COPOD), and Local Outlier Factor (LOF). The four base outlier data detection algorithms are used to detect different angles of data anomalies, promote the learning of different characteristics of the data, and improve the reliability and stability of the detection model.
The Isolation Forest algorithm realizes outlier detection of a dataset based on the idea of partition. The less the sample is divided, the more easily it is isolated, and the higher the anomaly degree of the sample is. The anomaly score of each data is shown in Eq. (6) [38].
where
OC-SVM is an outlier detection algorithm proposed for unbalanced samples. By mapping original data to high-dimensional space through kernel function, there are significant differences between normal data and abnormal data. A hyperplane is constructed to separate the two accordingly. The decision function to judge whether the data is abnormal is shown in Eq. (7) [39].
where
COPOD realizes anomaly detection based on statistical methods. Aiming at the diversity of data distribution and the multidimensional data, it calculates the tail probability of each data point and calculates the skewness of distribution to correct the tail probability of data, so as to estimate the anomaly degree of data. The anomaly score of data x is shown in Eq. (8) [40].
where
LOF is based on the idea of density. It detects anomalies by comparing the density of each point with its neighboring points. Moreover, the LOF algorithm calculates the density through the kth neighborhood of the point, without causing abnormal misjudgment due to different data density dispersion. The local outlier factor of
where
3 Identification of Users-Transformer Relationship in the Station Area
The voltage data of users in different LVSAs are different, showing different trends and characteristics, and the proportion of users with the wrong UTR is very small. Therefore, the problem of UTR identification can be defined as outlier data detection of unbalanced samples. To ensure the accuracy and reliability of the results, this paper adopts the LSCP algorithm with an ensemble framework to identify the relationship between users and the transformer in LVSA.
3.1 Selection and Processing of Algorithm Input Data
At present, the data in the user information collection system of the LVSA includes voltage, current, electricity consumption, and power. In this paper, voltage data is selected as the input of the LSCP algorithm, because the variation patterns of voltage data are not similar for users in different LVSAs due to electrical distances and different outgoing lines [31]. The voltage curves of normal users (users with right UTR) and abnormal users (users with wrong UTR) in the LVSA are shown in Fig. 3.

Figure 3: Voltage curve of users in the station area
As can be seen from Fig. 3, there are different trends between them. To highlight the difference, two-day voltage data of all users in the LVSA are selected as input dataset.
Meanwhile, to highlight the difference in users’ voltage data, this paper reconstructed voltage data based on the information entropy. Information entropy refers to the degree of ordering or complexity of voltage data at different times. When the information entropy of voltage data at a certain time is large, it indicates that the voltage data of the user at that time is greatly different from that of other users. The user’s voltage data Y can be expressed as:
where, M is the number of users; N is the number of voltage data samples; and
Voltage information entropy at different moments can be defined as follows [42]:
where the column vector
Based on the information entropy of voltage data, the voltage data reconstruction coefficient is calculated, as shown in Eq. (16). And the original voltage data Y is reconstructed to obtain the matrix
where
3.2 Determine the Key Input Parameter of the LSCP Algorithm
Based on the LSCP algorithm, the principle of the identification method of the UTR is as follows: input the voltage data reconstructed by information entropy of all users in the LVSA, use the LSCP algorithm to accurately detect the abnormal trend of the voltage data, judge the abnormal degree of the voltage data, and get the abnormal score of the voltage data of each user. The individual user with the highest data anomaly score is regarded as the user with wrong UTR, and the output is 1. Other users are regarded as normal users, and the output is 0. Among the input parameters of the LSCP algorithm, the proportion of outlier data is a key input parameter, which controls the number of users with the wrong UTR. In the UTR identification, the proportion of users with the wrong UTR is unknown. If the proportion of outlier data is set to a fixed value, the accuracy and efficiency of calculation results will be affected. This paper tries to optimize the key input parameters selection of the LSCP algorithm from the perspective of line loss rate, to avoid artificially setting parameters affecting the identification results and improve the practicability of the proposed method. The procedure for determining the key input parameter is as follows:
1. Input different proportions of outlier data values. The LSCP algorithm is used to get the serial number of users with wrong UTR. In this paper, the proportion of outlier data is in the interval [0, 0.10], and the value is traversed every 0.01. This is because the number of users in LVSA in this paper is about 100. When the interval is 0.01, the number of users with wrong UTR output each time increases by about 1. If 0.005 is selected, the amount of calculation will increase; if 0.02 is used, the parameter changes are too large, and it is difficult to find the optimal parameter.
2. The sum of electricity consumption of users with the right UTR is selected to calculate the line loss rate of the LVSA.
3. Considering the LVSA existing line loss, the minimum line loss rate threshold should be set according to the historical line loss record of the system or the actual LVSA characteristics.
4. If the line loss rate calculated according to different input parameters is lower than the minimum line loss threshold, it is considered that an error occurs in the UTR. When the outlier data proportion of input data is increased, the number of users with wrong UTR in output will increase. The users with right UTR may be misjudged as abnormal users, which will further reduce the total power consumption of users in the LVSA and increase the line loss rate. Therefore, on the basis of the minimum line loss threshold, the input value corresponding to the minimum line loss rate is selected as the optimal parameter with flowchart shown in Fig. 4.

Figure 4: Flowchart of determining the key input parameter
3.3 The Realization Process of Users-Transformer Relationship Identification
The specific implementation steps of the UTR identification method based on the proposed method are as follows:
1) Data processing
Filter out and collect complete data from the user information collection system, including 2 days’ voltage data and 10 days’ daily electricity consumption data. Meanwhile, voltage data is reconstructed based on information entropy.
2) Determine the outlier data proportion c
The input parameter outlier data contamination c is traversed every 0.01 in the interval
3) Users-transformer relationship identification
Input the best parameter, use the LSCP algorithm to identify the UTR, and obtain users with wrong UTR in the LVSA.
4) On-site verification
The staff verifies the users with abnormal UTR on-site and updates the system’s UTR files on time.
The electricity consumption and voltage data of Nanjing, Jiangsu Province in April 2020 is selected as the dataset. The voltage data is used to identify the relationship between transformer and user, and the electricity consumption data is used to determine the optimal input parameter of the algorithm. Experiments are carried out in the actual LVSAs to verify the effectiveness and applicability of the proposed method. The structure diagram of the LVSAs is shown in Fig. 5. The LVSA 1 has 107 single-phase residential users. The LVSA 2 has 89 single-phase residential users. The LVSA 3 has 143 single-phase residential users.

Figure 5: Structure diagram of the LVSAs
Three simulation scenarios are set to verify the proposed UTR identification method. Simulation scenario 1: There are 107 users in LVSA 1. 5 users are randomly selected from LVSA 2 and placed in LVSA 1 as users with wrong UTR. Simulation scenario 2: There are 89 users in LVSA 2, and 3 users are randomly selected from LVSA 1 and LVSA 3 respectively as users with wrong UTR. Simulation scenario 3: There are 7 LVSAs in total. 5 users from one LVSA are randomly selected and assigned to the other 6 LVSAs as users with wrong UTR. In this paper, recall and precision are used to evaluate the effect of the method. The calculation of the two indexes is shown in Eqs. (18) and (19).
where
4.1 Determine the Key Input Parameter of the Algorithm
The State Grid Corporation of China defines the abnormal line loss LVSA as that lasts over 10 days. In Simulation scenario 1, the average power consumption of users in the LVSA in 10 days is used to calculate the line loss rate and determine the proportion of outlier data. Input parameters are taken at 0.01 intervals in [0, 0.10], and traversal calculation is carried out to obtain the UTR membership and LVSA line loss rate of each calculation. The LVSA line loss rate is shown in Table 3.
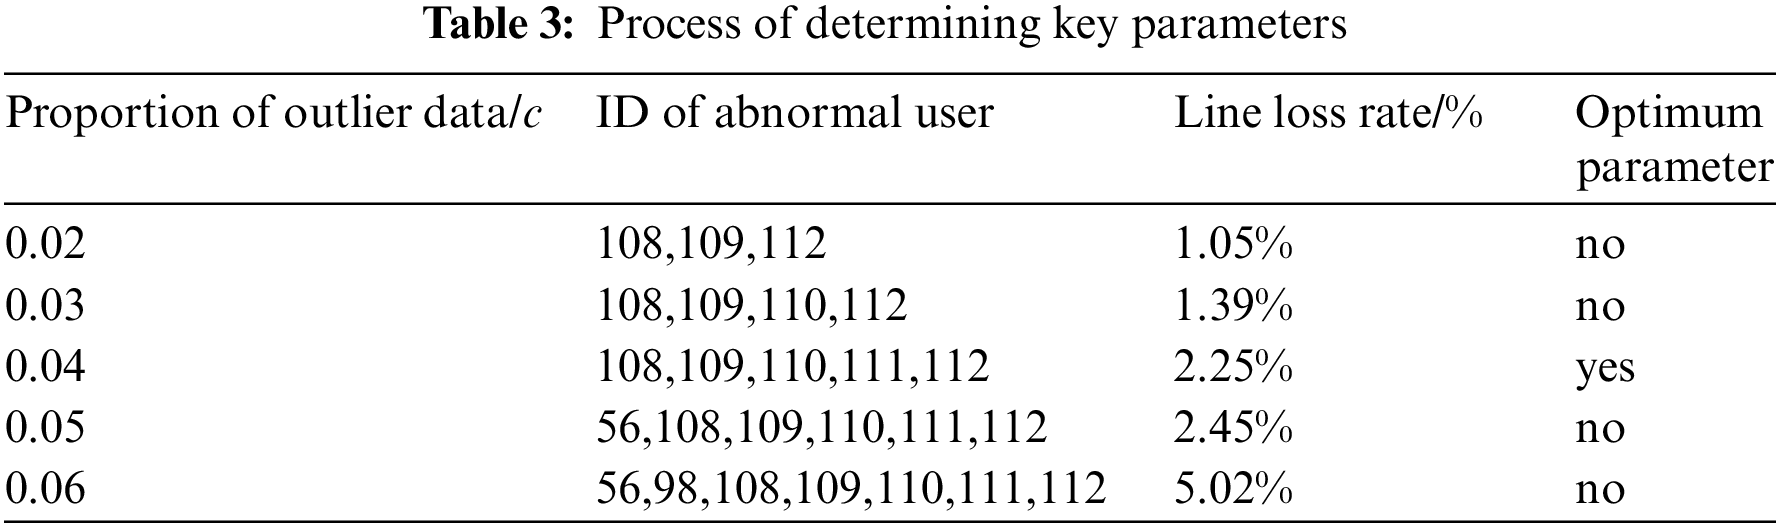
Due to limited space, only the calculation results of parameters in the interval [0.02,0.06] are listed in Table 3. In this paper, the minimum threshold of line loss rate is set as 2%. In practical application, the minimum threshold can be modified according to the historical line loss value and the actual LVSA characteristics. As can be seen from Table 3, based on the specified minimum line loss rate, when the input parameter value is 0.04, the calculated line loss rate is the smallest. Therefore, 0.04 is selected as the best input parameter.
4.2 Example Analysis of Users-Transformer Relationship Identification Based on the LSCP Algorithm
Simulation scenarios 1 and 2 are used to verify the applicability and effectiveness of the identification method of the users-transformer relationship in the station area based on the LSCP algorithm. According to the calculation rules in Section 4.1, the optimal input parameter of the algorithm in simulated scenarios 1 and 2 are 0.04 and 0.06, respectively. The LSCP algorithm selects I-Forest, OC-SVM, COPOD, and LOF as its base outlier detection models, and sets the number of nearest neighbors of the LOF algorithm as 10, 14, 18, and 22 to form a group of heterogeneous base models. Parameter Settings of the LSCP algorithm are shown in Table 4. Input dataset is two-day reconstructed voltage data based on information entropy with the collection frequency 1 h/time and a total of 48 points.

In practice, due to the close electrical distance between LVSAs, the voltage similarity of users in different LVSAs is very high. In simulated scenarios 1 and 2, the Pearson correlation coefficient method is used to measure the voltage data similarity index between the users with normal UTR and users with abnormal UTR in the LVSA. The mean value of the correlation coefficient is shown in Fig. 6.
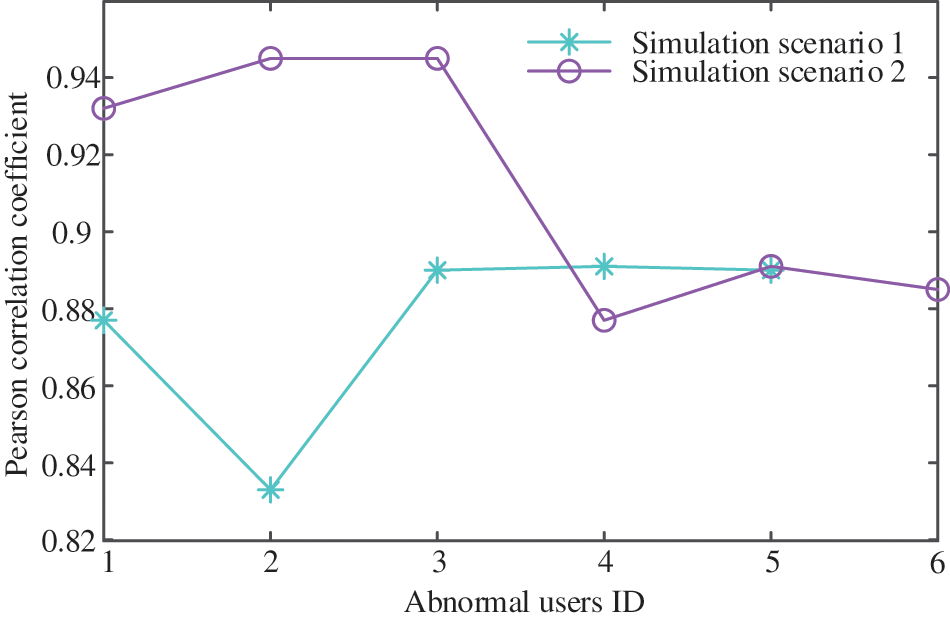
Figure 6: Voltage data correlation coefficient average value
As is seen from Fig. 6, in simulated scenario 2, the voltage data similarity between users in LVSA 2 and LVSA 3 is the highest, reaching above 0.9 because their electrical distance is relatively close. In the simulation scenario with high voltage similarity, the method presented in the paper is used to identify the UTR. The calculation results are shown in Table 5, and the anomaly scores of users’ voltage data in the LVSA is shown in Fig. 7.

Figure 7: Anomaly scores of users’ voltage data in LVSA

In Table 5, both recall and precision rates in the simulated scenario are 100%. In Fig. 7, the anomaly scores of voltage data of users in the LVSA are very different, which is conducive to the identification of users with wrong UTR. In view of the high similarity of voltage data, the method based on the LSCP algorithm is more sensitive to the local difference of voltage curves between normal and abnormal users by constructing the local feature space of data samples. Meanwhile, different outlier detection algorithms based on different principles are used as the base detector, which further ensures the high accuracy and reliability of the identification result.
To further illustrate the superiority of the method proposed in this paper in solving the UTR identification problem in LVSAs, it is compared with the single outlier detection algorithm. The comparison results are shown in Table 6.
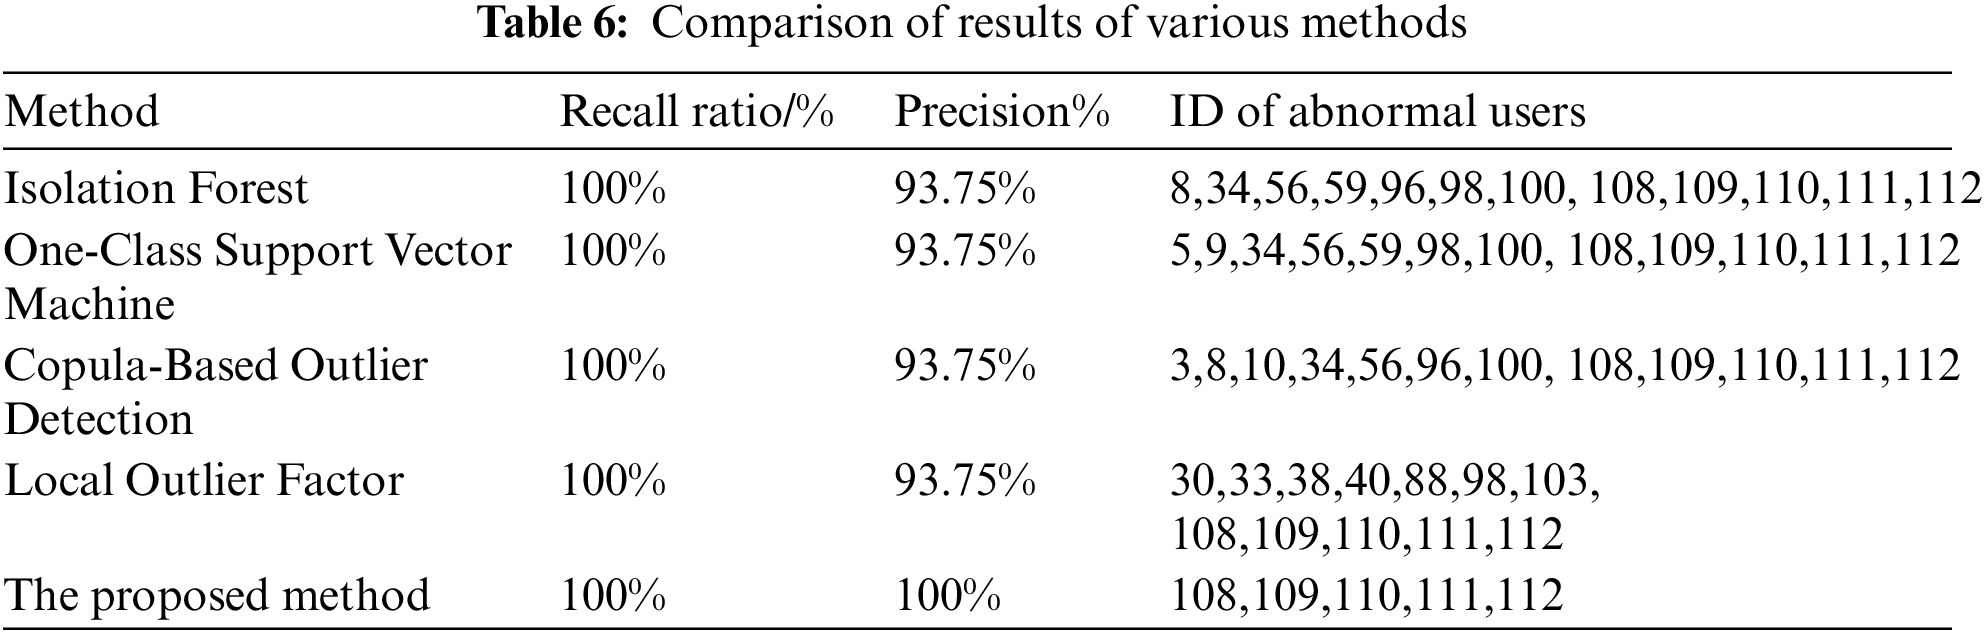
According to the test results in Table 6, general identification methods can cause misjudgment of UTR with the accuracy rate of 93.75% and varied users of wrong UTR. It is also noted that general identification methods detect outlier data from a single angle and do not optimize the input parameter of the algorithm, resulting in poor accuracy and stability. The recall and precision of the proposed method are both 100%, and the input parameter of the algorithm can adapt to the characteristics of the actual station area.
At the same time, to verify the universality and reliability of the proposed method, under simulated scenario 3, the voltage data of two days is used to identify the UTR of six LVSAs. The test results are shown in Table 7.

In Table 7, the recall rate of the LVSA 4 is 80% and the precision rate is 98.71%, missing one user with wrong UTR. The recall rate and precision rate of the other five LVSAs are 100%. However, for the LVSA 4, the recall rate and precision rate can still reach 100% if voltage data of more than 2 days is used for calculation. In practical application, for higher accuracy and reliability, voltage data of more than 2 days can be used for calculation when the voltage data of the station area is sufficient. Therefore, the method proposed in this paper has high accuracy and applicability in the identification of the UTR in LVSA.
4.3 The Practical Analysis of this Method in Application
The influence of the voltage data of different days and the error of voltage data in transmission on the identification result are considered to verify the method in the practical application.
4.3.1 The Influence of Voltage Data in Different Days on the Result
In simulated scenario 1, voltage data of different days are taken as input data to identify the relationship between users and the transformer and to verify the influence of voltage data of different days on the identification result, as shown in Table 8.

It can be seen from Table 8 that the proposed method can accurately identify the UTR by using two-day voltage data. It is also applicable to the LVSA with poor collection function and difficulties in obtaining multi-day complete voltage data, which shows that the proposed algorithm is not too dependent on data. It improves the applicability and reduces the calculation cost.
4.3.2 The Influence of Random Error of Voltage Data Measurement on the Result
Considering the existence of random errors in the measurement and transmission of electricity data, the influence of the errors on the identification results of the proposed method is verified. In simulation scenario 1, the measured voltage data for 30 days in April in the LVSA (the actual measured voltage data contains random measurement errors) is selected, and the two-day data was divided into 1 group. The average test results of 15 groups of data are shown in Table 9.

When testing 15 groups of data, only the third group has a recall rate of 80% and a precision rate of 98.21%, while the other groups have a recall rate and precision rate of 100%. The average recall rate is 98.66% and the average precision rate is 99.88%. Therefore, the random error in voltage measurement has no influence on the accuracy of the algorithm identification results, which further demonstrates the practicability and anti-interference of the proposed method.
This paper proposes an ensemble learning LSCP algorithm to identify the relationship between users and the transformer, which provides a new idea for solving the UTR correction. The proposed method contributes to the lean management of the LVSA, which is of great significance to the economic operation of the LVDN. The effectiveness of the proposed method is verified in the three designed simulation scenarios. It is concluded that the LSCP algorithm of the ensemble framework is used to build an identification model for the UTR, which improves the accuracy and reliability of identification results. The recall and precision rate of this method can reach 100%. The proposed method can make use of two-day voltage data to identify the UTR accurately and avoid the dependence on data, which is applicable to the LVSA where data acquisition is difficult while reducing the cost of calculation. In the case of high voltage similarity of users in different LVSAs, the method presented in this paper can still achieve accurate identification and meet the requirements of practical application. In this paper, the optimal key input parameter of the algorithm is determined automatically by the line loss rate index, which can adapt to the characteristics of different LVSAs actively and improve the practicability. The shortcoming of the proposed method is that it can merely find there are users with wrong UTR in LVSA, without automatically determining which LVSA the user belongs to. In the future, we can study how to achieve UTR identification based on voltage characteristics when photovoltaic and other renewable power generation are connected to the LVSA.
Acknowledgement: The authors would like to acknowledge the State Grid Jiangsu Electric Power Co., Ltd. and Jiangsu Frontier Electric Power Technology Co., Ltd. Special thanks to Professor Sun Guoqiang for his careful guidance on this paper.
Funding Statement: The authors received no specific funding for this study.
Conflicts of Interest: The authors declare that they have no conflicts of interest to report regarding the present study.
References
1. Jiang, Y. C., Liu, C. C., Diedesch, M., Lee, E., Srivastava, A. K. (2016). Outage management of distribution systems incorporating information from smart meters. IEEE Transactions on Power Systems, 31(5), 4144–4154. DOI 10.1109/TPWRS.2015.2503341. [Google Scholar] [CrossRef]
2. Li, P., Yan, Y. H., Xu, M. Z., Liu, F., Wang, J. R. et al. (2019). The research of users-transformer relationship verification method based on data-driven. 2019 IEEE Innovative Smart Grid Technologies—Asia (ISGT Asia), pp. 2550–2554. Chengdu, China. DOI 10.1109/ISGT-Asia.2019.8881160. [Google Scholar] [CrossRef]
3. Luan, W. P., Peng, J., Maras, M., Lo, J., Harapnuk, B. (2015). Smart meter data analytics for distribution network connectivity verification. IEEE Transactions on Smart Grid, 6(4), 1964–1971. DOI 10.1109/TSG.2015.2421304. [Google Scholar] [CrossRef]
4. Yu, J. F., Weng, Y., Rajagopal, R. (2019). PaToPaEM: A data-driven parameter and topology joint estimation framework for time-varying system in distribution grids. IEEE Transactions on Power Systems, 34(3), 1682–1692. DOI 10.1109/TPWRS.2018.2888619. [Google Scholar] [CrossRef]
5. Shi, C. K., Zhang, B., Sheng, W. X., Zhou, M., Gao, Y. et al. (2016). Discussion on functional architecture for distribution network operation and maintenance management platform. Power System Technology, 40(7), 2206–2211. [Google Scholar]
6. Pappu, S. J., Bhatt, N., Pasumarthy, R., Rajeswaran, A. (2018). Identifying topology of low voltage distribution networks based on smart meter data. IEEE Transactions on Smart Grid, 9(5), 5113–5122. DOI 10.1109/TSG.2017.2680542. [Google Scholar] [CrossRef]
7. Zheng, M. C. (2014). Application of instantaneous power failure method in the investigation of household relationship change in area. Guide to Business, 23, 193. [Google Scholar]
8. Ying, J., Chen, Y. L., Ji, W. L., Liu, M. X., You, Y. et al. (2019). Topology modeling method for distribution network via power line communication. 2019 IEEE Innovative Smart Grid Technologies—Asia (ISGT Asia), pp. 323–327. Chengdu, China. DOI 10.1109/ISGT-Asia.2019.888174. [Google Scholar] [CrossRef]
9. Lisowski, M., Masnicki, R., Mindykowski, J. (2019). PLC-enabled low voltage distribution network topology monitoring. IEEE Transactions on Smart Grid, 10(6), 6436–6448. DOI 10.1109/TSG.2019.2904681. [Google Scholar] [CrossRef]
10. Matthew, L., Matthew, J. R., Jouni, P. (2019). Distribution system parameter and topology estimation applied to resolve low-voltage circuits on three real distribution feeders. IEEE Transactions on Sustainable Energy, 10(3), 1585–1592. DOI 10.1109/TSTE.2019.2917679. [Google Scholar] [CrossRef]
11. Cunha, V. C., Freitas, W., Trindade, F. C. L., Santoso, S. (2020). Automated determination of topology and line parameters in low voltage systems using smart meters measurements. IEEE Transactions on Smart Grid, 11(6), 5028–5038. DOI 10.1109/TSG.2020.3004096. [Google Scholar] [CrossRef]
12. Ma, L., Wang, L. F., Liu, Z. X. (2022). Topology identification of distribution networks using a split-EM based data-driven approach. IEEE Transactions on Power Systems, 37(3), 2019–2031. DOI 10.1109/TPWRS.2021.3119649. [Google Scholar] [CrossRef]
13. Zhao, J. M., Cai, Y. Z., Guo, W. C., Li, J. (2021). User-transformer relationship verification method of low voltage distribution network based on voltage correlation analysis. 2021 IEEE International Conference on Electronic Technology, Communication and Information (ICETCI), pp. 163–166. Changchun, China. DOI 10.1109/ICETCI53161.2021.9563352. [Google Scholar] [CrossRef]
14. Blakely, L., Reno, M. J. (2021). Identification and correction of errors in pairing AMI meters and transformers. 2021 IEEE Power and Energy Conference at Illinois (PECI), pp. 1–8. Urbana, United States. DOI 10.1109/PECI51586.2021.9435274. [Google Scholar] [CrossRef]
15. Xiao, Y., Zhao, Y., Tu, Z. D., Dian, B., Chang, R. M. (2019). Topology checking method for low voltage distribution network based on improved pearson correlation coefficient. Power System Protection and Control, 47(11), 37–43. [Google Scholar]
16. Zhang, M. Z., Luan, W. P., Guo, S., Wang, P. (2018). Topology identification method of distribution network based on smart meter measurements. 2018 China International Conference on Electricity Distribution, pp. 372–376. Tianjin, China. DOI 10.1109/CICED.2018.8592228. [Google Scholar] [CrossRef]
17. Tang, D. L., Ni, P. B., Zhang, J., Liu, Y. B., Li, Y. et al. (2021). Identification method for relationship between household transformers based on Discrete Frechet Distance. Automation of Electric Power Systems, 45(6), 223–230. [Google Scholar]
18. Liu, L. N., Li, F. S., Zhou, Y. F., Cheng, Z. J., Qu, M. et al. (2021). An identification algorithm of low voltage user-transformer relationship based on improved spectral clustering. 2021 IEEE 2nd China International Youth Conference on Electrical Engineering (CIYCEE), pp. 1–5. Chengdu, China. DOI 10.1109/CIYCEE53554.2021.9676868. [Google Scholar] [CrossRef]
19. Cui, X. Y., Liu, S. Y., Jin, W. C., Lin, Z. Z., Xuan, Y. H. et al. (2021). Consumer-transformer relationship and phase identification based on APAA and improved DBSCAN algorithm. Power System Technology, 45(8), 3034–3043. [Google Scholar]
20. Hu, W., Guo, Q. H., Wang, W., Wang, W. H., Song, S. H. (2021). Research on user–transformer relationship based on improved dynamic time warping algorithm. 2021 IEEE 5th Conference on Energy Internet and Energy System Integration (EI2), pp. 485–489. Taiyuan, China. DOI 10.1109/EI252483.2021.9713261. [Google Scholar] [CrossRef]
21. Liu, S., Huang, C., Li, K. M., Hou, S. S. (2022). Identification method for household-transformer relationship based on derivative dynamic time warping distance and density-based spatial clustering of application with noise algorithm. Automation of Electric Power Systems, 45(18), 71–77. [Google Scholar]
22. Li, K. M., Jiang, Y. Q., Huang, S. F., Li, J. Q., Yang, M. S. (2021). Topology identification method of a low-voltage distribution station area based on DTW distance and cluster analysis. Power System Protection and Control, 49(14), 29–36. [Google Scholar]
23. Guo, S., Lin, J. Y., Wang, P., Zhang, J. C., Chen, L. et al. (2020). Topology verification of low voltage distribution network based on ROF outliers detection algorithm. Control Engineering of China, 27(1), 201–206. [Google Scholar]
24. Feng, Z. Y., Shen, J., Wang, D. Y., Liu, Y., Wen, G. P. (2020). Transformer area topology verification method based on sparse adaptive learning. Electrical Measurement & Instrumentation, 57(7), 29–34. [Google Scholar]
25. Li, P., Wu, W. J., Yan, Y. H., Xu, B., Liu, F. et al. (2020). Research on the method of transformer-meter relationship verification based on data-driven. Power Demand Side Management, 22(1), 64–68. [Google Scholar]
26. Deng, W., Zhu, J. R., Tang, H. G., Hu, W., Liu, Y. et al. (2021). Users-transformer relationship identification based on smart meter data. 2021 China International Conference on Electricity Distribution (CICED), pp. 1040–1044. Shanghai, China. DOI 10.1109/CICED50259.2021.9556773. [Google Scholar] [CrossRef]
27. Farajollahi, M., Shahsavari, A., Mohsenian-Rad, H. (2020). Topology identification in distribution systems using line current sensors: An MILP approach. IEEE Transactions on Smart Grid, 11(2), 1159–1170. DOI 10.1109/TSG.2019.2933006. [Google Scholar] [CrossRef]
28. Hu, W., Liu, Y., Guo, Q. T., Wang, J., Wang, Y. L. et al. (2020). Detection of users-transformer relationship in the secondary power distribution system with smart meter data. 2020 15th IEEE Conference on Industrial Electronics and Applications (ICIEA), pp. 449–454. Kristiansand, Norway. DOI 10.1109/ICIEA48937.2020.9248159. [Google Scholar] [CrossRef]
29. Zhou, L., Wen, F. J., Yang, X. F., Zhong, Y. M. (2022). User-transformer connectivity relationship identification based on knowledge-driven approaches. IEEE Access, 10, 54358–54371. DOI 10.1109/ACCESS.2022.3175841. [Google Scholar] [CrossRef]
30. Gao, Z. P., Zhao, Y., Yu, Y. L., Luo, Y. J., Xu, Z. W. et al. (2020). Low-voltage distribution network topology identification method based on knowledge graph. Power System Protection and Control, 48(2), 34–43. [Google Scholar]
31. Tang, J., Cai, Y. Z., Zhou, L., Yi, Y. Q., Chen, G. P. et al. (2020). Data-driven based identification method of feeder-consumer connectivity in low-voltage distribution network. Automation of Electric Power Systems, 44(1), 127–134. [Google Scholar]
32. Zimek, A., Campello, R., Sander, J. (2014). Ensembles for unsupervised outlier detection: Challenges and research questions a position paper. ACM SIGKDD Explorations Newsletter, 15(1), 11–22. DOI 10.1145/2594473.2594476. [Google Scholar] [CrossRef]
33. Yao, R., Li, J., Hui, M., Bai, L. (2022). Pattern recognition for partial discharge using adaptive boost classification model based on ensemble method. Power System Technology, 46(6), 2410–2420. [Google Scholar]
34. Khan, I. U., Javeid, N., Taylor, C. J., Gamage, K. A. A., Ma, X. D. (2022). A stacked machine and deep learning-based approach for analysing electricity theft in smart grids. IEEE Transactions on Smart Grid, 13(2), 1633–1644. DOI 10.1109/TSG.2021.3134018. [Google Scholar] [CrossRef]
35. Wang, F., Gao, X., Jia, X., Ren, B., Zha, S. (2021). An anomaly detection ensemble algorithm for power dispatching data based on log-interval isolation. Power System Technology, 45(12), 4818–4827. [Google Scholar]
36. Xu, X., Zhao, H. B., Liu, H. Q., Sun, H. (2020). LSTM-GAN-XGBOOST based anomaly detection algorithm for time series data. 2020 11th International Conference on Prognostics and System Health Management (PHM-2020 Jinan), pp. 334–339. Jinan, China. DOI 10.1109/PHM-Jinan48558.2020.00066. [Google Scholar] [CrossRef]
37. Zhao, Y., Nasrullah, Z., Hryniewicki, M. K., Li, Z. (2019). LSCP: Locally selective combination in parallel outlier ensembles. Proceedings of the 2019 SIAM International Conference on Data Mining, pp. 585–593. Calgary, Alberta, Canada. DOI 10.1137/1.9781611975673.66. [Google Scholar] [CrossRef]
38. Li, X. P., Gao, X., Yan, B., Chen, C. X., Chen, B. et al. (2019). An approach of data anomaly detection in power dispatching streaming data based on isolation forest algorithm. Power System Technology, 43(4), 1447–1456. [Google Scholar]
39. Scholkopf, B., Platt, J. C., Shawe-Taylor, J., Smola, A. J., Williamson, R. C. (2001). Estimating the support of a high-dimensional distribution. Neural Computation, 13(7), 1443–1471. DOI 10.1162/089976601750264965. [Google Scholar] [CrossRef]
40. Li, Z., Zhao, Y., Botta, N., Ionescu, C., Hu, X. et al. (2020). COPOD: Copula-based outlier detection. The 20th IEEE International Conference on Data Mining, pp. 1118–1123. Sorrento, Italy. DOI 10.1109/ICDM50108.2020.00135. [Google Scholar] [CrossRef]
41. Zhao, Q. Z., Li, Y., Tian, S. M., Dong, Y. L., Tan, Y. et al. (2016). A state estimation and fault processing method based on big data analysis of smart distribution network. Power System Technology, 40(3), 774–780. [Google Scholar]
42. Yan, Y. L., Li, J., Li, H., Sun, P., Zhang, X. M. (2015). A wind turbine anomaly detection method based on information entropy and combination model. Power System Technology, 39(3), 737–743. [Google Scholar]
Cite This Article
 Copyright © 2023 The Author(s). Published by Tech Science Press.
This work is licensed under a Creative Commons Attribution 4.0 International License , which permits unrestricted use, distribution, and reproduction in any medium, provided the original work is properly cited.
 Downloads
 Citation Tools