
 Submit a Paper
 Propose a Special lssue
 Open Access
ARTICLE

Electric Vehicle Charging Capacity of Distribution Network Considering Conventional Load Composition
1 Zhangjiakou Power Supply Company, State Grid Jibei Power Co., Ltd., Zhangjiakou, 075000, China
2 Department of Electrical Engineering, North China Electric Power University, Baoding, 071003, China
* Corresponding Author: Haifeng Liang. Email:
Energy Engineering 2023, 120(3), 743-762. https://doi.org/10.32604/ee.2023.024128
Received 24 May 2022; Accepted 26 August 2022; Issue published 03 January 2023
 View Full Text
 Download PDF
Abstract
At present, the large-scale access to electric vehicles (EVs) is exerting considerable pressure on the distribution network. Hence, it is particularly important to analyze the capacity of the distribution network to accommodate EVs. To this end, we propose a method for analyzing the EV capacity of the distribution network by considering the composition of the conventional load. First, the analysis and pretreatment methods for the distribution network architecture and conventional load are proposed. Second, the charging behavior of an EV is simulated by combining the Monte Carlo method and the trip chain theory. After obtaining the temporal and spatial distribution of the EV charging load, the method of distribution according to the proportion of the same type of conventional load among the nodes is adopted to integrate the EV charging load with the conventional load of the distribution network. By adjusting the EV ownership, the EV capacity in the distribution network is analyzed and solved on the basis of the following indices: node voltage, branch current, and transformer capacity. Finally, by considering the 10-kV distribution network in some areas of an actual city as an example, we show that the proposed analysis method can obtain a more reasonable number of EVs to be accommodated in the distribution network.Keywords
With the establishment and growing popularity of strategic objectives such as carbon peaking and carbon neutralization worldwide, as well as the proposal of relevant concepts such as green power grids and green energy consumption, intelligent and sustainable modes of transportation, including electric vehicles (EVs), are being actively promoted [1]. The promotion and application of EVs can play an important role in ensuring national energy security and mitigating the greenhouse effect [2]. However, because EVs use electricity as their only power source, their wide penetration and large-scale access to the power grid may lead to problems such as node voltage out-of-range, transformer overload, and increased network loss, which are not conducive to the safe and stable operation of the distribution network [3,4]. Therefore, analyzing the EV capacity of the current distribution network is important not only for the planning of the power grid, so as to better serve the public, but also for supporting local governments in formulating EV development plans.
EV charging load forecasting is the basis for analyzing the EV charging capacity of the distribution network, and researchers have conducted numerous studies in this regard. By analyzing the characteristics of the temporal distribution of the EV charging load, a Monte Carlo simulation method was used to predict the EV charging load after fitting the probability distribution of the last trip end time and daily mileage of the EV [5,6]. Further, the Poisson distribution model was proposed to analyze the aggregation characteristics of charging loads at EV charging stations. This method considers only the temporal characteristics of EV charging loads and is suitable only for centralized charging scenarios such as shopping mall parking lots, optical storage charging stations, and highway charging stations; it is not suitable for decentralized charging scenarios [7,8]. In addition, the probability distribution of the spatio-temporal characteristics of each segment of the EV trip was fitted according to the trip chain theory to obtain a more accurate spatio-temporal distribution of the EV charging load [9–13]. Considering the impact of the traffic network information on the EV trip, some researchers have also developed dynamic forecasting models for the EV charging demand with high accuracy and good real-time performance [14,15]. In summary, the EV charging load prediction method based on the trip chain theory has the advantages of high accuracy and easy implementation, and it significantly facilitates the study of EV charging load prediction.
The capacity of the distribution network to accommodate EVs depends on various factors, which have been studied from different perspectives in the existing literature. The influence of the EV charging load on the service life of the distribution network transformer has been discussed extensively [16,17]. The number of vehicles in the residential distribution network, the penetration of plug-in hybrid electric vehicles (PHEVs) in the next few years, the distribution of PHEVs in the network, and the estimated household load growth in the next few years have been considered to study the impact of EVs on the residential distribution system; however, other distribution systems such as industrial areas have not been considered [18]. The evaluation index system has been established from the three aspects of rationality, safety, and economy of the distribution network operation, and the capacity of the distribution network has been evaluated from various aspects [19]. The analysis of EV access from the two aspects of distribution network construction investment and network loss during operation has shown that EV access will lead to an increase in both the distribution network investment cost and the network loss [20]. Various factors such as system load size, node voltage offset, and network power loss have been integrated to analyze the ability of the distribution network to accommodate EVs [21–23].
Although the aforementioned studies have used various evaluation indicators to analyze the capacity of the distribution network to accommodate EVs, the following deficiencies persist in the prediction of the EV charging load and the integration of the charging load and conventional load: (1) EV trips are random in time and space, and their charging time and place are related to the journey. However, the aforementioned studies have not fully considered the space-time characteristics of the EV charging load in its prediction. (2) When dividing the distribution network into functional areas, the load category in the functional area is generally considered unique; however, in fact, the load categories in the functional area are diverse. If there is only one load category in the default functional area, the accuracy of the result will be affected. Therefore, the conventional load should be processed more finely.
In view of the aforementioned shortcomings, this paper proposes a method for analyzing the EV capacity of the distribution network by considering the composition of the conventional load. First, the power load units in the distribution network are classified according to the load characteristics. Then, the distribution network topology is established by dividing the network into multiple small power supply areas. By combining the trip chain theory and the Monte Carlo method, the temporal and spatial distribution of the EV charging load is predicted, and a distribution method based on the proportion of the same type of conventional load between each node is proposed to integrate the charging load prediction results with the conventional load of the distribution network. The EV capacity of the regional distribution network is analyzed on the basis of the following indices: node voltage, branch power, and transformer load capacity. Finally, by considering a regional 10-kV distribution network as an example, the capacity of the distribution network to accommodate EVs is analyzed.
2 Distribution Network Model Analysis and Preprocessing
2.1 Classification of Power Load Units
Owing to the complex distribution network lines and numerous loads in reality, as well as the random specific charging locations for EVs, a method for power load unit classification is proposed to prepare for the subsequent EV charging load distribution to each node of the distribution network.
A power load unit refers to the load with an independent distribution room or transformer for the power supply. Common power load units include residential buildings, communities, villages, office buildings, schools, and industrial parks. According to the load characteristics, the power load units can be categorized into residential load, commercial load, and office load. For convenience of the subsequent discussion, they will be denoted by class a, class b, and class c, respectively. The specific definitions are as follows.
1) Class a load
It refers to the load that maintains the normal operation of residential places: a = {communities, villages, nursing homes, etc.}.
2) Class b load
It refers to the load for commercial activities, b = {hotels, clubs, scenic spots, office buildings, etc.}.
3) Class c load
It refers to the load involved in office and production activities, c = {government organs, schools, industrial parks, etc.}.
2.2 Division of Small Power Supply Areas
Owing the large number of power load units in the distribution network, to simplify the distribution network and facilitate the calculation, the concept of small power supply areas is proposed. It is simply understood that the power load units that are located on the same line and are relatively close to each other constitute a small power supply area. By dividing the distribution network into small power supply areas, the power load units in a certain range are gathered into a load node. Owing to such division, the distribution network is simplified considerably, as shown in Fig. 1.
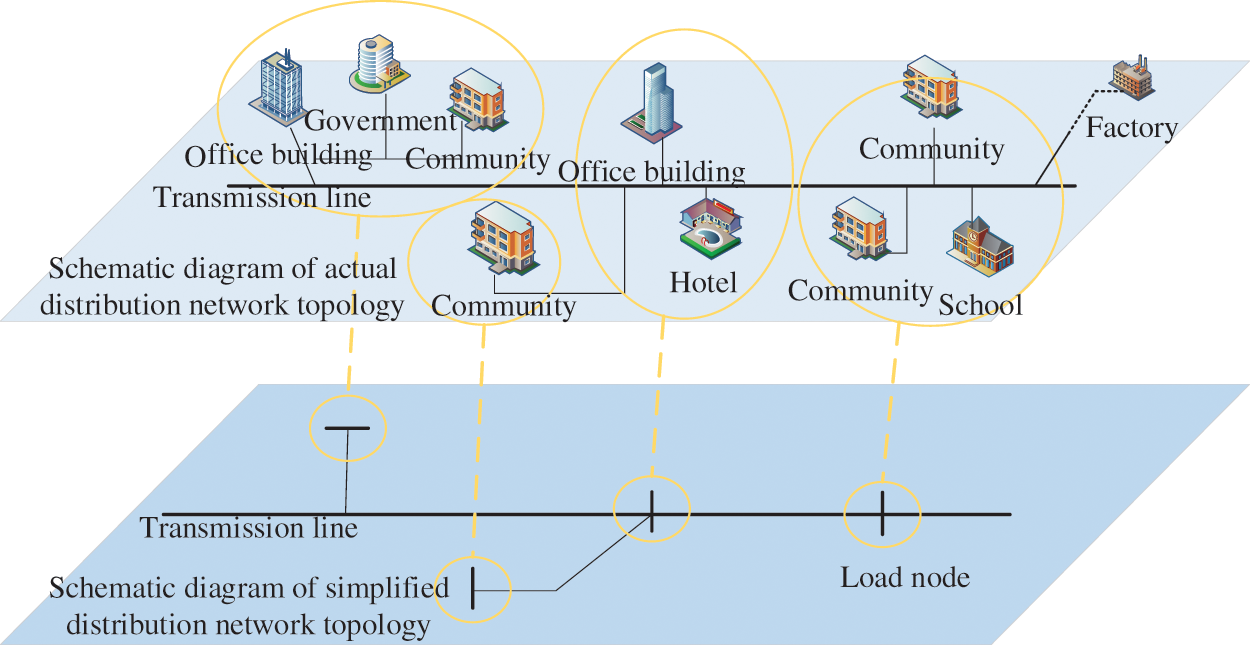
Figure 1: Simplification of the distribution network
According to the division method shown in Fig. 1, the distribution network can be simplified into a network topology composed of several nodes. In addition, as can be seen from the figure, a node may contain multiple categories of power load units.
3 Analysis of EV Capacity of Distribution Network
3.1 EV Charging Load Forecasting Considering Spatio-Temporal Characteristics
According to the description of an EV trip in the trip chain theory, the daily trip process of a single EV is determined by the trip characteristic quantities, such as the first trip time Ts,1, the trip time tx from the departure to the destination, the parking time tp of different trip destinations, and the trip mileage d per trip [24]. The structure of the trip chain is shown in Fig. 2.
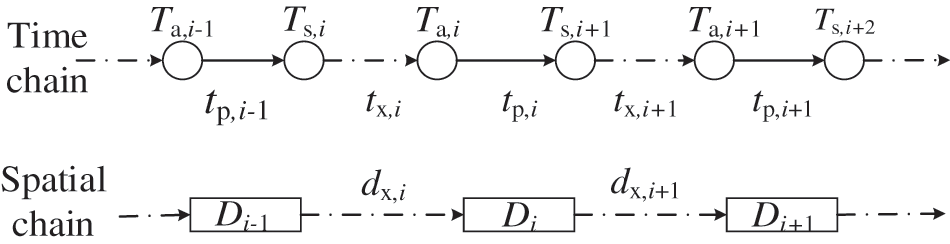
Figure 2: Structure of the trip chain
The characteristic quantity in the trip chain can be categorized into time and space; i refers to the i-th trip with Di-1 as the starting point and Di as the destination; Ts,i and Ta,i represent the departure time and arrival time of the i-th trip, respectively; tx,i and tp,i represent the driving time of the i-th trip and the parking time at the destination, respectively; and dx,i represents the driving distance of the i-th trip.
3.1.2 Spatio-Temporal Variable Parameter Fitting
A suitable probability distribution model is selected for fitting according to the data distribution characteristics. When the data distribution characteristics are different from the distribution characteristics of common probability models, a Gaussian mixture distribution can be used for fitting, and its probability density function can be described by the weight
The analysis of the trip data revealed that the first trip moment of the day for the EV users obeys a one-dimensional Gaussian mixture distribution
3.1.3 Charging Behavior Criterion
According to the aforementioned method, the fitting of the EV travel characteristic quantities is completed, and the probability distribution of each characteristic quantity is calculated subsequently. Finally, the complete EV travel chain is generated through Monte Carlo random simulation. Furthermore, the endurance capacity of the vehicle decreases continuously during driving; hence, the initial state of charge (SOC) of the EV is set to 1 to update the battery charge state during driving. The calculation formula is expressed as follows:
where SOCi−1 and SOCi denote the battery charge state before and after the i-th trip, respectively, dx,i is the driving mileage (km), Q100 is the battery power consumption per 100 kilometers (kwh/100 km), and Cb is the battery capacity (kWh).
It is assumed that the EV is charged when
It should be noted that in the survey and statistical data of users' trips in this study, there is no distinction between EVs and fuel vehicles, i.e., EVs and fuel vehicles are assumed to have the same trip regularity. In addition, this study is mainly based on the development status of EVs in the northern cities of China. At this stage, private EVs account for the vast majority of the EV market, whereas other types of EVs such as electric taxis account for a small proportion; the error caused by ignoring them is negligible. Moreover, considering that the charging of electric buses is uniformly dispatched by the operation company, it involves good planning and can be regarded as the conventional load in the distribution network. Hence, it will not be considered.
3.2 Distribution of EV Charging Load
The temporal and spatial distribution of the EV cluster charging load in Section 3.1 includes the charging load of EVs connected to residential, commercial, and office areas in each time period and the total charging load in each time period. To integrate the EV charging load with the conventional load of the distribution network and compensate for the shortage of a single load in each functional area in the traditional distribution method, by completing the pretreatment of the distribution network model, a distribution method based on the proportion of a similar conventional load among the nodes is proposed. The distribution calculation formula is expressed as follows:
where N is the number of distribution network nodes; Lb_i,a, Lb_i,b, and Lb_i,c are the class a, class b, and class c conventional loads on node i, respectively; Lev,a, Lev,b, and Lev,c are the EV charging loads connected to residential, commercial, and office areas, respectively; Lev,i is the EV charging load on node i; and Lb_i is the foundation load on node i.
By superimposing the EV charging load and the conventional load, the total load of the node after connecting the EV charging load can be obtained as follows:
where Li is the total load on node i.
A schematic diagram of the allocation method is shown in Fig. 3.
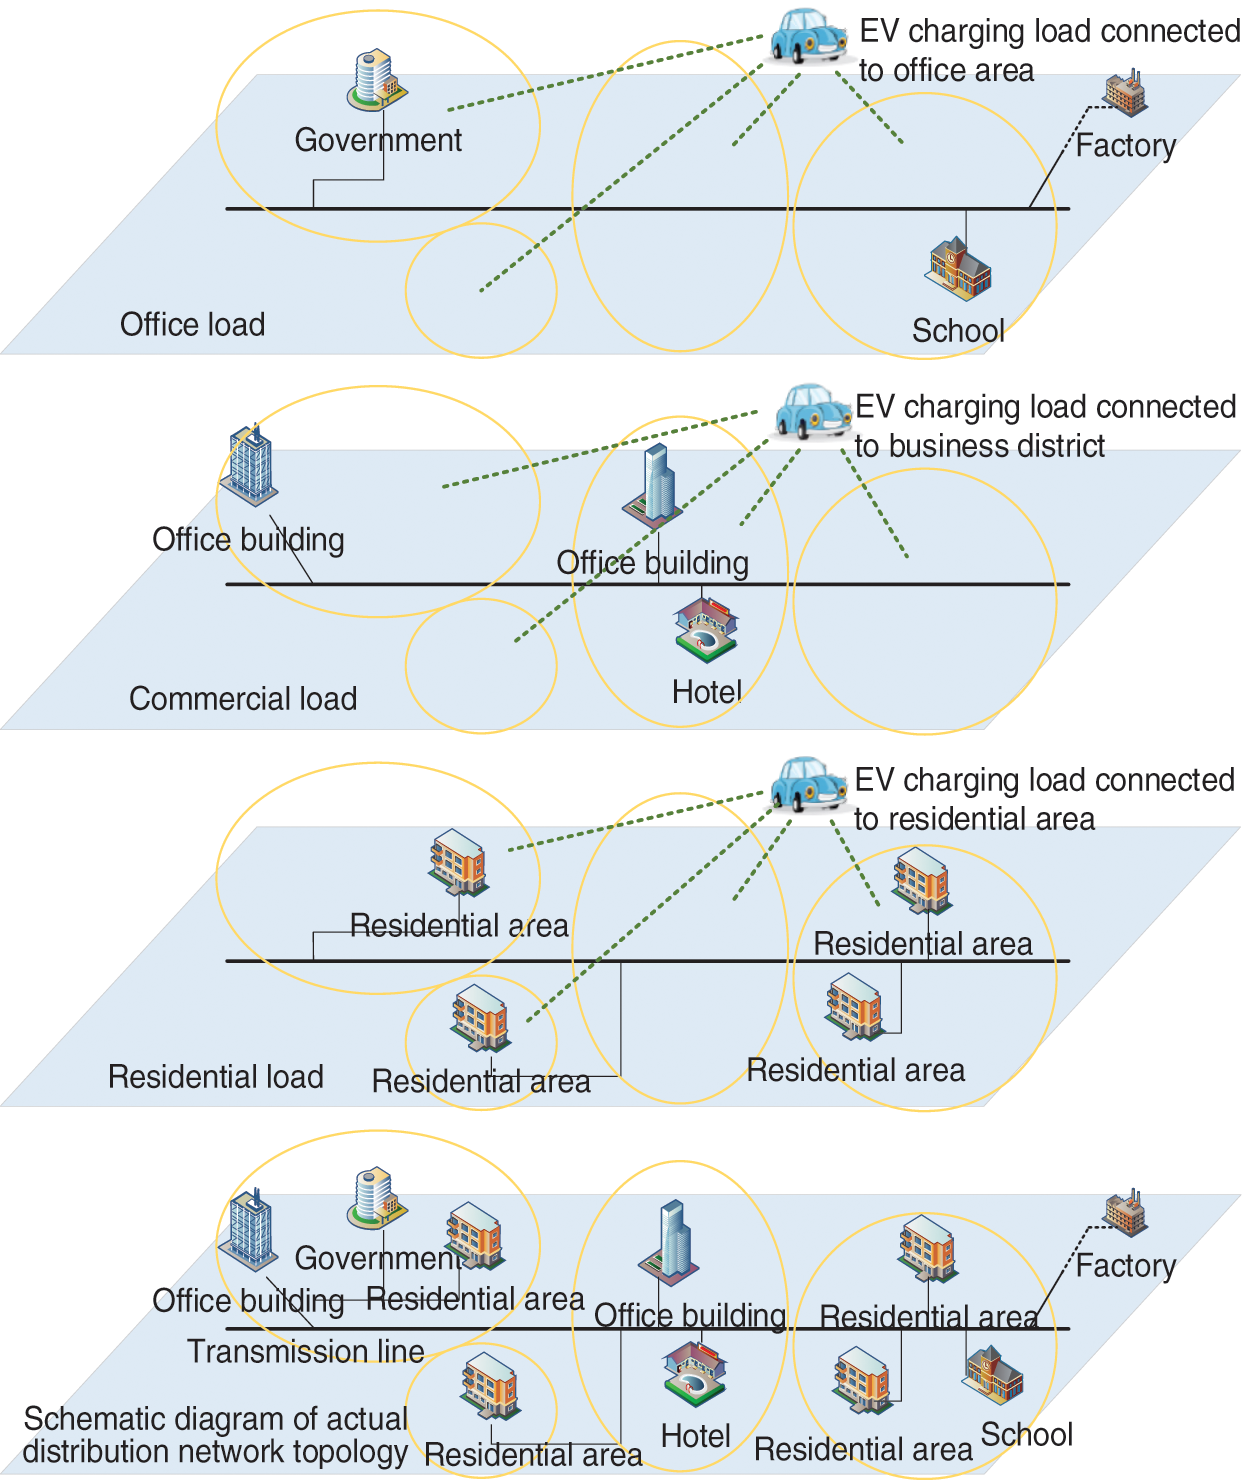
Figure 3: Charging load distribution
3.3 EV Charging Capacity Modeling of Distribution Network
To analyze and evaluate the capacity of an urban distribution network to accommodate EVs, the objective function for the maximum number of EVs accommodated in the distribution network is established as follows:
where Net is the topology of the distribution network; Lb is the node conventional load; and Lev is the EV charging load.
According to the objective function, the EV capacity of the distribution network is limited by the topology of the distribution network and its conventional load. It should be noted that the aim of this study is to calculate the maximum number of EVs that can be accommodated in the distribution network, regardless of the limitation of the charging piles, i.e., the number of charging piles in the distribution network is assumed to be sufficient.
1) Node voltage constraint
where Vi is the voltage value of node i, and Vmax and Vmin are the upper and lower limits of the node voltage, respectively.
2) Transformer capacity constraints
where Si is the load of transformer i and SN is the rated capacity of the transformer.
3) Branch current constraint
where Il_i is the current of branch i and IN is the maximum allowable current of the line.
The backward/forward sweep power flow calculation method [28] is a common method for calculating the voltage level of each node, transformer load level, branch current, and other operation indices in the distribution network, and it has great advantages in solving the power flow of radial distribution networks. When the EV charging loads of different scales are connected to the distribution network, the operation state of the distribution network is bound to change, such as drop in the node voltage level, heavy load operation of the transformer, and line overheating. While continuously adjusting the EV ownership, the operation state of the distribution network is observed; by judging whether the distribution network operates within the safe range, the maximum number of EVs that the distribution network can accommodate can be determined. The flowchart of the solution process is shown in Fig. 4.
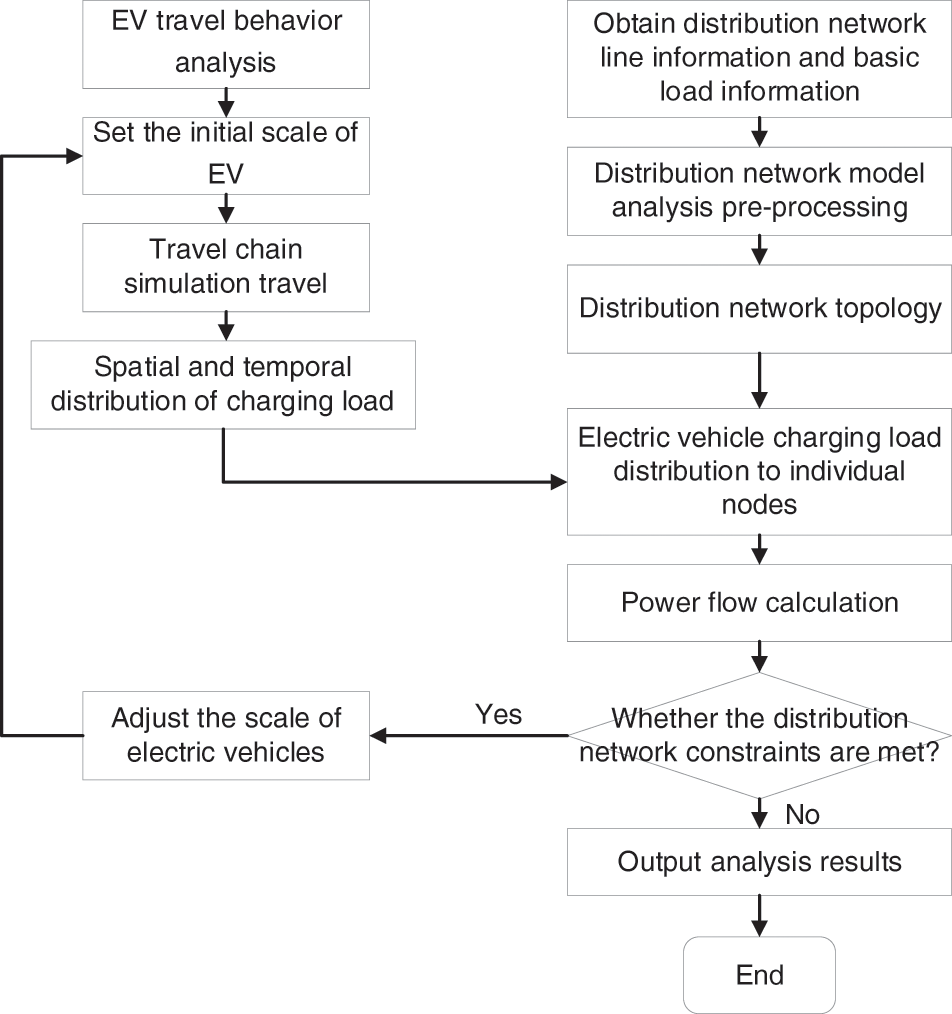
Figure 4: Flowchart for analyzing EV capacity of distribution network
4.1 Basic Information of Distribution Network
In this study, part of an actual distribution network is used for analysis. The area contains six 110/10 kV substations with a total of 34 outgoing lines. The specific structure is simplified as shown in Fig. 5.
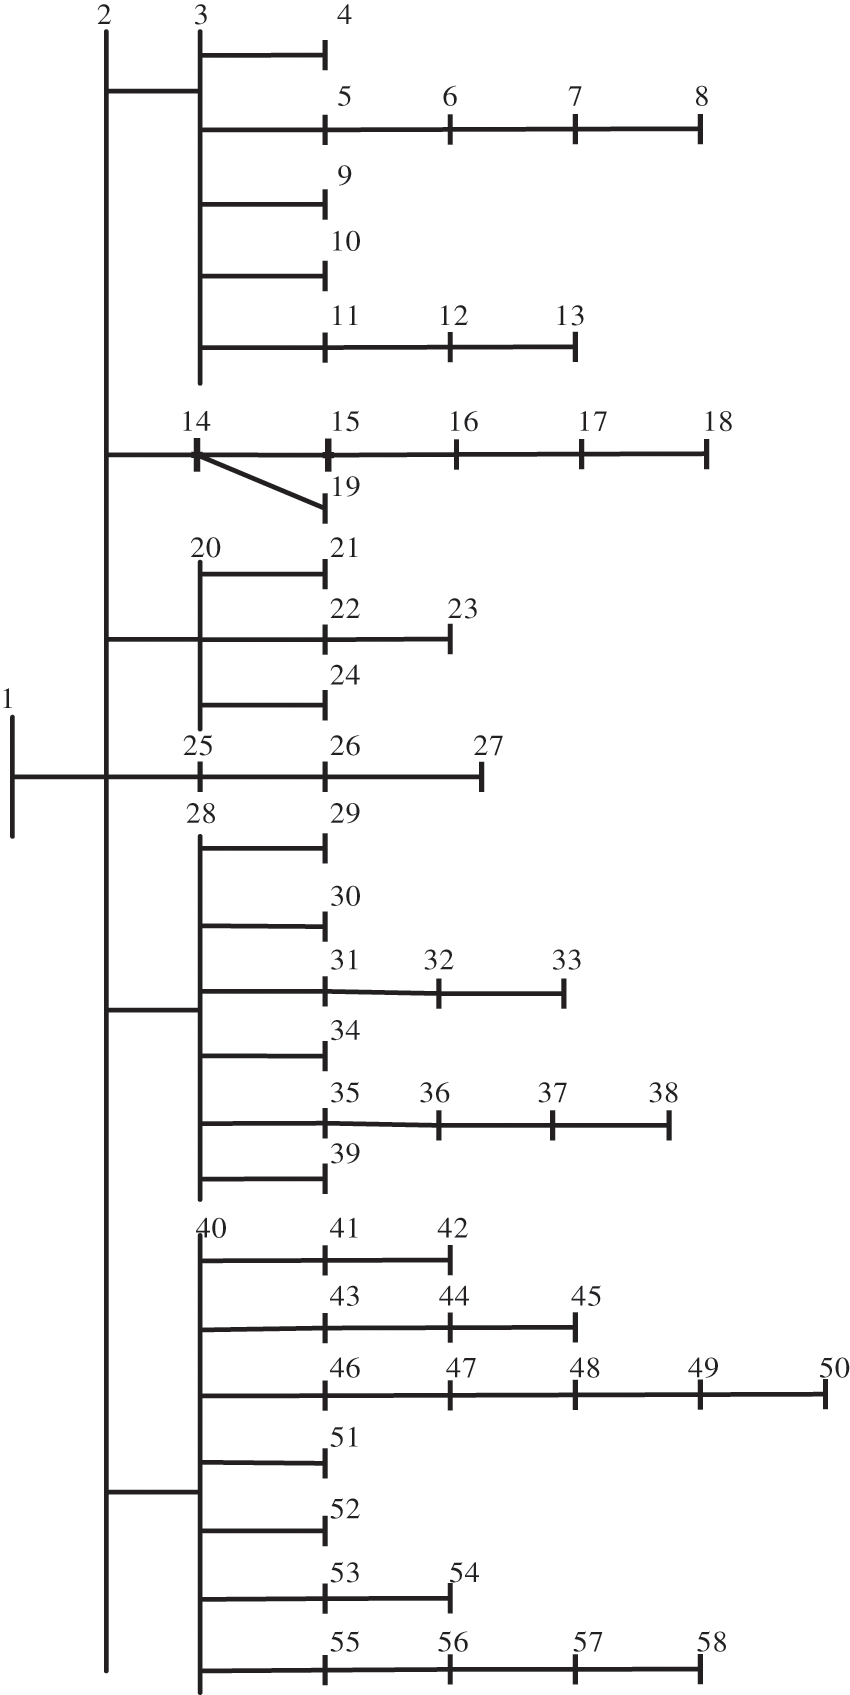
Figure 5: Structure of the specified distribution network
Here, node 1 is the superior system equivalent node, the impedance between node 1 and node 2 is the system short-circuit impedance, node 2 is the 110 kV busbar, and nodes 3, 14, 20, 25, 28, and 40 are the 10-kV substation busbar nodes.
The transformer model and rated capacity of each substation are listed in Table 1.
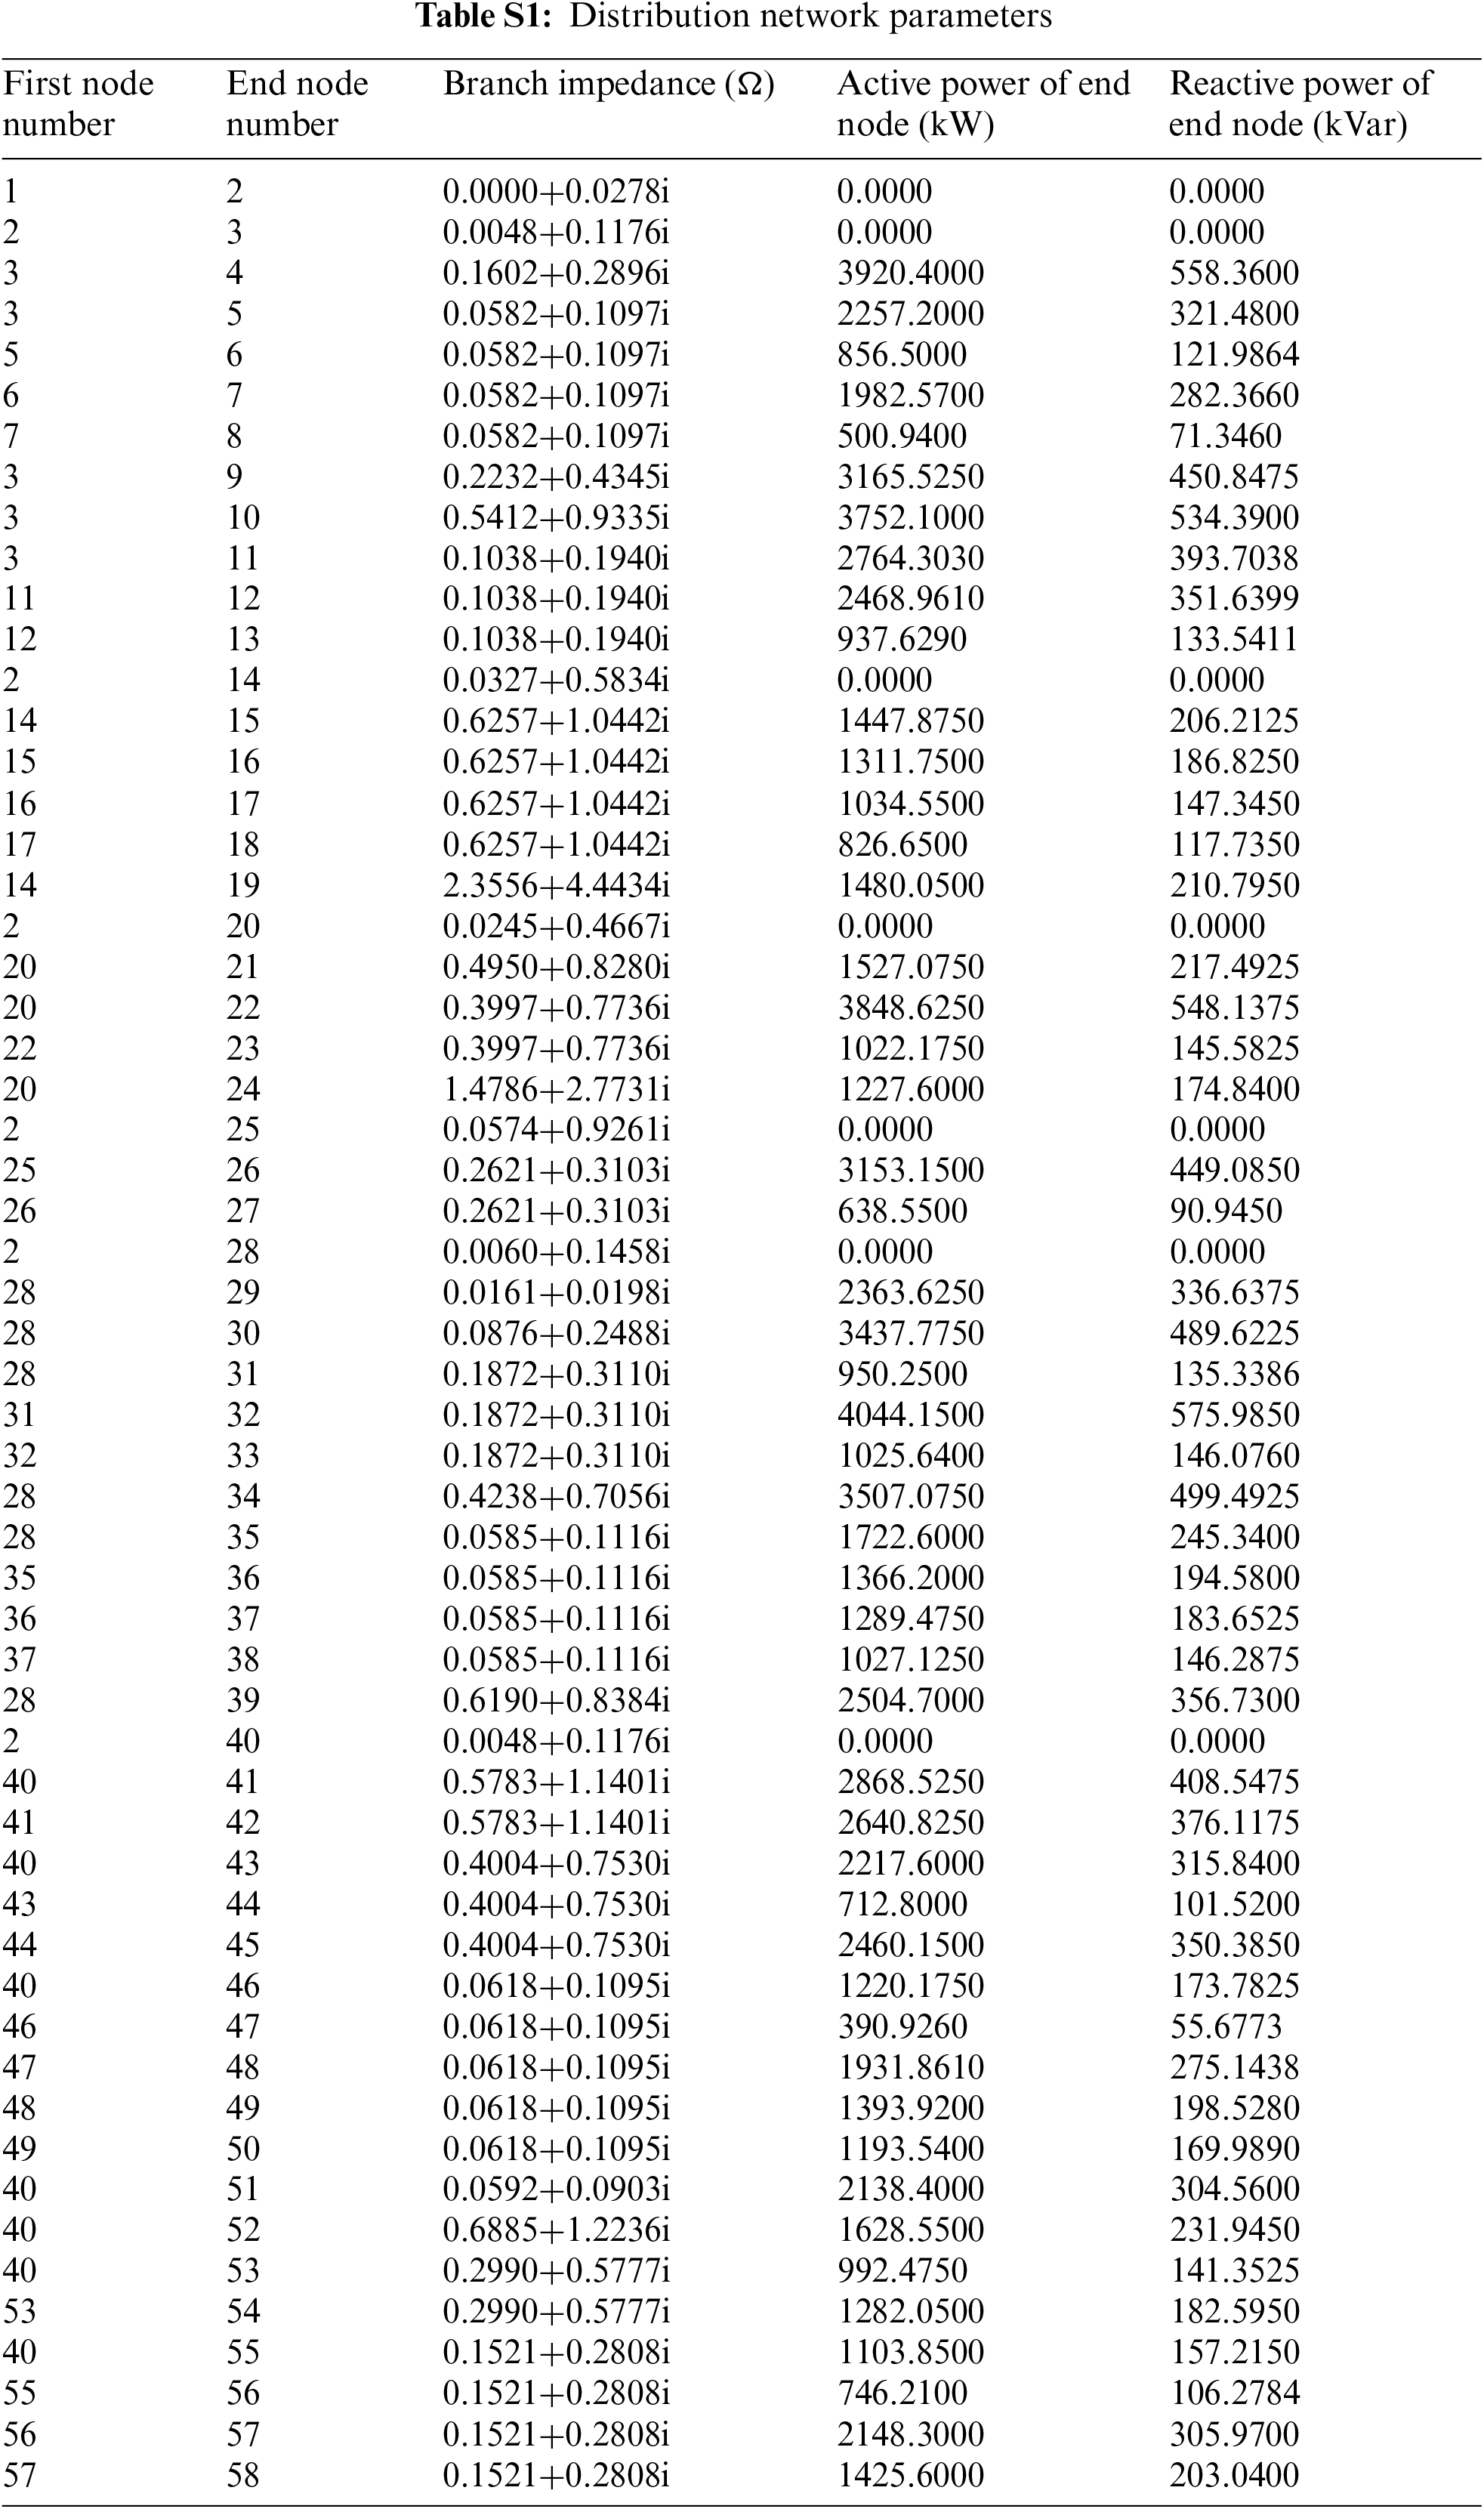
The distribution network node conventional load and line impedance parameters are summarized in Table S1.
Without considering the EV charging load connected to the distribution network, the power flow calculation is performed on the original distribution network. The node voltage distribution is obtained as shown in Fig. 6.
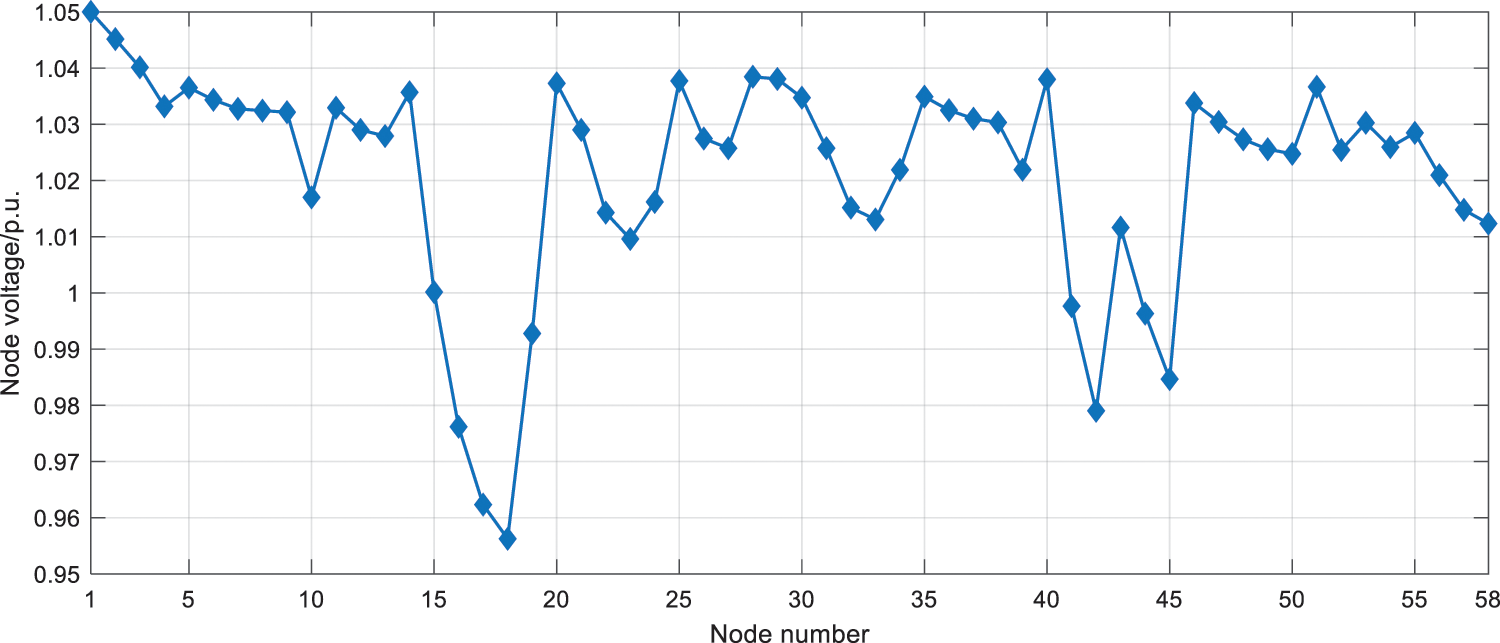
Figure 6: Distribution of node voltages
As can be seen from the calculation results in Fig. 6, the node voltage is as low as 0.956 (unit value). In addition, the maximum current of the line is 360.56 A, and the load rate of each transformer is within the allowable range. According to the regulations of 10-kV distribution network operation, the allowable offset range of the node voltage is between −7% and +7% of the rated voltage, and the maximum allowable current of the LJ-240 overhead line is 610 A (70°C), the maximum allowable current for a three-core cable with a conductor cross section of 300 mm2 is 433 A (60°C), according to the wire type. Therefore, from the results of the power flow calculation under the conventional load only, it can be seen that the distribution network has some remaining load capacity for EV charging load access.
4.2 EV Charging Demand Forecast
4.2.1 Fitting of Trip Characteristic Quantity
The National Household Trip Survey (NHTS) dataset [29] was used to analyze the characteristics of urban residents' driving trip activities.
1) Purpose of trip
The NHTS trip dataset contains 19 common trip purposes of the residents as well as the statistical analysis of the trip data of the vehicles within the city. The six trip purposes and trip frequencies of the residents with the highest frequency of driving on weekdays and weekends are summarized in Table 2.
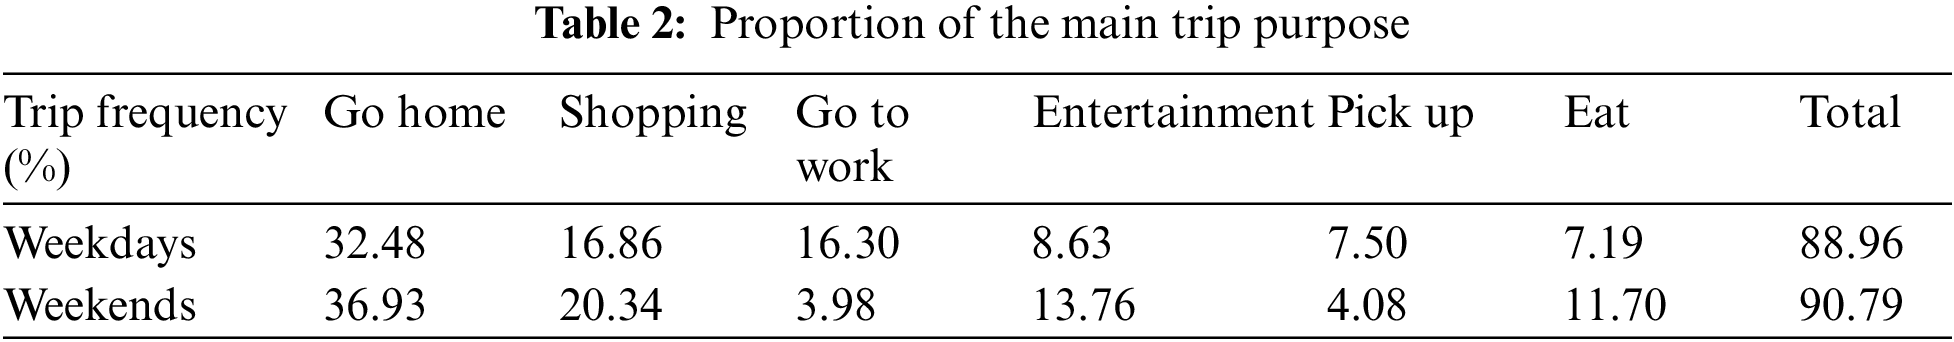
In the calculation of the EV charging demand, the six trip destinations were classified into three categories: residential, office, and commercial. The charging demand generated at shopping and entertainment trip destinations was considered as commercial. Furthermore, charging was considered not to be performed when the stay at dining and pick-up trip destinations was too short.
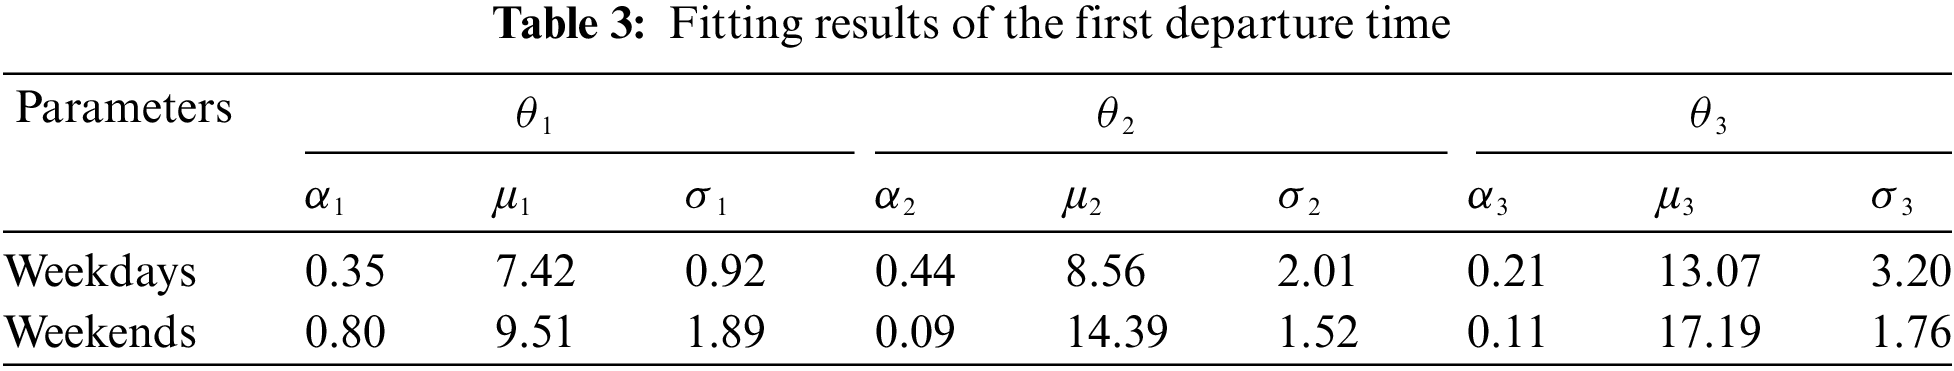
2) First trip time
The daily first trip times obeyed a three-peak mixed Gaussian distribution. The fitting results are shown in Table 3.
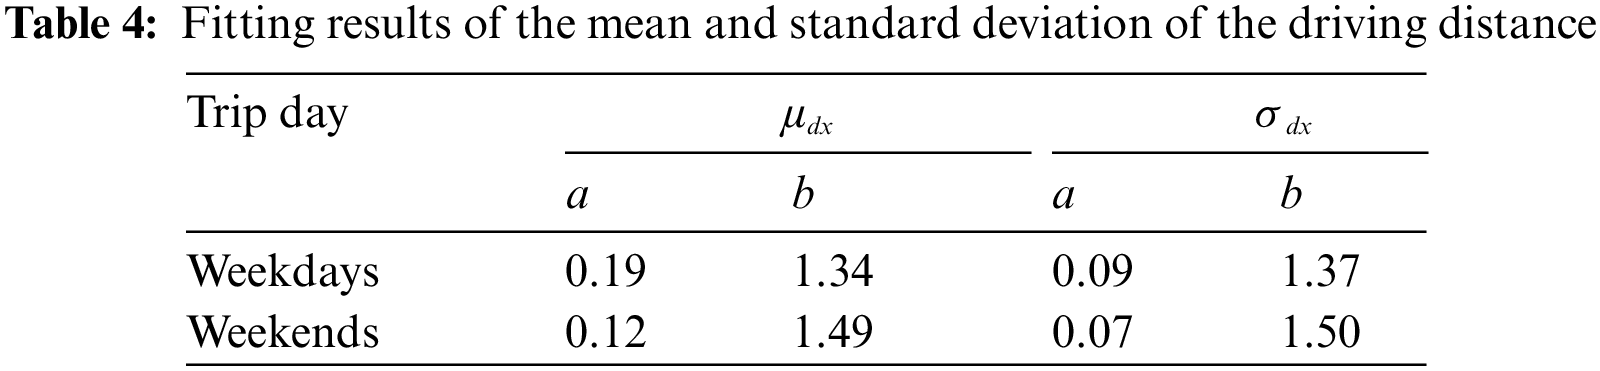
3) Driving time and distance
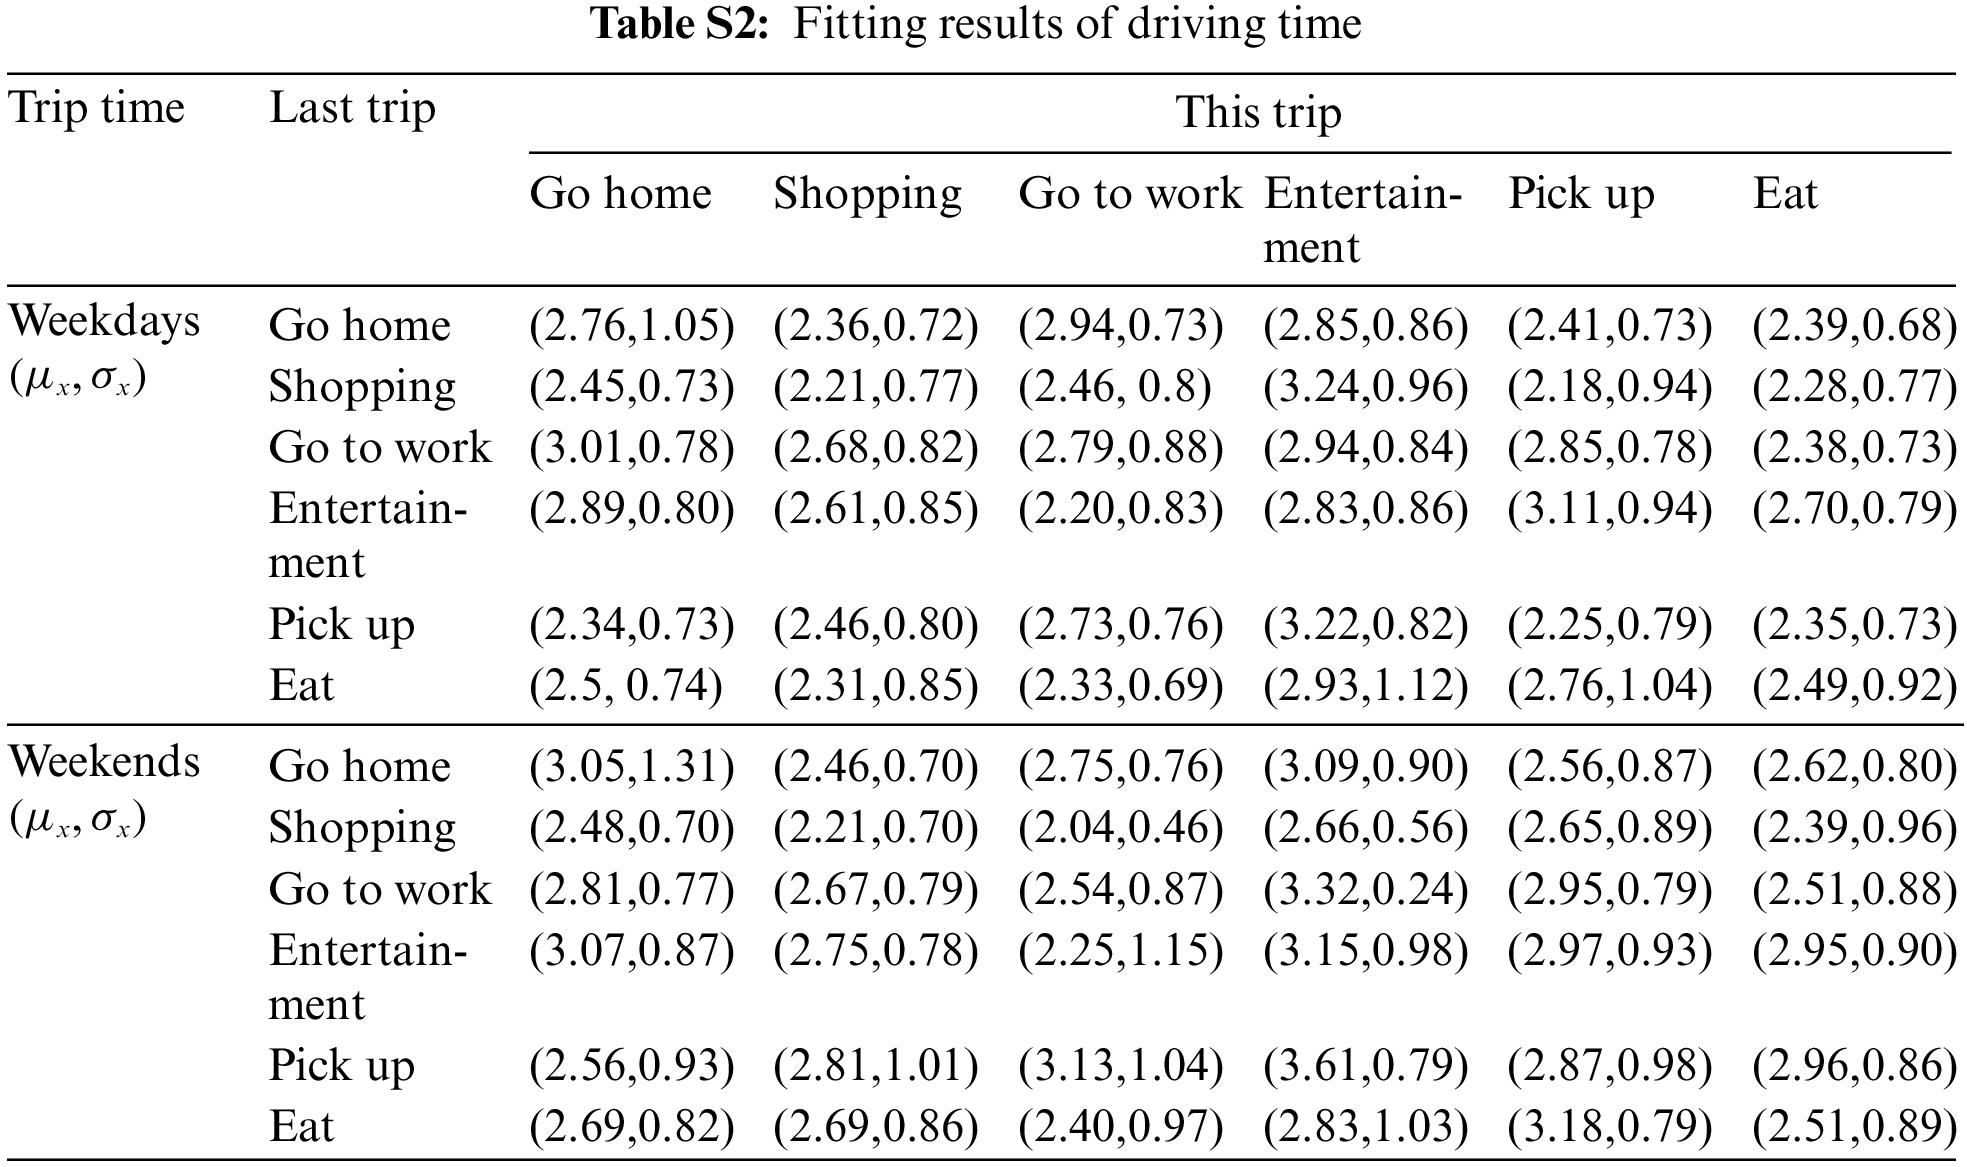
The trip duration of departure and destination follows a log-normal distribution
The mean and variance of the driving distance show a power function relationship with the driving duration. The fitting results are shown in Table 4.
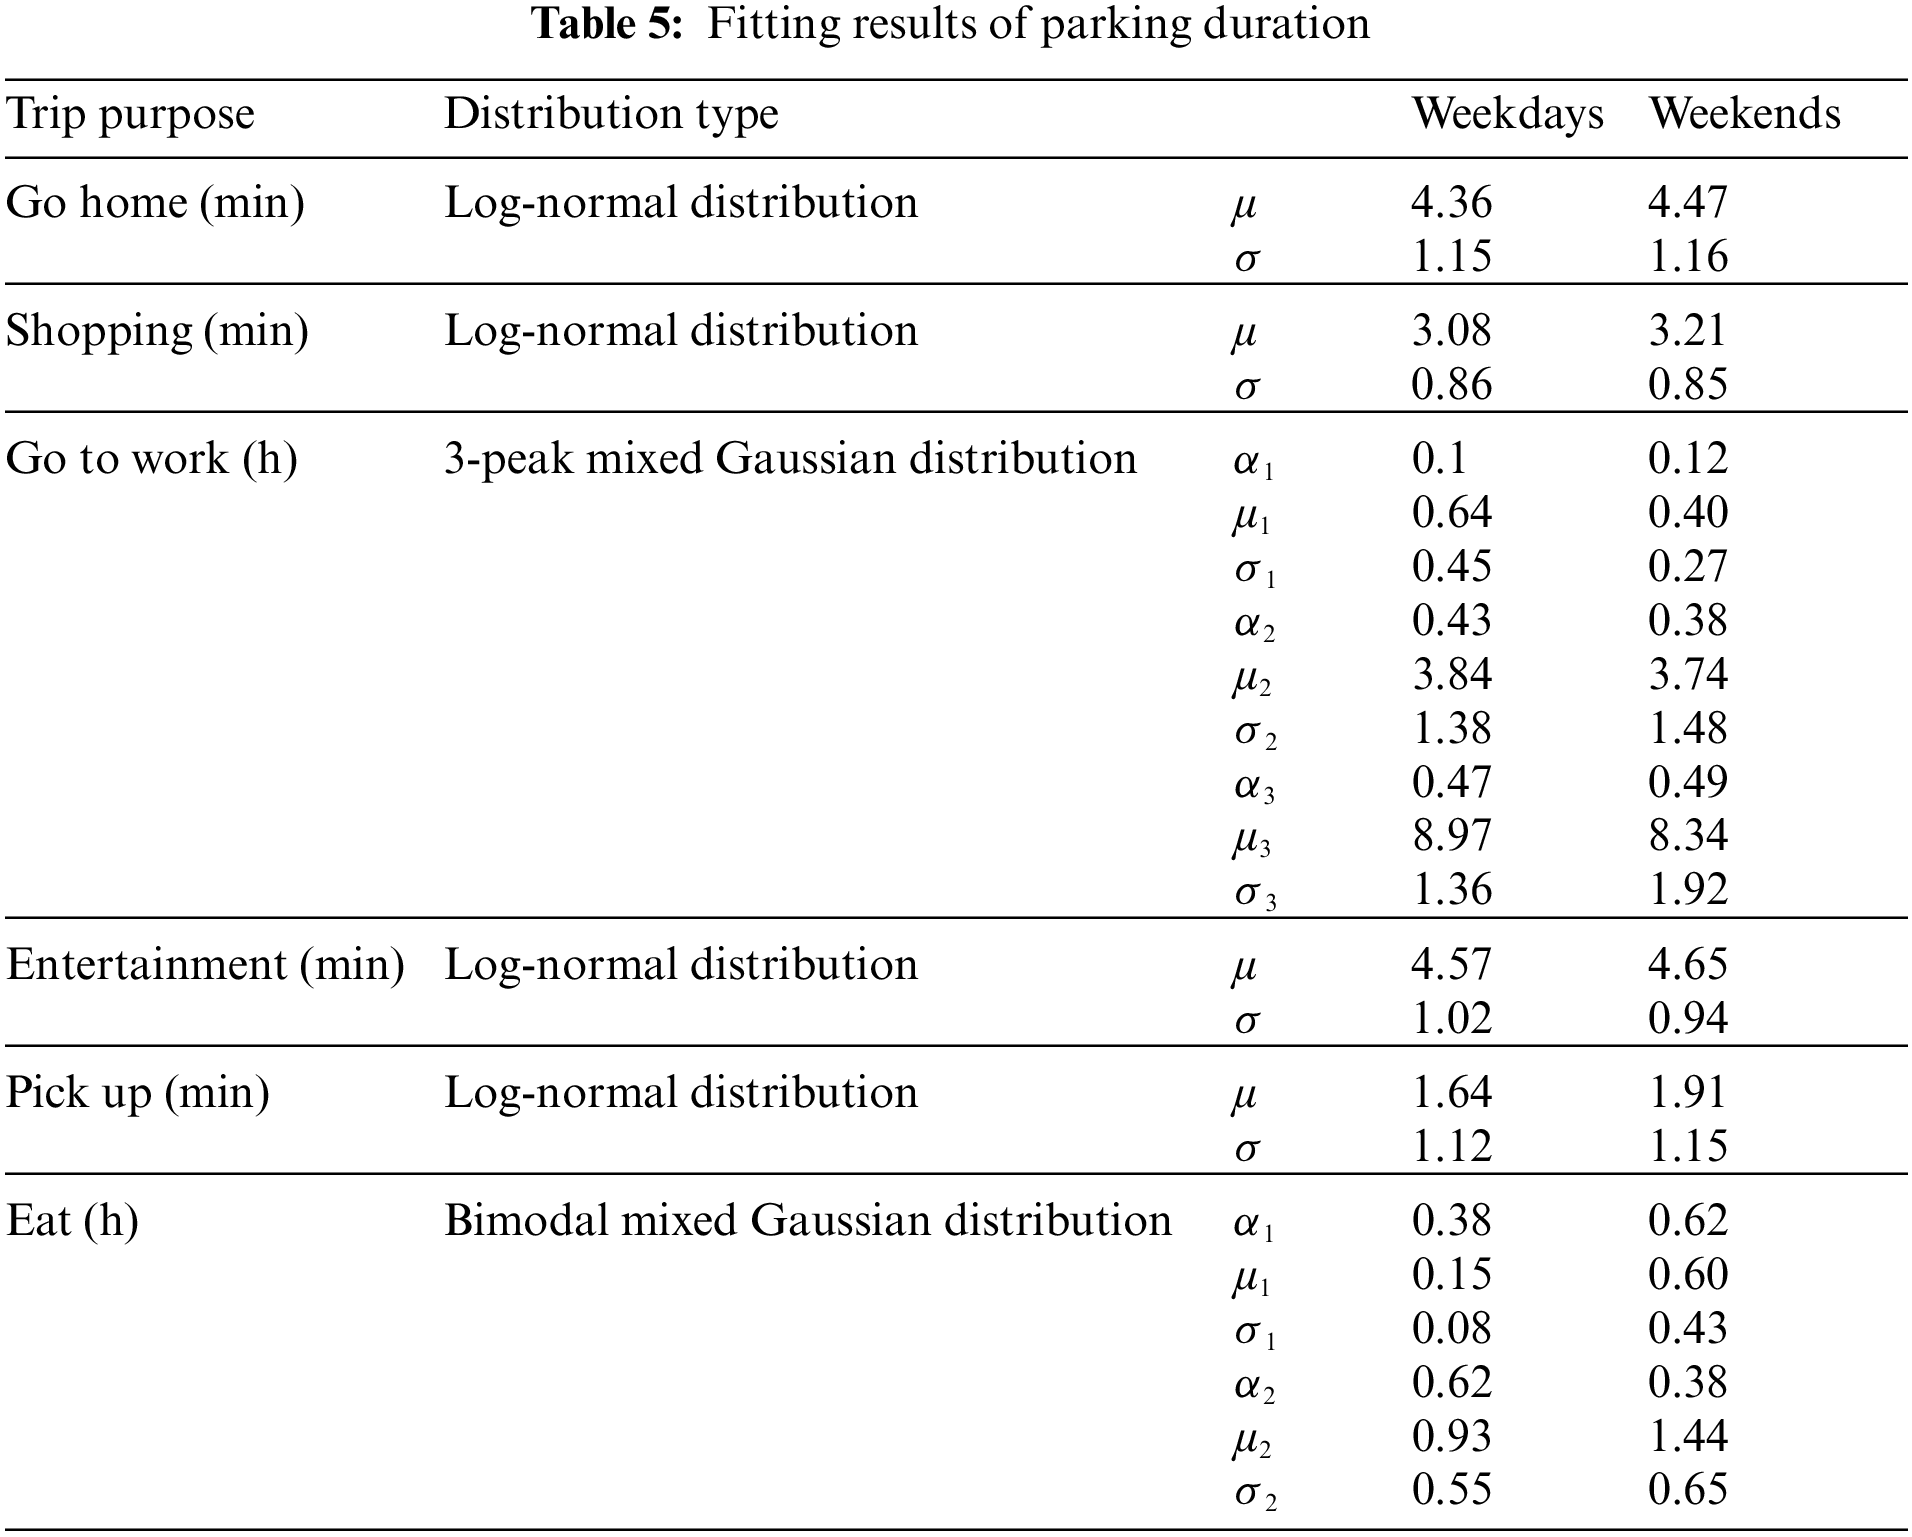
4) Duration of parking
The parking duration of vehicles at different destinations was analyzed, and only the shorter time was considered for vehicles whose destination was home; the case of returning home and not going out again was not considered. The vehicle parking times at different destinations show a large difference. The fitting results obtained using the log-normal and Gaussian mixture distribution are shown in Table 5.
5) Trip destination transfer probability
Dividing a day into 24 periods and considering the difference between going home for a short period of time and going home at the end of the trip, the size of the trip purpose shift matrix is 24 × 6 × 7. The trip shift probability between 17:00 and 18:00 on weekdays is shown in Fig. 7.
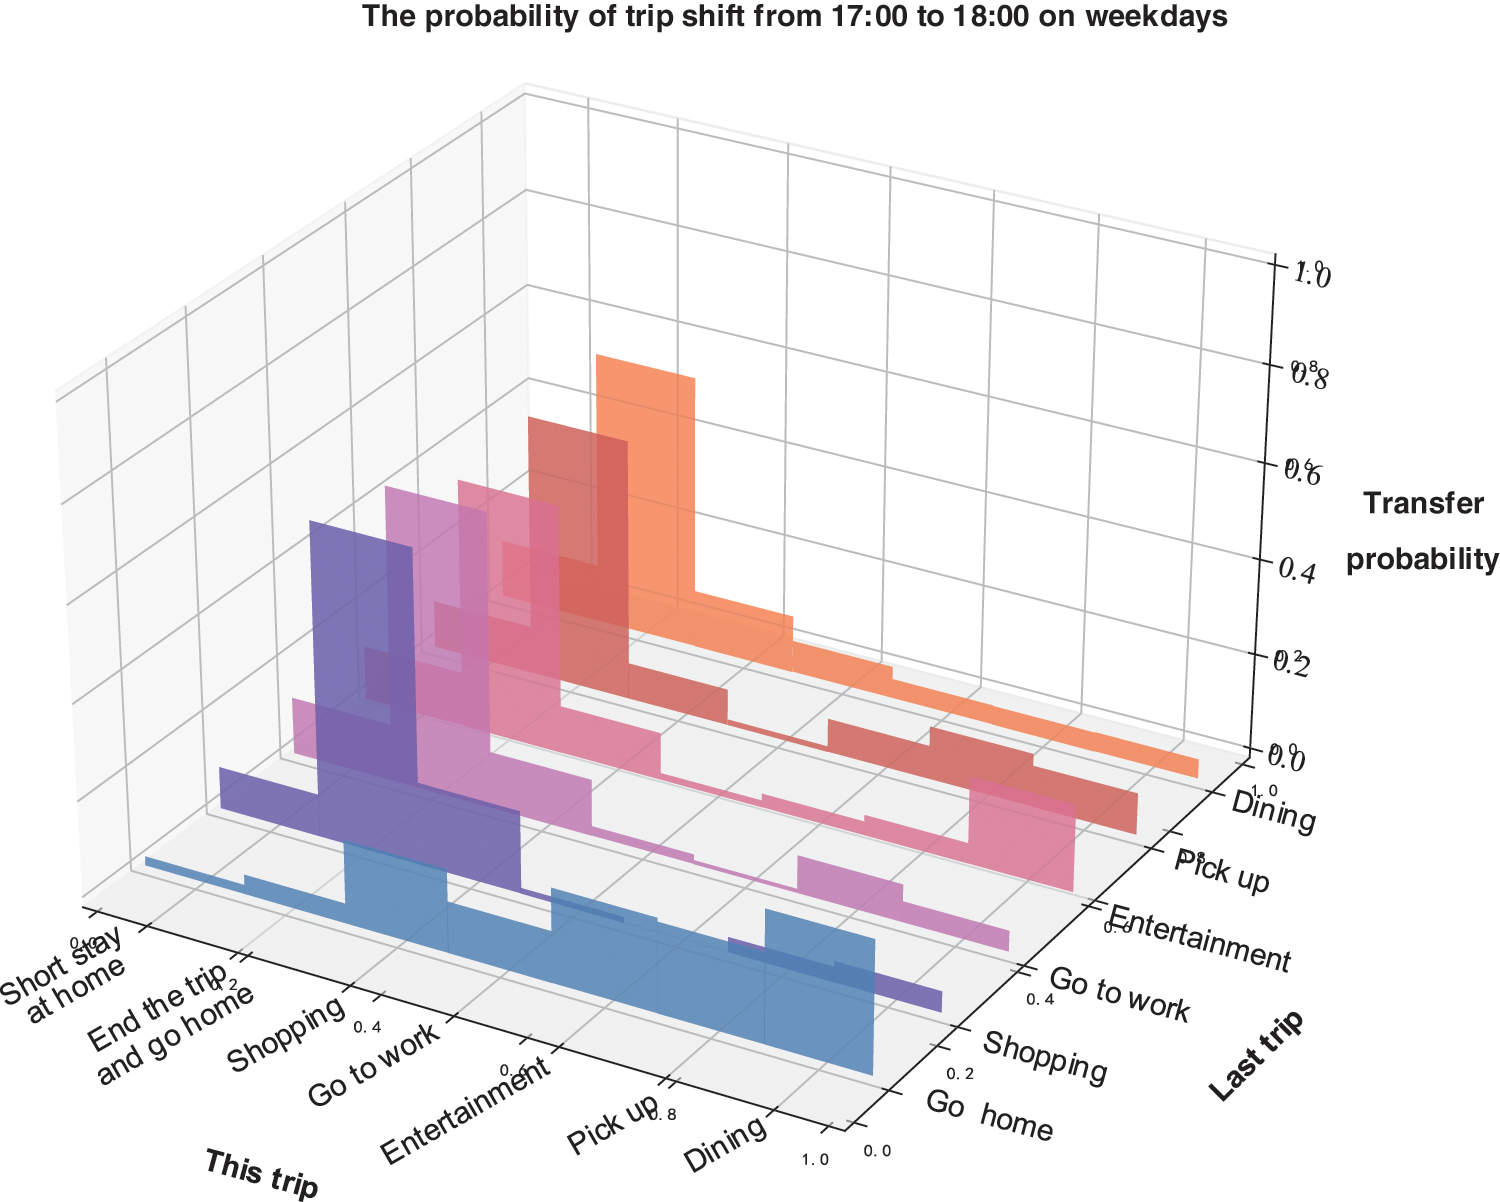
Figure 7: Transfer probability between trip purposes between 17:00 and 18:00 on weekdays
4.2.2 Charging Demand Forecast
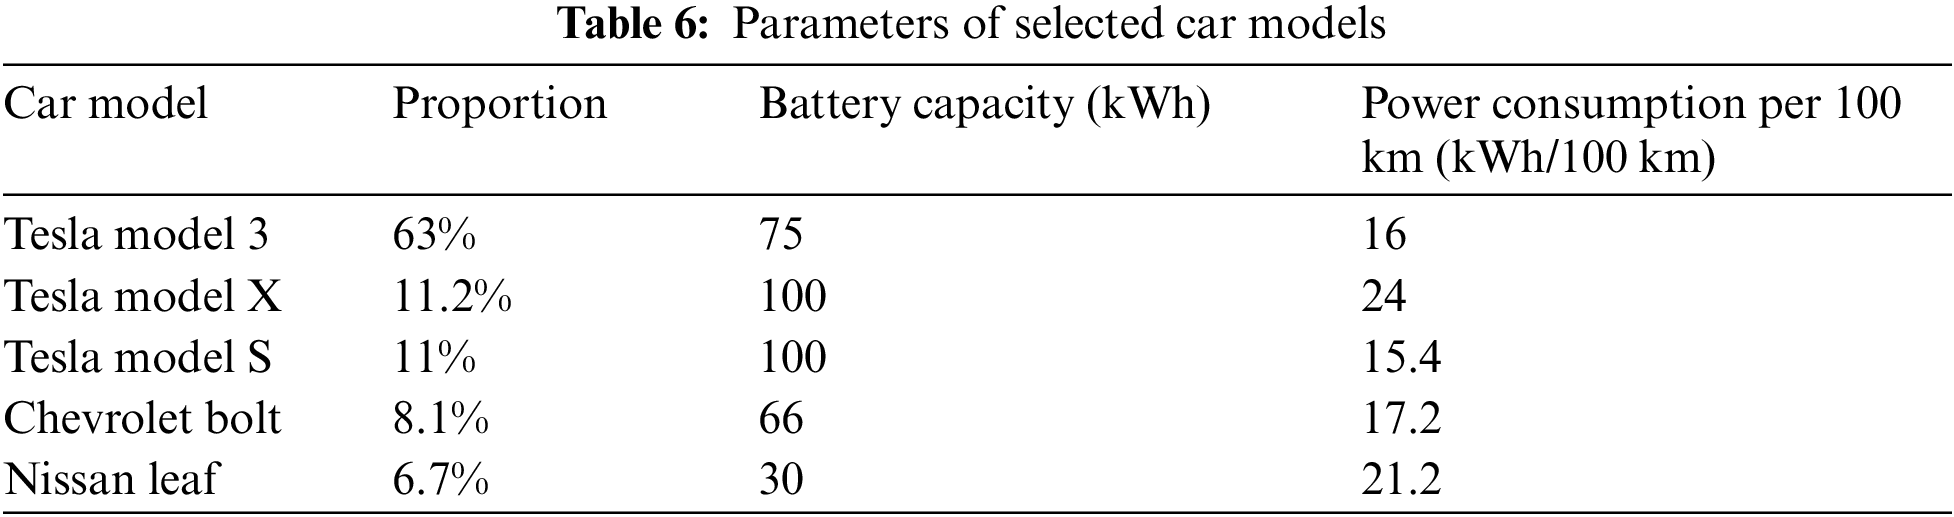
The top five EVs in terms of the market share in the United States were selected for simulation. The specific parameters are listed in Table 6.
Considering the battery life and the impact on the distribution network, slow charging (5 kW) is preferred for EVs; however, fast charging (50 kW) is chosen when the slow charging mode cannot complete the charging task to support the next trip within the parking time. To improve the simulation accuracy, the EV trip and charging behavior were simulated continuously for 3 weeks with a simulation accuracy of 1 min. To exclude the error caused by the SOC in the starting phase, the charging load demand on Monday and Sunday of the second week in each charging area was chosen for analysis, as shown in Fig. 8.
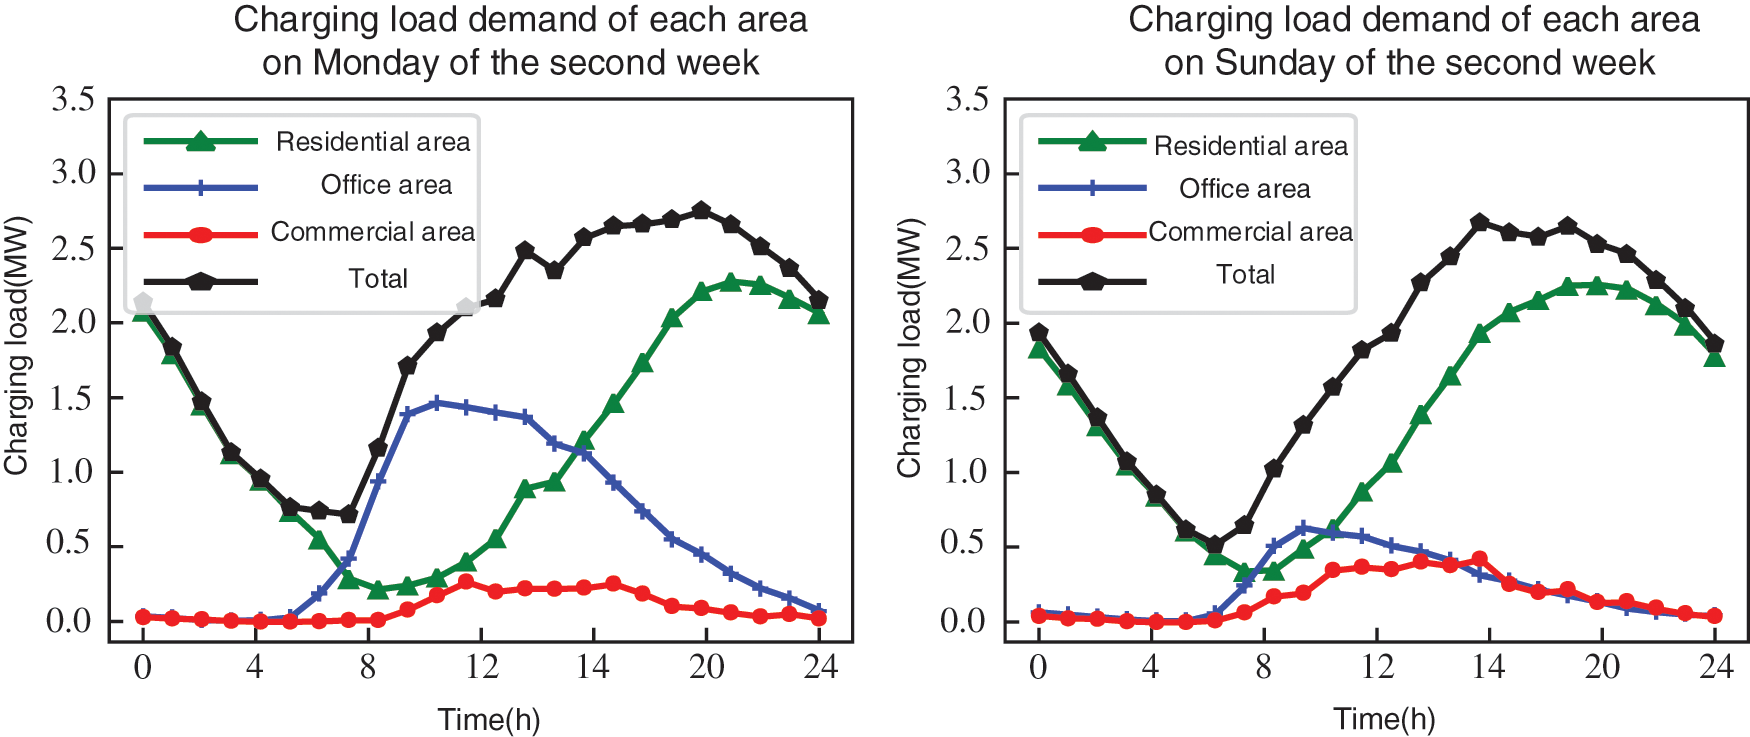
Figure 8: Charging demand on Monday and Sunday of the second week
From Fig. 8, a comparison of the EV charging load curves in office areas on weekdays and weekends shows that the charging load is higher in office areas on weekdays than on weekends, and this gap is particularly prominent between 08:00 and 20:00, because EV users habitually choose to charge their EVs at their workplaces on weekdays.
The analysis of charging loads connected to residential areas shows that the general trends of EV charging loads on weekdays and weekends are the same; however, between 12:00 and 20:00 on weekends, the EV charging loads are slightly higher than those at the same time on weekdays because more users are at home during the weekends and therefore have more opportunities to choose to charge their EVs at their place of residence.
In general, users stay in commercial areas for a short time, which is not sufficient to complete charging. Hence, the charging load of EVs entering commercial areas on weekdays and weekends is low; however, people are more accustomed to visiting commercial areas on weekends, making the charging load on weekends slightly higher than that on weekdays.
Combined with the aforementioned analysis of the charging loads in each region, the prediction results of this study for the spatial and temporal distribution of the EV charging loads are consistent with the actual situation and have high accuracy.
4.3 Analysis of EV Charging Capacity in Distribution Network
Taking Monday of the second week as an example, the EV capacity of the distribution network is analyzed according to the process shown in Fig. 4. When the number of EVs increases to 22973, the line of node 11 of the distribution network is the first to reach the maximum allowable current value of 432.8 A, at which time the other branch currents and transformer loads are within the constraint range. The voltage distribution of the distribution network nodes is obtained as shown in Fig. 9.
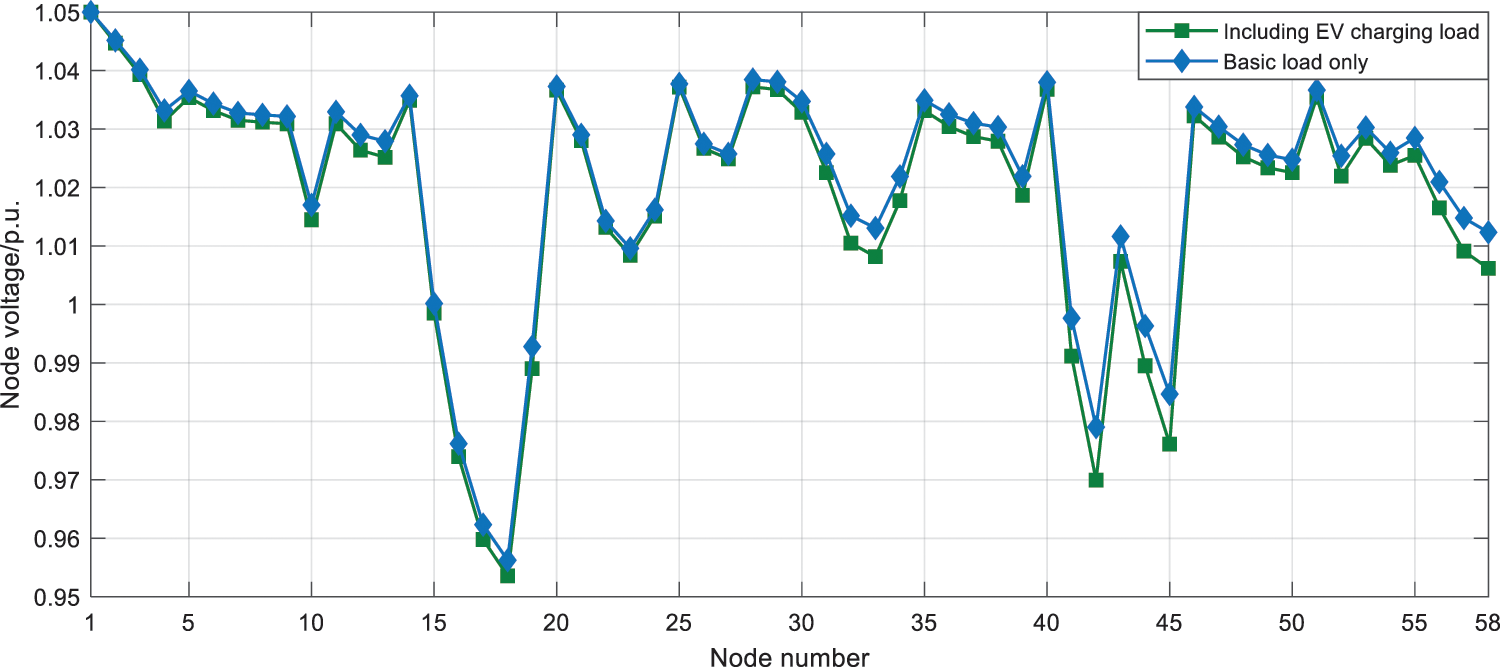
Figure 9: Load node voltage distribution including EV charging load
From Eq. (4), it can be seen that the topology of the distribution network and the size of the conventional load are the key factors that limit the capacity of the distribution network to accommodate EVs, for which the 11 nodes and the lines where they are located are analyzed with the parameters listed in Tables 7 and 8.
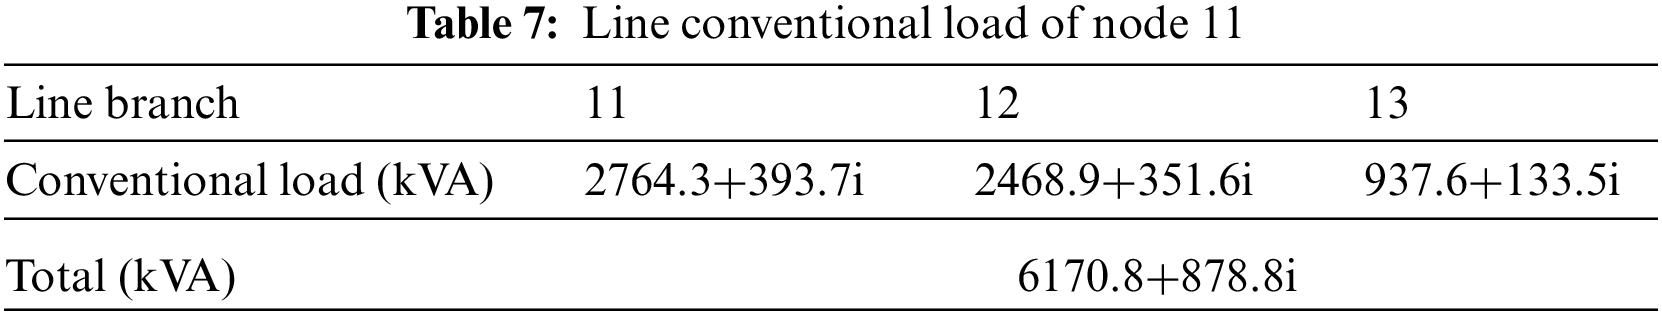
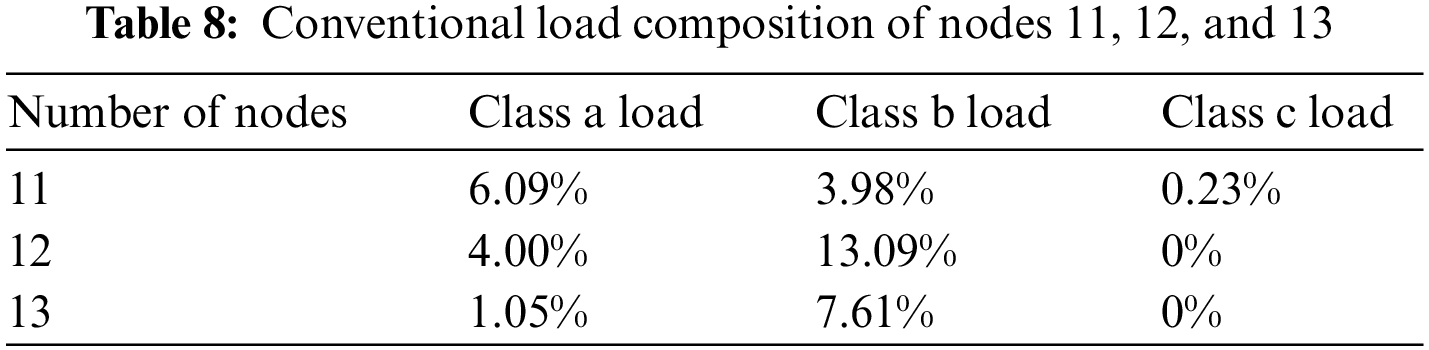
First, the analysis is done from the perspective of the conventional load on the line where node 11 is located. When EV charging load is not considered, the conventional load on the line is shown in Table 7, and the total line load reaches 6170.8+878.8i kVA, which shows that the conventional load on the line is higher than most lines. On the other hand, the analysis from the perspective of EV charging load access. As can be seen from Table 8, the percentage of class a load in nodes 11, 12 and 13 reached 6.09%, 4.00%, 1.05%, respectively, and the total percentage of class a load in these three nodes reached 11.14%, in addition, the total percentage of class b load on the line also reached 24.7%, which is a relatively large ratio compared to other lines. According to the charging load allocation principle, the node with a large percentage of conventional load classification is also assigned a large charging load, so the above-mentioned node will receive more charging load for charging load allocation, thus causing line overload.
The aforementioned analysis shows that under the existing distribution grid structure, the number of EVs that can be accommodated in the distribution grid in the region is around 22973, considering the spatial and temporal characteristics of the EV trip and charging behavior.
4.4 Evaluation of Charging Load Distribution Method
The proposed method allocates the charging load in proportion to the conventional load of the same category among the nodes, which offers the following advantages:
1. The manner of division of the distribution network into functional areas is improved. Previously, the functional area was large in scope and had a single conventional load category. However, in fact, the functional area may also contain other categories of the conventional load during the division. For example, the office area includes not only schools, party and government agencies, and factories and other loads but also residential and commercial loads of a certain scale. The division of the electric load unit classification and electronic supply area in this study overcomes this drawback.
2. The accuracy of the charging load allocation is improved. If the spatial characteristics of the charging load are not considered, i.e., if the charging load in each area is not distinguished, and the total charging load is directly distributed according to the total conventional load of each node, there will be a large deviation in the distribution result, as shown in Table 9 (considering the line of node 11 as an example).
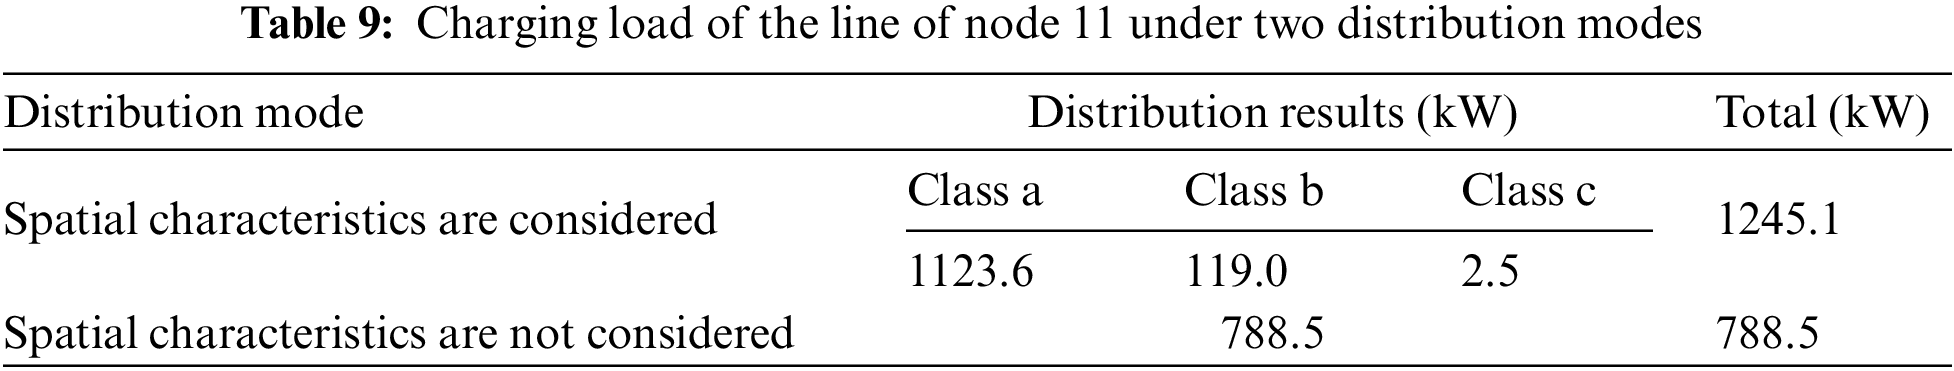
As can be seen from Table 9, considering the spatial characteristics of the charging load, the charging load obtained by the line of node 11 increased from 788.5 to 1245.1 kW, i.e., an increase of 57.9%. This is only for the analysis of the line of node 11; the case of the other nodes depends on the specific composition of the conventional load. In conclusion, the proposed charging load allocation method fully considers the spatial and temporal characteristics of the EV charging load as well as the composition characteristics of the distribution network conventional load, and improves the accuracy of the distribution network EV capacity analysis results.
Considering that the increasing EV charging load due to large-scale access to EVs will affect the safe and stable operation of the distribution network, this paper proposed a method for analyzing the EV charging capacity of the distribution network. First, the topology the of distribution network was simplified by analyzing and preprocessing the distribution network model. Second, by combining the trip chain theory and Monte Carlo simulation method, the driving trip and charging behavior of urban residents was analyzed, and the temporal and spatial distribution of the EV charging demand was predicted. Considering the diversity of the conventional load composition categories of the actual distribution network nodes, a distribution method based on the proportion of the conventional load of the same category among nodes was proposed to integrate the charging load with the conventional load of the distribution network. Finally, the EV charging capacity of the distribution network was solved via power flow calculation. In this study, specifically, a feasible EV charging load distribution method was proposed on the basis of the characteristics of the space-time distribution of the EV charging load and the composition characteristics of the node conventional load. Compared with the traditional method of dividing the distribution network into functional areas, this study made a more refined classification of the power load units in the power supply area. The proposed EV charging load distribution method was shown to effectively reduce the error caused by a single load category in the traditional method, ensure reasonable distribution of the charging power to each node, and improve the reliability of the results. The findings presented herein can provide not only a reference to power grid operators for relevant decisions but also significant guidance to the government for planning the development of EVs.
Acknowledgement: We are grateful to our professors for their patient guidance as well as our laboratory associates for their assistance. We also thank Zhangjiakou Power Supply Company for their support. We would like to acknowledge TopEdit (www.topeditsci.com) for its linguistic assistance during the preparation of this manuscript.
Funding Statement: This research is supported by the Science and Technology Project of Zhangjiakou Power Supply Company of State Grid Jibei Co., Ltd. (SGJBZJ00YJJS2001096).
Conflicts of Interest: The authors declare that they have no conflicts of interest to report regarding the present study.
References
1. Chao, P. P., Gao, J. Y., Yang, Y., Hu, Q. G., Zhong, Z. H. (2016). Research on the national development strategy of new energy vehicles. Strategic Study of CAE, 18(4), 69–75. [Google Scholar]
2. Li, B., Zhao, Y. L., Wei, Y. H., Qi, B., Chen, S. S. (2021). Research on key supporting technologies for demand-side resource interaction in the context of carbon neutrality. Distribution & Utilization, 38(9), 3–9+18. [Google Scholar]
3. Zhao, J., Wang, J. H., Xu, Z., Wang, C., Wan, C. et al. (2017). Distribution network electric vehicle hosting capacity maximization: A chargeable region optimization model. IEEE Transactions on Power Systems, 32(5), 4119–4130. DOI 10.1109/TPWRS.2017.2652485. [Google Scholar] [CrossRef]
4. Sun, Y. Y., Yue, H., Zhang, J. F., Booth, C. (2019). Minimization of residential energy cost considering energy storage system and EV with driving usage probabilities. IEEE Transactions on Sustainable Energy, 10(4), 1752–1763. DOI 10.1109/TSTE.2018.2870561. [Google Scholar] [CrossRef]
5. Calearo, L., Thingvad, A., Suzuki, K., Marinelli, M. (2019). Grid loading due to EV charging profiles based on pseudo-real driving pattern and user behavior. IEEE Transactions on Transportation Electrification, 5(3), 683–694. DOI 10.1109/TTE.2019.2921854. [Google Scholar] [CrossRef]
6. Yu, Z., Yue, S., Hill, D. J., Meng, K. (2019). Online distributed MPC-based optimal scheduling for EV charging stations in distribution systems. IEEE Transactions on Industrial Informatics, 15(2), 638–649. DOI 10.1109/TII.2018.2812755. [Google Scholar] [CrossRef]
7. Yuan, H. T., Wei, G., Zhu, L., Zhang, X., Luo, Z. G. et al. (2020). Optimal scheduling for micro-grid considering EV charging-swapping–storage integrated station. IET Generation, Transmission & Distribution, 14(6), 1127–1137. DOI 10.1049/iet-gtd.2018.6912. [Google Scholar] [CrossRef]
8. Omar, H., Kankar, B. (2018). Integrating EV charging stations as smart loads for demand response provisions in distribution systems. IEEE Transactions on Smart Grid, 9(2), 1096–1106. DOI 10.1109/TSG.2016.2576902. [Google Scholar] [CrossRef]
9. Tang, D. F., Wang, P. (2016). Probabilistic modeling of nodal charging demand based on spatial-temporal dynamics of moving electric vehicles. IEEE Transactions on Smart Grid, 7(2), 627–636. [Google Scholar]
10. Zhang, Q., Zhu, Y., Wang, Z., Su, Y. J., Li, C. Y. (2019). Reliability assessment of distribution network and electric vehicle considering quasi-dynamic traffic flow and vehicle-to-grid. IEEE Access, 7, 131201–131213. DOI 10.1109/ACCESS.2019.2940294. [Google Scholar] [CrossRef]
11. Tao, S., Liao, K. Y., Xiao, X. N., Wen, J. F., Yang, Y. et al. (2016). Charging demand for electric vehicle basicd on stochastic analysis of trip chain. IET Generation, Transmission & Distribution, 10(11), 2689–2698. DOI 10.1049/iet-gtd.2015.0995. [Google Scholar] [CrossRef]
12. Liang, H. F., Lee, Z. Y., Li, G. (2020). A calculation model of charge and discharge capacity of electric vehicle cluster basicd on trip chain. IEEE Access, 8, 142026–142042. DOI 10.1109/ACCESS.2020.3014160. [Google Scholar] [CrossRef]
13. Yan, J., Zhang, J., Liu, Y., Lv, G. L., Han, S. et al. (2020). EV charging load simulation and forecasting considering traffic jam and weather to support the integration of renewables and EVs. Renewable Energy, 159(2), 623–641. DOI 10.1016/j.renene.2020.03.175. [Google Scholar] [CrossRef]
14. Su, S., Lin, X. N., Zhang, H. Z., Zhao, H., Li, H. et al. (2017). Dynamic evolution model of space-time distribution of electric vehicle charging demand. Proceedings of the CSEE, 37(16), 4618–4629+4887. [Google Scholar]
15. Li, X. H., Li, L., Liu, W. D., Zhao, X., Xie, Q. (2020). Prediction of temporal and spatial distribution of electric vehicle charging load basicd on dynamic traffic information. Power System Protection and Control, 48(1), 117–125. [Google Scholar]
16. Gong, Q. M., Midlam Mohler, S., Marano, V., Rizzoni, G. (2012). Study of PEV charging on residential distribution transformer life. IEEE Transactions on Smart Grid, 3(1), 404–412. DOI 10.1109/TSG.2011.2163650. [Google Scholar] [CrossRef]
17. Hilshey, A. D., Hines, P. D. H., Rezaei, P., Dowds, J. R. (2013). Estimating the impact of electric vehicle smart charging on distribution transformer aging. IEEE Transactions on Smart Grid, 4(2), 905–913. DOI 10.1109/TSG.2012.2217385. [Google Scholar] [CrossRef]
18. Shafiee, S., Fotuhi Firuzabad, M., Rastegar, M. (2013). Investigating the impacts of plug-in hybrid electric vehicles on power distribution systems. IEEE Transactions on Smart Grid, 4(3), 1351–1360. DOI 10.1109/TSG.2013.2251483. [Google Scholar] [CrossRef]
19. Zhang, M. X., Sun, Q. J., Yang, X. (2021). Research on the assessment of the capacity of urban distribution networks to accept electric vehicles based on the improved TOPSIS method. IET Generation, Transmission & Distribution, 15(19), 2804–2818. DOI 10.1049/gtd2.12216. [Google Scholar] [CrossRef]
20. Luis, P. F., Tomas, G. S. R., Rafael, C., Carlos, M. D., Pablo, F. (2011). Assessment of the impact of plug-in electric vehicles on distribution networks. IEEE Transactions on Power Systems: A Publication of the Power Engineering Society, 26(1), 206–213. DOI 10.1109/TPWRS.2010.2049133. [Google Scholar] [CrossRef]
21. Huang, B. B., Kong, W. Z., Li, Q. H. (2013). Research on the capacity of electric vehicles in China’s typical urban power grid. Electric Power, 46(10), 91–95. [Google Scholar]
22. Zhang, X. W., Jiang, X. X., Wang, L., Zhang, C., Tian, J. et al. (2015). Research on the evaluation method of electric vehicle acceptance in distribution network. Power System Protection and Control, 43(12), 14–20. [Google Scholar]
23. Yang, J. X., Zhang, Y. J. (2020). Optimization of charging load acceptance based on orderly charging start mechanism and subsidy mechanism. Electric Power Automation Equipment, 40(11), 122–130. [Google Scholar]
24. Wang, X. F., Shao, C. C., Wang, X. L., Du, C. (2013). Survey of electric vehicle charging load and dispatch control strategies. Proceedings of the CSEE, 33(1), 1–10. [Google Scholar]
25. Dempster, A. P., Laird, N. M., Rubin, D. B. (1977). Maximum likelihood from incomplete data via the EM algorithm. Journal of the Royal Statistical Society: Series B (Methodological), 39(1), 1–38. DOI 10.1111/j.2517-6161.1977.tb01600.x. [Google Scholar] [CrossRef]
26. Li, H. (2012). Statistical learning methods, pp. 183−187. Beijing, China: Tsinghua University Press. [Google Scholar]
27. Liang, H. F., Lee, Z. Y., Li, G. (2020). A calculation model of charge and discharge capacity of electric vehicle cluster based on trip chain. IEEE Access, 8, 142026–142042. DOI 10.1109/ACCESS.2020.3014160. [Google Scholar] [CrossRef]
28. Shao, H., Shi, Y. J., Yuan, J. P. (2018). Analysis on voltage profile of distribution network with distributed generation. IOP Conference Series: Earth and Environmental Science, vol. 113, no. 1, 012170. DOI 10.1088/1755-1315/113/1/012170. [Google Scholar] [CrossRef]
29. Federal Highway Administration (2017). National household travel survey. https://nhts.ornl.gov/. [Google Scholar]
Appendix
Cite This Article
 Copyright © 2023 The Author(s). Published by Tech Science Press.
This work is licensed under a Creative Commons Attribution 4.0 International License , which permits unrestricted use, distribution, and reproduction in any medium, provided the original work is properly cited.
 Downloads
 Citation Tools