
 Submit a Paper
 Propose a Special lssue
 Open Access
ARTICLE

Traceability Technology of DC Electric Energy Metering for On-Site Inspection of Chargers
1 Hunan Institute of Metrology and Inspection, Changsha, 410018, China
2 State Grid Hunan Electric Power Corporation Limited, Changsha, 410001, China
3 Hunan Province Key Laboratory of Intelligent Electrical Measurement and Application Technology, Changsha, 410001, China
* Corresponding Author: Hua Li. Email:
(This article belongs to the Special Issue: Advances in Modern Electric Power and Energy Systems)
Energy Engineering 2023, 120(3), 715-727. https://doi.org/10.32604/ee.2022.022990
Received 03 April 2022; Accepted 18 July 2022; Issue published 03 January 2023
 View Full Text
 Download PDF
Abstract
The on-site inspection of high-power DC chargers results in new DC high-current measurement and DC energy traceability system requirements. This paper studies the traceability technology of electric energy value for automotive high-power DC chargers, including: (1) the traceability method of the built-in DC energy meter and shunt of the charger; (2) precision DC high current and small precision DC voltage output and measurement technology. This paper designs a 0.1 mA~600 A DC high current measurement system and proposes a 0.005 level DC power measurement traceability system. The uncertainty evaluation experiment of the DC power measurement calibration system and the high-power DC charger’s on-site calibration experiment results verify the method’s effectiveness and feasibility in this paper. The experimental results show that the combined standard uncertainty of the DC power metering verification system can be 0.0451%.Keywords
The AC power transmission, transformation, and electricity consumption have dominated the power structure in the world. Therefore, in electric energy measurement, AC power is the mainstay. However, with the rapid development of distributed power sources and electric vehicles, the DC power supply equipment has been widely used in recent years. In such cases, the accuracy of DC power measurement must be guaranteed to ensure the fairness and impartiality of trade settlement in DC power measurement [1–3]. Hence, studying and establishing a DC energy value traceability system is significant.
The DC power supply device is a considerable part of the electric vehicle charging facilities, called a DC charger (referred to as a charger). The core of DC charger energy measurement is its built-in DC energy meter [4–6]. Therein, the current commonly used in DC charger is up to 300 A, and the DC current in rail transit often exceeds 1000 A. In terms of DC verification traceability equipment, Fluke 6100 A can only trace DC current or voltage; Fluke 5520 A can achieve power calibration, and the measurement accuracy of DC voltage can reach 50 ppm; LMG 95 can measure DC voltage of 600 V, and its DC current measurement range is 150 mA–20 A, and its DC power measurement accuracy is 0.03%. However, none of the above devices have the function of accumulating electricity, and then they cannot directly verify the DC energy meter.
With the wide application of high-power DC chargers, the development trend of DC energy metering and verification equipment is high current and high precision [7–9]. All countries have gradually established and improved regulations and standards involving DC energy measurement, where more than ten international standards for DC chargers have been released for this issue[10–12]. For example, IEC 62052-11: 2020 “Electricity Metering Equipment-General Requirements, Tests and Test Conditions-Part 11: Metering Equipment” and IEC 62053-41: 2021 “Electricity Metering Equipment-Particular requirements–Part 41: Static Meters for DC Energy (Classes 0.5 and 1)”, have been prepared by IEC Technical Committee 13: Electrical energy measurement and control. IEC 62052-11 specifies the general requirements for DC energy meters and AC energy meters, including such requirements and associated test methods as nominal value, structure, marking, electrical, climate, EMC, etc. [13].
On-site verification of chargers is one of the critical tasks to ensure fair trade. On-site verification of DC chargers needs to solve the problem of DC high current measurement [14–17]. At present, the resistance method, Hall method, and DC comparator are mainly utilized, and their accuracy can reach: 0.2%/year, 0.5%/year, and 5 ppm/year, respectively. The DC comparator is a traditional DC measurement and comparison method with a narrow dynamic range and cannot track the rapid changes in current during the charging process. In addition, as the equipment of chargers, the current often contains a certain AC component. When the charger is verified on-site, it is necessary to achieve broadband current measurement and comparison [18–20]. Paper [21] studied the integrated dual-mode DC power metering device for DC distribution networks. However, the effective voltage measurement range is 375 V, which is not suitable used in the scenarios of the DC voltage higher than 375 V. In [22], the DC electric energy measurement method for the domestic electric vehicle charging facilities is explored, in which the allowed measuring range of the current is lower than 250 A. Whereas, at present, the charging current is always higher than 600 A. In [23], the anti-DC bias energy meter based on the magnetic-valve-type current transformer is proposed. In the proposed approach, the magnetic-valve-type current transformer is used as the current sensor in the meter instead of the conventional current transformer. Although the proposed method can validly resolve the issue of the DC bias, how to integrate it to form a DC electric energy metering system for the on-site inspection of the DC charger is fuzzy. With the technological advancement of related equipment, e.g., batteries and conductive cables, and users’ requirements for shortening the charging time, the DC current level will be larger, and the accuracy of DC energy measurement will be higher [23]. With the technological advancement of related equipment, e.g., batteries and conductive cables, and users’ requirements for shortening the charging time, the provision of DC current level will be larger, and the accuracy of DC energy measurement will be higher [24].
To the best of the authors’ knowledge, the method for on-site inspection of high-power DC chargers is still insufficient. Aiming at the on-site inspection requirements of high-power DC chargers, this paper investigates the traceability method of DC chargers, the traceability methods of the built-in measuring instruments (DC energy meters and shunts) of chargers, and high-precision large DC current and DC. The output and measurement technology of precise micro voltage realizes high-precision measurement of DC current with a range of 0.001–600 A and DC measurement traceability with an accuracy of 0.005. It attains the uncertainty evaluation of the traceability system and conducts verification experiments on DC chargers. The contributions of this article are summarized as follows: (1) the traceability method of the built-in DC energy meter and shunt of the charger is proposed. (2) The technology of the precision DC high current and small precision DC voltage output and measurement is given. (3) Design a high-precision DC current measurement system with a range of 0.001–600 A, and propose a DC energy measurement traceability system with an accuracy of 0.005.
2 On-Site Inspection of DC Charger
2.1 Overall Plan for On-Site Inspection of DC Chargers
The on-site verification of the DC charger can be roughly classified into two kinds of methods: actual load verification and virtual load verification. The actual load verification is implemented when charging the electric vehicle. This method can only verify the charger under the existing working conditions and cannot verify the entire metering performance of the charger. The virtual load verification provides different load points for the on-site verification through the virtual power load to confirm the full range of the charger. Regardless of whether it is a virtual load or an actual load, a standard electric energy meter, i.e., a charging machine field calibrator, is required to compare with the measurement data of the impact machine.
According to the calibration requirement, the rated voltage of the charger is 100~750 V, the reference current is 10~500 A, and the accuracy is Class 1 or 2. The first step in verifying the DC charger is for the standard device to confirm the status and parameters of the charger. In other words, the standard device should exchange information with the charger to determine whether the charger and its parameters can be verified. This process is called interaction.
The second step is the formal calibration. The DC charger is connected to the charger calibrator (built-in special charging socket) through a particular electrical connection line. The other end of the charger calibrator is linked to the power load. When the charger provides DC power, the charger calibrator should accurately measure its electric energy value. In Fig. 1, the working principle of the calibration is depicted. The detailed process is as follows: (1) connect the charging gun of the DC charger to the input end of the charger calibrator; (2) connect the output end of the calibrator to the load; (3) adjust the parameters of the load; (4) compare the electric energy values measured by the calibrator and the tested charger at different load points simultaneously; (5) calculate the error of the tested charger.

Figure 1: Schematic diagram of precision small-signal voltage source output
2.2 High-Precision Large DC Current Output Technology
The verification device should output the high voltage and large current for the verification of the direct-input energy meters and shunts. Given the measurement range of the DC energy meter, the maximum voltage and current are 1000 V and 600 A. Although the 1000 V DC voltage output technology has been explored diffusely, the high-precision and stable DC current output source of up to 600 A are problematic in the current DC energy meter verification technology.
In contrast, two leading methodologies exist for outputting high-precision large DC current. (1) The adjustable voltage source is used to output the high voltage, which is converted into current by the shunt. The output of the adjustable voltage source is controlled by the negative feedback circuit for the voltage at both ends of the shunt to attain the stability and accuracy of the large current output [25]. (2) Use the switching power supply to generate a large current. This scheme is basically the same as the previous scheme. The output of the power supply is adjusted through negative feedback as well. The difference is that the feedback adjustment is performed by monitoring the magnitude of the current through the Hall sensor in the negative feedback loop. By monitoring the output of the Hall device and the size of the compensation current, the primary current value can then be obtained. Through this method, the large current generated by the switching power supply can be monitored. Furthermore, the negative feedback and numerical output are obtained.
2.3 Precision Small Signal Voltage Output Technology
When outputting a small DC voltage, it is easily affected by noise and temperature changes, thus affecting the output stability and measurement accuracy. Therefore, it is necessary to keep the temperature of the measurement loop uniform to reduce the error caused by temperature when designing the hardware. Furthermore, the four-wire terminal button method and the anti-interference line can be employed to measure small signals to reduce the influence of noise and keep the output stable and accurate. In Fig. 1, the typical precision small-signal voltage source schematic block diagram is presented.
The precision small-signal voltage output first provides a voltage reference signal through the central control unit. This signal and the feedback signal reach a stable voltage value through the integrator and output a DC small voltage with high stability and low noise through the power amplifier. What's more, the output voltage collects its voltage signal through the 1000:1 precision V/V conversion standard and converts it into a standard small voltage signal. The instrument amplifier amplifies the signal and then uses it as a feedback signal, thus forming a closed-loop negative feedback system.
The design uses constant temperature and ultra-low noise voltage reference, precision V/V conversion standard, and high-resolution ADC and DAC to achieve a small voltage signal accuracy of 0.01% to 0.05%. This meets the requirements of indirect-connected electric energy meters and traceability requirements.
2.4 The Main Challenges of On-Site Verification of Chargers
Compared with the laboratory, the on-site calibration of the charger is relatively harsh, majorly reflected in: (1) the temperature and humidity range is large −40°C~55°C, 20%~90% RH; (2) the dynamic range of the power supply of the charger is wider, and the surge current is larger, especially the fast DC may generate a large current of several hundred Amperes; (3) on-site calibration work requires that the test equipment is portable and has certain seismic performance.
The above problems require that the equipment used for the on-site verification of the charger should have good environmental adaptability. The solutions are as follows: (1) The current measurement circuit of the primary standard used for on-site verification of the charger cancels the mechanical or electrical contacts, To ensure that there is no instantaneous short circuit (such as protection, one-time shift, etc.) in the current loop, the instrument should have a solid ability to resist sizeable current impact. (2) All instruments and equipment components adopt wide temperature devices and cooperate with excellent circuit design and manufacturing process to minimize the impact of large-scale changes in temperature and humidity on measurement. (3) The major standard devices are installed in the seismic portable instrument box. The box body is equipped with rollers, which are easy to drag; the interior is filled with a large amount of buffer material.
3 Design of DC Energy Value Traceability System
According to the on-site inspection requirements of DC chargers, this paper constructs a DC energy value traceability system. It is necessary to measure the magnitude of voltage, current, and time to measure DC energy. Therefore, to realize the traceability of DC energy measurement, it is required to trace values of voltage, current, and time, respectively.
In the DC energy value traceability system designed in this paper, the accuracy of DC energy is up to 0.005%. The accuracy of time measurement can be up to 10−6, and the impact on electrical energy is negligible. Therefore, the DC voltage and current measurement error should be less than 0.0025%. The traceability system diagram of the DC energy value designed in this paper is shown in Fig. 2.

Figure 2: DC energy value traceability system diagram
The principle of DC voltage’s traceability: a voltage comparison test is performed by outputting a stable voltage signal from a high-stable DC source and connecting the voltage measurement circuit of the eight-and-a-half-digit meter in parallel with the voltage measurement circuit of the detected DC standard energy meter. To ensure the measurement accuracy of the eight-digit half-digit meter, a 0.001-level precision AC and DC voltage divider is used to perform V/V conversion. The DC large voltage of 10 mV~1150 V is converted into a DC voltage of 1 V and then through the 3458 A digital multi-purpose. The overall measurement accuracy equals to the proportional accuracy of the voltage divider (10 ppm) + the 1 V range measurement accuracy of the 3458 A (about 4.5 ppm), which is better than 0.0025% (25 ppm).
The principle of DC current traceability: connect the current measurement circuit of the eight-and-a-half-digit meter in parallel with the current measurement circuit of the tested DC standard electric energy meter to conduct a current comparison test. Therefore, it requires measuring the DC voltage indirectly. Furthermore, it demands measuring the DC current of 0.1 mA~600 A with accuracy within 0.0025%. The maximum DC current measurement capability of mainstream commercial 8½-digit digital multi-meters is 20 A. Hence the indirect transfer measurement method must be the same as the voltage. Here the current range is divided into two cases: 0.1 mA~100 A and 100 A~600 A:
(a) 0.1 mA~100 A DC current
It is planned to utilize a precision AC-DC coaxial shunt for I/V conversion. Convert the large DC current into a DC voltage of 1 V, and then measure it with a 3458 A digital multi-meter. The overall measurement accuracy = the proportional accuracy of the coaxial shunt (20 ppm) + 3458 A 1 V range measurement accuracy (about 4.5 ppm), better than 0.0025% (25 ppm).
(b) 100 A~600 A DC current
It is planned to use the DC proportional standard for I/I conversion. Convert the large DC current into a DC current of 1 A first. Secondly, convert it into a DC voltage of 1 V through a standard resistance of 1 Ω. Lastly, employ a 3458 A digital multi-meter to measure the voltage across the standard resistance. Overall measurement accuracy = DC proportional standard proportional accuracy (1 ppm~2 ppm) + 1 Ω precision resistance accuracy (<10 ppm) + 3458 A 1 V range measurement accuracy (about 4.5 ppm), better than 0.0025% (25 ppm).
DC energy meters can be divided into direct and indirect access. Direct access means that high voltage U and high current I are directly fed into the electric energy meter. The indirect access type generally converts a large DC current (0~300 A) into a small DC voltage (0~75 mV) through a shunt and then sends it to the electric energy meter. When the indirect access type is adopted, the shunt’s performance also needs to be verified besides the verification of the DC energy meter. Therefore, the DC electric energy meter verification needs to consider the direct-connected electric energy meter, the indirect-connected electric energy meter, and its external DC shunt. These three types of appliances can be verified through the DC energy meter (shunt) verification device.
4 Traceability of DC Voltage and Current
4.1 DC Voltage Traceability Method
In the scheme designed in this paper, the large DC voltage is converted into a small voltage of 1 V through precise V/V conversion and then sampled by a high-precision digital multi-meter to output the sampling signal of the voltage U1.
It is necessary to measure the large DC voltage of 10 mV~1150 V with accuracy within 0.0025%, and the results of the DC voltmeter cannot be directly obtained. On the one hand, the maximum DC voltage measurement capability of the mainstream commercial 8½-digit digital multi-meters is only 1050 V. On the other hand, the digital multi-meter’s input impedance decreases as the voltage range increases, such as the 1000 V range input impedance of 3458 A. It is 10 MΩ, and the calorific value is proportional to U2/R. Using its large voltage range for a long time will cause the instrument to heat up and affect the measurement accuracy.
Therefore, it is necessary to use an indirect measurement method for the DC voltage. Firstly, a 0.001-level precision AC-DC voltage divider is used for the V/V conversion, which converts the DC large voltage of 10 mV~1150 V into a DC voltage of 1 V. Then the DC voltage of 1 V is measured by the digital multi-meter 3458 A. The overall measurement accuracy equals to the proportional accuracy of the voltage divider (10 ppm) + the 1 V measurement accuracy of the 3458 A (about 4.5 ppm), which is better than 0.0025% (25 ppm).
According to the requirements of the traceability system, it requires measuring DC large currents ranging from 0.0001 to 600 A with accuracy within 0.0025%. The maximum DC current measurement capacity of mainstream commercial 8½-digit digital multi-meters is 20 A, which must be the same as the voltage. Use indirect transfer measurement. This paper divides the current range into 0.1 mA~100 A and 100~600 A to design, respectively.
(1) 0.1 mA~100 A DC current
In this paper, a precision AC-DC coaxial shunt is used for I/V conversion, and the DC large current is converted into a DC voltage of 1 V, and then measured by a 3458 A digital multi-meter. The overall measurement accuracy = the proportional accuracy of the coaxial shunt (20 ppm) +3458 A’s 1 V measurement accuracy (about 4.5 ppm) is better than 0.0025% (25 ppm).
(2) 100~600 A DC current
In this paper, the DC proportional standard is used for I/I conversion, and the large DC current is converted into a DC current of 1 A, and then converted into a DC voltage of 1 V through a 1 Ω precision resistor, and then measured by a 3458 A digital multi-meter. The overall measurement accuracy = DC proportional standard ratio accuracy (1~2 ppm) + 1 Ω precision resistance accuracy (<10 ppm) + 3458 A 1 V range measurement accuracy (about 4.5 ppm), better than 0.0025% (25 ppm).
The principle diagram of the traceability of the DC energy value is shown in Fig. 3.

Figure 3: Schematic diagram of traceability of DC energy value
To ensure that the technical requirements of DC energy meters meet the requirements of DC energy meters. The DC precision micro voltage output of the meter verification device must meet: when the verification device adjusts the output mV level voltage signal, the minimum value is ±20 µV, the basic error limit is ±1 µV, and the voltage output stability is 300 nV/min. However, when the verification device verifies the DC energy meter, the influence of the thermal electromotive force and contact electromotive force of materials, e.g., wires and terminals, will bring great errors to the verification process. Therefore, to remove the influence of interfering signals on the verification device, e.g., thermocouples and contact electromotive force, we adopt the four-wire measurement mode to measure the DC precise micro voltage, and design a precise DC small signal voltage standard source in combination with the small signal testing process. Moreover, we increase the input resistance of the DC energy meter and shunt to reduce the influence of wires on the measurement accuracy.
In the on-site verification of electric vehicle chargers, the measurement error obtained by the electric vehicle charger on-site tester to verify the tested charger is η1 (%), and the measurement error introduced by the electric vehicle charger on-site tester is η2 (%). The measurement error introduced by the rounding off of the error data of the electric vehicle charger under inspection is η3 (%). The measurement error of the electric energy of the electric vehicle charger under inspection is η (%):
Then the combined uncertainty is
Among them, c1, c2, c3 are the sensitivity coefficients of error propagation obtained by formula (1)
where, u(η1) represents the standard uncertainty introduced by the measurement repeatability of the electric vehicle charger under test and adopts the Uncertainty A. u(η2) is the standard uncertainty introduced by the measurement error η2 of the electric vehicle charger field tester. u (η3) is the standard uncertainty introduced by rounding off the error of the tested electric vehicle charger by η3, which is evaluated by the Uncertainty B.
5 Analysis of Experimental Results
5.1 Uncertainty Evaluation Experiment
(a) Standard uncertainty u(η1) introduced by the measurement repeatability of the tested electric vehicle charger
For a level 1 electric vehicle charger, the data obtained by repeating the measurement 10 times at a reference voltage of 200 V and a reference current of 100 A are shown in Fig. 4. Note that the relative error is defined as the ratio of the absolute error of the measured value to the actual measured value. The relative error is dimensionless. The unit of the absolute error and the actual measured value is kWh.

Figure 4: Measurement repeatability results
The average of 10 measurements in Fig. 4 is about 0.3%. The experimental standard deviation for a single measurement is S = 0.0489%. The standard uncertainty result can be taken as the average of the two measurement errors:
(b) The standard uncertainty u(η2) introduced by the measurement error η2 of the DC electric energy metering and verification system of the electric vehicle charger
Assuming that 0.005 is used for the electric vehicle charger’s DC energy metering and verification system. Wherein the maximum allowable error is e1 = ±0.005%, which is uniformly distributed, k =
(c) Standard uncertainty u(η3) introduced by rounding off η3 of the tested electric vehicle charger error
According to the data rounding rules, the rounding interval of the measurement results of the Class 1 charger is 0.1%. The measurement uncertainty introduced by rounding is 0.1%. The half-width of the interval is 0.05%. The standard uncertainty introduced by machine error rounding η3 is
According to (2), the standard uncertainty of the system synthesis is
Consequently, it yields uc(η) = 0.0451%.
From the above results, it obtains that the proposed method has robustness against the uncertainty. And the combined standard uncertainty of the DC power metering verification system can be 0.0451%.
5.2 On-Site Verification Experiment of Charger
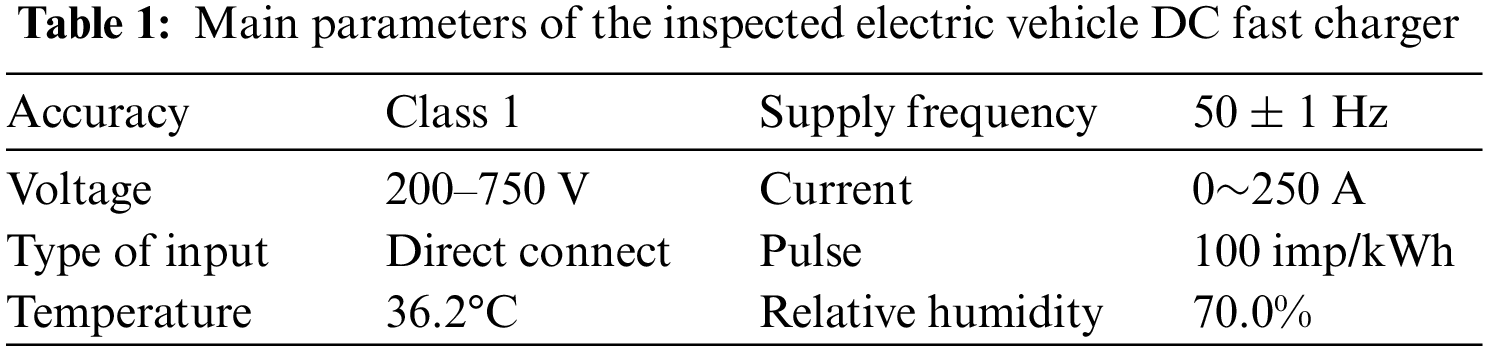
The designed DC power metering and verification system are used to verify the DC fast charger for electric vehicles produced by XXX Company (Changsha, China). The main parameters of the tested electric vehicle DC fast charger are depicted in Table 1.
In the traceability process, for the energy pulse output of the DC standard energy meter, the energy pulse output frequency can be calculated according to the following formula:
where, f0 is the calculated energy pulse of the standard device. PX is the current measured power of the DC standard energy meter. URG is the current/voltage range of the DC standard energy meter. IRG is the current range of the DC standard energy meter, and k is the electric energy of the DC standard energy meter Pulse output constant.
The energy pulse can be calibrated by measuring the output frequency of the standard energy meter energy pulse by the frequency meter. First, obtain the measured power PX of the standard electric energy meter. Secondly, employ the frequency meter to measure the pulse frequency issued by the standard electric energy meter. Lastly, the measured frequency is f1, and the relative error of the electric energy pulse of the tested standard electric energy meter is
The pulse method’s results to test the working error are shown in Fig. 5. The operational error test under 200 V, 100 A is 8 times, and the working error under 200 V, 200 A, and 10 A is tested 3 times each.

Figure 5: Relative error of charger pulse method test
The experimental results verify that the designed DC electric energy metering device has high accuracy with 0.005. Therefore, the built DC electric energy metering equipment is an effective tool to attain the DC high current measurement and DC energy traceability.
5.3 Comparison with the State-of-the-Art Method
Some methodologies of the DC electric energy metering have been proposed previous, while compared with the methods presented in [21–24], the advantages of the DC energy metering method proposed in this paper are as follows:
1) The wider operation condition of voltage for the charger is considered. The maximum DC voltage measurement capability of the mainstream commercial 8½-digit digital multi-meters is only 1050 V, and the results of the DC voltmeter cannot be directly obtained. In contrast, the designed equipment in this paper can measure the large DC voltage of 10 mV~1150 V with accuracy within 0.0025%.
2) The wider operation condition of the current for the charger is considered. The maximum DC current measurement capacity of mainstream commercial 8½-digit digital multi-meters is 20 A, which must be the same as the voltage. However, this paper’s designed equipment can measure the large DC currents ranging from 0.0001 to 600 A with an accuracy of 0.0025%.
3) The uncertain impact of the on-site chargers is considered. Compared with the laboratory, the impact of on-site of the charger contains (1) the temperature and humidity range is large −40°C~55°C, 20%~90% RH; (2) the dynamic range of the power supply of the charger is wider, and the surge current is larger, especially the fast DC may generate a large current of several hundred Amperes; (3) On-site calibration work requires that the test equipment is portable and has certain seismic performance. Considering the on-site chargers’ impact, the designed equipment in this paper inherits good environmental adaptability. However, the state-of-the-art methods often ignore the aforementioned uncertainty influence [21–24].
The experimental results have verified that the designed equipment in this paper has a high-precision DC current measurement system with a range of 0.001–600 A, the DC energy measurement traceability system can be with an accuracy of 0.005, and the combined standard uncertainty of the DC power metering verification system is 0.0451%. Hence the proposed method of the DC high current measurement and DC energy traceability is effective and can resolve the emerging issues of the on-site verification of DC chargers.
Aiming at the problems of DC high current measurement and DC energy traceability that urgently need to be solved in the on-site verification of DC chargers, this paper studies the energy value traceability method for high-power DC chargers for automobiles and analyses the built-in DC energy meter and shunt value of the charger. Traceability method, research the output and measurement technology of high-precision large DC current and DC precise micro-voltage, design a high-precision DC current measurement system with a range of 0.001–600 A, and propose a DC energy measurement traceability system with an accuracy of 0.005. The combined standard uncertainty of the DC power metering verification system is 0.0451%. The experimental results of verifying the first-level DC charger show that the system can meet the field verification requirements of high-power DC chargers. The harmonic impact on this research is considered. In the future, the influence of the harmonic on the accuracy of measurement will further be explored. Furthermore, as to the increase of the electric vehicle penetration, the interaction influence of different electric vehicles on the DC electric energy metering will also be explored.
Funding Statement: The authors received no specific funding for this study.
Conflicts of Interest: The authors declare that they have no conflicts of interest to report regarding the present study.
References
1. Seth, A. K., Singh, M. (2021). Unified adaptive neuro-fuzzy inference system control for OFF board electric vehicle charger. International Journal of Electrical Power & Energy Systems, 130(5), 106896. DOI 10.1016/j.ijepes.2021.106896. [Google Scholar] [CrossRef]
2. Hsu, C. W., Fingerman, K. (2021). Public electric vehicle charger access disparities across race and income in California. Transport Policy, 100, 59–67. DOI 10.1016/j.tranpol.2020.10.003. [Google Scholar] [CrossRef]
3. Phanden, R. K., Gupta, R., Gorrepati, S. R., Patel, P., Sharma, L. (2021). ANN based robust bidirectional charger for electric vehicles. Materials Today: Proceedings, 38, 80–84. [Google Scholar]
4. Padmapriya, M., Raghavendiran, T. A., Gomathi, S. (2021). Smart energy meter for electric vehicle. 2021 International Conference on Artificial Intelligence and Smart Systems (ICAIS), pp. 1677–1682. Coimbatore, India. [Google Scholar]
5. Zucca, M., Bottauscio, O., Harmon, S., Guilizzoni, R., Schilling, F. et al. (2019). Metrology for inductive charging of electric vehicles (MICEV). 2019 AEIT International Conference of Electrical and Electronic Technologies for Automotive (AEIT AUTOMOTIVE), pp. 1–6. Turin, Italy. [Google Scholar]
6. Chu, S. Y., Avestruz, A. (2019). A new calibration strategy for transfer-power measurement of wireless charging of electric vehicles. 2019 IEEE Transportation Electrification Conference and Expo (ITEC), pp. 1–5. Detroit, MI, USA. [Google Scholar]
7. Chen, Z., Li, F., Xu, X., Dong, X., Wang, P. et al. (2019). Research on remote calibration system of DC metering device for electric vehicle charging piles based on embedded. 2019 IEEE 3rd Information Technology, Networking, Electronic and Automation Control Conference (ITNEC), pp. 300–304. Chengdu, China. [Google Scholar]
8. Zucca, M., Pogliano, U., Modarres, M., Giordano, D., Crotti, G. et al. (2018). A voltage calibration chain for meters used in measurements of EV inductive power charging. 2018 Conference on Precision Electromagnetic Measurements (CPEM 2018), pp. 1–2. Paris, France. [Google Scholar]
9. Chu, S. Y., Avestruz, A. (2017). Transfer-power measurement: A non-contact method for fair and accurate metering of wireless power transfer in electric vehicles. 2017 IEEE 18th Workshop on Control and Modeling for Power Electronics (COMPEL), pp. 1–8. Stanford, CA,USA. [Google Scholar]
10. IEC 62052-11 (2003). Electricity metering equipment (AC)–General requirements, tests and test conditions-Part 11: Metering equipment. International Electrotechnical Commission, Geneve. [Google Scholar]
11. IEC 62053-21 (2003). Electricity metering equipment (AC)–Particular requirements--Part 21: Static meters for active energy (classes 1 and 2). International Electrotechnical Commission, Geneve. [Google Scholar]
12. IEC 62053-22 (2020). Electricity metering equipment (AC)–Particular requirements--Part 22: Static meters for active energy (classes 0.2 S and 0.5 S). International Electrotechnical Commission. [Google Scholar]
13. Cetina, Q., Roscoe, R. A. J., Wright, P. S. (2017). Challenges for smart electricity meters due to dynamic power quality conditions of the grid: A review. 2017 IEEE International Workshop on Applied Measurements for Power Systems (AMPS), pp. 1–6. Liverpool, UK. [Google Scholar]
14. Liu, H., Zhu, X., Xiao, Z., Wu, Y., Li, P. et al. (2020). The application of smart meter in the management of electric vehicle charging facilities. Procedia Computer Science, 175(4), 774–777. DOI 10.1016/j.procs.2020.07.115. [Google Scholar] [CrossRef]
15. Zeng, B., Liu, Y., Luo, Y. (2021). Quantifying contribution of DER-integrated EV parking lots to reliability of power distribution systems. Energy Engineering, 118(6), 1713–1728. DOI 10.32604/EE.2021.016678. [Google Scholar] [CrossRef]
16. Min, Q., Deng, M., Zheng, Z., Wang, S., Gui, X. et al. (2021). Research on direct yaw moment control strategy of distributed-drive electric vehicle based on joint observer. Energy Engineering, 118(4), 853–874. DOI 10.32604/EE.2021.014515. [Google Scholar] [CrossRef]
17. Seth, A. K., Singh, M. (2021). Modified repetitive control design for two stage off board electric vehicle charger. ISA Transactions. DOI 10.1016/j.isatra.2021.09.015. [Google Scholar] [CrossRef]
18. Joseph, J. J., Josh, F. T., Gilbert, S. L. (2021). A test bench on quality checking for electric vehicle chargers. Materials Today: Proceedings, 45, 8176–8181. [Google Scholar]
19. Ahmed, I., Ahmad, I., Ahmed, S., Adil, H. M. M. (2021). Robust nonlinear control of battery electric vehicle charger in grid to vehicle applications. Journal of Energy Storage, 42(1), 103039. DOI 10.1016/j.est.2021.103039. [Google Scholar] [CrossRef]
20. Yu, C., Duan, Y., Meng, J., Li, X., Liu, W. et al. (2021). Comparative study on domestic and international standards of DC energy meter. 2021 IEEE 4th International Conference on Renewable Energy and Power Engineering (REPE), pp. 11–16. Beijing, China. [Google Scholar]
21. Meng, J., Song, L., Bai, J., Cen, W., Duan, Y. et al. (2022). Research on an integrated dual mode DC energy metering device and metering method. 2022 International Conference on Power Energy Systems and Applications (ICoPESA), pp. 138–143. Singapore. [Google Scholar]
22. Gong, D., Zhang, C., Ma, J., Zhang, C., Liu, X. et al. (2022). Accurate measurement of DC electric energy in power plant. Journal of Physics: Conference Series, 2218(1), 012029. [Google Scholar]
23. Chen, B., Zhang, Z., Wu, Y., Tian, C., Chen, Y. (2022). A novel anti-DC bias energy meter based on magnetic-valve-type current transformer. IEEE Transactions on Instrumentation and Measurement, 71, 1–9. DOI 10.1109/TIM.2022.3197782. [Google Scholar] [CrossRef]
24. Alonso, L. M., Roux, L. D., Taunay, L., Watare, A., Saudemont, C. et al. (2022). Energy metering data estimation and validation in railways. IEEE Transactions on Power Delivery. [Google Scholar]
25. Wang, Z., Yang, M., Yang, J. (2018). Research and construction of DC energy measurement traceability technology. IOP Conference Series: Earth and Environmental Science, 113, 012097. [Google Scholar]
Cite This Article
 Copyright © 2023 The Author(s). Published by Tech Science Press.
This work is licensed under a Creative Commons Attribution 4.0 International License , which permits unrestricted use, distribution, and reproduction in any medium, provided the original work is properly cited.
 Downloads
 Citation Tools