
 Submit a Paper
 Propose a Special lssue
 Open Access
ARTICLE

Comparative Analysis of Equal and Unequal Grounding Grid Configurations by Compression Ratio and Least Square Curve Fitting Techniques
Dayananda Sagar College of Engineering, Bangalore, 560078, India
* Corresponding Author: M. Soni. Email:
Energy Engineering 2023, 120(3), 597-616. https://doi.org/10.32604/ee.2023.021301
Received 06 January 2022; Accepted 12 April 2022; Issue published 03 January 2023
 View Full Text
 Download PDF
Abstract
The primary aim of the power system grounding is to safeguard the person and satisfying the performance of the power system to maintain reliable operation. With equal conductor spacing grounding grid design, the distribution of the current in the grid is not uniform. Hence, unequal grid conductor span in which grid conductors are concentrated more at the periphery is safer to practice than equal spacing. This paper presents the comparative analysis of two novel techniques that create unequal spacing among the grid conductors: the least-square curve fitting technique and the compression ratio technique with equal grid configuration for both square and rectangular grids. Particle Swarm Optimization (PSO) is adopted for finding out one optimal feasible solution among many feasible solutions of equal grid configuration for both square and rectangular grids. Comparative analysis is also carried out between square and rectangular grids using the least square curve fitting technique as it results in only one unequal grid configuration. Simulation results are obtained by the MATLAB software developed. Percentage of improvement in ground potential rise, step voltage, touch voltage, and grid resistance with variation in compression ratios are plotted.Keywords
Nomenclature
| Conductor spacing from center of the grid | |
| Maximum conductor spacing | |
| Compression ratio | |
| m | Total number of conductor spacing |
| L | Length of the grid |
| n | Total number of grid conductors |
| Number of grid segments | |
| Length of each segments | |
| k | Number of grid meshes |
| Number of grid conductor along horizontal direction | |
| Number of grid conductor along vertical direction | |
| Coefficients | |
| α, β | Coefficients |
| Reduced number of conductors along horizontal direction | |
| Reduced number of conductors along vertical direction | |
| Total number of reduced grid conductors |
It has been noticed that in a grounding grid with equal conductor spacing, more current originates from the conductors at the periphery, which results in the surface voltage being higher near the edge of the grounding grid than at the center [1]. Hence, it is not uniform throughout the grid. This results in making the grounding grid unsafe near the edge under heavy fault. This problem is overcome by designing the grid with the dense conductors at the periphery, which is done with two novel techniques such as least-square curve fitting and Compression ratio techniques. An analysis is carried out using these two techniques for both square and rectangular grid configurations. With increase in equal spacing grid conductors for the same area, the ground potential rise decreases and potential difference between two conductors will decrease, so, the voltage profile will be more uniform [2].
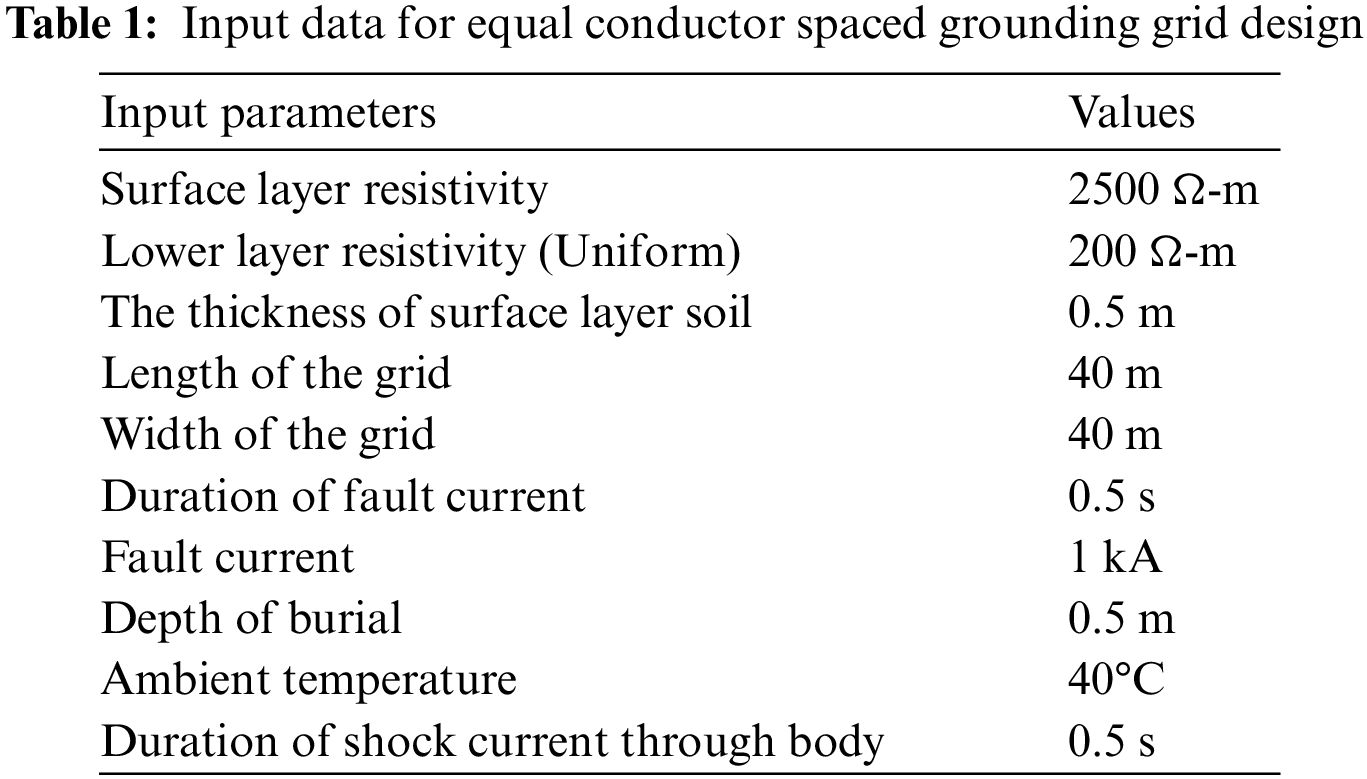
Initially, for the input data are shown in Table 1, one optimal feasible solution is obtained from an enormous feasible solution to achieve an optimal number of conductors along the horizontal and vertical axis for equal grounding grid design using Particle Swam Optimization (PSO) algorithm. For this optimal number of conductors, the compression ratio technique creates unequal distance by varying the value of CR from 0 to 1 in Eq. (1). Output parameters such as ground potential rise, step voltage, touch voltage, and grounding resistance are compared. The compression ratio technique results in many unequal grid configurations, but all the grid configurations may not be feasible. Hence, only feasible grid configurations are considered, and the rest all are discarded. The Least-square curve fitting technique results in one feasible solution with a reduction in the number of grid conductors along horizontal and vertical axis. In [3], the authors proposed a cost effective substation grounding grid design for given set of input parameters. Cost affecting factors such as types of the grid conductors, depth of the grid burial, grid conductor spacing, number of ground rods and length of the ground rods are considered to minimize the cost. One optimal solution is obtained with enormous feasible solution. In [4], overview of substation grounding grid design was carried out based on IEEE std. 80-2000. Gravitational Search Algorithm (GSA) and Particle Swarm Optimization are proposed to achieve an effective grounding grid for equal grid conductor spacing. In [5], the authors proposed IEEE method and Finite Element Method (FEM) to find out the effect of different grid configurations on touch voltage, step voltage, grid resistance and Ground Potential Rise (GPR) for beverage and food industry. The simulation results revealed that L-shaped grid with equal conductor spacing gave the best results compared to other grid shapes. In [6], the authors, proposed two novel techniques such as compression ratio and least square curve fitting techniques to achieve unequal span the grid conductor for give number of conductor and given shape of the grid. Impact of touch and step voltages with increase in depth of grid burial and at different grid configuration analyzed and plotted. In [7], a least square method is presented for design of unequal spaced substation ground grid to make current density uniform among the grid conductors. In [8], the authors proposed Genetic Algorithm (GA) to design grounding grid with unequal conductor spacing. Proposed technology is used for design of grounding grid for petroleum company. Results obtained from GA is compared with CYGRD software. In [9–12], the authors proposed PSO and BAT algorithm to achieve optimal unequal grid configuration among many feasible configurations. Developed a MATLAB software program to find optimal compression ratio for a given grid area and number of grid conductors. In [13], the authors proposed is to inject the grid current into deep soil to reduce GPR, grid resistance and surface potential satisfying safety criterion. The ground rods for equal and unequal grid are analyzed using Auto grid pro SES grounding software. In [14,15], the authors proposed PSO and Genetic Algorithm Optimization (GAO) and Hybrid Particle Swarm Genetic Algorithm Optimization (HPSGAO) to ensure the safety and to determine economic grounding system. Results obtained revealed that HPSGAO technique presents lower values of the cost than GAO and PSO methods. In [16,17], the authors proposed a simplified approached for GPR and Earth Surface Potential (ESP) of grounding for uniform or non-uniform soil. It has been shown that distribution of grid conductor with unequal spacing having denser conductor at the periphery can provide most efficient grounding design. In [18,19], the authors presented a touch voltage reduction technique for two layer and uniform soil by compression ratio. It has shown that, for a given maximum step voltage, GRP and touch voltage of the rectangular grid with ground rods are lower than the without ground rods regardless its compression ratio. In [20], the authors presented computation of ground resistance and assesses safety of the grounding grid at three 161/23.9 kV substation and obtained results are compared with one-layer model of Schwarz’s equation of IEEE Std. 80-2000. In [21–23], the authors proposed a new mathematical function of the cost for designing economics and effective T shaped and L shaped grid configurations. The cost function used here include number of rods and conductors, dimensions of ground rods, horizontal and vertical conductor, revetment and excavation area. Proposed a method which reduces the whole cost related to materials of the grid, excavation and installation. In [24,25], the authors provided the rule to select the vertical ground rods in two or multilayer o based on the based on the relationship between the length and number of ground rods. Had concluded that placing the ground rods at the periphery and at the corners of the grid is better that placing at the of the grid. In [26], the authors proposed a method to obtain the voltage profile of the grounding grid by solving linear programming problem. Proposed method is fast and gives satisfactory and accurate results. In [27], the authors suggested, the evolution method for grounding grid design with unequal spacing among the grid conductor. Grounding grid design is based on the hybridization of PSO and Optimal Compression Ratio (OCR) technique. Proposed method offer 20% saving of the copper compared with OCR technique. In [28], the authors presented a comparative analysis of square, rectangular and L shaped grid configuration to find the optimal grounding design. Obtained results revealed that, compared to L shaped and square grid, rectangular grid has minimum values of GPR, grounding system resistance and mesh voltage.
2 Optimal Grounding Grid Design
Optimal grounding grid design is achieved by the Particle Swarm Optimization algorithm. Most of the mathematical computations involved in the traditional optimization algorithms are eliminated by the PSO algorithm. The aim being pursued is to arrive at a design such that safety limitations required by the standard guidelines are met [1]. The design is carried out based on the guidelines provided by IEEE Std. 80-2000 [1]. Input data are shown in Table 1 for which optimal solution is obtained.
Rectangular and square grid are designed for upper soli resistivity of 2500 Ω-m and lower soil resistivity 200 Ω-m and thickness of the upper layer is 0.5 m. Grounding grid is being test for the fault current of 1 kA and duration of shocking current through body is 0.5 s. Optimal number of grid conductors for square and rectangular grid is obtained considering input data shown in Table 1.
Particle Swarm Optimization (PSO) Technique is population based stochastic optimization intelligent technique inspired by social behavior of bird flocking. This algorithm is easy to implement as it used few parameters and can successfully applied to obtain optimal solution. In PSO each member of particles has fitness function to be optimized and have velocity with which particle fly. In every iteration particle are updated by two best values. The first is the Pbest and the second is the gbest. Flow chart of the PSO algorithm used is shown in Fig. 1.
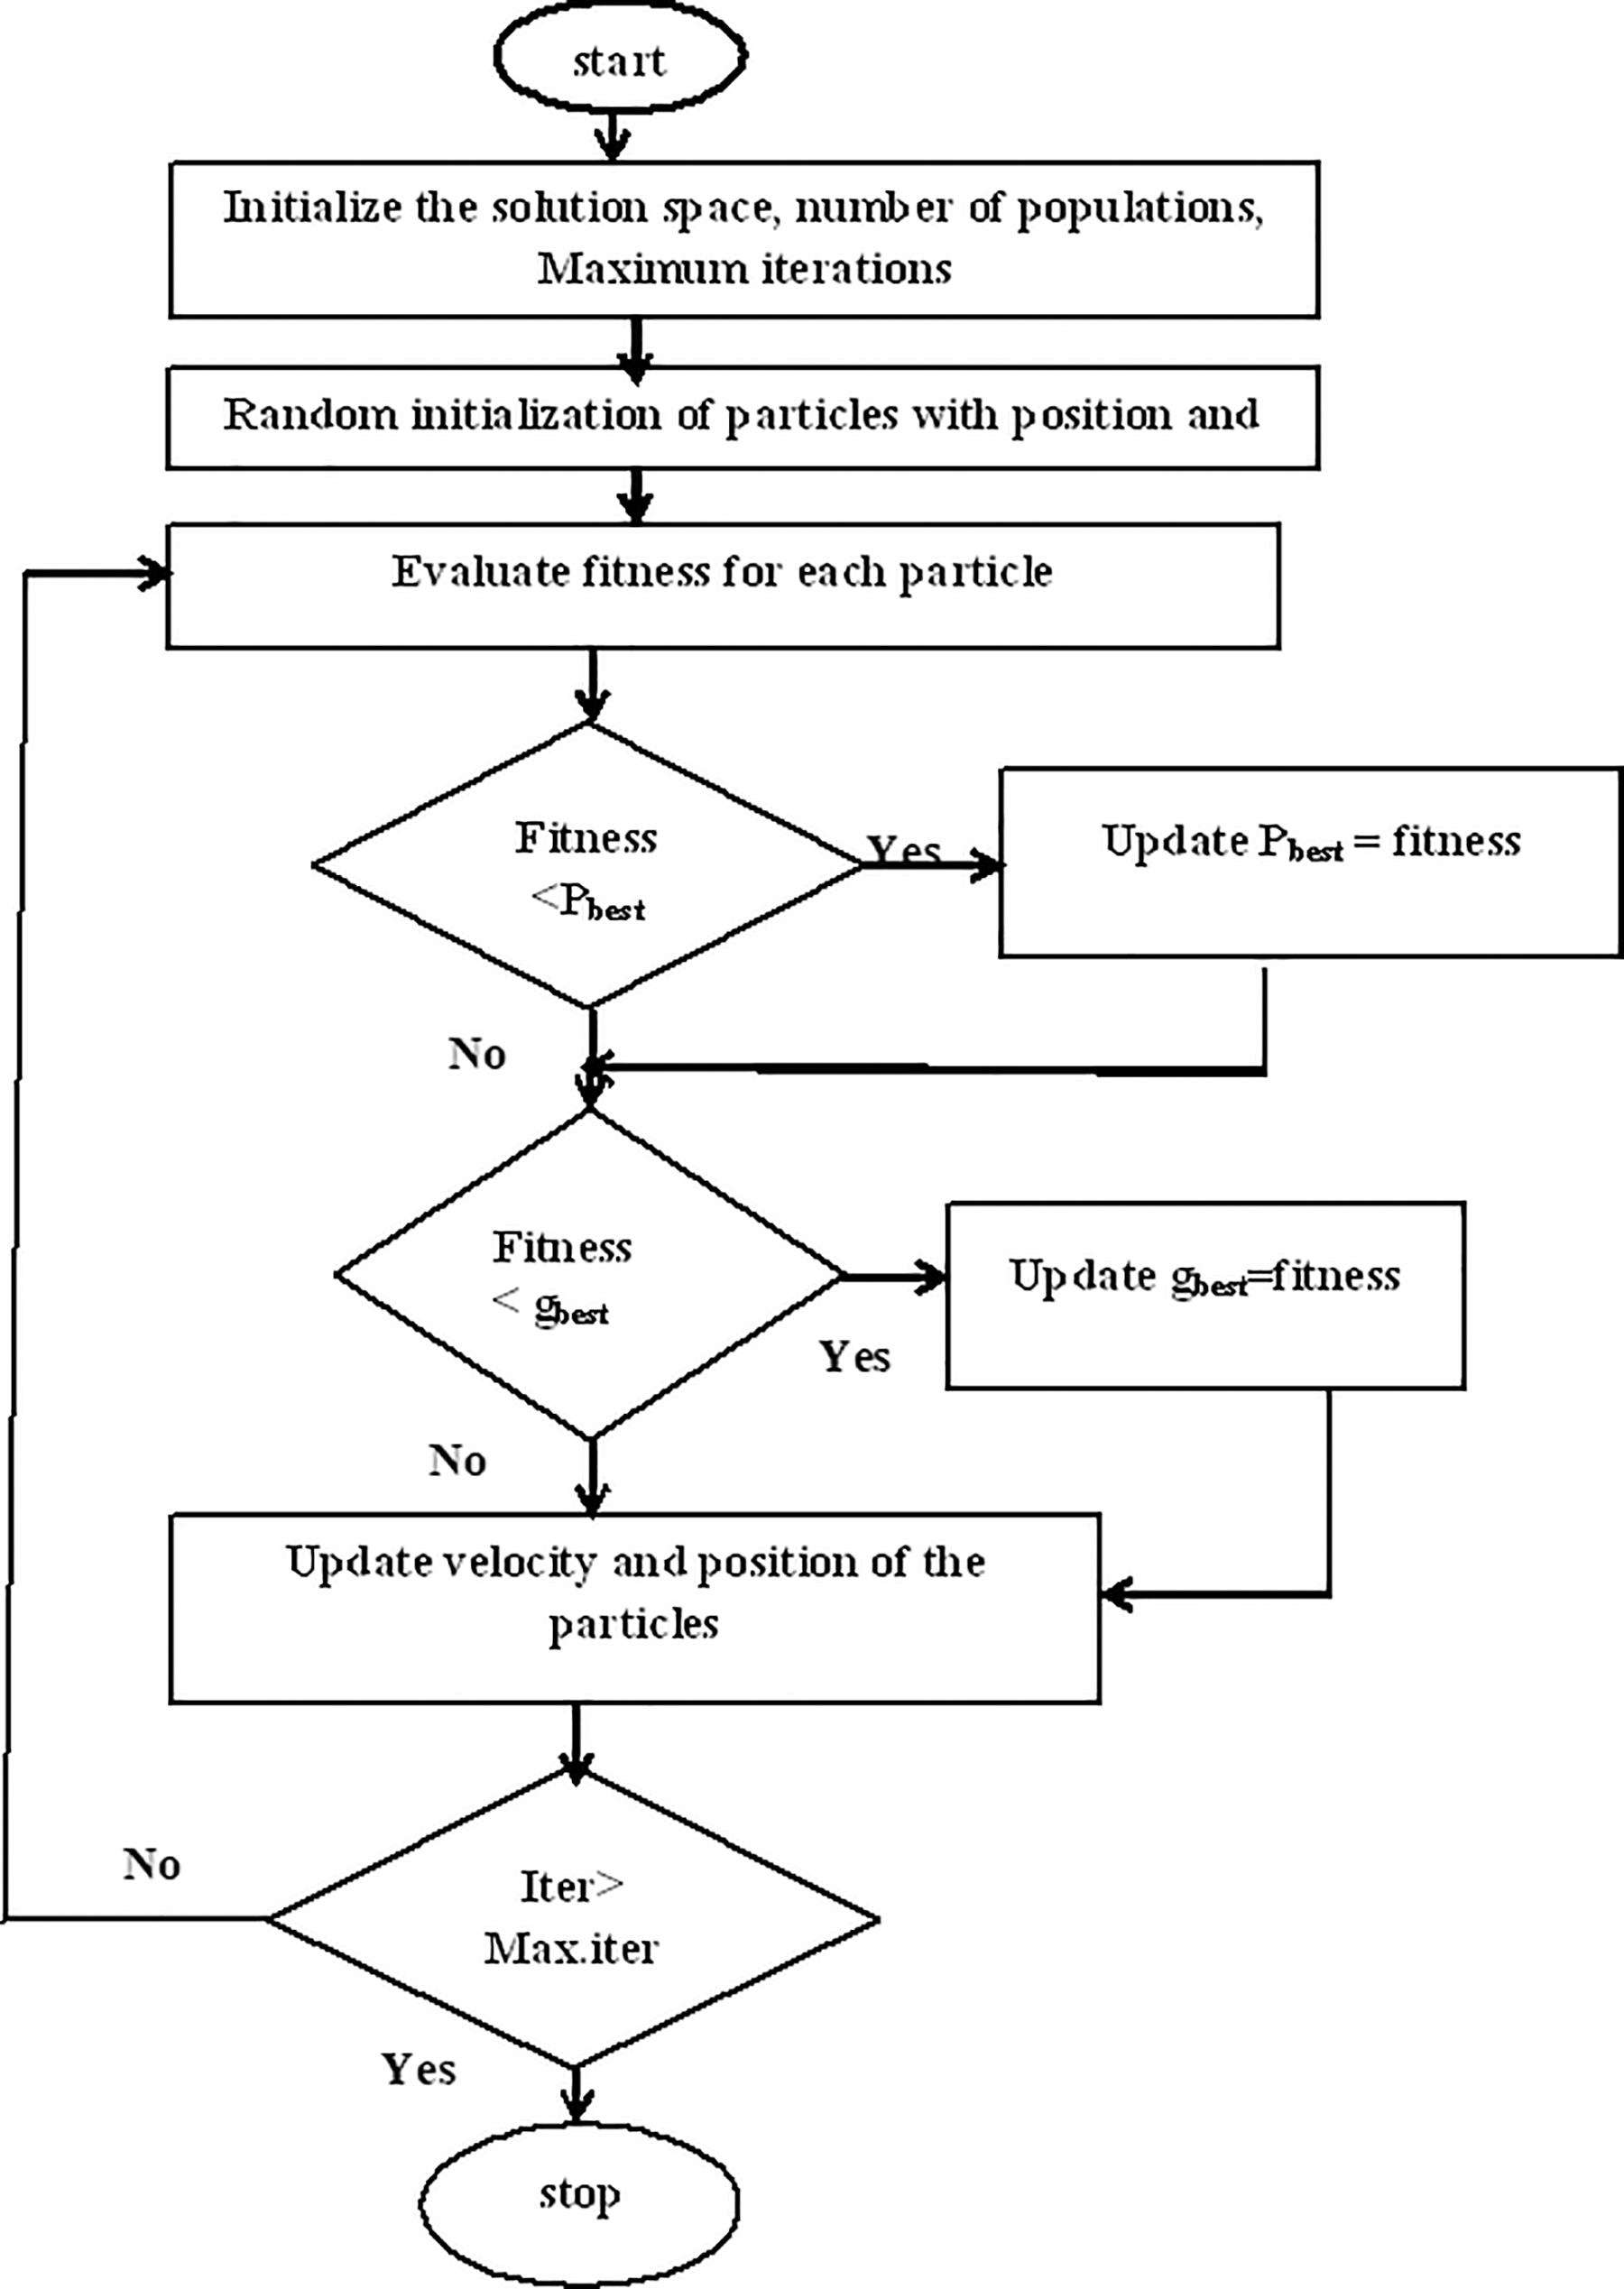
Figure 1: Flow chart of the PSO algorithm
Equation used for finding optimal value of compression ratio CR is
Chose
3 Comparative Analysis by Compression Ratio Technique
As it is required to push more conductors towards the periphery to make the current distribution uniform among them, compression ratio CR should be less than 1 in Eq. (2). The ith conductor spacing from the middle is given by [2]
m: Total number of conductors spacing from center to the left of the grid.
The maximum distance at the center is given by [2]
L: Length of the grid side.
n: Total number of conductors along horizontal and vertical axis of the grid.
Odd number of ‘n’ will result in symmetrical arrangement throughout the grid and even number of ‘n’ results in symmetrical arrangement except the center span.
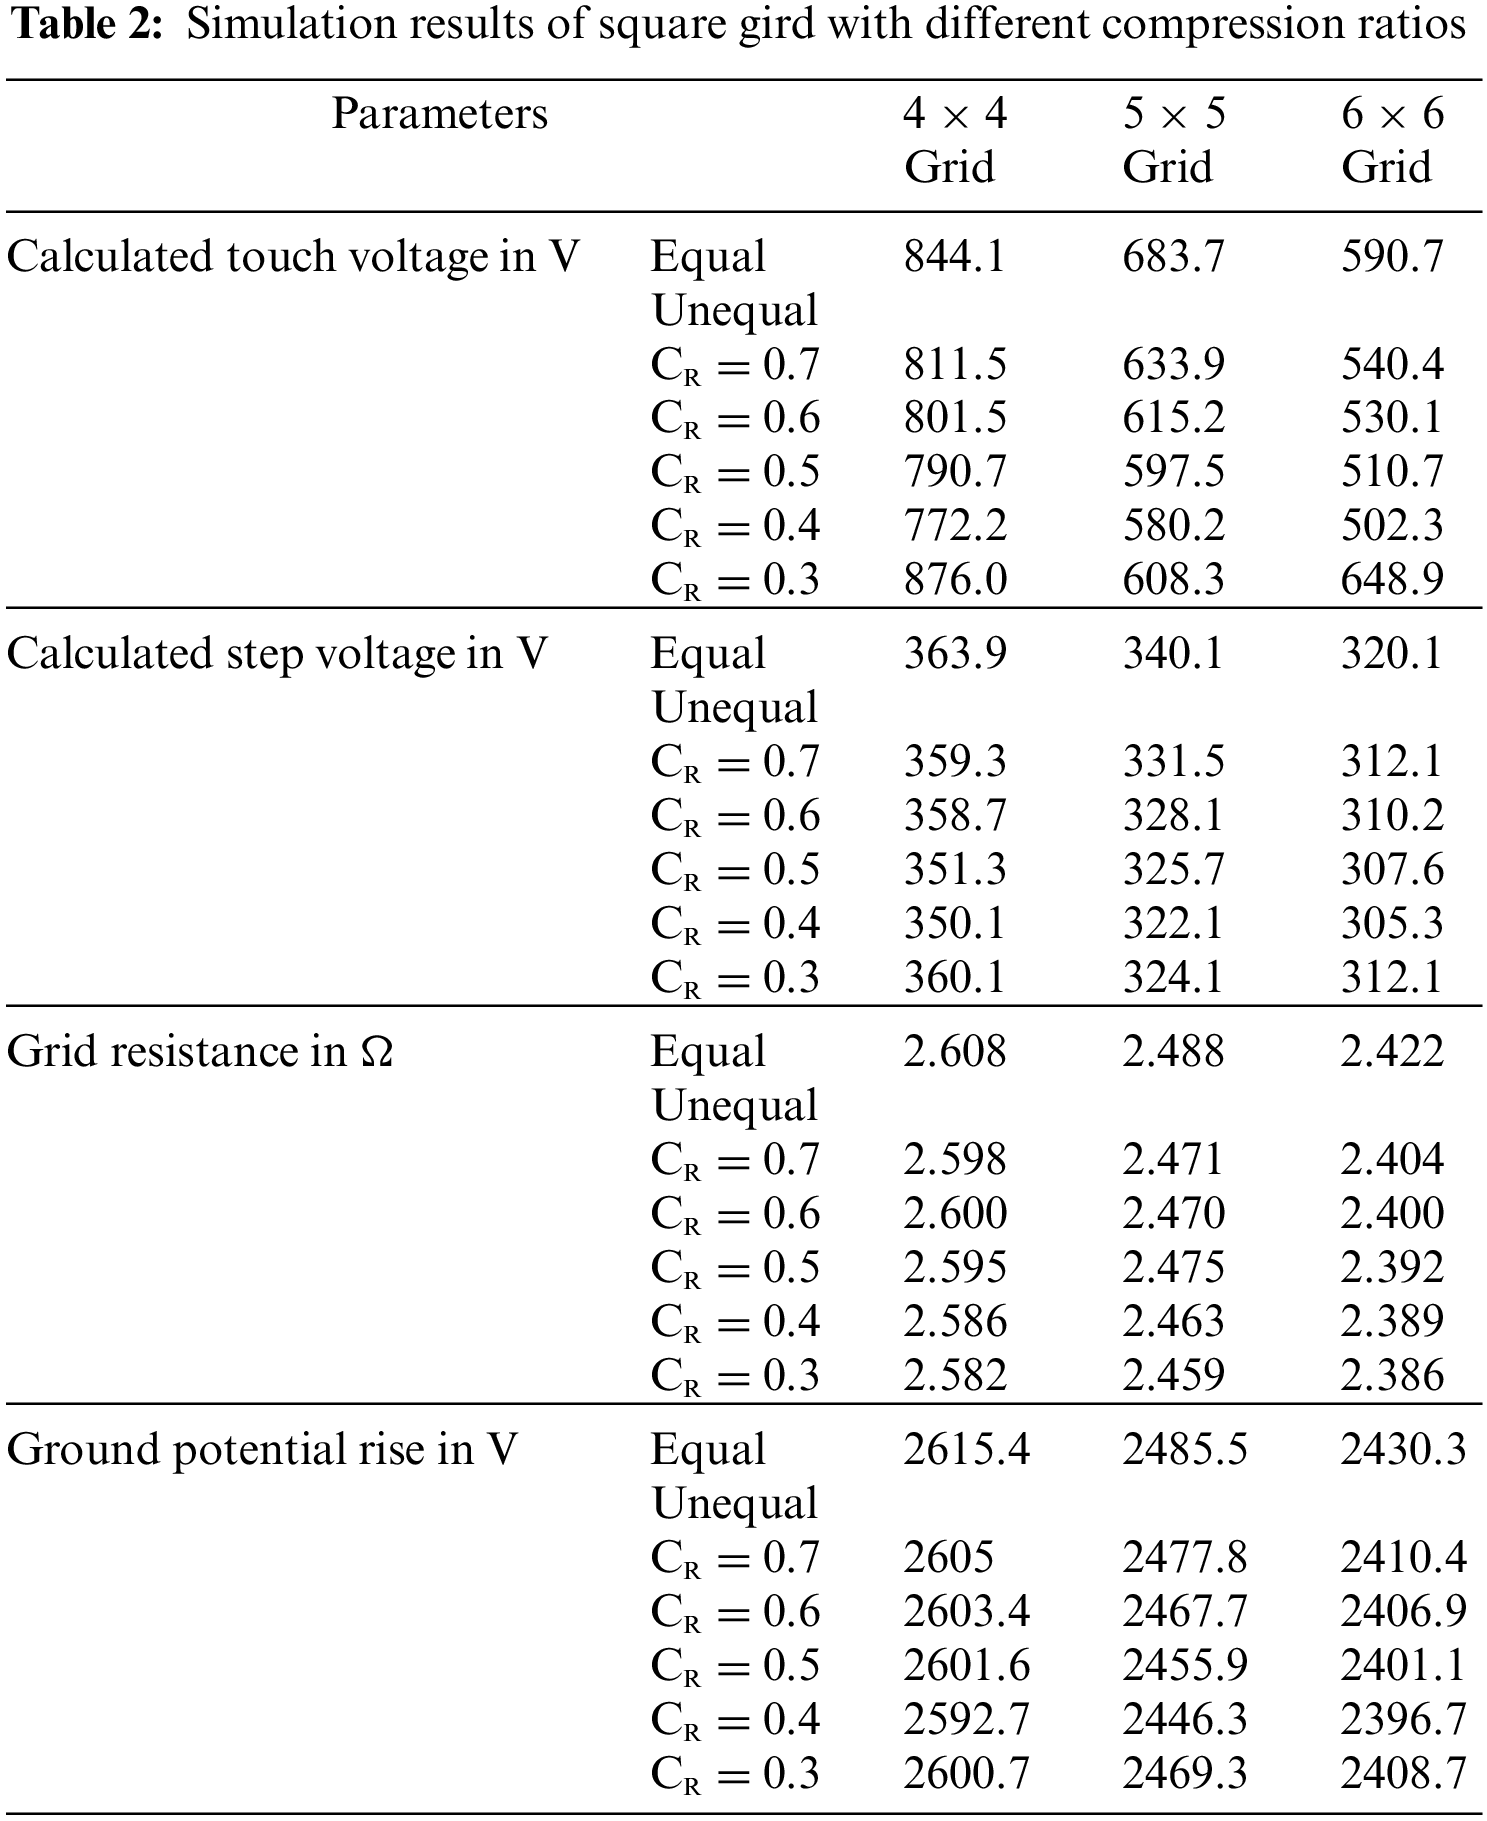
As touch voltage is more influenced by the increase in conductor spacing compared to step voltage [3], unequal grid design has more effect on touch voltage than step voltage shown in Table 2. For input data from Table 1, the optimal solutions obtained are: Tolerable touch voltage is 1011.9 V, tolerable step voltage is 3381.6 V, calculated touch voltage is 844.1 V, calculated step voltage is 363.9 V, ground potential rise is 2615.4 V, and the grid resistance is 2.608 Ω, number of horizontal and vertical grid conductors is 4. Likewise, calculated for other grid configurations as well shown in Table 2.
3.1 Comparative Analysis of Square Grid Design
The considered area of the grounding grid is 1600 m2 (40 m × 40 m) with three grid configurations of 4 × 4 (4 conductors along the vertical axis and 4 conductors along the horizontal axis of the grid), 5 × 5 (5 conductors along the horizontal axis and 5 conductors along the vertical axis of the grid), and 6 × 6 (6 conductors along the horizontal axis and 6 conductors along the vertical axis of the grid). For each configuration compression ratio CR is changed from 0.3 to 0.7 in step of 0.1 as the solution is not feasible for other values of CR. The comparative analysis has been carried out with equal grid design which resulted in a decrease in GPR, step voltage, touch voltage, and grid resistance as shown in Table 2, but touch voltage percentage improvement is more compared to step voltage, GPR and grid resistance in all the three grid configurations. From Table 3, it is observed that there is a better improvement in all the simulated results with an increase in the number of grid conductors. As already discussed, the grid design is not feasible for all grid configurations, so when the compression ratio CR is less than 0.4 the solution is not feasible hence it can be discarded. Graph of percentage of improvement of touch voltages, step voltages, grid resistances and GPR with variation in compression ratios are as revealed in Figs. 2–5, respectively.
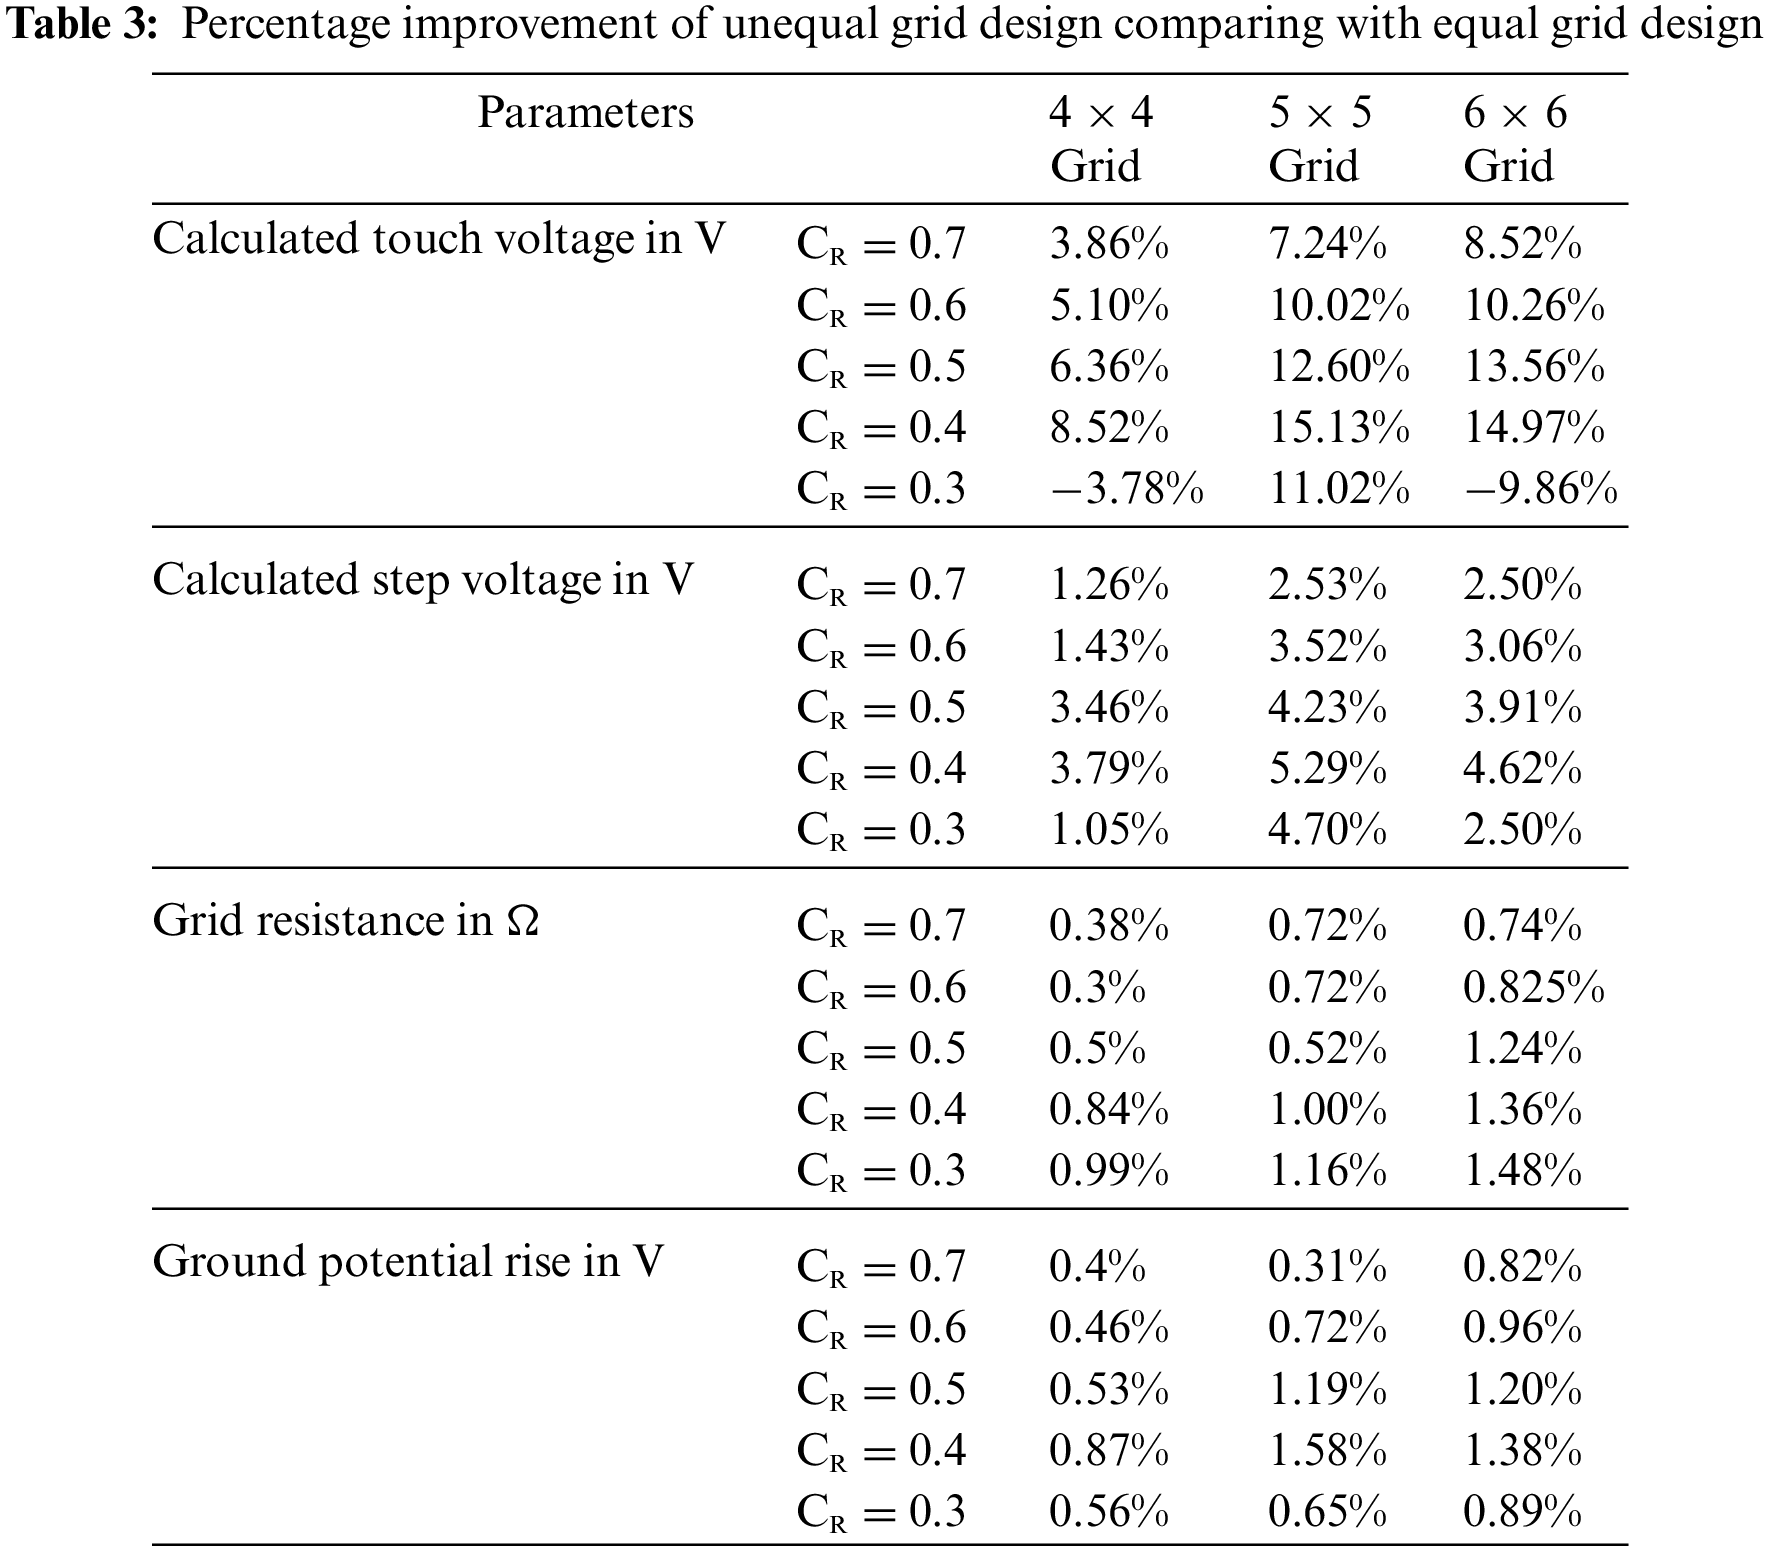
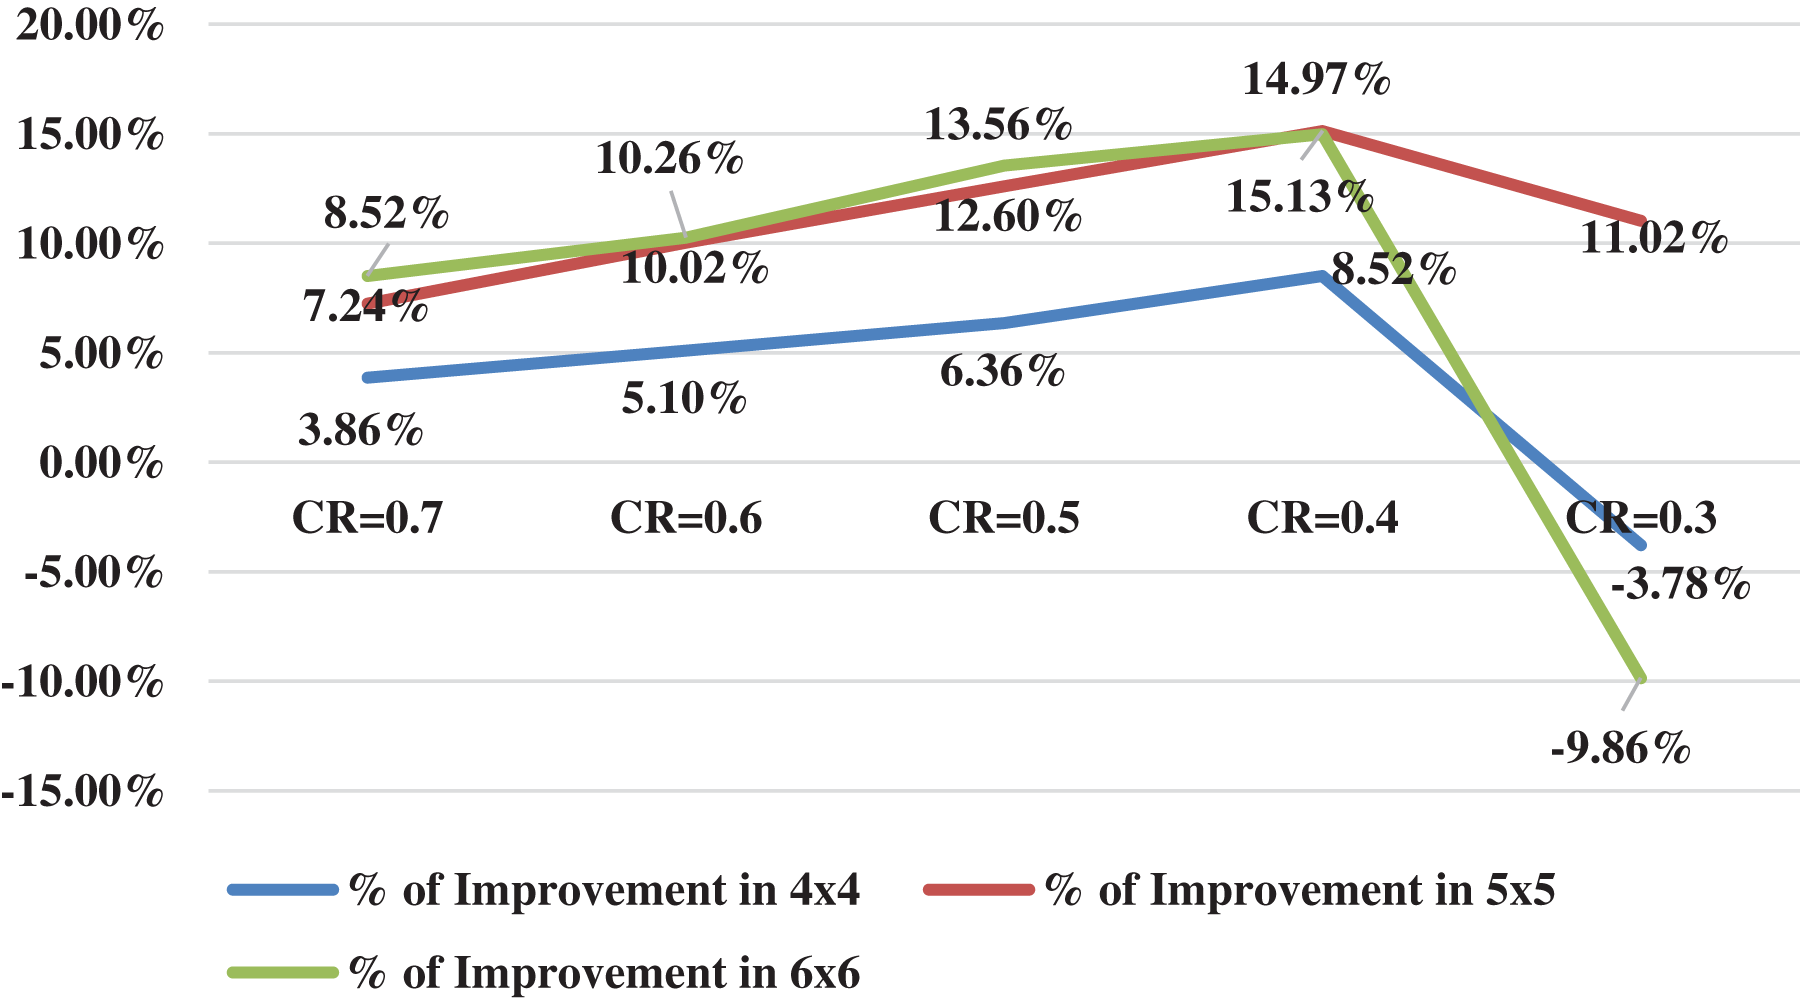
Figure 2: Touch voltage improvement at the different compression ratios for square grid
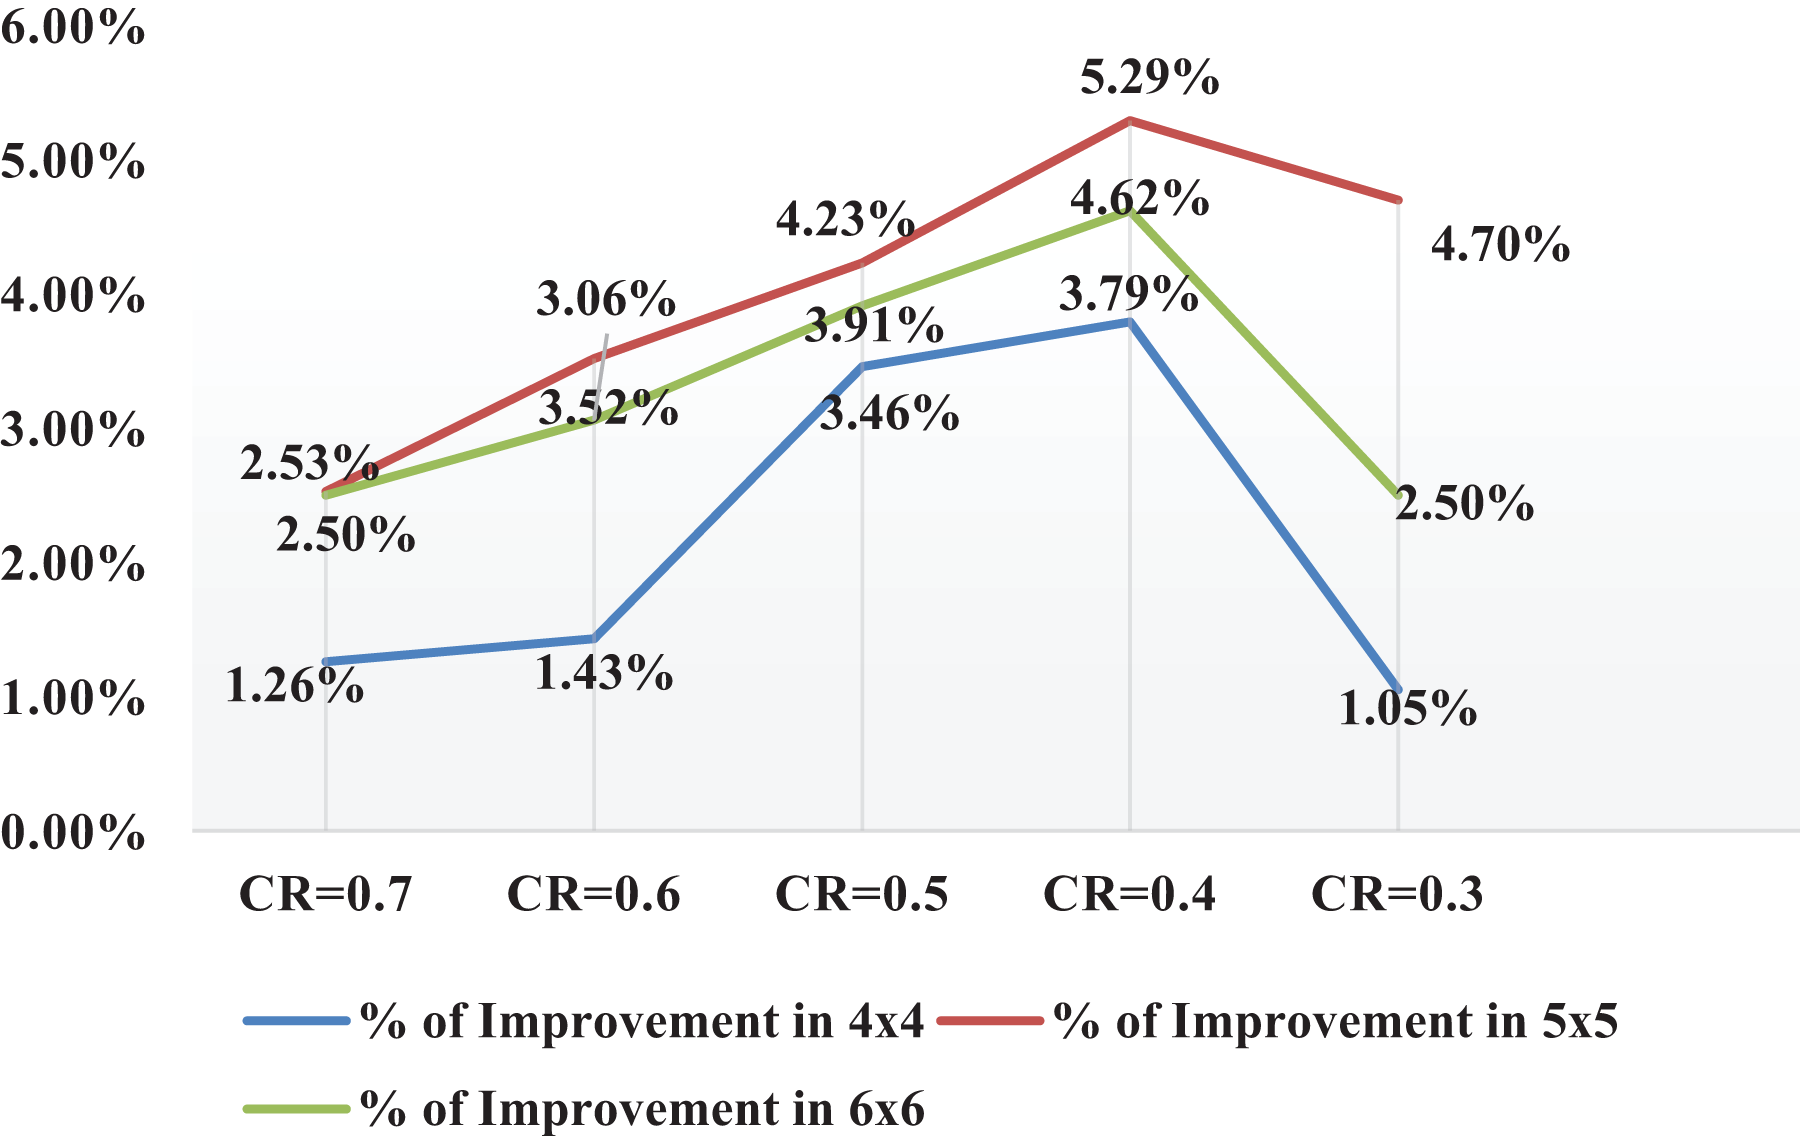
Figure 3: Step voltage improvement at different compression ratio for square grid
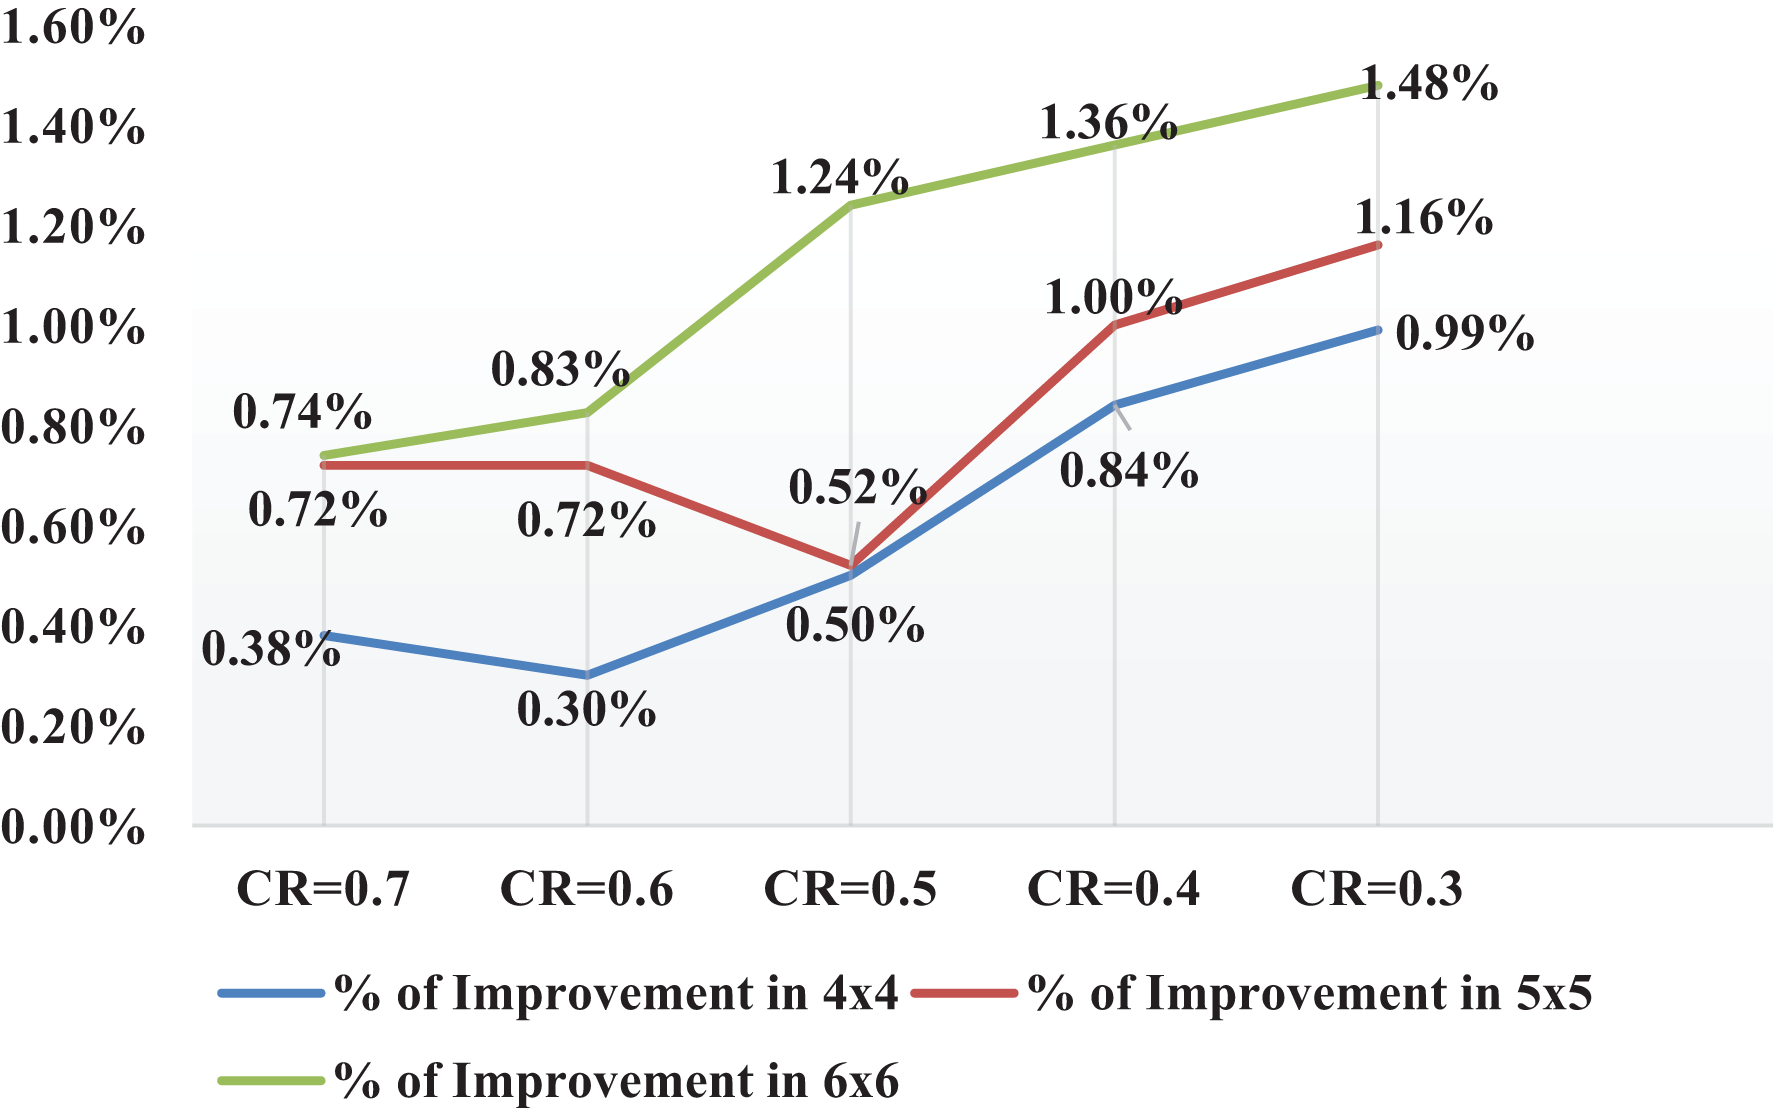
Figure 4: Grid resistance improvement at the different compression ratios for square grid
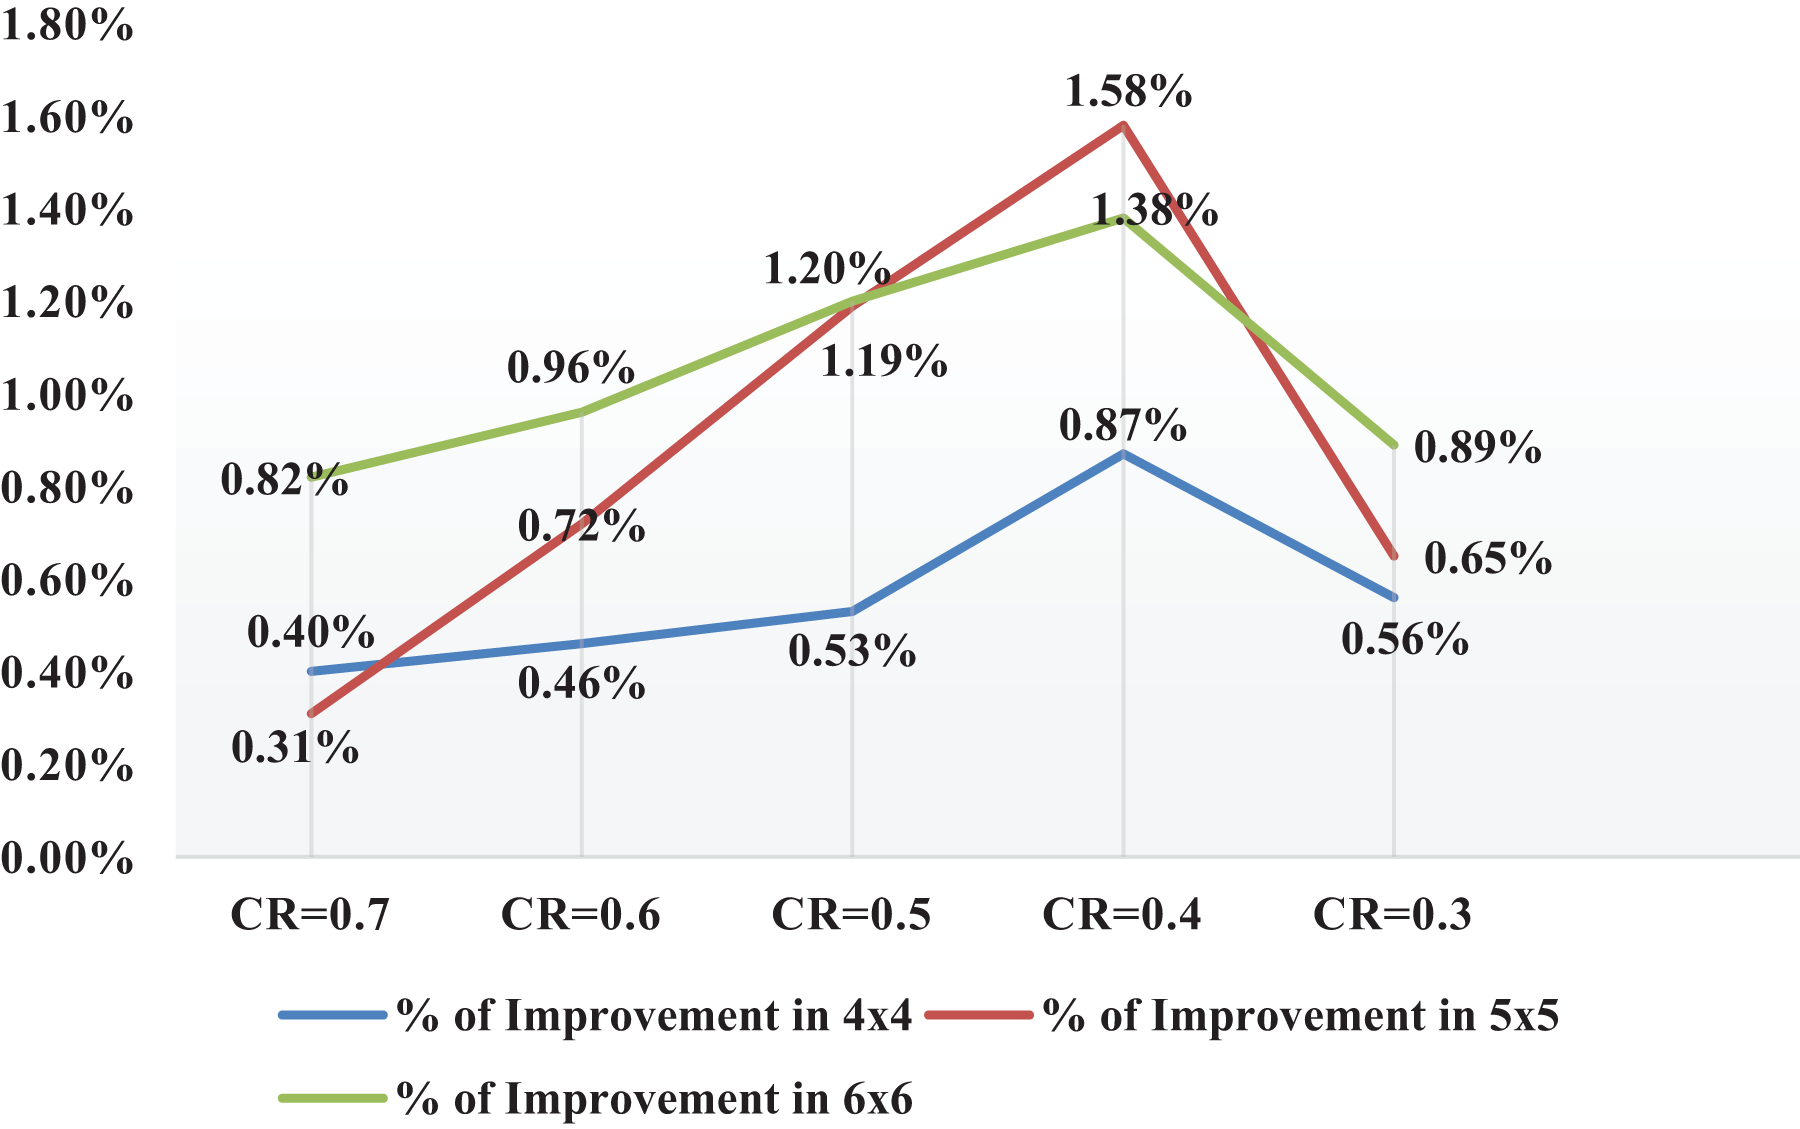
Figure 5: GPR improvement at different compression ratios for square grid
3.2 Comparative Analysis of Rectangular Gird Design
The considered area of the grid is 2400 m2 (60 m × 40 m) with three grid configurations of 6 × 4 (6 conductors along the horizontal axis and 4 conductors along the vertical axis of the grid), 7 × 5 (7 conductors along the horizontal axis and 5 conductors along the vertical axis of the grid), and 8 × 6 (8 conductors along the horizontal axis and 6 conductors along the vertical axis of the grid). For each configuration CR is changed from 0.3 to 0.7 in step of 0.1, and the simulated results are shown in Table 4. It can be observed from Table 4 that, optimal step voltage, GPR, touch voltage and grid resistance are decreasing with an increase in the number of conductors along horizontal and vertical axis. Percentage improvement of an unequal gird design comparing with equal grid design is shown in Table 5. Grounding grid solution is not feasible for CR less than 0.4, hence these solutions are discarded. Unequal grid design from CR = 0.4 to CR = 0.7 gave a better result compared to equal grid configuration. Graph of percentage of improvement of touch voltage, step voltage, grid resistance and GPR with variation in compression ratio is as revealed in Figs. 6−9, respectively.
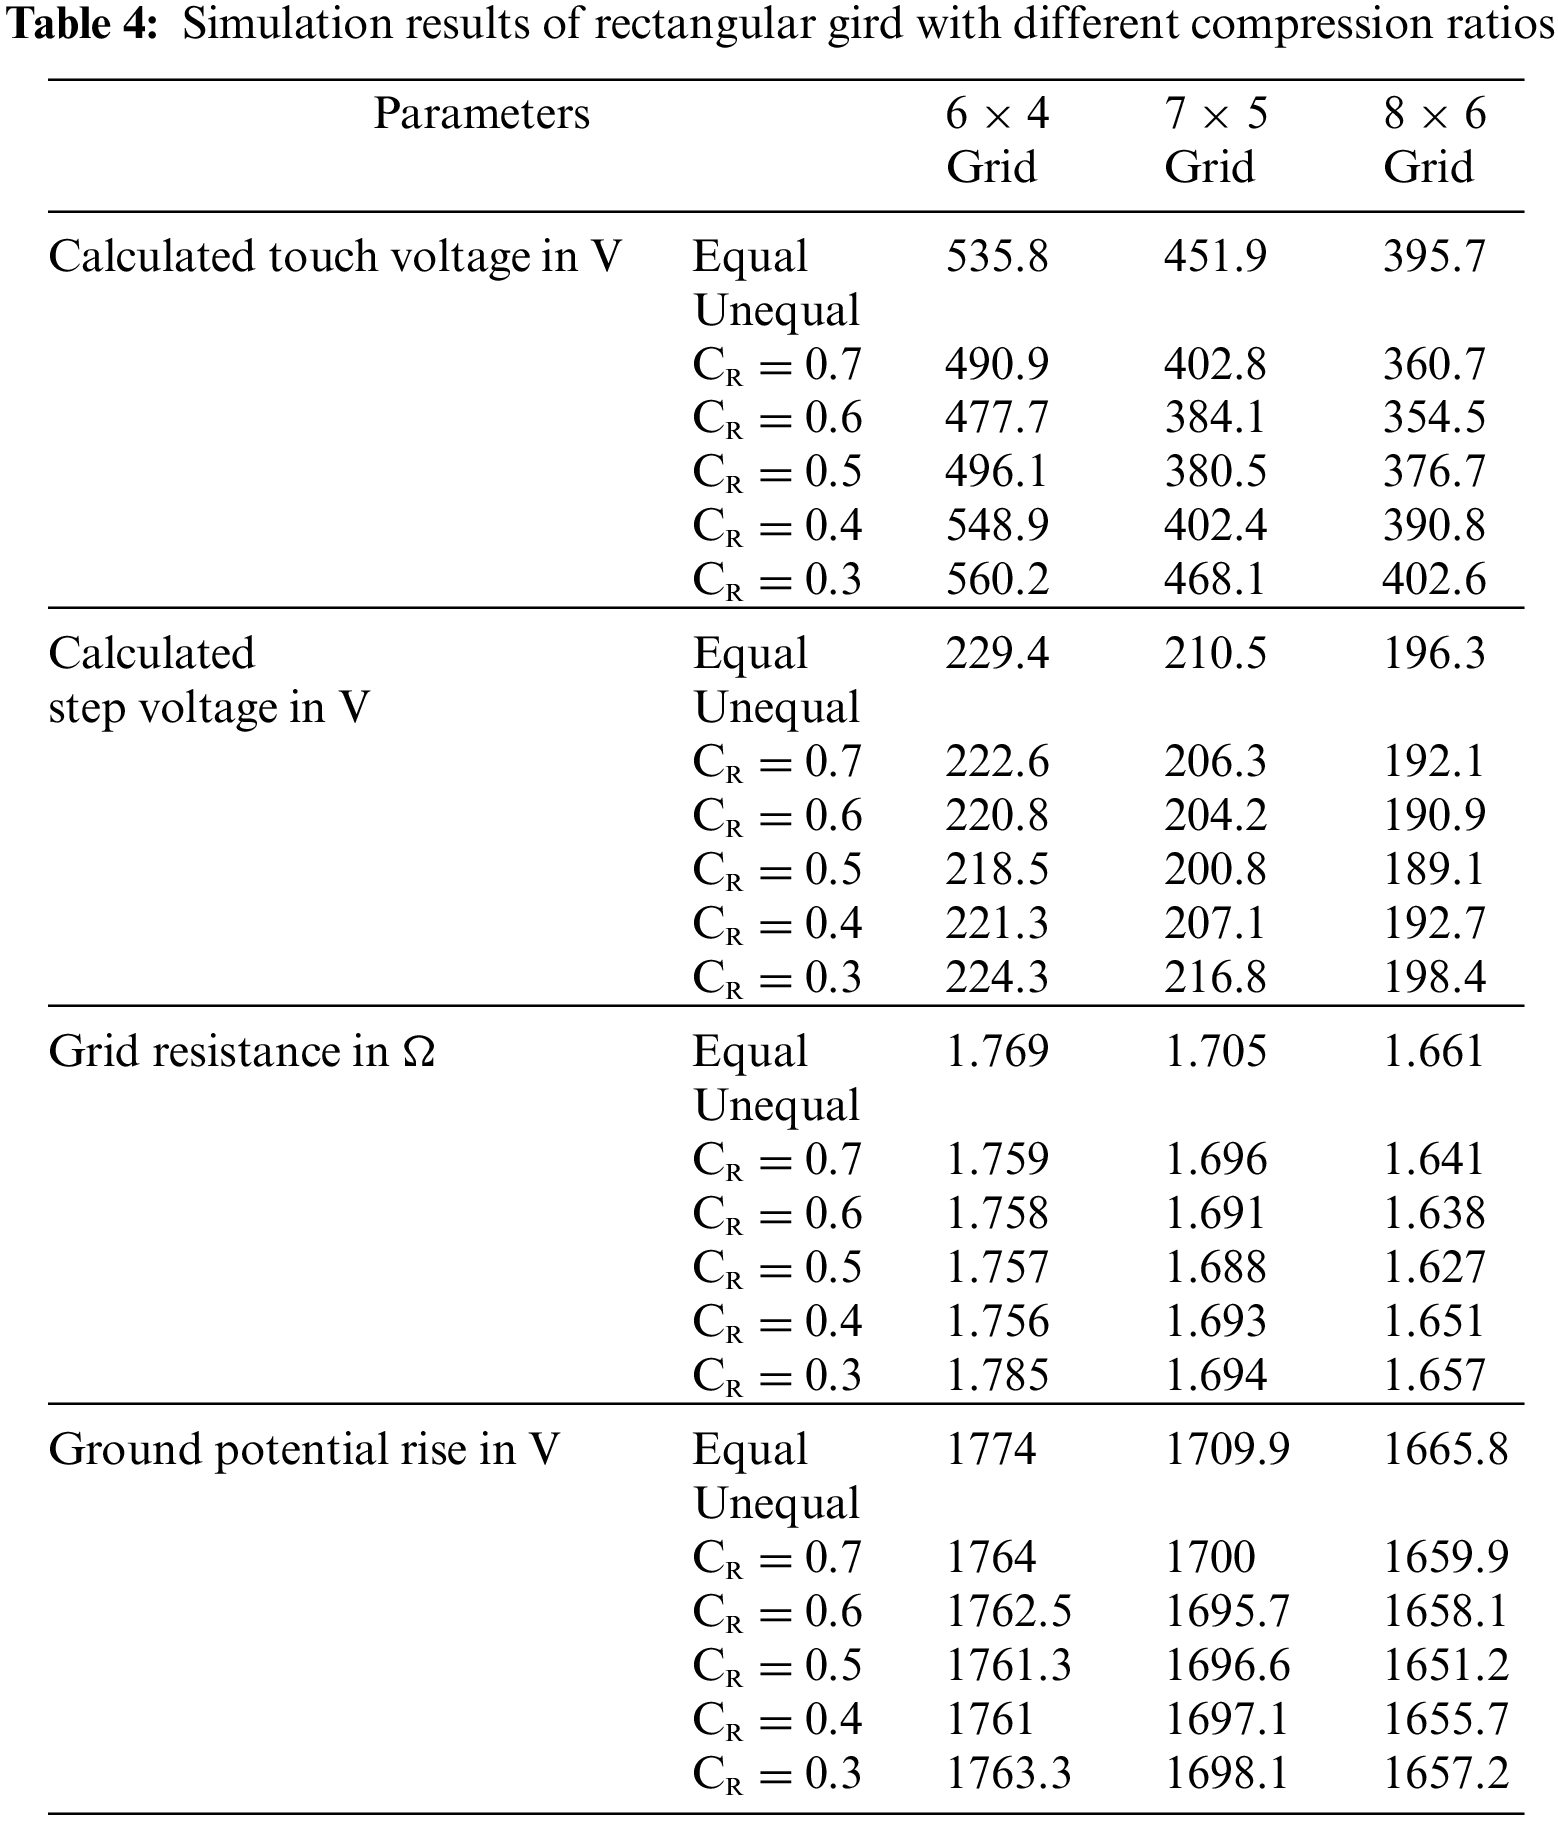
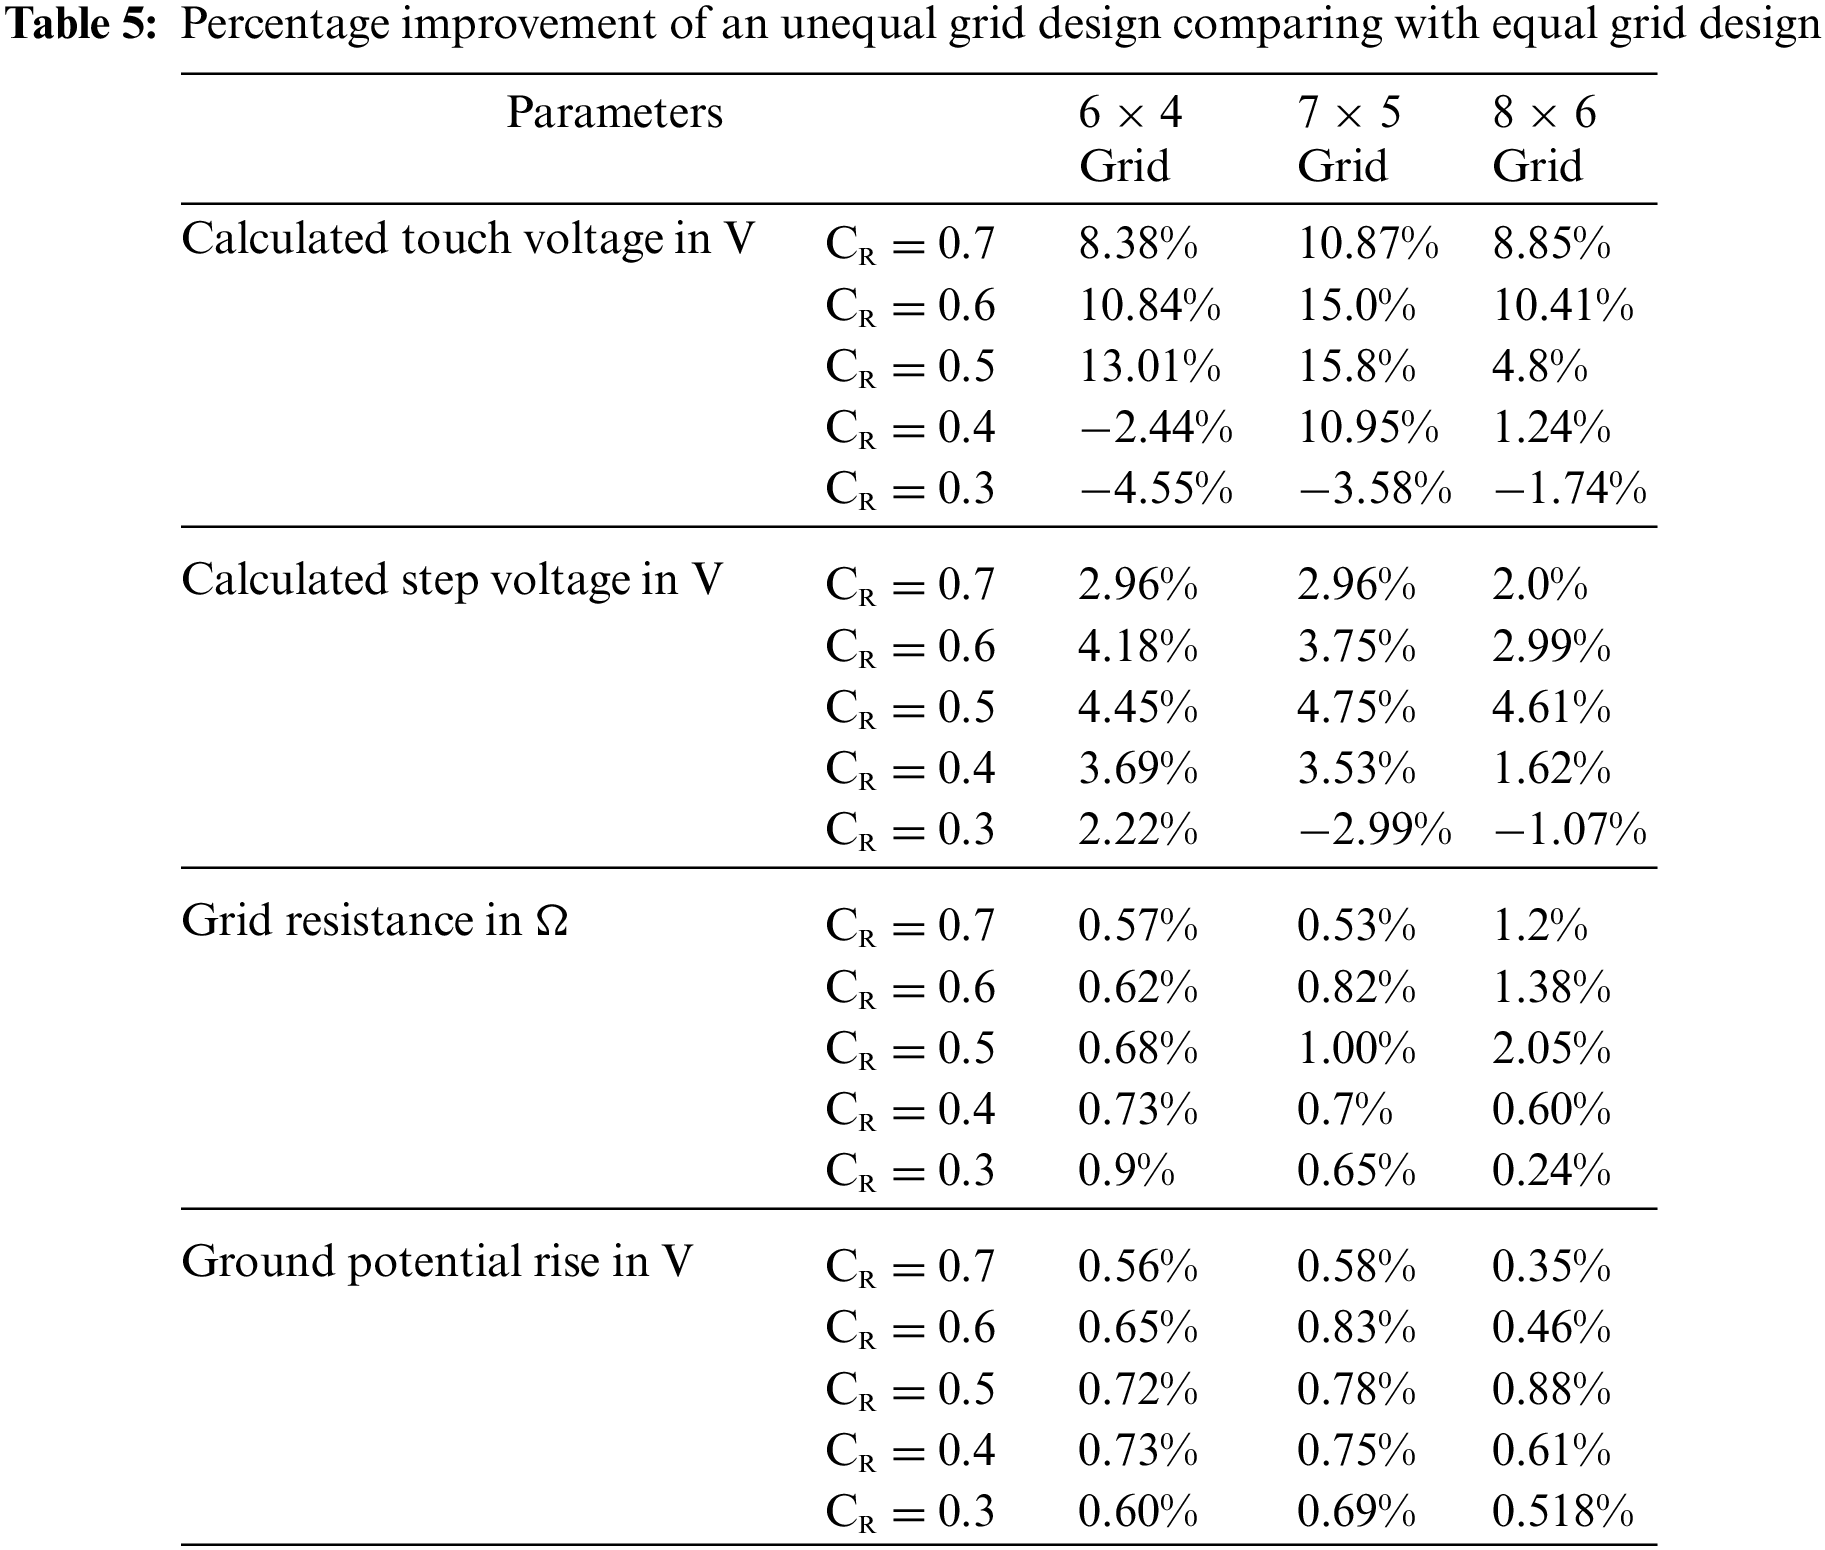
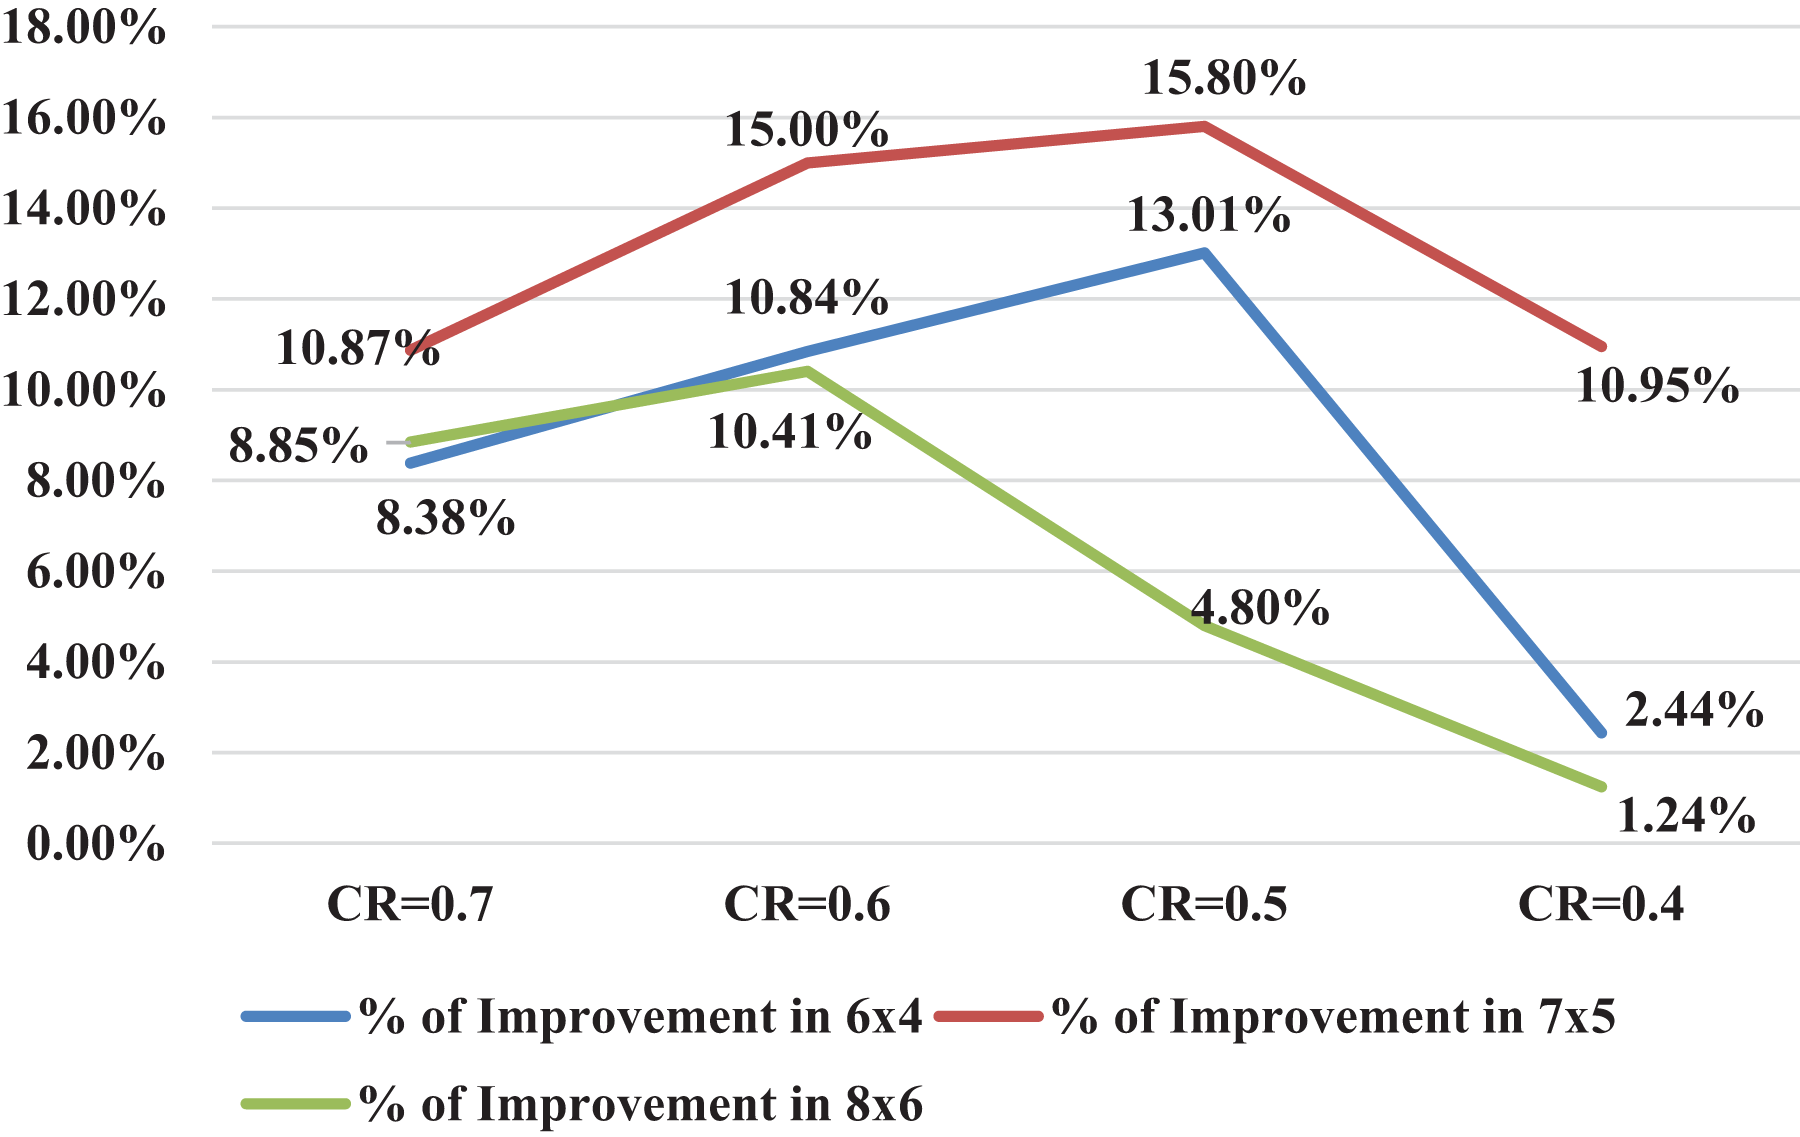
Figure 6: Touch voltage improvement at the different compression ratios for rectangular grid
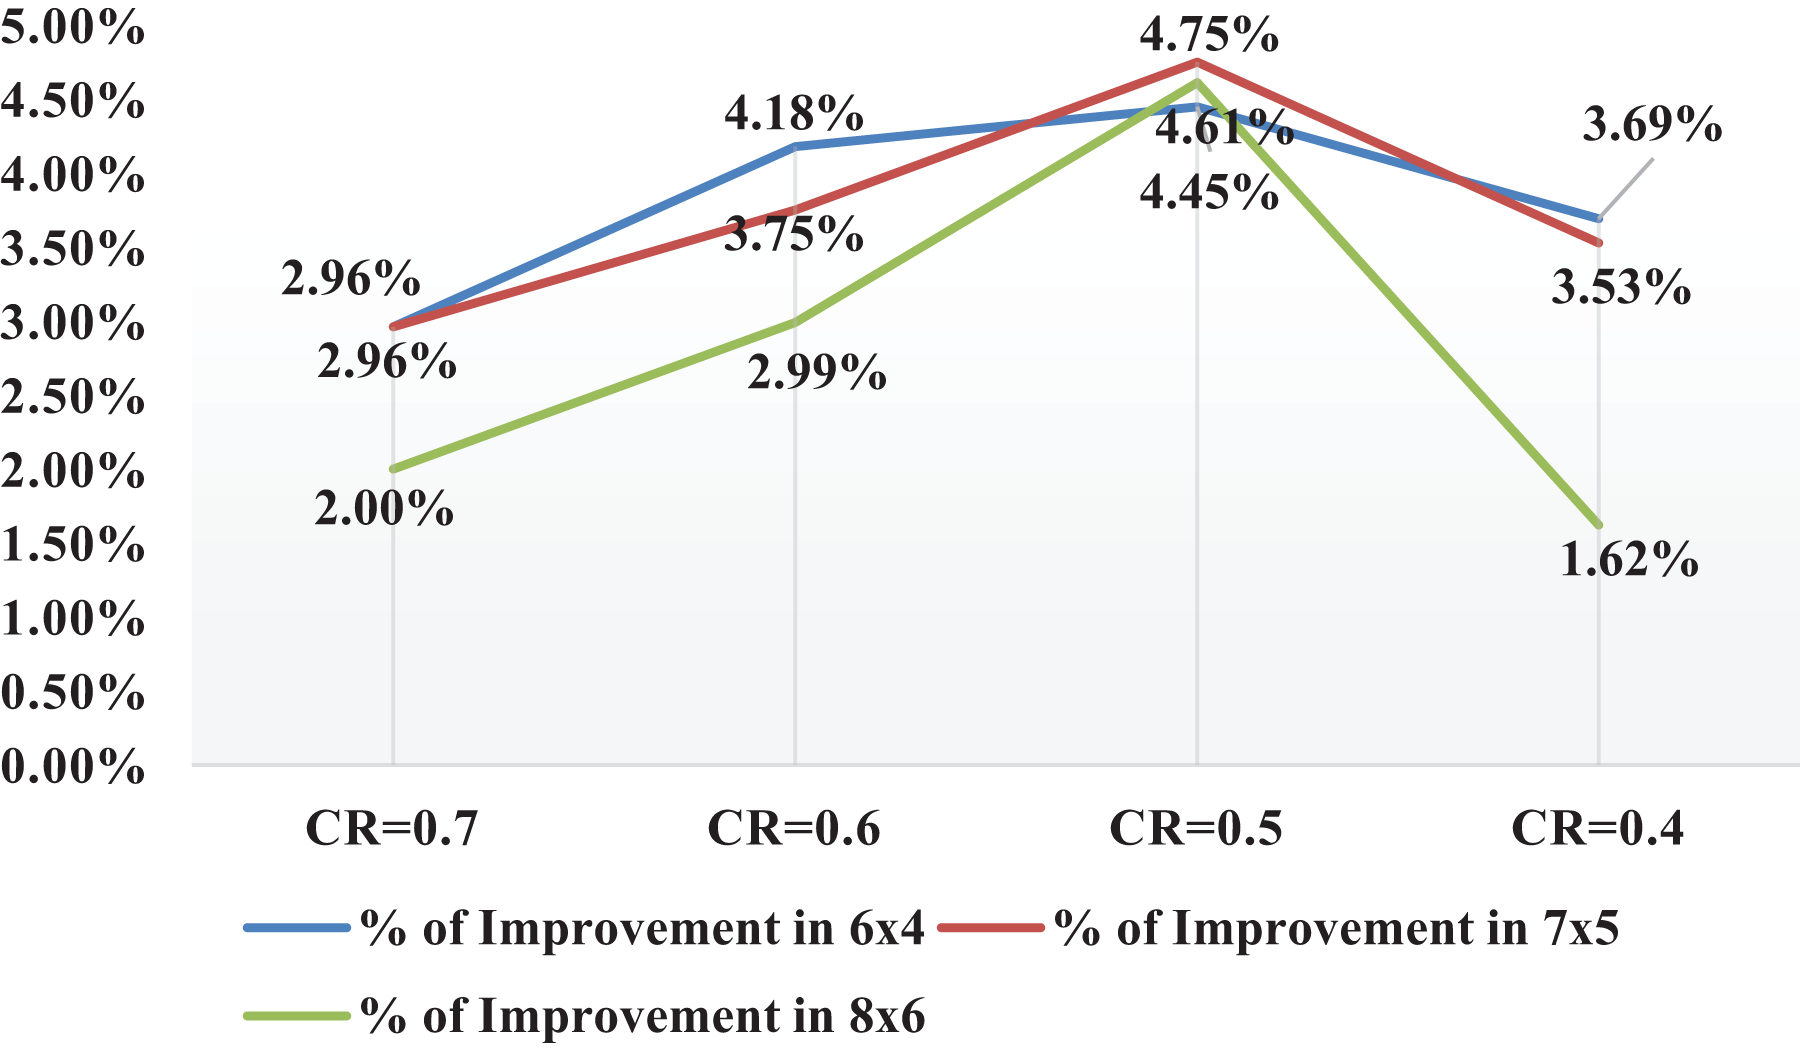
Figure 7: Step voltage improvement at different compression ratio for rectangular grid
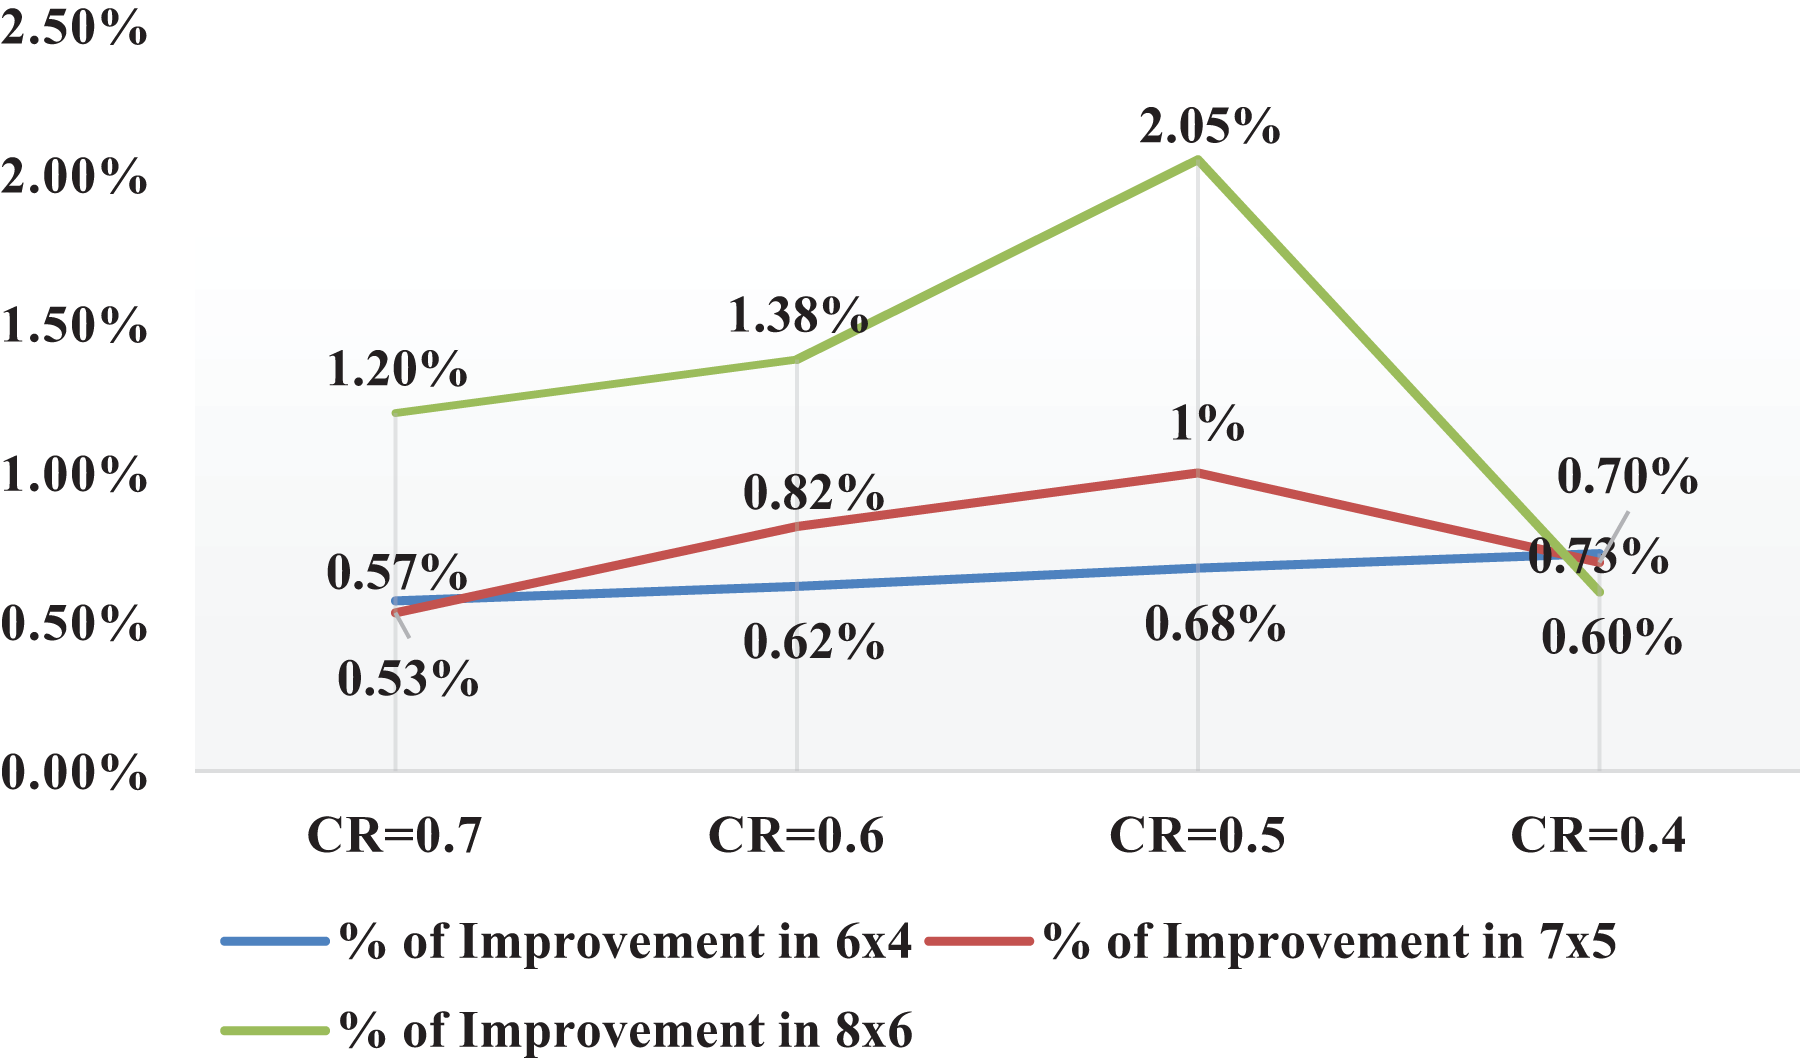
Figure 8: Grid resistance improvement at the different compression ratios for rectangular grid
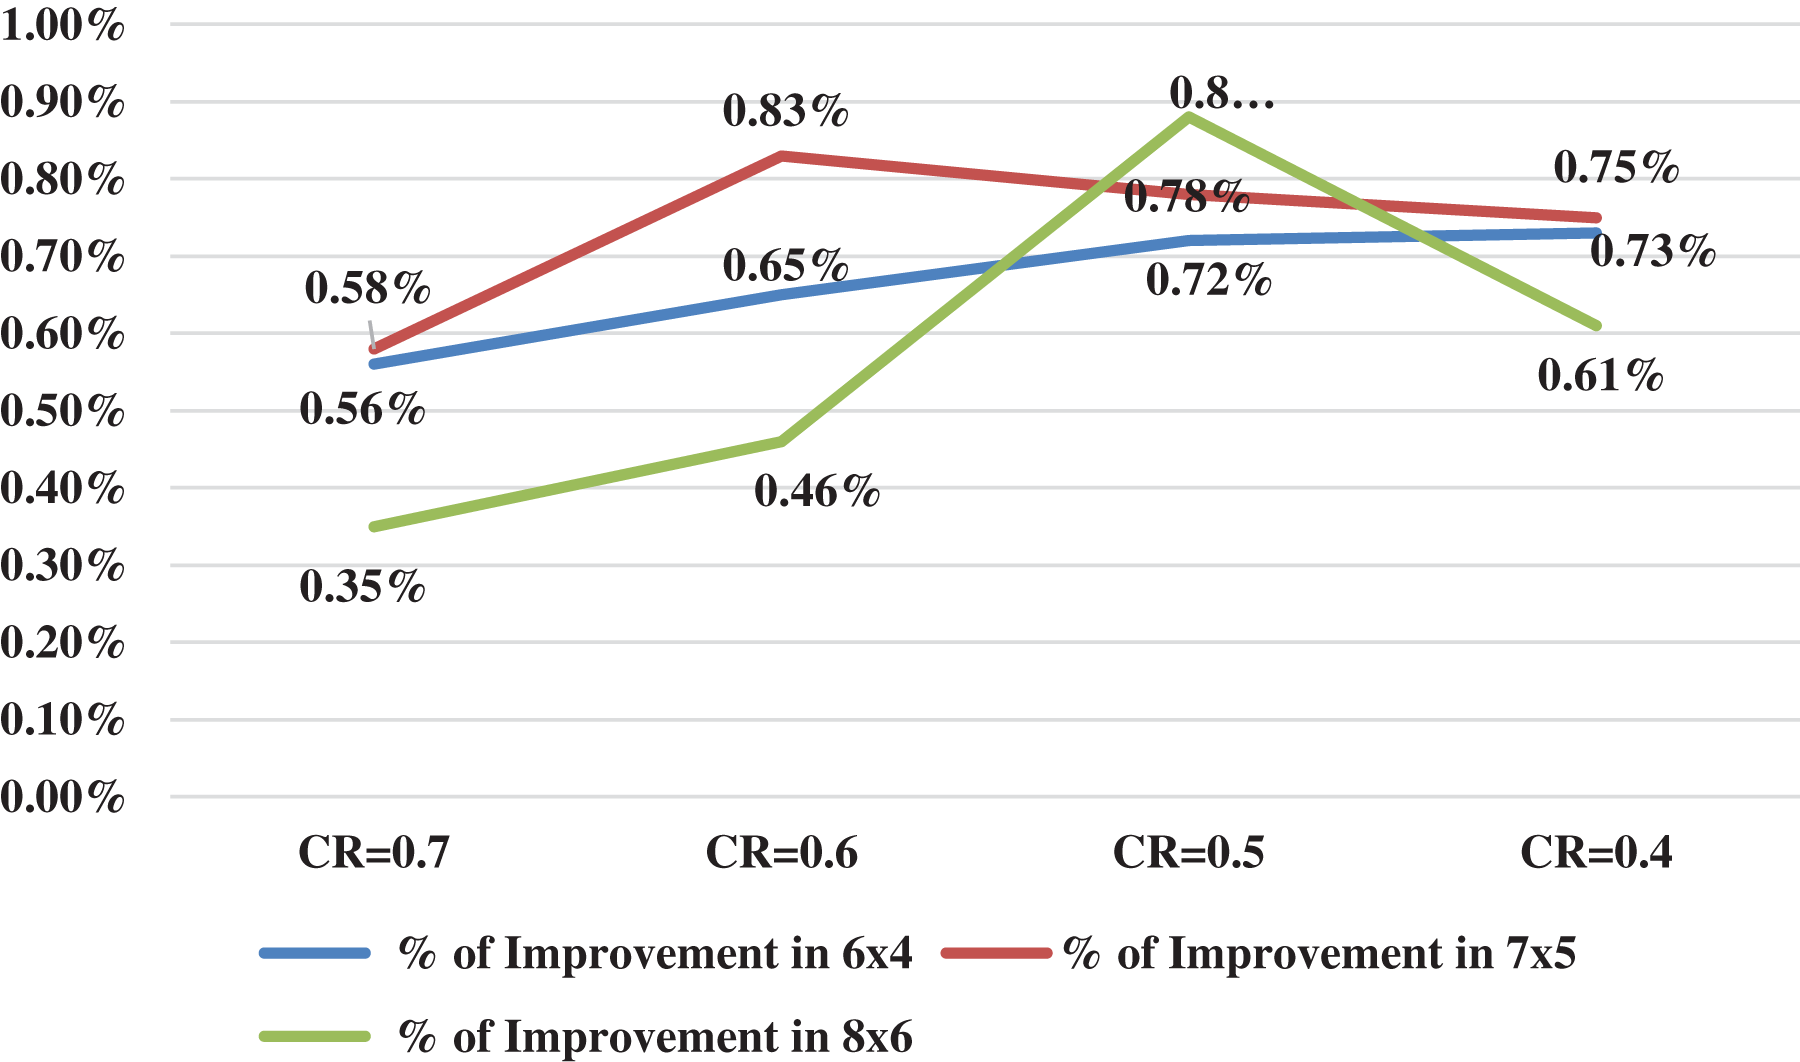
Figure 9: GPR improvement at different compression ratio for rectangular grid
4 Comparative Analysis by Least-Square Curve Fitting Technique
Let n1 and n2 are the numbers of conductors parallel to the x-axis and y-axis, respectively. L1 and L2 are the lengths of horizontal and vertical grid conductors; k1 and k2 are conductor spacing along the x-axis and y-axis, respectively. If there are k numbers of conductor segments, the length of the ith segment is Lik given by
Based on the least square curve fitting method Sik is given by
where,
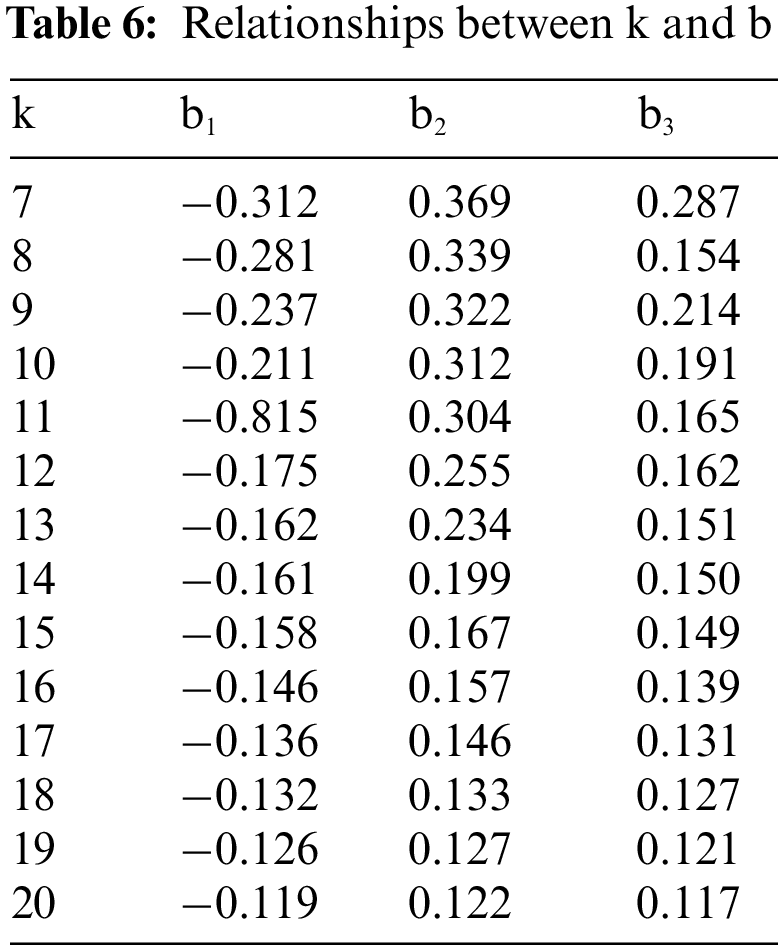
where k is the number of grounding grid meshes. Relationship between k and b [7] is as shown in Table 6.
Percentage of grid conductors saved using unequal spacing can be determined using the given formula as follows [7]:
coefficient of α and β varies with the total number of grid conductors used in an equal grid configuration. The coefficient of α and β can be determined using Eqs. (8) to (11).
The number of grid conductors along x-direction in unequal grid configuration is given by
The number of grid conductors along y-direction in unequal grid configuration is given by
Total number of grid conductors on both the direction
4.1 Comparative Analysis of Square Grid Design
The considered are of the square grounding gird is 3200 m2 (57 m × 57 m approximate), upper soil resistivity 2500 Ω-m, lower soil resistivity 200 Ω-m, fault current is 3 kA. The optimal solution for equal grounding grid for this data is: number of grid conductors along the x-direction is 16, number of grid conductors along the y-direction is 16, tolerable touch voltage is 880 V, tolerable step voltage is 2854 V, calculated touch voltage is 868.6 V, calculated step voltage is 462.5 V, the ground potential rise is 4403.7 V and grid resistance is 1.569 Ω. For this optimal solution when the least-square curve fitting technique was implemented, it resulted in a reduction of grid conductors along the x-direction and y-direction as 11 for unequal grid configuration. The corresponding calculated touch voltage is 851.7 which is less than tolerable touch voltage 880 V, calculated step voltage is 505 V which is also less than tolerable step voltage 2854 V, ground potential rise 4473.3 V and grid resistance is 1.593 Ω. Hence the solution is feasible with a reduction of grounding grid conductors, hence the reduction in total cost. Unequal conductor spacing by least-square curve fitting technique is given in Table 7 and Fig. 10 shows the unequal grid configuration. Figs. 11–13 are profiles of step voltage, touch voltage, and potential rise respectively.
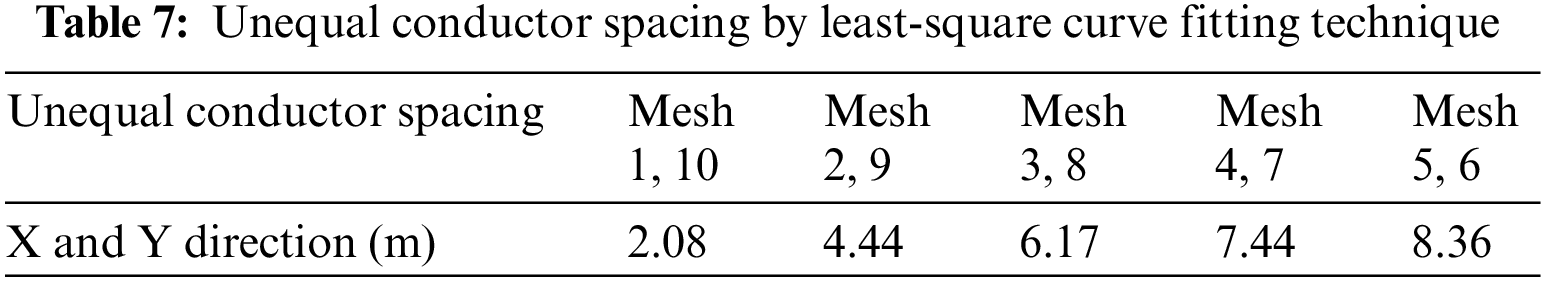
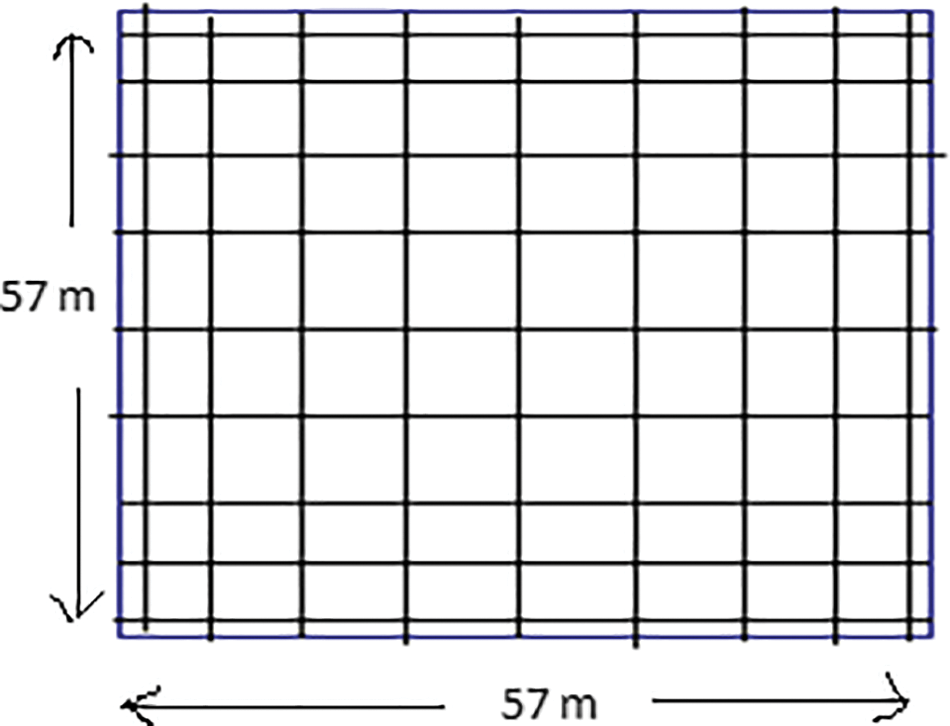
Figure 10: Unequal spacing in square grid configuration
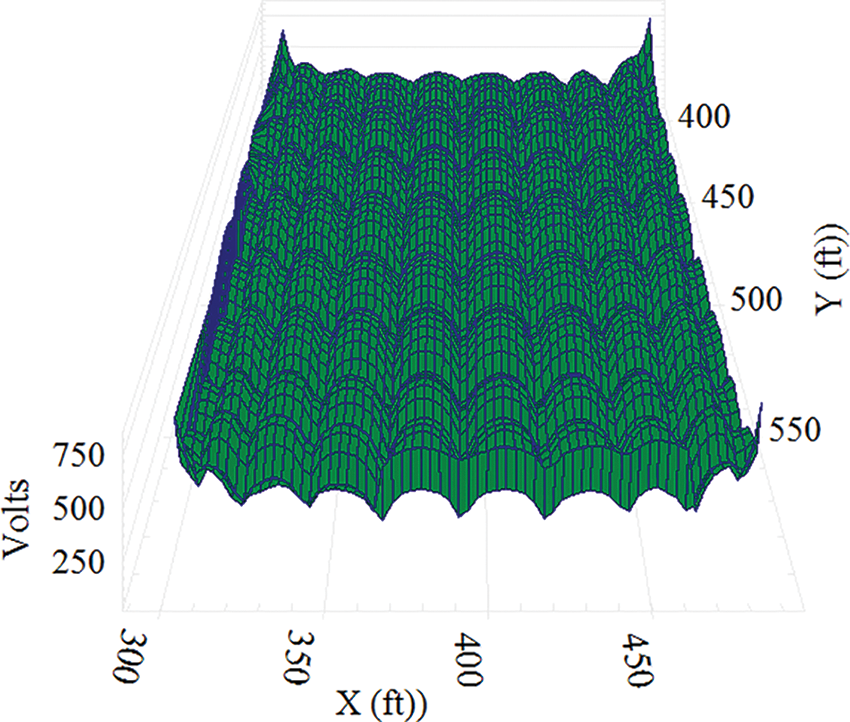
Figure 11: Touch voltage profile
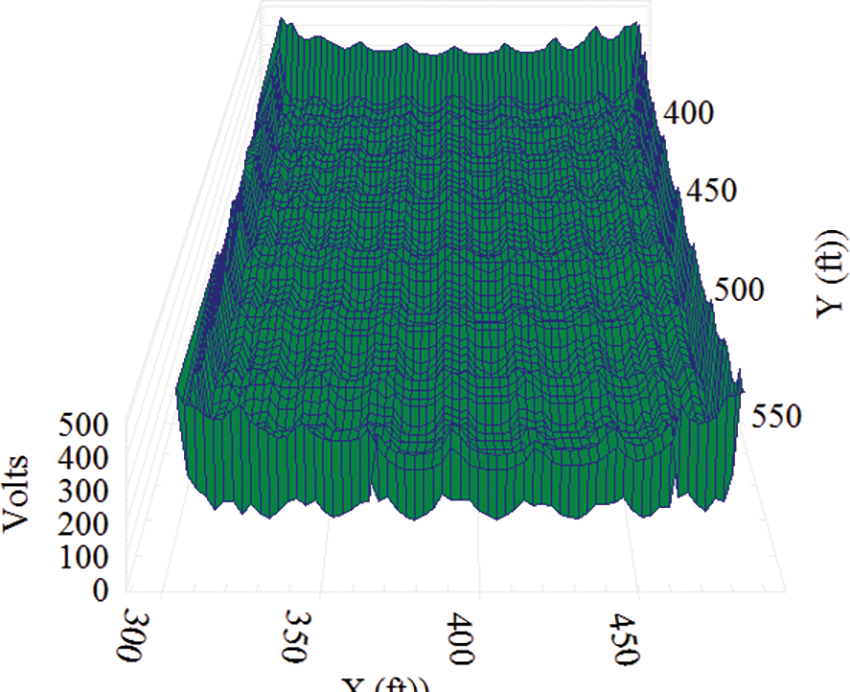
Figure 12: Step voltage profile
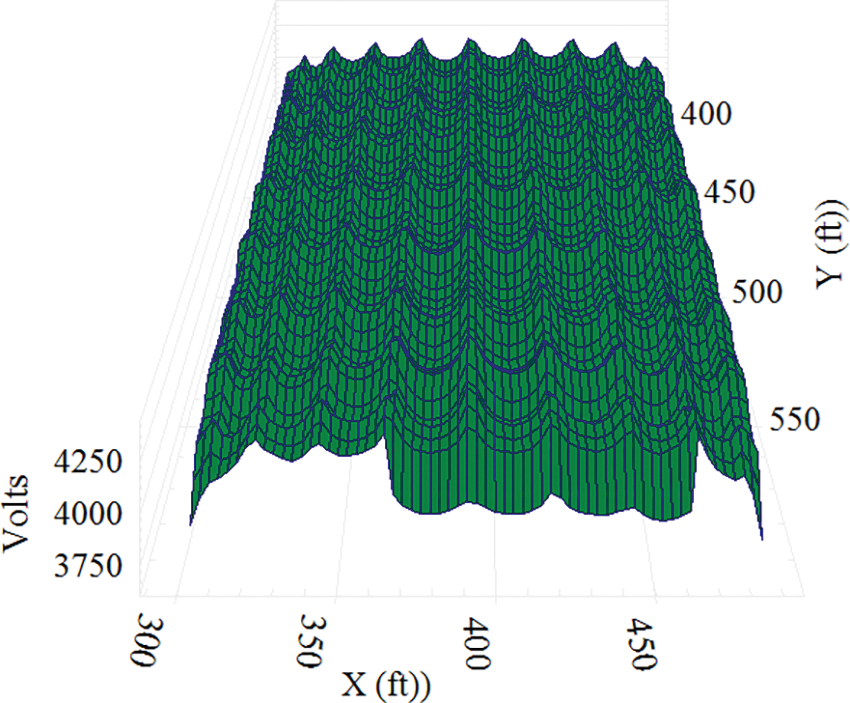
Figure 13: Absolute potential profile
4.2 Comparative Analysis of Rectangular Grid Design
Consider rectangular grounding gird of area 3200 m2 (80 m × 40 m), upper soil resistivity 2500 Ω-m, lower soil resistivity 200 Ω-m. Fault current is taken as 3 kA. The optimal solution for equal grounding grid for this data is: number of grid conductors along the x-direction is 14, number of grid conductors along the y-direction is 20, tolerable touch voltage is 880 V, tolerable step voltage is 2854 V, calculated touch voltage is 847.3 V, calculated step voltage is 460.3 V, the ground potential rise is 4322.8 V and grid resistance is 1.54 Ω. With the least-square curve fitting technique the number of grid conductors along the x-direction is 8 and y-direction is 12 for unequal grid configuration. The corresponding calculated touch voltage is 879.2 V which is less than tolerable touch voltage 880 V, calculated step voltage is 496 V which is also less than tolerable step voltage 2854 V, ground potential rise 4451 V and grid resistance is 1.586 Ω. Hence the solution is feasible with a reduction in grounding grid conductors in both the directions, hence the reduction in total cost. Unequal conductor spacing by least-square curve fitting technique is given in Table 8. Unequal grid configuration for rectangular (80 m × 40 m) grid is shown in Figs. 14. Figs. 15–17 are voltage profiles of step voltage, touch voltage, and potential rise correspondingly.
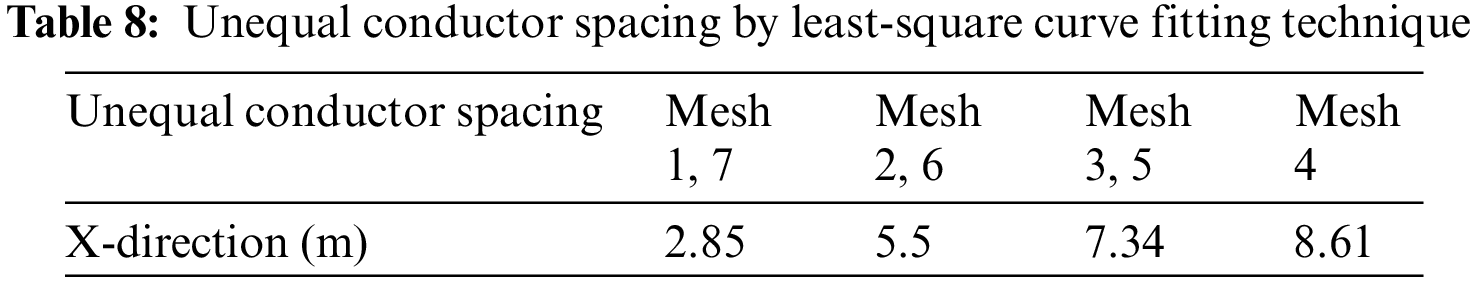
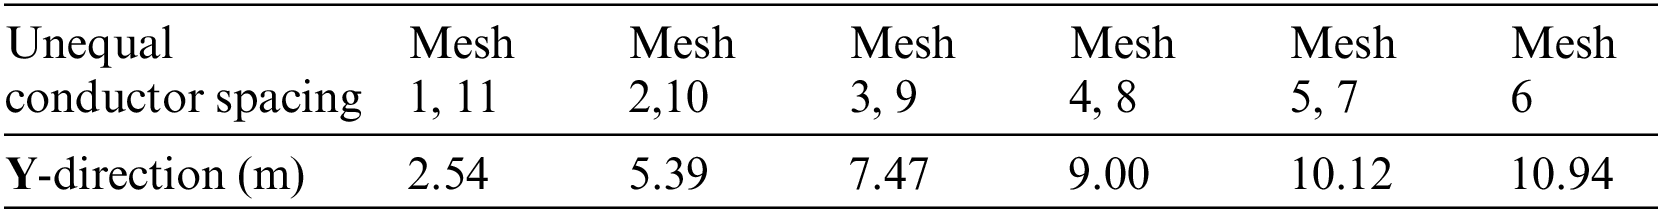
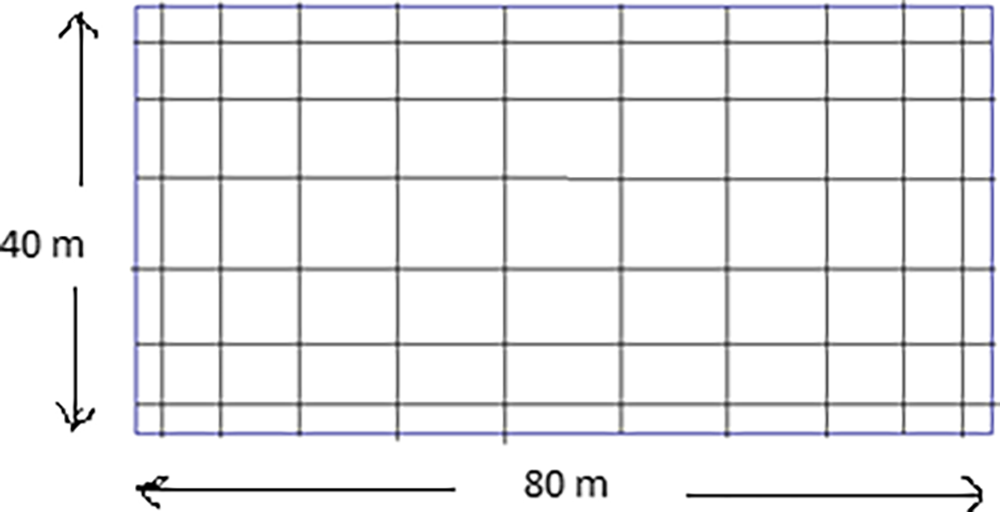
Figure 14: Unequal spacing in a rectangular grid configuration
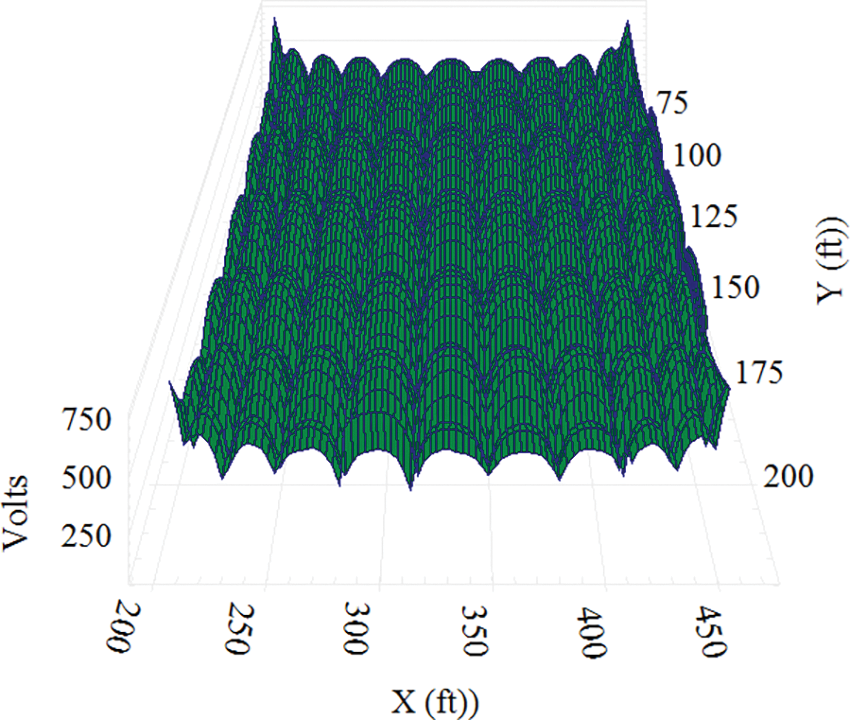
Figure 15: Touch voltage profile
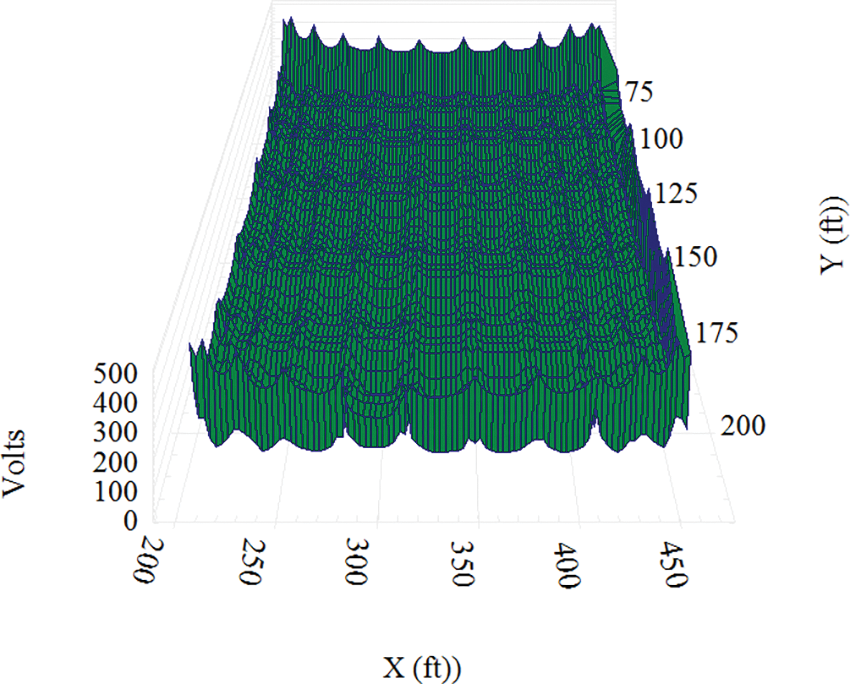
Figure 16: Step voltage profile
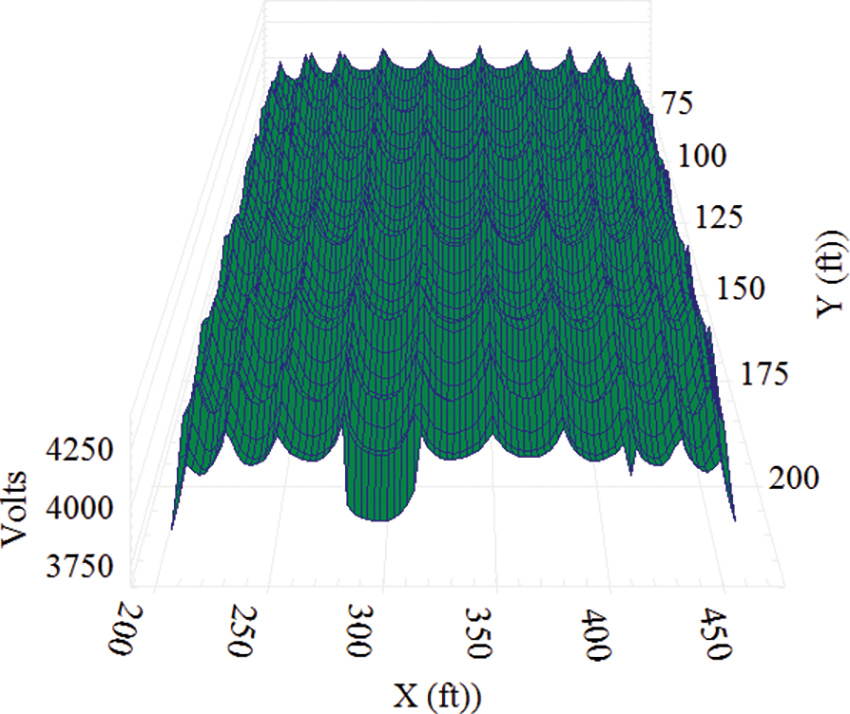
Figure 17: Absolute potential profile
5 Comparative Analysis of Square and Rectangular Grid Configuration
Comparative analysis is carried out between square and rectangular grid configuration with the same cross-sectional area of the grid, soil data, fault current, duration of the fault, depth of the burial for both equal and unequal conductor spacing, and the results are tabulated in Tables 9 and 10.
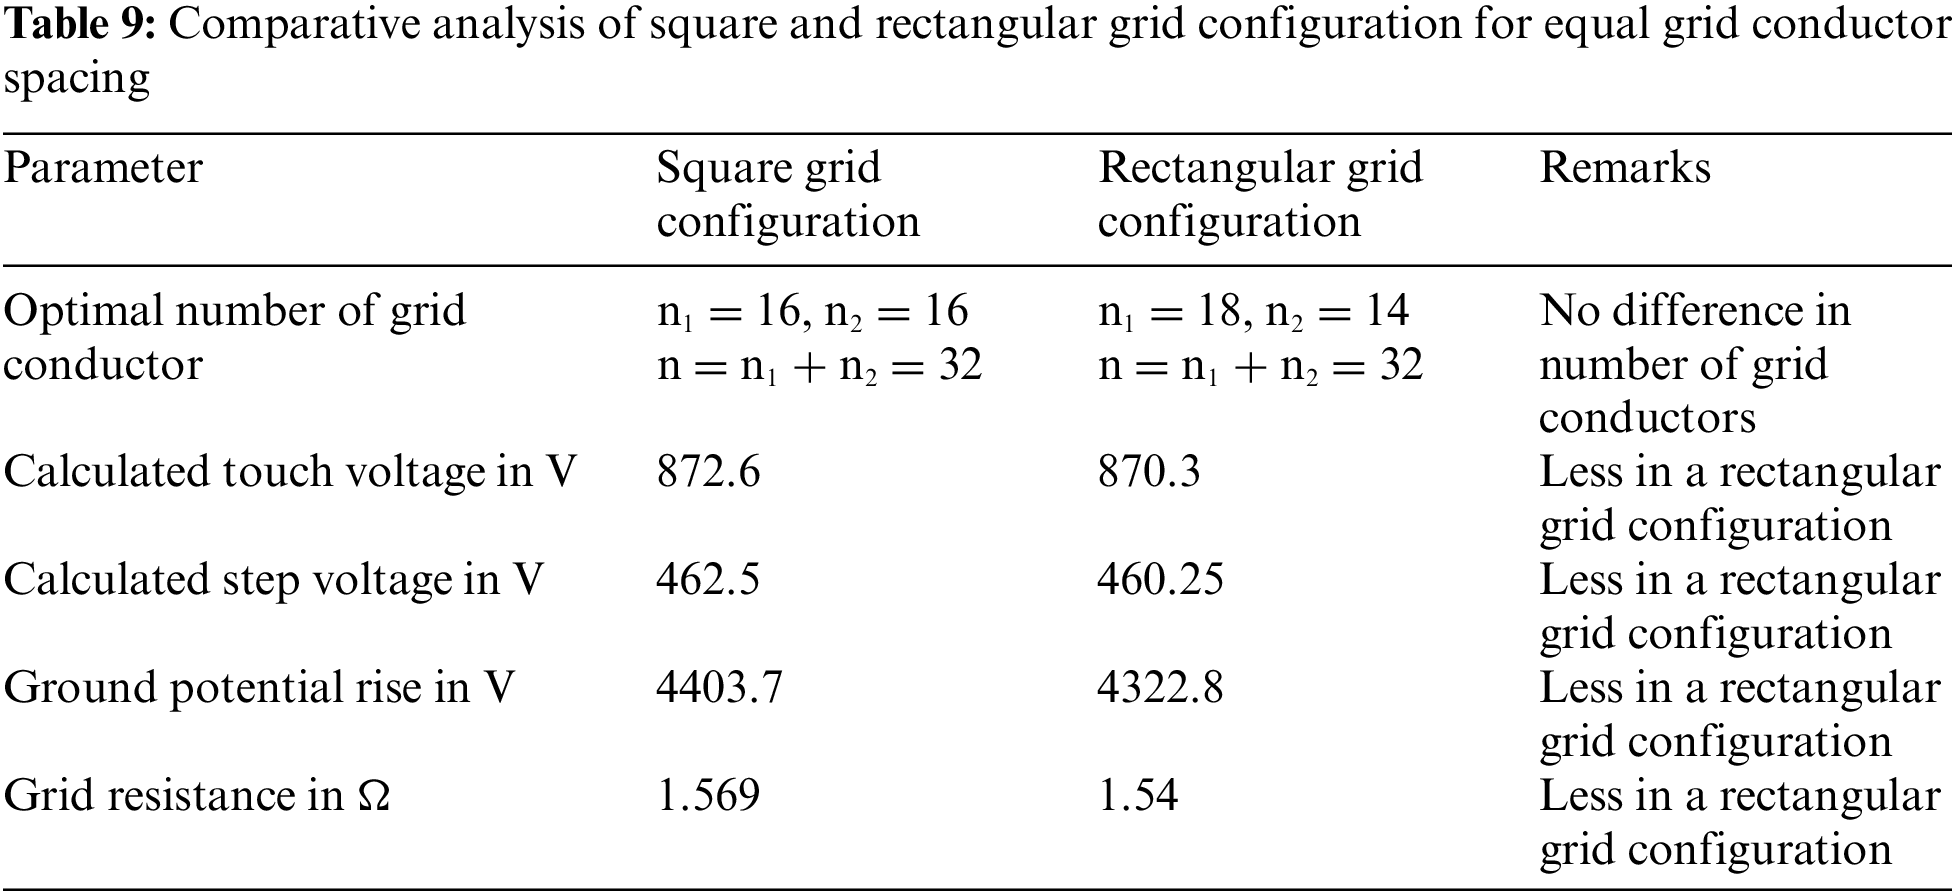
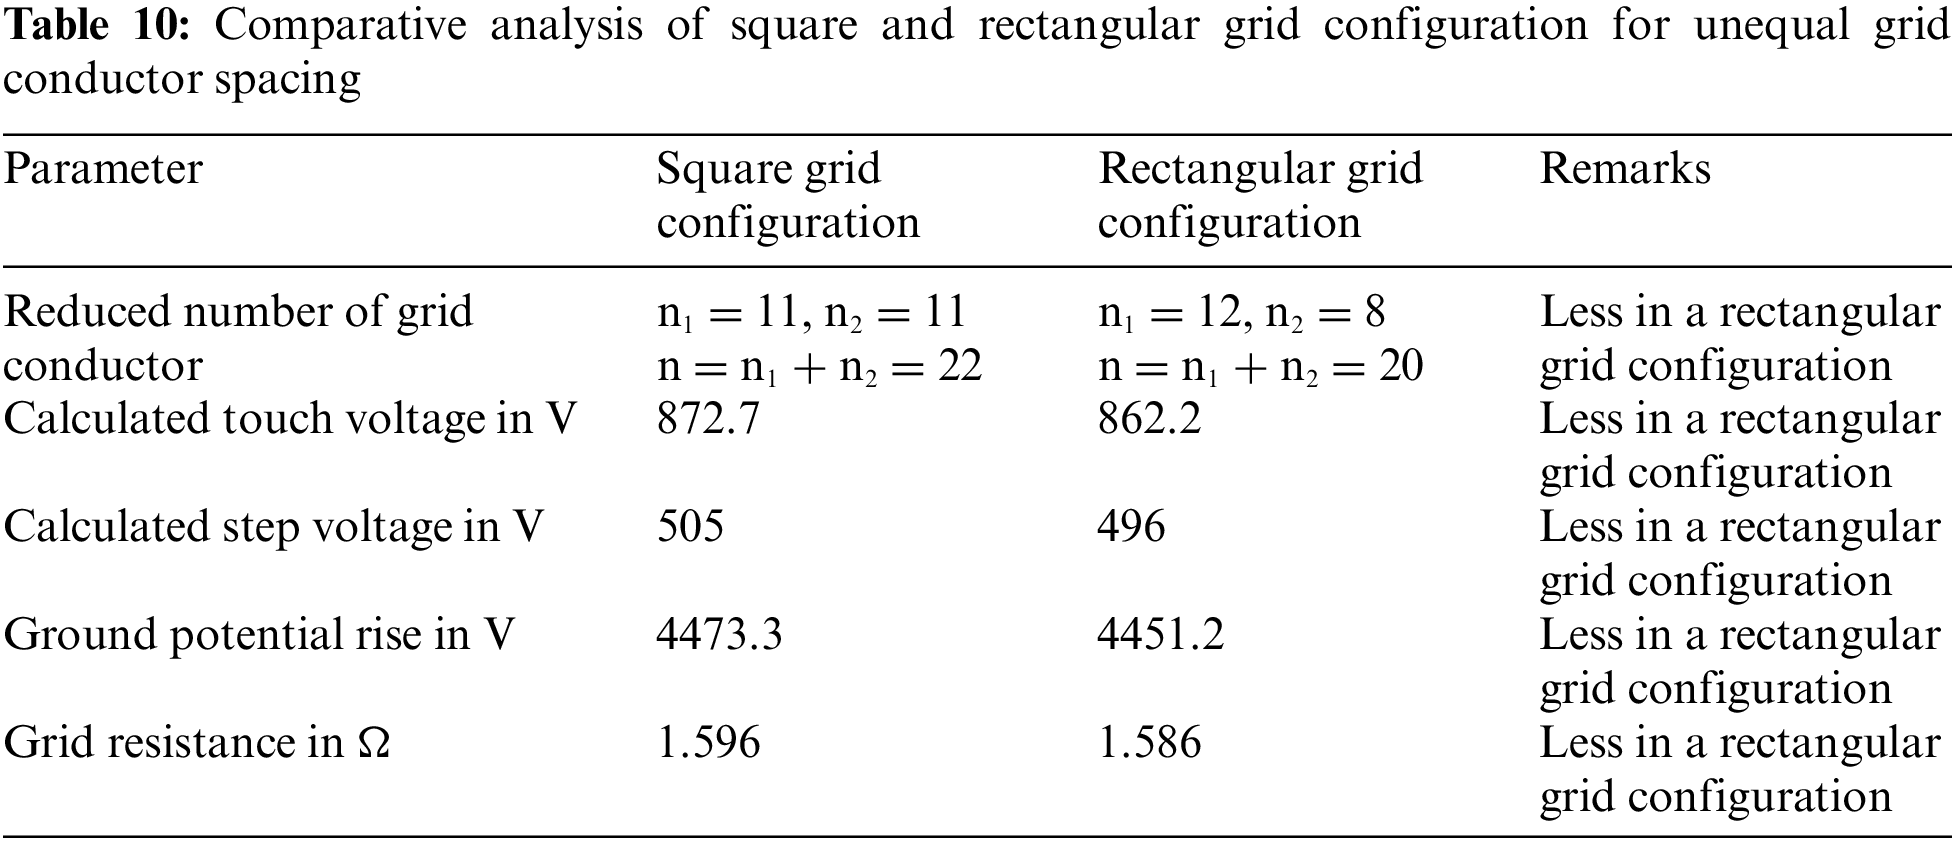
There is no difference in the total number of optimal grid conductors used in square and rectangular grid configuration but comparing with all other parameters rectangular grid results are better compared to square grid hence it can be concluded that rectangular gird configurations are better compared to square grid configuration for both equal and unequal grid conductor spacing.
6 Comparison and Discussions between Two Novel Techniques
To create unequal grid configurations two novel techniques such as Optimal Compression Ratio (OCR) technique and Least Square Curve Fitting Techniques are adopted. Least square curve fitting technique results in only one feasible solution but this technique reduces the number of grid conductors by 35% to 45% keeping the touch and step voltage with in the tolerable value. OCR techniques results in many feasible solutions by varying CR between 0 to 1. It is clearly shown in Table 2, if CR value is between 0.7 to 0.4 then only it is feasible to prefer unequal grid configuration compared to equal grid configuration. This means, not all the unequal grid configurations resulted are better than equal grid configuration.
In this paper two novel techniques: the least-square curve fitting and the compression ratio techniques are used in designing unequal grid configurations. Optimal solutions for equal grid configuration such as number of parallel conductor along x-direction and y-direction of the grid, tolerable touch voltage, tolerable step voltage, calculated touch voltage, calculated step voltage, ground potential rise, grid resistance are obtained by Particle Swarm Optimization algorithm using MATLAB software program developed.
Comparative analysis between the grounding grids with equal and unequal grid configurations are carried out for both square and rectangular gird. From this comparison it can be concluded that, a grounding grid with unequal grid configuration is better than a grounding grid with equal grid configuration, as there is a reduction in touch voltage by 3% to 10%. Step voltages are not much influenced on change in conductor spacing. It is also observed that in the least-square curve fitting technique, there is a reduction in grid conductors by 35% to 40% comparing with equal grid configuration for same input parameters and hence reduction in the cost. From the comparative analysis carried out between the square and rectangular grid configurations, it can be concluded that rectangular grid configurations are better than square grid configurations.
Funding Statement: The authors received no specific funding for this study.
Conflicts of Interest: The authors declare that they have no conflicts of interest to report regarding the present study.
References
1. ANSI/IEEE Std, 80-2000 (2000). Guide for safety in AC substation grounding. New York: IEEE. [Google Scholar]
2. Gouda, O. E., Eldein, A. Z. (2017). Ground potential rise of faulty substations having equal and unequal spacing grounding grids conductors. IET Generation, Transmission and Distribution, 112, 18–26. [Google Scholar]
3. Soni, M., George, A. (2015). Cost effective grounding grid design for substation. International Journal of Scientific & Engineering Study, 6(8), 1558–1563. [Google Scholar]
4. Voon, V. K., Wong, K. L., Tiong, T. C., Mansour, A., Law, K. H. (2019). Grounding grid design in electrical power subs-station using optimization methods. IOP Conference Series: Materials Science and Engineering. 11th Curtin University Technology, Science and Engineering (CUTSE) International Conference, vol. 495, pp. 26–28. Sarawak, Malaysia. [Google Scholar]
5. Ayodele, T. R., Ogunjuyigbe, A. S. O., Oyewole, O. E. (2018). Comparative assessment of the effect of earthing grid configuration on the earthing system using IEEE and finite element method. Engineering Science and Technology, 21(5), 970–983. [Google Scholar]
6. Soni, M., George, A. (2019). Analysis of unequal grid spacing in grounding grid design by two novel techniques and comparison of both. Journal of Advance Research in Dynamical & Control Systems, 11(2), 78–87. [Google Scholar]
7. Huang, L., Chen, X., Yan, H. (1995). Study of unequally spaced grounding grids. IEEE Transactions on Power Delivery, 10(2), 716–722. DOI 10.1109/61.400860. [Google Scholar] [CrossRef]
8. Gabr, A. Z., Helal, A. A., Said, H. E. (2016). Optimal design of substation grounding grid based on genetic algorithm technique. International Journal of Electrical, Computer, Energetic, Electronic and Communication Engineering, 10(7), 863–869. [Google Scholar]
9. Soni, M., George, A. (2019). Optimal design of unequal conductor spacing in grounding grid by modern computational intelligent techniques. International Journal of Innovative Technology and Exploring Engineering, 8(10), 2898–2903. [Google Scholar]
10. Unde, M. G., Kushare, B. E. (2014). Effect of compression ration n touch voltage in layered soil. 2014 6th IEEE Power India International Conference (PIICON), India. [Google Scholar]
11. El-Refaie, E. S. M., Elmasry, S. E., Abd Elrahman, M. K., Abdo, M. H. (2014). Achievement of the best design for unequally spaced grounding grids. Ain Shams Engineering Journal, 6, 171–179. [Google Scholar]
12. Phayomhom, A., Sirisumrannukul, S., Ainsuk, B. (2018). Technique for safety design improvement of grounding system by compression ratio methods in metropolitan electricity authority’s system. IEEE/PES Transmission and Distibution Conference (T&D), pp. 1–9. Denver, CO, USA. [Google Scholar]
13. Unde, M. G., Kushare, B. E. (2012). Cost effective design of grounding grid using ground rods−A case study. Power India Conference, India. [Google Scholar]
14. Alik, B., Teguar, M., Mekhaldi, A. (2015). Minimization of grounding system cost using PSO, GAO, and HPSGAO techniques. IEEE Transactions on Power Delivery, 30(6), 2561–2569. DOI 10.1109/TPWRD.2015.2445979. [Google Scholar] [CrossRef]
15. Abd Elrahman, M. K. (2011). Adapting particle swarm optimisation for charge simulation method. IET Science, Measurement and Technology, 5(3), 96– 101. [Google Scholar]
16. Gouda, O. E., Amer, G. M., Ibrahim, H. (2010). Earth surface potentials and GPR for grids having different conductors’ distributions buried in different layer soil structures. 14th International Middle East Power Systems Conference, pp. 19–21. Egypt: Cairo University. [Google Scholar]
17. Gouda, O. E., Dein, A. Z. E. (2017). Ground potential rise of faulty substations having equal and unequal spacing grounding grids conductors. IET Geneationsmission Distribution, 11(1), 18–26. [Google Scholar]
18. Rugthaicharoencheepand, N., Phayomhom, A. (2014). Grounding system design improvement by compression ratio and ground rod methodsin power distribution substation. IEEE International Conference on Lightning Protection (ICLP), pp. 869–872. Shanghai, China. [Google Scholar]
19. Phithakwong, B., Kraisnachinda, N., Banjongjit, S., Chompoo-Inwai, C., Kando, M. (2000). New techniques the computer-aided design for substation grounding. Power Engineering Society Winter Meeting, pp. 2011–2015. IEEE, Singapore. [Google Scholar]
20. Chang, C. N., Lee, C. H. (2006). Computation of ground resistances and assessment of ground grid safety at 161/23.9-kV indoor-substation. IEEE Transactions on Power Delivery, 21(3), 1250–1260. DOI 10.1109/TPWRD.2005.860245. [Google Scholar] [CrossRef]
21. Sengar K. P., Chandrasekaran K. (2020). Effects of cost optimized grid configuration on earthing system performance: A comparative assessment. IET Science, Measurement & Technology, 14(5), 610–620. DOI 10.1049/iet-smt.2019.0192. [Google Scholar] [CrossRef]
22. Neamt, L., Chiver, O. (2021). A simple design method of unequal spacing arrangement for substation grounding grid. IEEE Access, 9, 141339–141346. DOI 10.1109/ACCESS.2021.3119941. [Google Scholar] [CrossRef]
23. Sengar, K. P., Chandrasekaran, K. (2019). Comparative analysis of grounding grid configurations with equal and unequal spaced design. 1st International Conference Energy System (ICESIP), Chennai, India. [Google Scholar]
24. Zeng, R., He, J., Wang, Z., Gao, Y., Sun, W. et al. (2000). Analysis on influence of long vertical grounding electrodes on grounding system for substation. Proceedings International Conference on Power System Technology, pp. 1475–1480. Perth, WA, Australia. [Google Scholar]
25. Chen, X. L. (1990). Grounding lecture note. Chongqing University, Chongqing, China. [Google Scholar]
26. Gouda, O. E., Amer, G. M., EL-Saied, T. M. (2006). Computation of potential profile at a surface above energized unequally spaced grounding grid. The Eleventh International Middle-East Power Systems Conference, vol. 2, pp. 17–22. MEPCON El-Minia, Egypt. [Google Scholar]
27. Amer, G. M., Gouda, O. E., Salim, O. M., Amer, E. (2018). Techniques used for unequally spaced grounding grid design. Journal of Multidisciplinary Research and Reviews, 1(1), 1–9. [Google Scholar]
28. Sengar, K., Chandrasekaran, K. (2019). Comparative analysis of grounding grid configurations with equal and unequal spaced design. IEEE 1st International Conference on Energy, Systems and Information Processing (ICESIP), Chennai, India. [Google Scholar]
Cite This Article
 Copyright © 2023 The Author(s). Published by Tech Science Press.
This work is licensed under a Creative Commons Attribution 4.0 International License , which permits unrestricted use, distribution, and reproduction in any medium, provided the original work is properly cited.
 Downloads
 Citation Tools