
 Submit a Paper
 Propose a Special lssue
 Open Access
ARTICLE

Energy Loss Analysis of Distributed Rooftop Photovoltaics in Industrial Parks
1 State Grid Hunan Electric Power Corporation Limited, Changsha, China
2 Hunan Province Key Laboratory of Intelligent Electrical Measurement and Application Technology, Changsha, China
3 Hunan Institute of Metrology and Inspection, Changsha, China
* Corresponding Author: Hua Li. Email:
(This article belongs to the Special Issue: Key Technologies of Renewable Energy Consumption and Optimal Operation under )
Energy Engineering 2023, 120(2), 511-527. https://doi.org/10.32604/ee.2023.022750
Received 24 March 2022; Accepted 06 June 2022; Issue published 29 November 2022
 View Full Text
 Download PDF
Abstract
The analysis of the loss of distributed photovoltaic power generation systems involves the interests of energy users, energy-saving service companies, and power grid companies, so it has always been the focus of the industry and society in some manner or another. However, the related analysis for an actual case that considers different cooperative corporations’ benefits is lacking in the presently available literature. This paper takes the distributed rooftop photovoltaic power generation project in an industrial park as the object, studies the analysis and calculation methods of line loss and transformer loss, analyzes the change of transformer loss under different temperatures and different load rates, and compares the data and trend of electricity consumption and power generation in industrial parks before and after the photovoltaic operation. This paper explores and practices the analysis method of the operating loss of distributed photovoltaic power generation and provides an essential reference for the benefit analysis and investment cost estimation of distributed photovoltaic power generation systems in industrial parks. The analyzed results reveal that the change loss is stable after the photovoltaic is connected, and there is no additional transformer loss. And before and after the photovoltaic system installation, there was no significant change in the total monthly data difference between the total meter and the sub-meter.Keywords
In recent years, the development of the distributed photovoltaic power generation system that is “self-generated and self-used, surplus on-grid” is vigorously advocated in all countries [1–3]. Distributed photovoltaic power generation refers to photovoltaic power generation facilities that are constructed at or near consumers and users, and whose operation mode is mainly self-consumption on the user side. Excess power is connected to the power grids and is characterized by balanced adjustment in the distribution network system [4,5]. The distributed photovoltaic power generation system mainly comprises solar cell photovoltaic panels, controllers, collection stations, inverters, and transformers. The electric energy meter installed at the grid connection point is a two-way meter, which can not only measure the on-grid electricity of the distributed photovoltaic power generation system but also measure the electricity obtained by the user from the grid [6–8]. Accurately measuring the power generation, on-grid power, and off-grid power of distributed photovoltaic projects, and analyzing the loss of distributed photovoltaic power generation systems have always been the focus of domestic and foreign scholars.
The current distributed photovoltaic power generation project implements the principle of separate measurement and independent settlement of power generation, on-grid and off-grid power. On-grid power and off-grid power are calculated according to the state’s feed-in tariff and sales tariff for network purchase and sale of electricity, respectively [9,10]. Distributed photovoltaic power generation projects have various uncertain risks such as large capital demand, long cycles, high investment costs, and rapid policy changes. At present, distributed photovoltaic power generation systems in industrial parks are often constructed using contract energy management methods. It involves the interests of three parties: energy-using enterprises, energy-saving service companies, and power grid companies. Therefore, how to accurately analyze photovoltaic operating losses has become a focus of attention of the three parties [11–13].
Domestic and foreign scholars or enterprises have integrated the local monitoring data of photovoltaic power plants, environmental meteorological data of power plants, power plant fault information data, and other related information data, and built a unified information data monitoring and analysis platform, a comprehensive platform for power station operation management, and a data analysis platform based on big data [14,15]. What’s more, reference [16] investigated residential distribution networks with uncertain loads and photovoltaic distributed generation using data-driven models. Similarly, in [17], a data-driven network optimization approach was proposed to coordinate the control of distributed PVs and smart buildings in distribution networks, considering the uncertainties of solar power, outdoor temperature, and heat gain associated with building thermal dynamics. It can be found that the data-driven models are employed to forecast the uncertainties exited in the system. Explicitly, this is not our paper’s scope; hence, the data-driven models are not utilized. In terms of operation loss analysis of photovoltaic power generation systems, it mainly focuses on wire loss and ground wire loss. However, in the design and planning stage, it is generally difficult to determine the type and transposition method of the ground wire, so it is difficult to evaluate it. In contrast, the parameters of the wire are relatively easy to determine [18–21].
In addition, Reference [22] proposed a new method for site and size selection of distributed PV systems considering system active power loss and nodal voltage profiles. And a detailed case study performed on the Northern Cypriot power system is given. The [23] investigated the system losses and power quality issues associated with the high deployment of PV in a grid network. However, some papers have discussed the power loss for the PV system, but the related analysis for an actual case that considers the benefit of different cooperative corporations are lacking for now. Consequently, this paper aims to analyze the requirements of distributed rooftop photovoltaic power generation in industrial parks, takes the distributed rooftop photovoltaic power generation project in XX Industrial Park as the object, studies the analysis and calculation methods of line loss and transformer loss, and compares and analyzes the electricity consumption of XX Industrial Park before and after the photovoltaic operation. It explores and practices the analysis method of distributed rooftop photovoltaic power generation operation loss. It also provides a reference for benefit analysis and investment cost estimation of distributed photovoltaic power generation systems in industrial parks. Lastly, some finds are obtained as: 1) The change loss is stable after the photovoltaic is connected, and there is no additional transformer loss. 2) Before and after the photovoltaic system installation, there was no significant change in the total monthly data difference between the total meter and the sub-meter. 3) Before and after the installation of photovoltaics, there is no significant change in the electricity consumption of XX Industrial Park, and the benefits brought by photovoltaic power generation are obvious.
2 Parameters of Distributed Rooftop Photovoltaic Power Generation in Industrial Parks
XX Industrial Park builds a distributed photovoltaic power generation project with a capacity of 6 MW, which is directly connected to the low-voltage side of the transformer in the distribution room of XX Industrial Park to supply power to XX Industrial Park. Therein the PV configuration parameters are listed in Table 1. The power generation system adopts the operation mode of “self-generated and self-used, surplus on-grid” and “all self-generated and self-used.” The generated energy is preferentially supplied to the XX Industrial Park for load, and the remaining power is sent back to the grid through the transformer.

The 4.744 MW distributed rooftop photovoltaic power generation project in XX Industrial Park is divided into three fields and ten grid-connected points, of which: the No. 1 plant has a capacity of 4.1877 MW and seven grid-connected points; the office building has a capacity of 0.32076 MW, two grid connection points; the canteen dormitory building area has a capacity of 0.14256 MW and one grid connection point. The photovoltaic cell modules use 270 W polysilicon, with a total of 17,226 pieces, and the installation method is fixed installation. In the canteen and dormitory building area, 528 photovoltaic modules, 4 sets of 36 kW string inverters, and 1 set of 4-to−1 AC combiner box are connected to the transformer room in the center of the exhibition hall; 1188 photovoltaic modules are installed in the office building area, 8 sets of 36 kW string inverters and 2 sets of 4-to−1 AC combiner boxes, connected to the power distribution room on the negative first floor of the office building; 15,510 photovoltaic modules, 115 sets of 36 kW string inverters and 29 sets of 4-to−1 AC combiner boxes, of which 27 combiner boxes are connected to the two power distribution rooms on the first floor of No. 1 factory building, and 2 combiner boxes are connected to the power distribution room on the negative first floor of the office building.
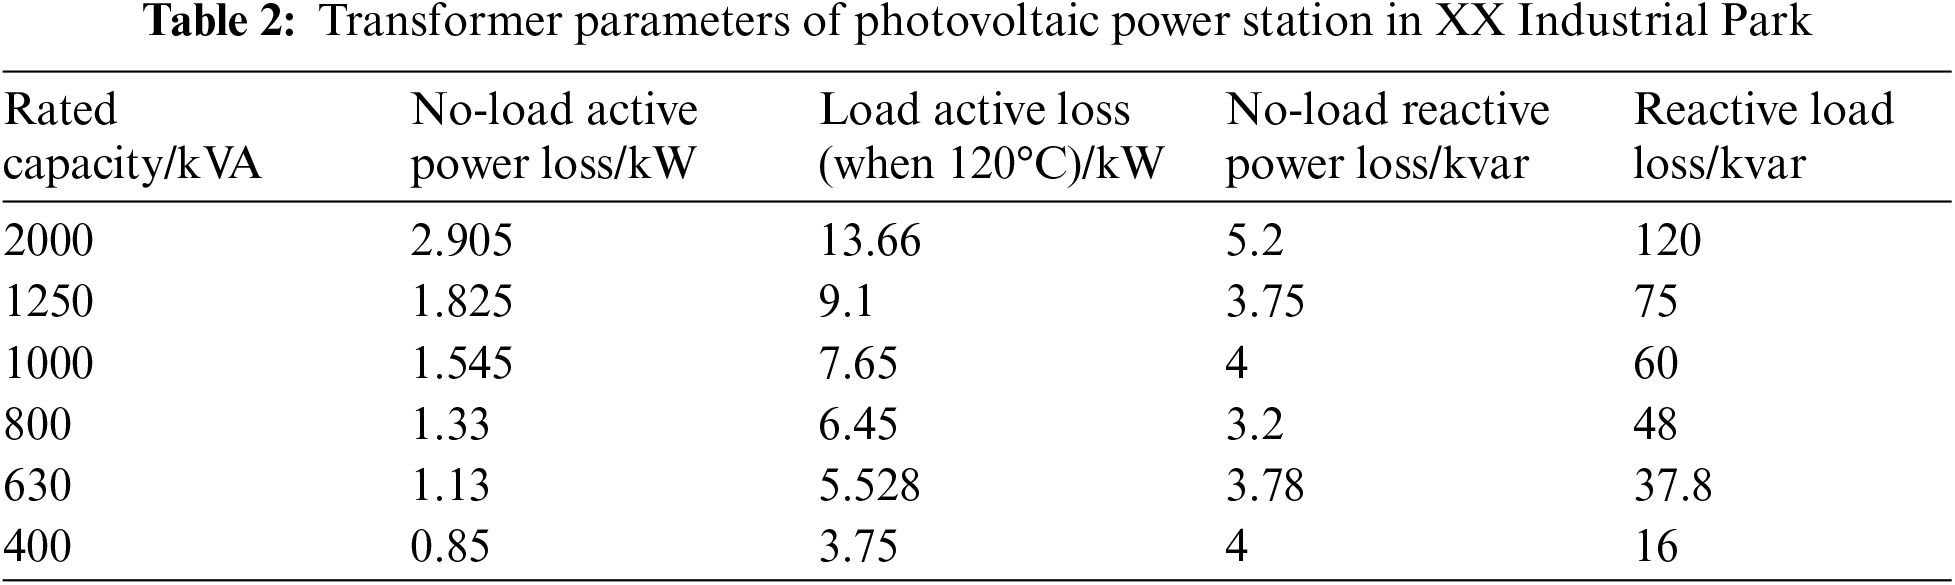
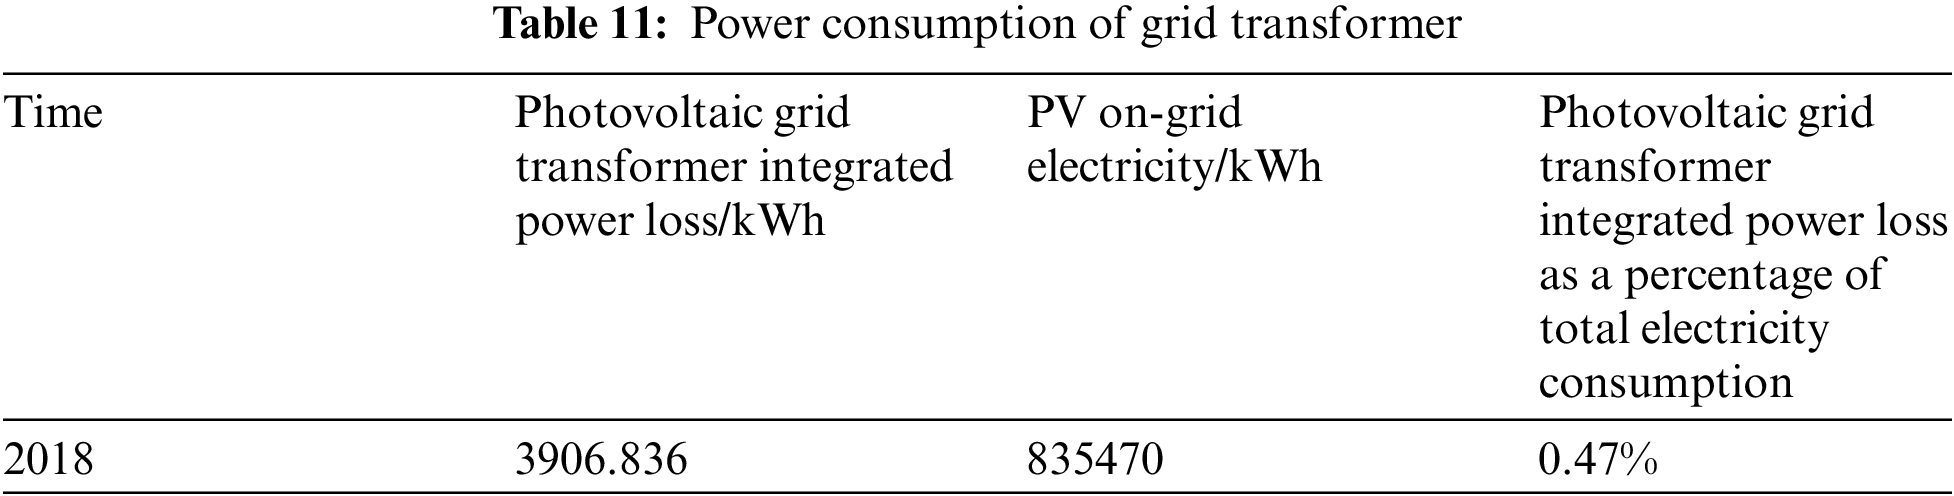
There are 13 transformers at the access point of the photovoltaic power station in XX Industrial Park, including one transformer with a rated capacity of 2000 kVA, three transformers with 1250 kVA, one transformer with a rated capacity of 1000 kVA, three transformers with a rated capacity of 800 kVA, four transformers with a rated capacity of 630 kVA and one transformer with a rated capacity of 400 kVA. The transformer adopts Tiantai SC(B)11 epoxy resin dry-type transformer. The parameters of various types of transformers are shown in Table 2 below.
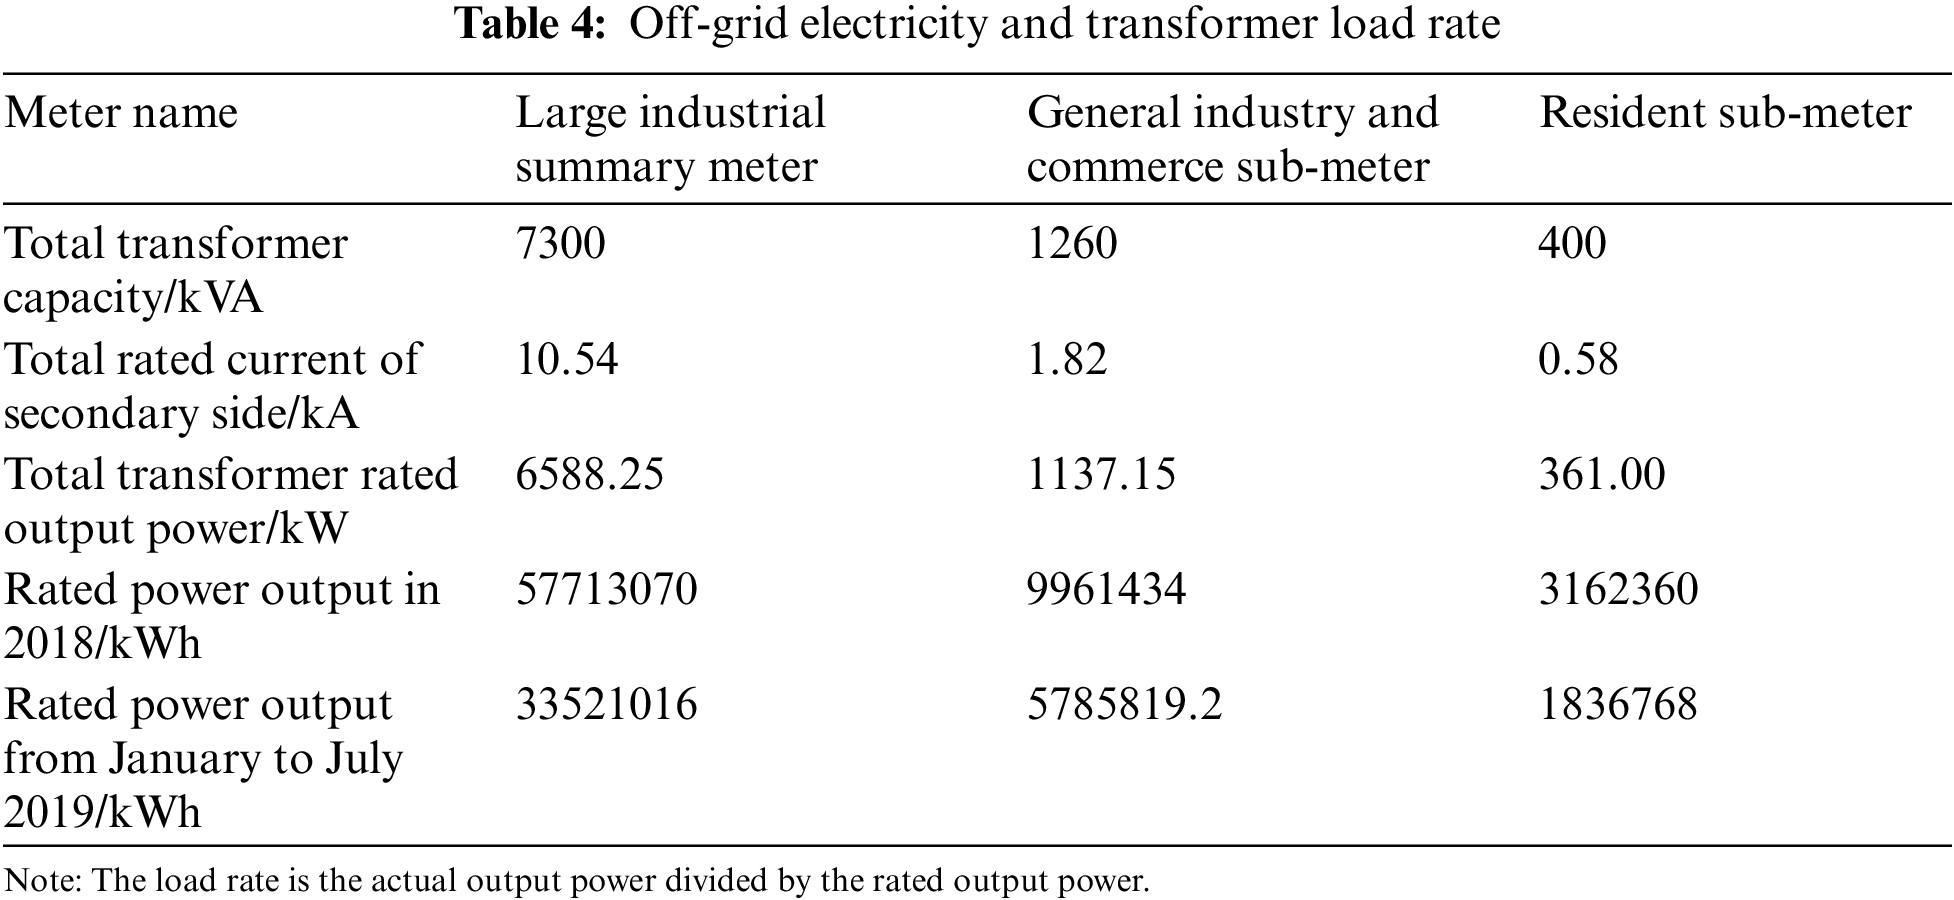
Among them, XX Industrial Park is connected with one 2000 kVA, two 1250 kVA, two 1000 kVA and three 800 kVA under the large industrial master meter, two 630 kVA under the general industrial and commercial sub-meter, and one 400 kVA under the residential sub-meter. The rest of the transformers are under the general industrial meter in the pantry and are not counted in the analysis and calculation. Now the transformer information of each metering point is shown in Table 3.

Total transformer capacity, total rated transformer no-load loss, total rated transformer load loss, total rated transformer reactive no-load loss, and total rated transformer reactive load loss are the sum of rated transformer capacity, rated no-load loss, rated load loss, reactive no-load loss and reactive load loss under the corresponding meter.
The main manifestation of line loss is the heat generated by line resistance. The calculation method of line heat loss power is as follows:
where, R is the resistance value of the wire, which is R20 × L; R20 is the resistance value of the single-phase wire at 20°C, take the conductor resistance 0.0991 ω/km whose nominal area of the cable is 3 × 185 + 1 × 95 mm2; L is the length of the single-phase line, according to XX Industry List of park assets, L is 0.06 km.
The average line current value is calculated based on the annual PV feed-in power Q, the equivalent full-load operating hours T, the rated voltage U on the secondary side, and the PV access point n in 2018. The line power loss after taking into account the above factors is:
According to XX Industrial Park 2018, PV total online power 835470 kWh, T = 929 h, U = 0.4 kV, PV access point n = 13, according to formula (3) can be calculated average current I = 57.65 A. Substitute I into formula (2) can be obtained PV plant 2018 line loss is about 715.96 kWh.
4.1 Analysis of Transformer Load Rate
Analysis of transformer losses should be considered from both theoretical and practical aspects. Theoretically, the transformer uses the two iron cores in the body to wind the coils with different turns to boost or reduce the voltage. Various losses will be generated in this process. Usually, the loss generated by the primary and secondary side coils of the transformer is called copper loss, and the loss generated in the transformer core is called iron loss. In most of the analysis and practical applications, the no-load loss of the transformer without any load and the short-circuit loss when the short-circuit occurs in the secondary coil are mainly studied, and the values of the no-load loss and short-circuit loss are taken as basic data to calculate the main losses when the transformer is operating. In practice, the influence of transformers due to different loads and temperature changes should also be considered.
When the transformer is in actual operation, both the load rate of the transformer and the temperature change will affect the transformer’s loss. The load rate of the transformer is not proportional to the efficiency of the transformer. When the load rate is too low, the efficiency of the transformer will be greatly reduced, and the temperature change of the transformer is also related to the load rate of the transformer. In order to obtain the transformer load rate accurately, the transformer configuration should be analyzed first, and then the transformer loss analysis and calculation should be performed.
After the XX Industrial Park is used in the photovoltaic power station, the transformer configuration under different meters is analyzed first, and then the transformer loss is calculated.
The total rated capacity P_total of the transformer at different measurement points has been given in Section 5.2.1. The voltage U2 on the secondary side of the transformer is 400 V. Substitute P_total and U2 into the total rated capacity formula:
It can be known that the total rated current I2 is on the secondary side. Then according to the rated output power formula:
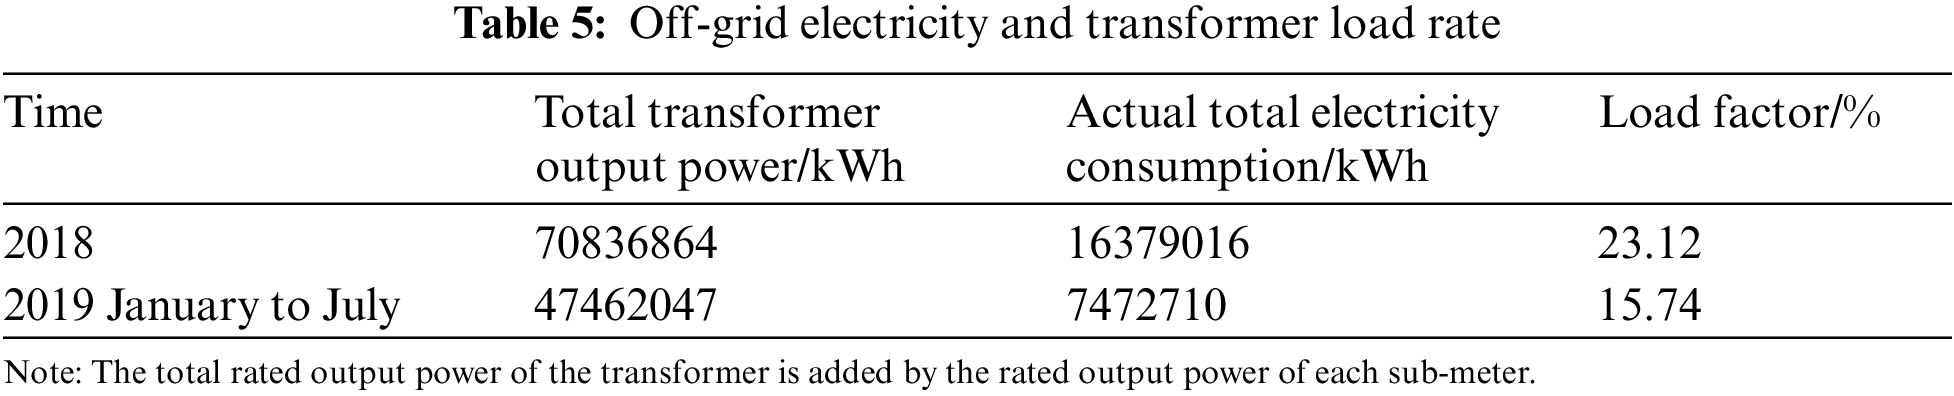
where, the power factor cosφ is taken as 0.95 and U is the industrial electricity voltage 380 V, the total transformer rated output power P_amount can be obtained. Then multiply the rated output power by 8760 h to get the rated output power in 2018; multiply 5088 h to get the rated output power from January to July 2019. According to formula (5), the off-grid power is divided by the rated output power to obtain the transformer load rate, as shown in Tables 4 and 5.
4.2 Losses of Actual Transformers at Different Temperatures
In actual operation, the thermal problem is the key factor affecting the operating state of the transformer. Excessive temperature rise has a great impact on the transmission efficiency and service life of the transformer. The insulation performance of the dry-type transformer is closely related to its internal heat generation and heat dissipation; the unbalanced internal heat generation and heat dissipation will affect the thermal life of the winding insulation. XX Industrial Park uses epoxy resin dry-type transformers, which have a higher temperature level for the insulation system. This type of transformer has the incomparable advantages of oil-immersed transformers, but its disadvantage is its relatively poor thermal conductivity. Therefore, transformer losses at different temperatures should also be considered.
To obtain the internal temperature field of the transformer under different modeling, different physical models are established to simulate the temperature field of the transformer. For the heat source per unit volume of the iron core, the heat source per unit volume of the winding, the external air temperature and atmospheric pressure set the exterior ambient temperature to 30°C. Perform the definition of materials, heat source, boundary conditions, heat dissipation methods, each parameter’s setting, etc. Heat dissipation considers conductor heat transfer, natural cooling, and radiation.
When studying the change of the temperature field with the ambient temperature, the load rate is 80%, and the load fluctuation coefficient KT = 1.042, PK = 9300 W. By calculating the selected transformer windings, the heat source per unit volume of the windings is 59.07 kW/m3. Figs. 1 and 2 are the temperature field distributions calculated by the finite element method. Fig. 1 is a three-dimensional temperature field view, and Fig. 2 is a three-dimensional temperature field and an isothermal view.
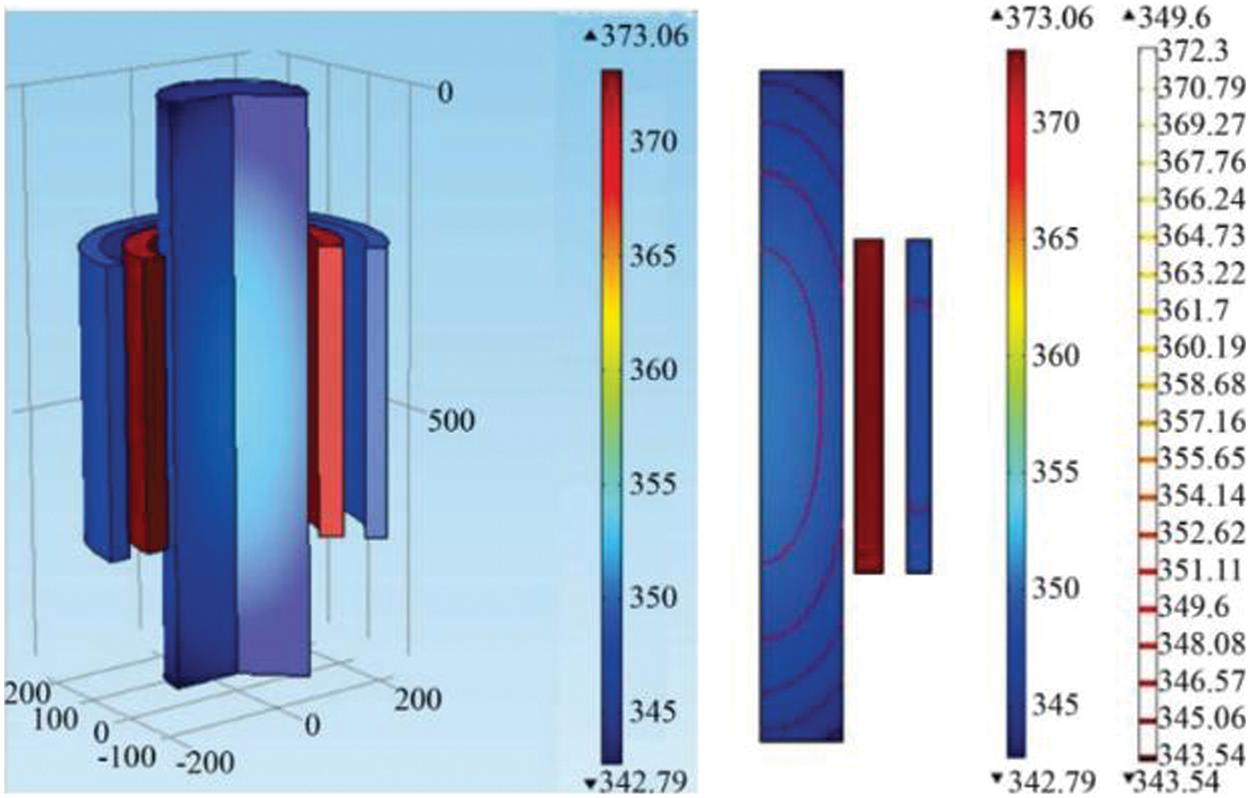
Figure 1: Three-dimensional temperature field identification map
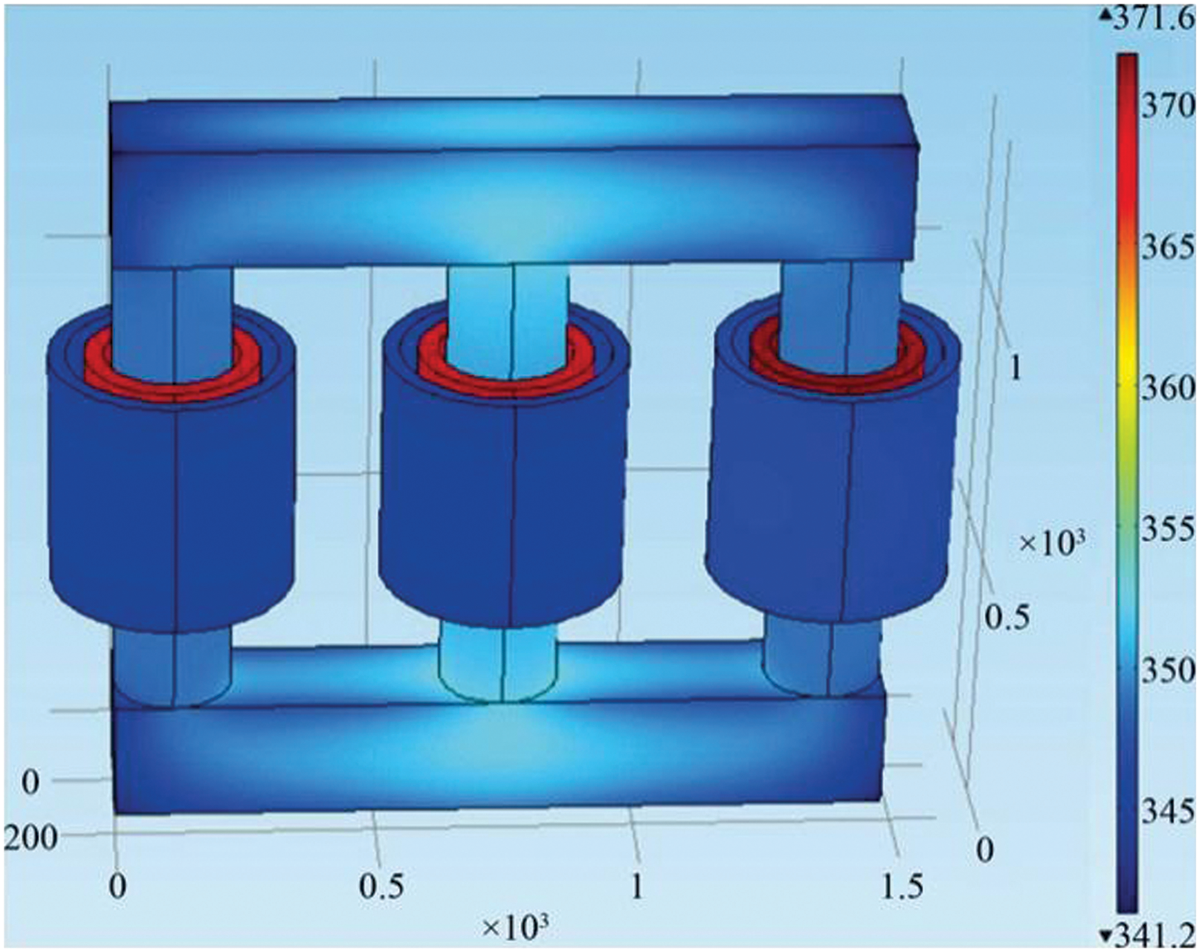
Figure 2: 3D temperature field and isotherm view
Fig. 2 can intuitively reflect the temperature field distribution inside the transformer and can also obtain the temperature at an accurate coordinate. It can be judged that the maximum temperature of the transformer during regular operation is 373.06 K when the external ambient temperature is 303 K, the solid heat transfer physical module is selected, and the load rate is 80%. Inside the transformer, the temperature gradient does not change much due to the smaller axial dimension relative to the longitudinal dimension. Since the radial thickness of the winding is very small relative to the axial direction, the temperature is almost the same at the same axial coordinate position. For the iron core, the isotherm diagram shown in Fig. 1 can be seen. Due to the influence of heat dissipation conditions, the temperature near the low-voltage winding is made to approach the temperature at the inner side of the iron core, forming an isotherm.
By changing the external temperature of the three-dimensional model, the variation of the highest temperature inside the transformer with the exterior ambient temperature is obtained, as shown in Table 6 and Fig. 3.
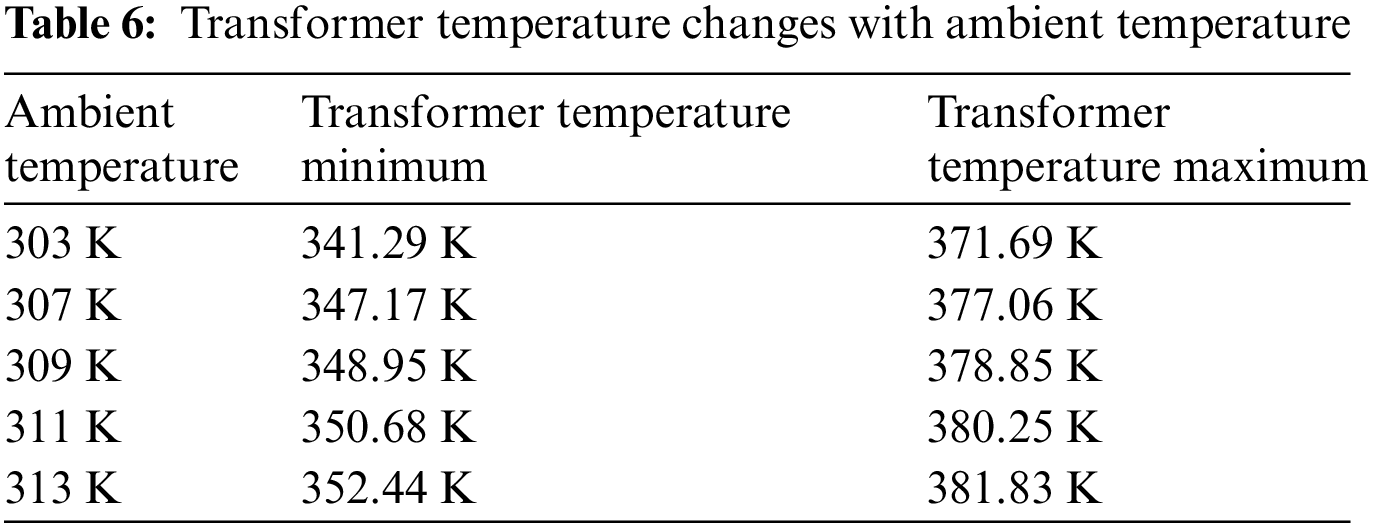
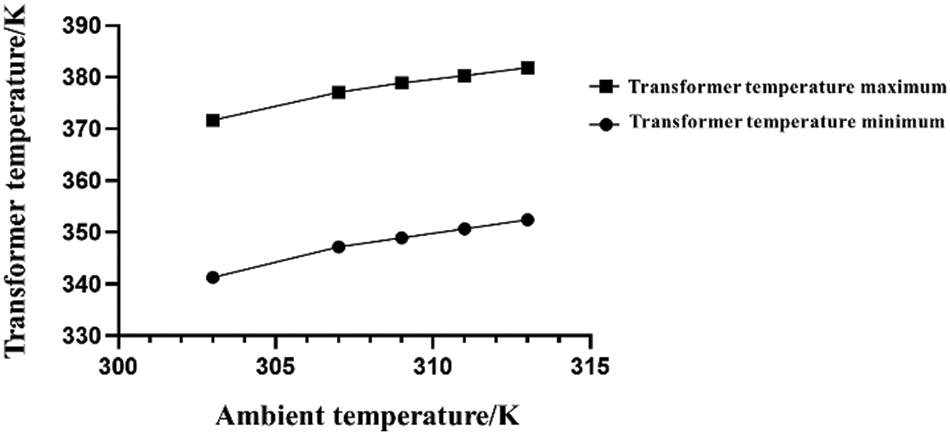
Figure 3: Transformer temperature change curve with outside temperature
Fig. 4 shows the variation of the maximum temperature and minimum temperature of the transformer with the load rate of the transformer. As the load rate of the transformer increases, the distribution of the temperature field inside the transformer also changes. As the load rate increases, the load loss of the transformer increases, and the heat source per unit volume increases, increasing the temperature rise inside the transformer.
Figure 4: Transformer temperature change curve with load rate
According to the simulation of the heating and cooling process of photovoltaic transformers in XX Industrial Park, a three-dimensional model is established, and the finite element method is used to calculate and analyze the temperature field numerically. The main conclusions are as follows:
• With the increase of the ambient temperature, the maximum temperature of the transformer increases approximately linearly. For every 2 K increase in the external ambient temperature, the maximum and minimum temperatures of the transformer increase correspondingly to a value close to 1 K. According to the on-site measurement, the ambient temperature of the transformer is 309 K, the maximum temperature of the transformer is 378 K, and the minimum is 347 K, which is in good economic operation efficiency. The transformer loss will not increase additionally.
• When the load rate is between 0% and 56%, the maximum temperature of the transformer appears in the iron core. Within this range, the increase of the load rate has little effect on the maximum temperature of the transformer; the load rate of the transformer in XX Industrial Park all are between 0% and 56%, so the influence of the temperature of the transformer is not considered when calculating the loss.
• With the increase of the load rate, the highest temperature point of the transformer appears in the low-voltage winding of the transformer, and the maximum temperature of the transformer increases with the increase of the load rate. Considering the load rate from the perspective of transformer temperature, therefore the load rate should be kept below 80%. Considering the load rate from the perspective of optimal economic operation, the load rate of XX Industrial Park should be around 50–60%.
4.3 Transformer Loss Estimation
1. Analysis of the Total Transformer Loss of the Photovoltaic Power Station in XX Industrial Park in 2018
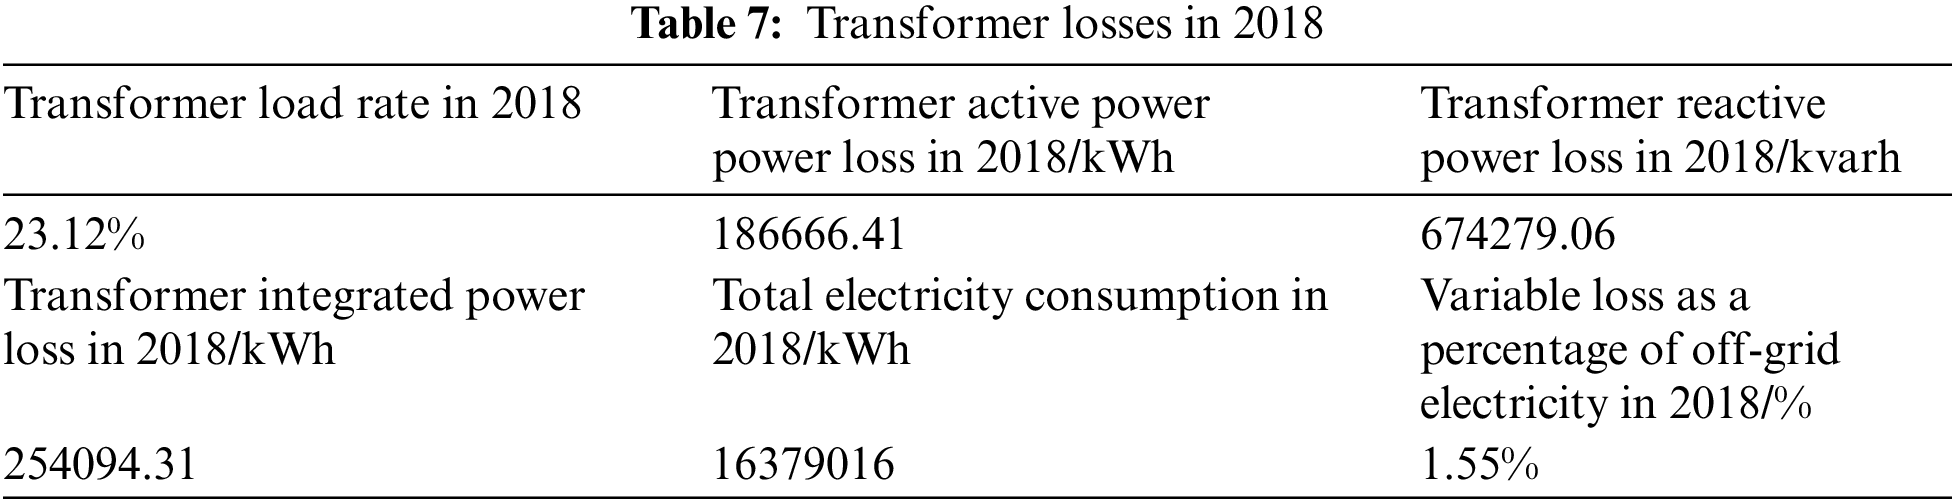
According to the transformer load rate meter obtained by the analysis shows that the transformer load rate in 2018 was 23.12%. Then, according to the total no-load loss P0, total load loss PK, total reactive no-load loss Q0,and total reactive load loss QK of the corresponding transformer at different measurement points obtained in the previous section, substitute into formula (3), we can get
The load fluctuation coefficient KT is taken as 1.05, and the active power loss ΔP of the transformer and the reactive power loss ΔQ of the transformer in 2018 are obtained, and then multiplied by 8760 h to obtain the annual active power loss of the transformer and the reactive power loss of the transformer, which can be integrated to obtain
Among them, the reactive power economic equivalent KQ is taken as 0.1. Substituting the active power loss and reactive power loss into the above formula, the comprehensive power loss ΔPZ of the transformer offline in 2018 can be obtained. The results are shown in Table 7.
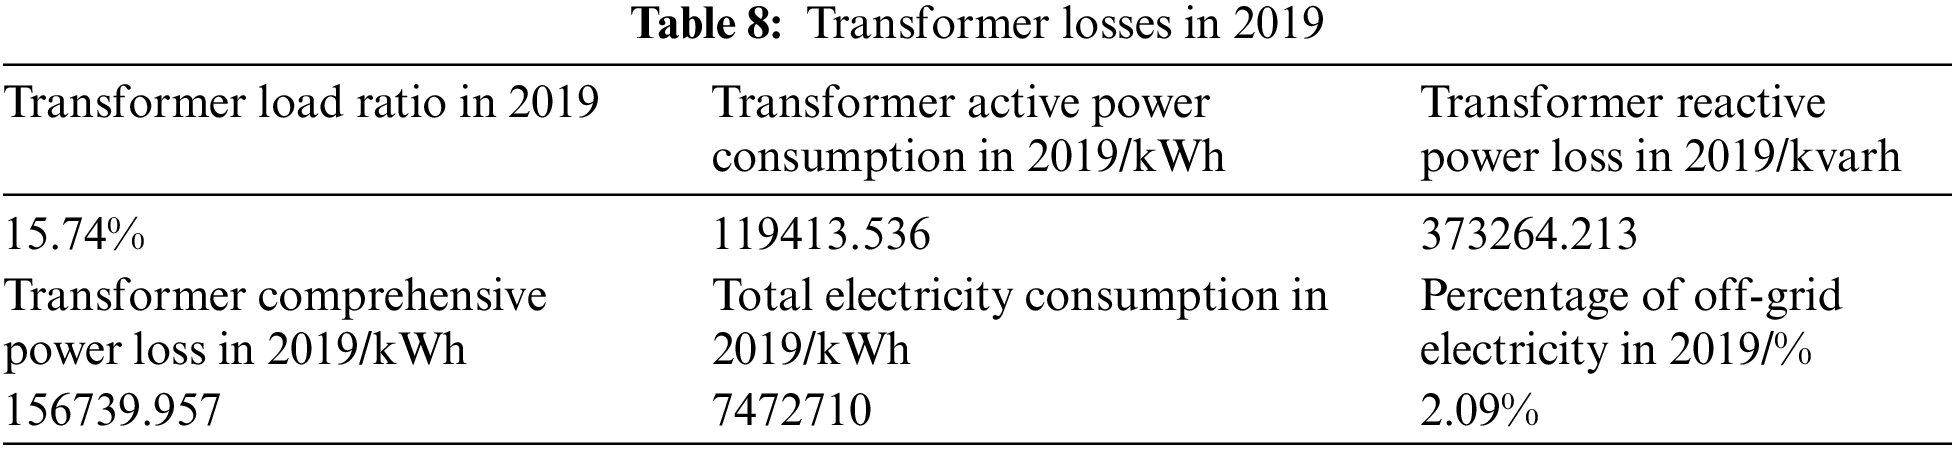
2. Analysis of the Total Transformer Loss of the Photovoltaic Power Station in XX Industrial Park in 2019
It can also be seen that the transformer load rate in 2019 is 15.74%. The total no-load loss P0, total load loss PK, total reactive no-load loss Q0, and total reactive load loss QK of the transformer are the same as in 2018 and are substituted into formulas (6), (7). The load fluctuation coefficient KT is taken as 1.05 to obtain the transformer active power loss ΔP and the transformer reactive power loss ΔQ in 2019 and then multiply it by 5088 h to obtain the annual transformer active and transformer reactive power loss, where the reactive power economic equivalent KQ is taken as 0.1. Substituting the active power loss and reactive power loss into the above formula then, the comprehensive power loss ΔPZ of the transformer off the grid from January to July 2019 can be obtained. The results are shown in Table 8.
3. Analysis of the Total Transformer Loss of the Photovoltaic Power Station in XX Industrial Park in 2018
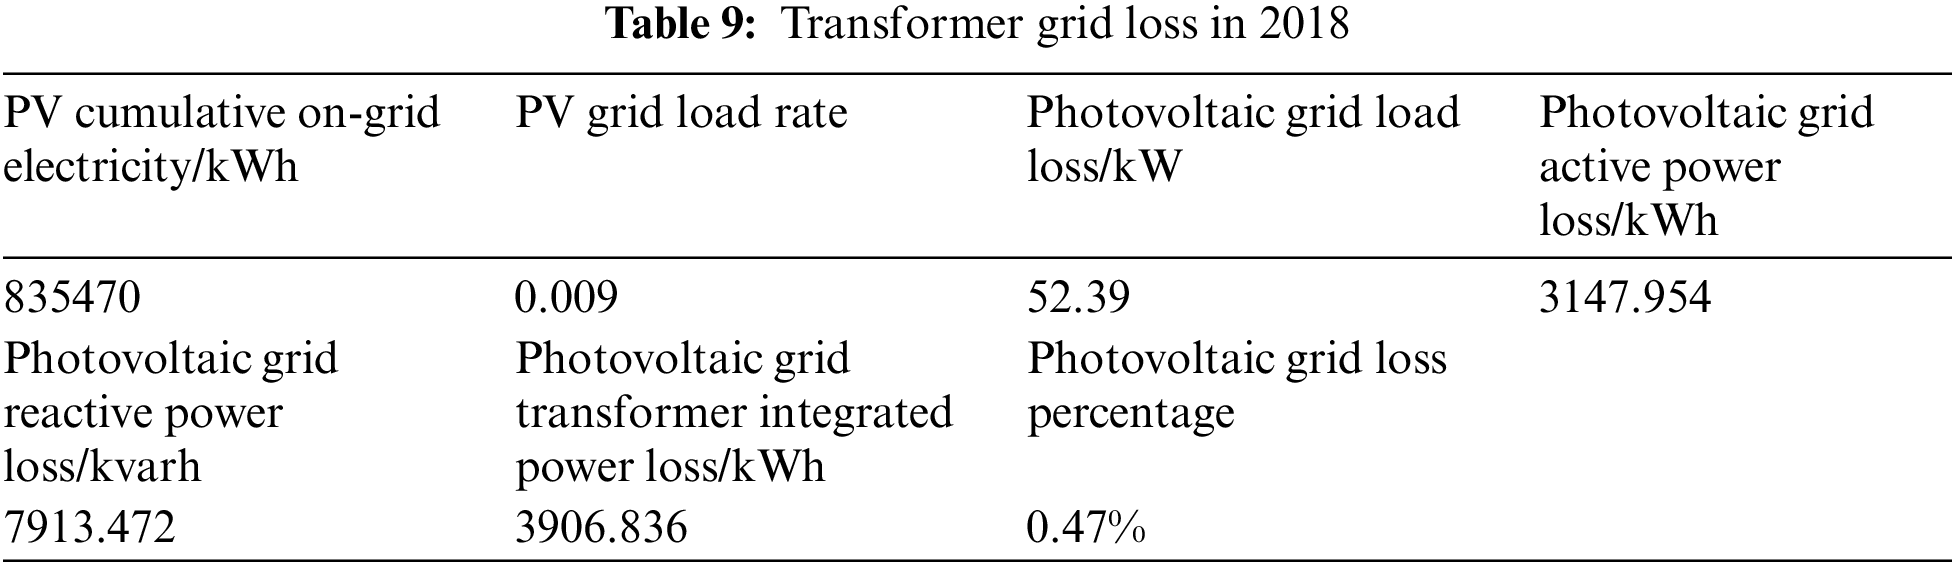
In 2018, the photovoltaic power generation was 5,189,310 kWh, and the annual photovoltaic power generation time of the photovoltaic power station in XX Industrial Park was 864.8850 h; in 2018, the photovoltaic on-grid electricity was 835,470 kWh, and the estimated photovoltaic on-grid time was 835,470 kWh/0.6 Mw = 139.2450 h. Since the grid-connected points of PV plants are all available, the transformer no-load loss P0, rated load loss PK, transformer rated reactive no-load loss Q0, transformer rated reactive load loss QK, and load rate of all transformers can be calculated uniformly by substituting into Eq. (6), (7). The load fluctuation coefficient KT is taken as 1.05 to obtain the load loss of the photovoltaic grid and then multiply the photovoltaic grid time of 148.64 h to obtain the photovoltaic active power loss ΔP and the transformer reactive power loss ΔQ. Among them, the reactive power economic equivalent KQ is taken as 0.1. Substituting the active and reactive power loss into the above formula, the comprehensive power loss ΔPZ of the transformer on-grid in 2018 can be obtained. The results are shown in Table 8.
After organizing the above variable loss data, Tables 9 and 10 can be obtained. From Tables 9 and 10, the following conclusions can be drawn:
(1) From the perspective of the proportion of transformer loss to off-grid electricity, since the off-grid electricity in 7 months of 2019 was only 45.6% of the total off-grid electricity in 2018, the transformer load rate From 23.12% in 2018 to 15.74%, which led to a slight increase in the percentage of the total electricity consumption in 2019 compared with 2018.
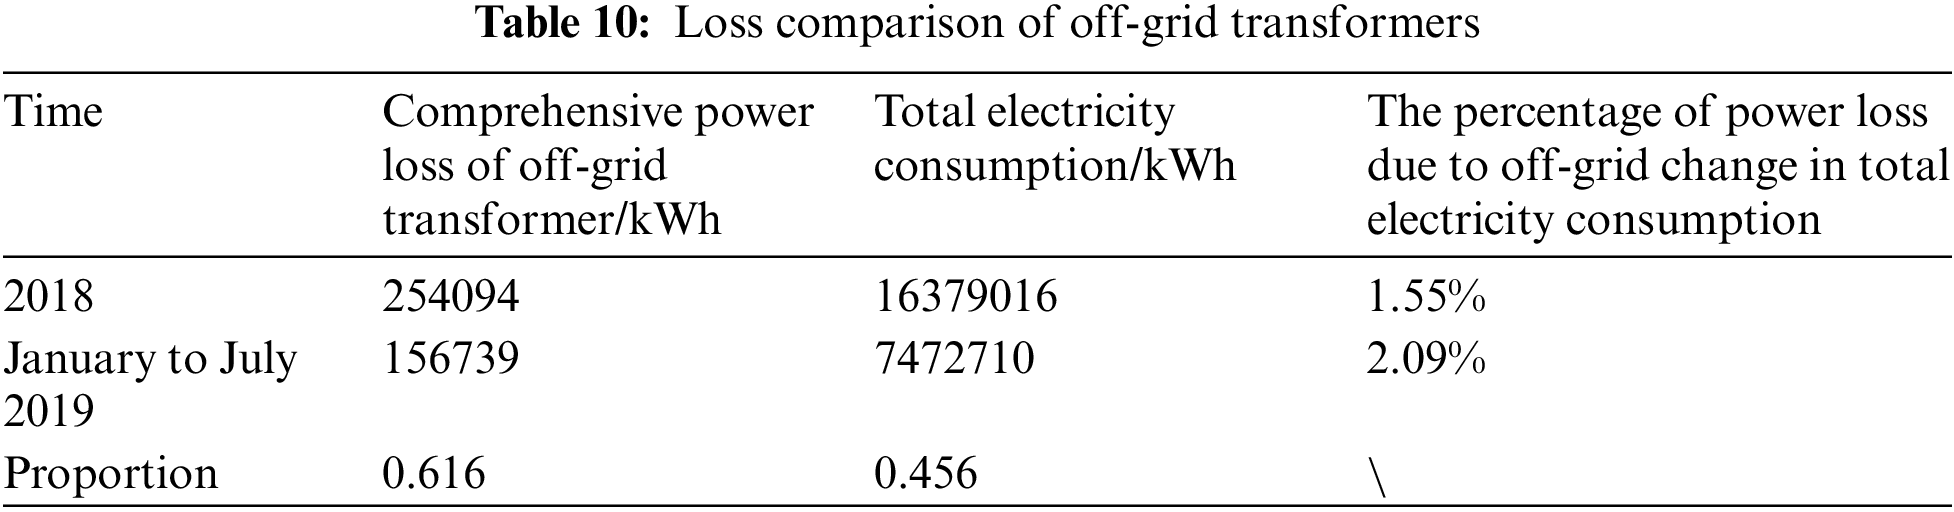
(2) From the point of view of economic operation, it is suggested that XX Industrial Park can appropriately increase the load rate of the transformer to keep it in the economic operation range and improve the efficiency of the transformer. Tables 9–11 can be obtained after arranging the above variable loss data.
Therefore, based on the above analysis, the flow chart about the general process of solving the problem for the typical problems of the energy loss is depicted in Fig. 5. It shows that analyzing the energy loss for a practical case requires first analyzing the line loss based on (1)--(3). Afterward, it demands to investigate the transformer load rate based on (4) and (5). Lastly, it needs to analyze the transformer loss based on (6)--(8). According to the above process, the energy loss can be attained clearly.
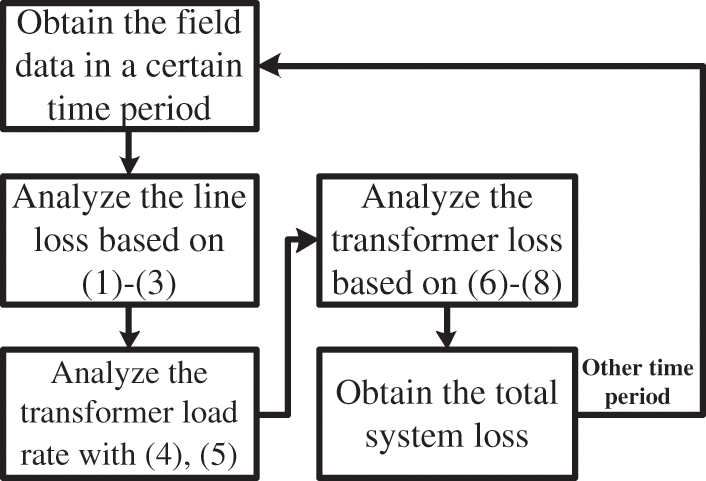
Figure 5: The flow chart for the loss analysis for a general case
5 Analysis of Production Energy Consumption in the Park
Fig. 6 provides the studied factory equipped with a rooftop PV system. Besides, Fig. 7 shows the energy balance in the studied scenario. Our data contain total energy demand, the electricity consumption of sub-meters, energy losses, and PV generation from this factory for four months, from January to April 2019. As seen from Fig. 1, rooftop panels supply electricity to buildings, so they need to buy less electricity from the grid, thereby saving on energy costs. As the energy is generated on-site, transmission losses are kept at a minimum.
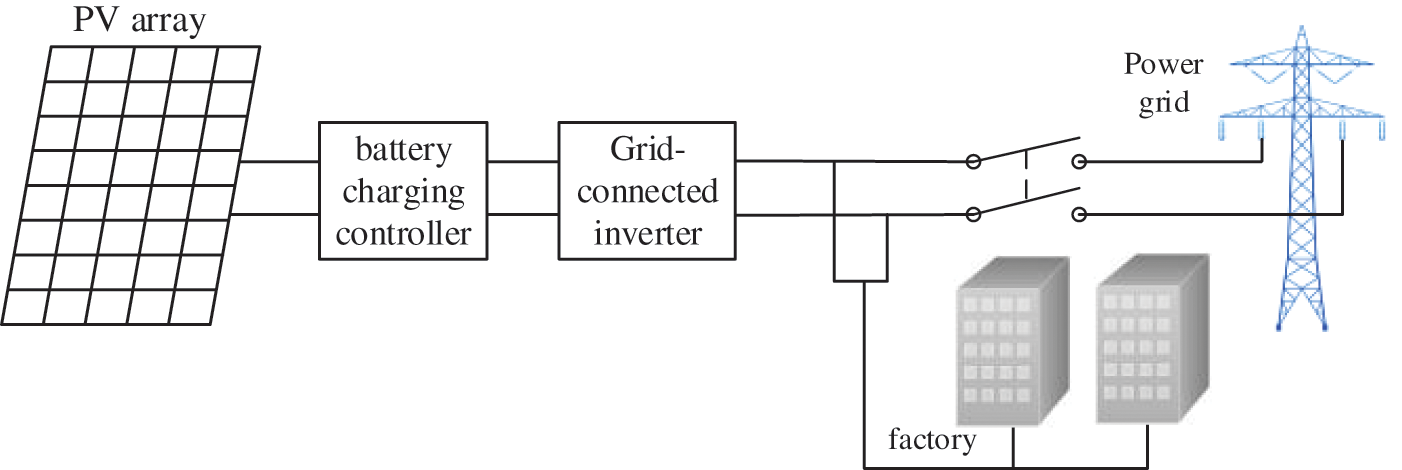
Figure 6: The factory is equipped with a rooftop PV system
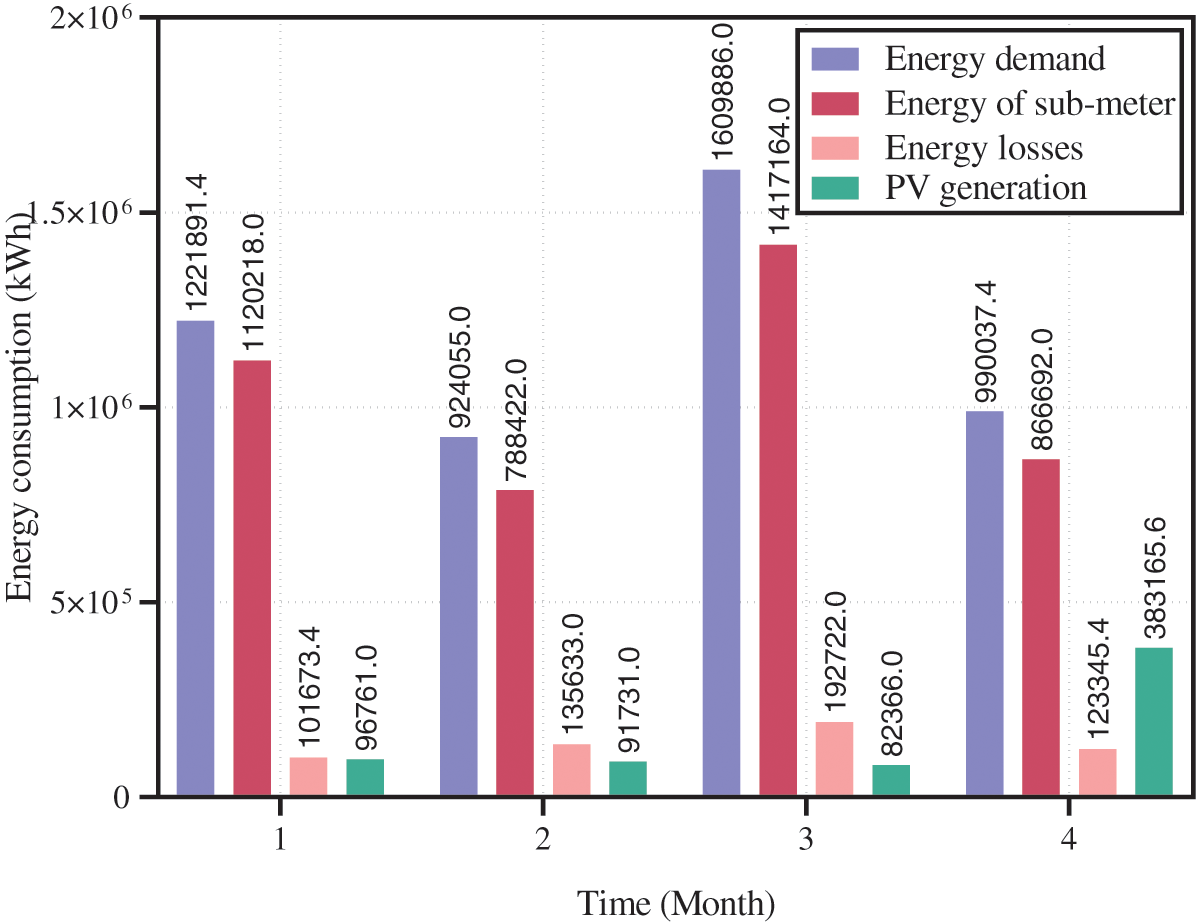
Figure 7: The energy balance in the study location
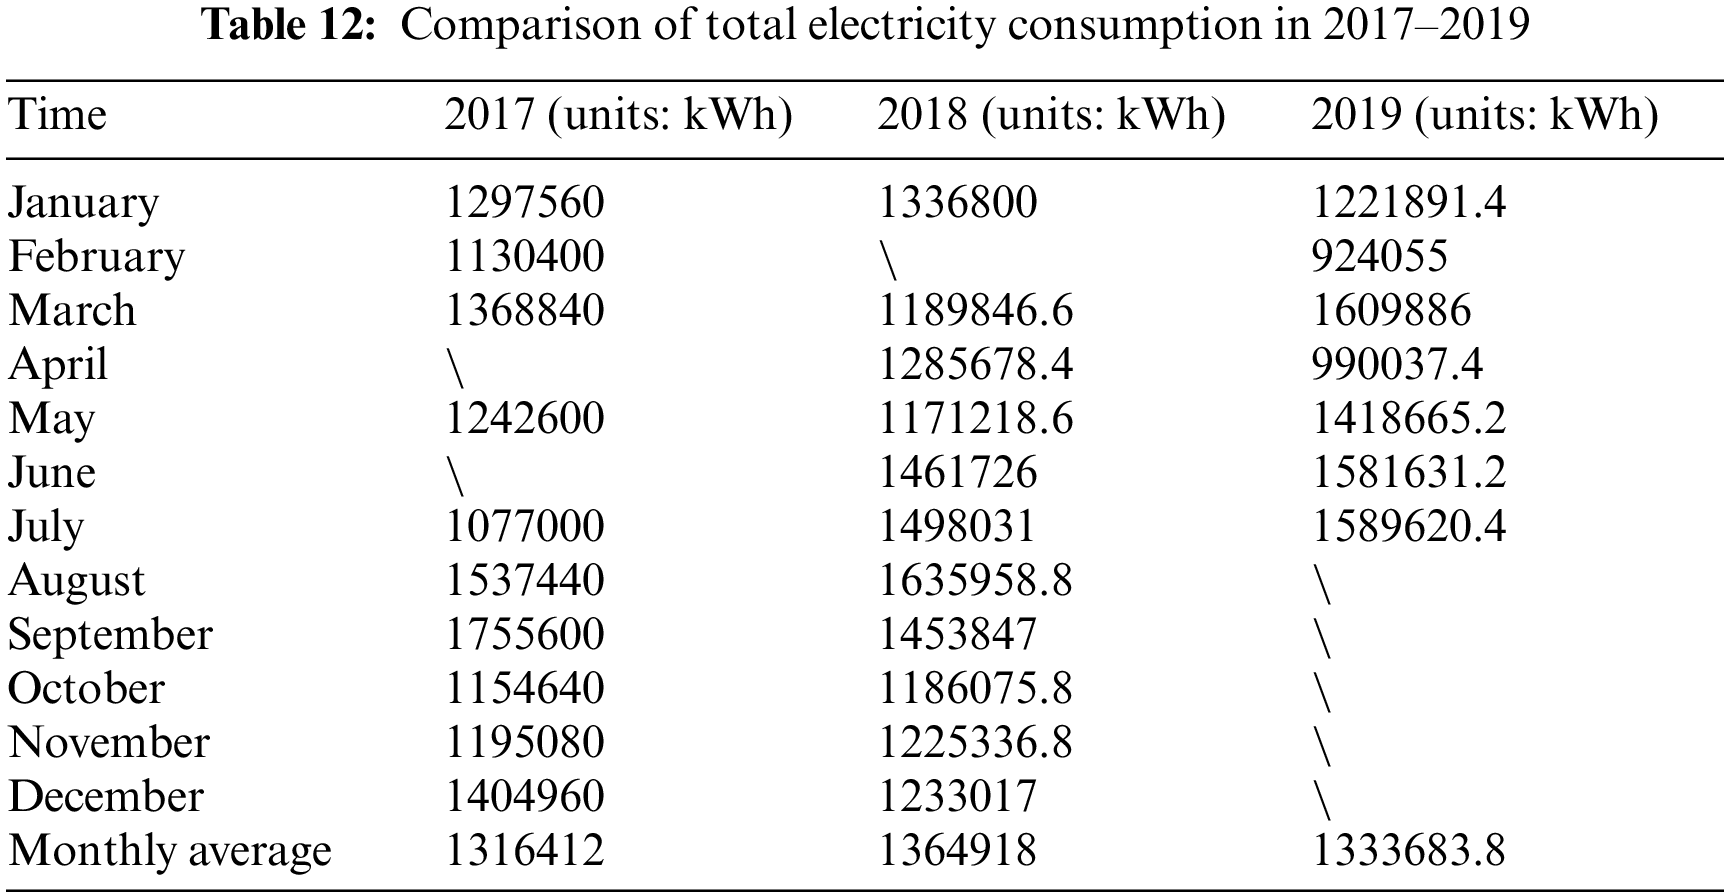
Combined with the total electricity data of the general meter and sub-meters of XX Industrial Park, the total electricity and change trends of the total and sub-meters in each month from 2017 to 2019 are shown in Fig. 8.
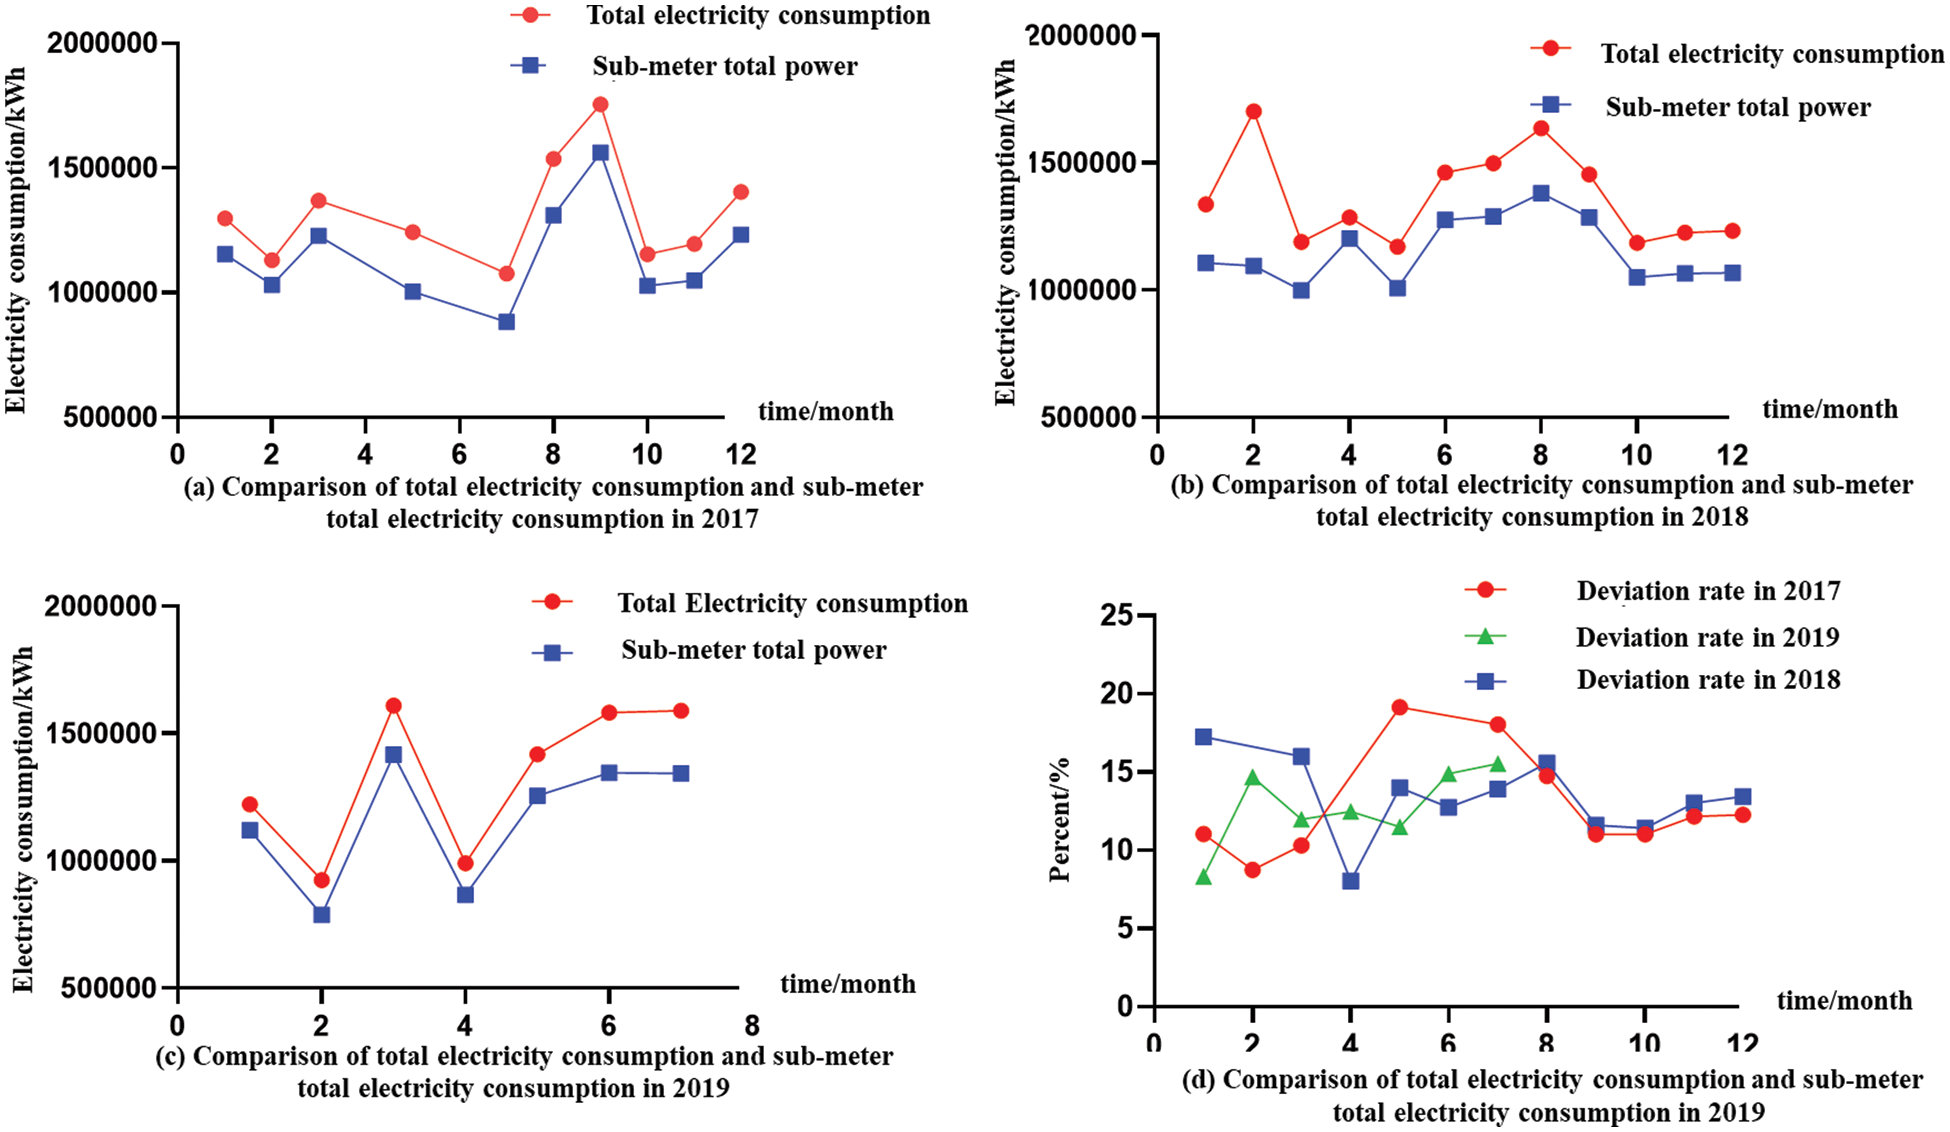
Figure 8: Comparison of total electricity consumption and sub-meter total electricity data from 2017 to 2019
As seen from Fig. 8, before and after the installation of photovoltaics, the monthly average electricity consumption did not increase significantly. The monthly average total electricity consumption in 2018 increased by 1.36% compared with 2017, and the monthly average sub-meter total electricity consumption increased by 0.78%. After installing photovoltaics (from March to December 2018), the monthly average total electricity consumption and the monthly average sub-meter total electricity consumption increased by 1.34% and 1.23%, respectively. From January to July 2019, the monthly average total electricity consumption and the monthly average sub-meter total electricity consumption increased by −2.29% and 0.88%, respectively, compared with 2018. The electricity consumption data for 2017 lacks data for April and June, and the data for 2019 ends in July. In summary, there is no abnormal increase in the average annual electricity before and after the installation of photovoltaics.
Table 12 lists the comparison of total electricity consumption in each month from 2017 to 2019. It can be seen from the data in the table that comparing the electricity data of each month, except for the electricity consumption in July 2017 compared to 2018 and 2019 by obvious differences, the remaining months have no large deviation, after consulting the city’s historical weather data, the minimum temperature in July 2018 exceeded 30°C for nine days, and the maximum temperature exceeded 37°C for 15 days; the minimum temperature in July 2017 exceeded 30°C for five days, and the maximum temperature exceeded 37°C for ten days, the summer temperature in 2018 is high, so the high summer temperature may cause the increase in electricity consumption in 2018 and 2019.
Based on the data analysis of the operating loss of distributed rooftop photovoltaics in XX Industrial Park, the conclusions are as follows:
1) From the perspective of the proportion of transformer losses in the off-grid power, since the off-grid power in 7 months of 2019 was only 45.6% of the total off-grid power in 2018, the transformer load rate decreased from 23.12% in 2018 to 15.74%, which in turn led to a slight increase in the percentage of off-grid transformation losses in total electricity consumption in 2019 compared with 2018. After theoretical analysis and data calculation, it can be determined that the change loss is stable after the photovoltaic is connected, and there is no additional loss of the transformer.
2) According to the electric energy metering data, the average monthly deviation rate in 2017 was 12.85%, and the average monthly deviation rate from March 2018 to December 2018 (when the photovoltaic system was connected) was 12.97%, and from January 2018 to December 2018. The annual average monthly deviation rate was 15.21%, and the average monthly deviation rate from January to July 2019 was 11.56%. There was no significant change in the total monthly data difference between the full meter and the sub-meter before and after installing the photovoltaic system.
3) The monthly average total electricity consumption in 2018 increased by 1.36% compared with 2017, and the monthly average sub-meter total electricity consumption increased by 0.78%. After installing photovoltaics (from March to December 2018), the monthly average total electricity consumption and the monthly average sub-meter total electricity consumption increased by 1.34% and 1.23%, respectively. In 2019, the monthly average total electricity consumption and the monthly average sub-meter total electricity consumption increased by −2.29% and 0.88%, respectively, compared with 2018. The electricity consumption data for 2017 lacks data for April and June, and the data for 2019 ends in July. From the data analysis results, it can be seen that before and after the installation of photovoltaics, there is no significant change in the electricity consumption of XX Industrial Park, and the benefits brought by photovoltaic power generation are apparent.
Funding Statement: This paper is partly supported by the State Grid Corporation of China Science and Technology Project (5216AG21000 K).
Conflicts of Interest: The authors declare that they have no conflicts of interest to report regarding the present study.
References
1. Fokui, W. S. T., Saulo, M. J., Ngoo, L. (2021). Optimal placement of electric vehicle charging stations in a distribution network with randomly distributed rooftop photovoltaic systems. IEEE Access, 9, 132397–132411. DOI 10.1109/ACCESS.2021.3112847. [Google Scholar] [CrossRef]
2. Al-Hilfi, H. A. H., Abu-Siada, A., Shahnia, F. (2021). Estimating generated power of photovoltaic systems during cloudy days using gene expression programming. IEEE Journal of Photovoltaics, 11, 185–194. DOI 10.1109/JPHOTOV.5503869. [Google Scholar] [CrossRef]
3. Confrey, J., Etemadi, A. H., Stuban, S. M. F., Eveleigh, T. (2020). Energy storage systems architecture optimization for grid resilience with high penetration of distributed photovoltaic generation. IEEE Systems Journal, 14, 1135–1146. DOI 10.1109/JSYST.4267003. [Google Scholar] [CrossRef]
4. Schiera, D. S., Minuto, F. D., Bottaccioli, L., Borchiellini, R., Lanzini, A. (2019). Analysis of rooftop photovoltaics diffusion in energy community buildings by a novel GIS-and agent-based modeling co-simulation platform. IEEE Access, 7, 93404–93432. DOI 10.1109/Access.6287639. [Google Scholar] [CrossRef]
5. Mathew, P., Madichetty, S., Mishra, S. (2019). A multilevel distributed hybrid control scheme for islanded DC microgrids. IEEE Systems Journal, 13, 4200–4207. DOI 10.1109/JSYST.4267003. [Google Scholar] [CrossRef]
6. Islam, M., Nadarajah, M., Hossain, M. J. (2019). Short-term voltage stability enhancement in residential grid with high penetration of rooftop PV units. IEEE Transactions on Sustainable Energy, 10, 2211–2222. DOI 10.1109/TSTE.5165391. [Google Scholar] [CrossRef]
7. Alam, M. J. E., Muttaqi, K. M., Sutanto, D. (2015). Alleviation of neutral-to-ground potential rise under unbalanced allocation of rooftop PV using distributed energy storage. IEEE Transactions on Sustainable Energy, 6, 889–898. DOI 10.1109/TSTE.2015.2415778. [Google Scholar] [CrossRef]
8. Eftekharnejad, S., Vittal, V., Heydt, G. T., Keel, B., Loehr, J. (2013). Impact of increased penetration of photovoltaic generation on power systems. IEEE Transactions on Power Systems, 28, 893–901. DOI 10.1109/TPWRS.2012.2216294. [Google Scholar] [CrossRef]
9. Cai, C., Aliprantis, D. C. (2013). Cumulus cloud shadow model for analysis of power systems with photovoltaics. IEEE Transactions on Power Systems, 28, 4496–4506. DOI 10.1109/TPWRS.2013.2278685. [Google Scholar] [CrossRef]
10. Alam, M. J. E., Muttaqi, K. M., Sutanto, D. (2013). Mitigation of rooftop solar PV impacts and evening peak support by managing available capacity of distributed energy storage systems. IEEE Transactions on Power Systems, 28, 3874–3884. DOI 10.1109/TPWRS.2013.2259269. [Google Scholar] [CrossRef]
11. Karunarathne, E., Wijethunge, A., Ekanayake, J. (2022). Enhancing PV hosting capacity using voltage control and employing dynamic line rating. Energies, 15, 134. DOI 10.3390/en15010134. [Google Scholar] [CrossRef]
12. Schultis, D. L., Ilo, A. (2021). Effect of individual volt/var control strategies in LINK-based smart grids with a high photovoltaic share. Energies, 14, 5641. DOI 10.3390/en14185641. [Google Scholar] [CrossRef]
13. Pinthurat, W., Hredzak, B. (2021). Distributed control strategy of single-phase battery systems for compensation of unbalanced active powers in a three-phase four-wire microgrid. Energies, 14, 8287. DOI 10.3390/en14248287. [Google Scholar] [CrossRef]
14. Peña Sánchez, E. U., Ryberg, S. D., Heinrichs, H. U., Stolten, D., Robinius, M. (2021). The potential of variable renewable energy sources in Mexico: A temporally evaluated and geospatially constrained techno-economical assessment. Energies, 14, 5779. DOI 10.3390/en14185779. [Google Scholar] [CrossRef]
15. Javed, H., Muqeet, H. A., Shehzad, M., Jamil, M., Khan, A. A. et al. (2021). Optimal energy management of a campus microgrid considering financial and economic analysis with demand response strategies. Energies, 14, 8501. DOI 10.3390/en14248501. [Google Scholar] [CrossRef]
16. Giambattista, G., Paolo, M. (2020). Data-driven uncertainty analysis of distribution networks including photovoltaic generation. International Journal of Electrical Power & Energy Systems, 121, 106043. DOI 10.1016/j.ijepes.2020.106043. [Google Scholar] [CrossRef]
17. Bai, L. Q., Xue, Y. S., Xu, G. L., Dong, J., Olama, M. M. et al. (2021). A data-driven network optimisation approach to coordinated control of distributed photovoltaic systems and smart buildings in distribution systems. IET Energy Systems Integration, 3, 285–294. DOI 10.1049/esi2.12025. [Google Scholar] [CrossRef]
18. Su, X., Liu, J., Tian, S., Ling, P., Fu, Y. et al. (2020). A Multi-stage coordinated volt-var optimization for integrated and unbalanced radial distribution networks. Energies, 13, 4877. DOI 10.3390/en13184877. [Google Scholar] [CrossRef]
19. Leou, R. C., Teng, J. H., Li, Y. F., Lin, W. M., Lin, Y. H. (2020). System unbalance analyses and improvement for rooftop photovoltaic generation systems in distribution networks. Energies, 13, 1996. DOI 10.3390/en13081996. [Google Scholar] [CrossRef]
20. Kuruseelan, S., Vaithilingam, C. (2019). Peer-to-peer energy trading of a community connected with an AC and DC microgrid. Energies, 12, 3709. DOI 10.3390/en12193709. [Google Scholar] [CrossRef]
21. Alrawi, O., Bayram, I. S., Al-Ghamdi, S. G., Koc, M. (2019). High-resolution household load profiling and evaluation of rooftop PV systems in selected houses in Qatar. Energies, 12, 3876. DOI 10.3390/en12203876. [Google Scholar] [CrossRef]
22. Abujubbeh, M., Fahrioglu, M., Al-Turjman, F. (2021). Power loss reduction and voltage enhancement via distributed photovoltaic generation: Case study in North Cyprus. Computers & Electrical Engineering, 95, 107432. DOI 10.1016/j.compeleceng.2021.107432. [Google Scholar] [CrossRef]
23. Alzahrani, A., Alharthi, H., Muhammad, K. (2019). Minimization of power losses through optimal battery placement in a distributed network with high penetration of photovoltaics. Energies, 13, 140. DOI 10.3390/en13010140. [Google Scholar] [CrossRef]
Cite This Article
 Copyright © 2023 The Author(s). Published by Tech Science Press.
This work is licensed under a Creative Commons Attribution 4.0 International License , which permits unrestricted use, distribution, and reproduction in any medium, provided the original work is properly cited.
 Downloads
 Citation Tools