 Open Access
ARTICLE
Revolutionizing Tight Reservoir Production: A Novel Dual-Medium Unsteady Seepage Model for Optimizing Volumetrically Fractured Horizontal Wells
1
School of Geosciences, Yangtze University, Wuhan, 430100, China
2 Downhole Service Company, Petro China Qinghai Oilfield Company, Haixi, 817000, China
3 Drilling and Production Technology Research Institute, Petro China Qinghai Oilfield Company, Haixi, 817000, China
* Corresponding Author: Xinyu Zhao. Email:
Energy Engineering 2023, 120(12), 2933-2949. https://doi.org/10.32604/ee.2023.041580
Received 28 April 2023; Accepted 21 June 2023; Issue published 29 November 2023
Abstract
This study presents an avant-garde approach for predicting and optimizing production in tight reservoirs, employing a dual-medium unsteady seepage model specifically fashioned for volumetrically fractured horizontal wells. Traditional models often fail to fully capture the complex dynamics associated with these unconventional reservoirs. In a significant departure from these models, our approach incorporates an initiation pressure gradient and a discrete fracture seepage network, providing a more realistic representation of the seepage process. The model also integrates an enhanced fluid-solid interaction, which allows for a more comprehensive understanding of the fluid-structure interactions in the reservoir. This is achieved through the incorporation of improved permeability and stress coupling, leading to more precise predictions of reservoir behavior. The numerical solutions derived fromnite element method, ensuring high accuracy and computational effciency. To ensure the model’s reliability and accuracy, the outcomes were tested against a real-world case, with results demonstrating strong alignment. A key revelation from the study is the significant difference between uncoupled and fully coupled volumetrically fractured horizontal wells, challenging conventional wisdom in the field. Additionally, the study delves into the effects of stress, fracture length, and fracture number on reservoir production, contributing valuable insights for the design and optimization of tight reservoirs. The findings from this study have the potential to revolutionize the field of tight reservoir prediction and management, offering significant advancements in petroleum engineering. The proposed approach brings forth a more nuanced understanding of tight reservoir systems and opens up new avenues for optimizing reservoir management and production.Keywords
In recent years, the proportion of new proven reserves in sand conglomerate reservoirs has been increasing every year, and the development of sand conglomerate reservoirs is gradually gaining attention. A conglomerate is a rock formed by the sedimentation of rock fragments, which mainly consists of a matrix connecting the pebbles in the conglomerate and the pebbles compacted in the conglomerate. Due to its dense lithology and low permeability, large-volume fracturing is required to open the oil and gas seepage channel when exploiting the conglomerate reservoir.
Analytical models for predicting the volumetric production of fractured horizontal wells are typically based on more assumptions. Trilinear flow models have been pioneered in fractured horizontal well seepage studies [1]. A practical solution for the pressure transient response of fractured horizontal wells in unconventional reservoirs based on trilinear seepage models considering unconventional oil and gas seepage characteristics has been proposed [2]. An analytical model for fracture optimization was developed by modeling the physics of multiple lateral hydraulically fractured fractures in horizontal wells [3].
Modified hyperbolic decline, power-law exponential decline, stretched exponential decline, Duong’s method, and logistic growth model have been developed to predict production in shale reservoirs. However, they are all based on empirical observations of a particular scenario. To quantify their differences, different methods of history matching for production of unconventional hydraulically fractured reservoirs were investigated by forecasting future production and predicting EURs [4]. A mathematical model has been developed [5], Stimulated Reservoir Volume (SRV) by simulating the shale fracturing process. It is shown that multiple fractures propagate simultaneously, perturbing formation stresses and increasing reservoir pressures. The SRV is estimated from the volume of the natural fracture zone where tensile or shear damage occurs. The SRV is estimated from the volume of the natural fracture zones where tensile or shear failure occurs. Using variable-width conductivity fractures as the basic flow units, a mathematical model of flow with numerous horizontal wells was developed that accounts for well-fracture interference [6]. Simulations show that for the same perforation clusters, refracturing between existing fracture sections, orientation diversion within fractures, extended refracturing, and refracturing of existing fractures contribute the most to productivity from large to small; and the later the refracturing time, the shorter the effective time.
Based on this, the fracture pressure prediction model, which considers the variation of formation pressure, was used to determine the variation pattern of fracture pressure at different production periods and locations [7]. To investigate the contribution of microfractures to well productivity and the influence of dynamic capillary pressure on oil-water phase flow in tight oil reservoirs, a semi-analytical model is presented and solved by considering hydraulic fracture interference. This research aims to provide an integrated apparent permeability model for multiscale seepage mechanisms [8]. Nguyen et al. [9] proposed a semi-analytical multiphase method applicable to the study of water return and early gas production data of multi-fractured horizontal gas wells. As a result of conglomerates, seepage properties become more complex, and predicting production following volume fracturing is challenging. To tackle this problem, a two-component unsteady seepage model was designed to account for both matrix seepage and distinct fracture network seepage, taking into consideration the triggering pressure gradient [10]. In order to examine the near-well seepage behavior of volume fractured horizontal wells in unconventional tight formations, a regional production forecasting model for these wells in tight reservoirs has been constructed, drawing on the physical model of volume fractured horizontal wells [11].
Its seepage properties are more complex due to the presence of conglomerate, and its production after volume fracturing is difficult to predict. The presence of conglomerates complicates seepage properties within geological formations due to factors such as heterogeneity, anisotropy, irregular pore spaces, tortuosity, and variable cementation. These characteristics result in complex and unpredictable fluid flow patterns, making it challenging to accurately model and predict seepage behavior. Zeng et al. [12] investigated the effect of fracturing on the formation of sandstone reservoirs with limited permeability. The Warren & Root model describes an infinitely tight fractured reservoir with vertical hydraulic fractures [13]. Vogler et al. [14] investigated the feasibility of replicating real rock specimens to analyze rock mechanical behavior by subjecting several similar specimens to tensile tests and various analyses [15]. Using semicircular bend (SCB) specimens, the effect of temperature on the mixed mode (I + II) and mode II fracture toughness of sandstone is investigated to analyze its fracture toughness. Considering the deterioration process of sandstone’s bond strength, the reported strength decrease was successfully reproduced using Particle Flow Code 3D. For the same type of reservoir, the stimulation effect was superior to the standard horizontal well fracturing method, the production was higher, and the stable production period was longer. The fracturing effect of this reservoir was enhanced by Wu et al. [16]. The cracking behavior from the tip of an artificial notch during straight through notch SCB and cracked chevron notch SCB tests is investigated by the extended finite element method (XFEM) using the commercial finite element software ABAQUS to elucidate the crack front geometry during the cracking process [17].
Adopt core experiment and theoretical analysis method, combined with fracture engineering geological characteristics and design parameters, to analyze the fracture penetration criterion and investigate the effect of design factors and reservoir geological characteristics on the law of fracture penetration [18]. Obara et al. [19] investigated the effect of acidic brine on the displacement of an artificial fracture under stress in dolomitic and clay-cemented Bandera Gray sandstone. Zhang et al. [20] obtained the transient analytical solutions of both the fluid pressure drop generated by the artificial barrier and the equivalent permeability between the artificial barrier and the reservoir at various positions of the hydraulic fracture tips, elucidating the parameters that influence the plugging effect of the diverting agent on the tips. The complicated lithological properties of sand aggregates and the influence of fluid-solid coupling on the production during the production process have been the subject of only a few studies. There are more studies on the production change after volume fracturing of horizontal wells in conventional tight reservoirs [21,22]. However, there are fewer studies on the complex lithological characteristics of the tight reservoirs themselves and the effect of fluid-solid coupling on production. No improvements have been made to the fluid-solid coupling effect that distinguishes tight reservoirs from conventional reservoirs, and there are problems in accurately describing the production law of actual sand and gravel reservoirs where fluid-solid coupling exists.
This paper uses the established volumetric fractured horizontal well model as a foundation. The actual flow-solid coupling effect on production is considered, and the permeability-stress coupling relationship of tight is improved to make the model results more realistic.
Based on previous studies, it is believed that the reservoir area for a general volumetric fractured horizontal well consists of two parts: the reservoir matrix-naturally fractured (unmodified) zone, and the artificially fractured (modified) zone [23]. In this study, the concept of a dual-medium system is employed to accurately model fluid flow behavior, wherein fractures serve as high-permeability pathways and the matrix acts as a low-permeability storage medium.
Assumed conditions: (1) Block reservoir, thickness h. (2) Outer boundary is closed and natural fractures exist. (3) Rock and fluid are slightly compressible. (4) Seepage process does not consider the effect of gravity and temperature change.
2.1 Mathematical Model of Seepage Flow in Fractured Horizontal Wells
The matrix system considers the initiation pressure gradient and the fluid equation of motion is
where
where
Taking into account the equation of motion (1) and the equation of state (2) for structuring, and incorporating the damping flow, the resulting differential equation governing the single-phase, slightly compressible fluid seepage in the matrix can be derived as follows:
where
Within an artificial fracture, the fluid seepage in it obeys Darcy’s law, so its controlling equation can be expressed as
where
The matrix pressure boundary condition is the second type of boundary condition, and the crack system pressure boundary equals the matrix pressure boundary.
2.2 Fractured Horizontal Well Stress Field Model
The following assumptions are made: (1) the rock undergoes deformation as a porous medium; (2) rock particles are incompressible while particle pores are compressible; (3) temperature change effects on rock deformation are disregarded; (4) rock deformation exhibits elastic-plastic minor deformation; (5) the pore compressibility factor is variable. The stress field’s mathematical model primarily includes the current constitutive equations, geometric equations, equilibrium differential equations, and boundary solution conditions.
In this paper, the elastic-plastic intrinsic equation is used to describe the stress and strain intrinsic relationships during the stressing of the rock, and the tensor expression is
where
The geometric relationship equation mainly refers to the relationship between displacement and strain during the deformation of reservoir rocks. The following tensor form describes it:
where
The following equation can express the equilibrium differential equation for a unitary body’s stress and volume force:
where fi is the volume force on one side;
2.3 Seepage Field-Stress Field State Cross-Coupling Model
To establish the dynamic interrelation between permeability and stress in tight reservoirs, this study incorporates three key parameters: Poisson’s ratio, initial permeability and Young’s modulus [10].
where
The coupled model for the permeability and effective stress of the target layer is
where
The porosity deformation of a tight reservoir is more complex, and the coupled model of porosity in this paper is
where
The oil-water two-phase flow simulation of shale reservoirs can be realized by solving sequentially.
This paper solves the above equations by substituting them into COMSOL Multiphysics software. The fractured horizontal well in a conglomerate reservoir is numerically simulated with a reservoir size of 1000 * 800 m2, a fracture network cluster spacing of 30 m, half-length, and bandwidth of 200 and 8 m. The volume fracture zone is encrypted and refined, the maximum cell size at the fracture face is set to 0.1 m, and the flow pressure at the bottom of the horizontal well is set to 20 MPa. The actual reservoir geological parameters and horizontal well data in the model are adopted from the actual destination block data. The grid outline is shown in Fig. 1. The number of grids after triangular dissection is 11093. The relevant parameters are shown in Tables 1 and 2.
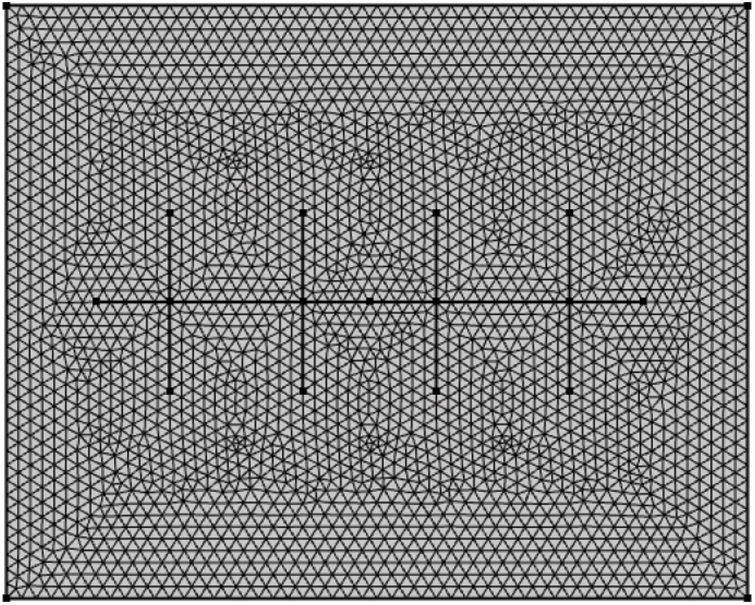
Figure 1: Geometric model diagram


The parameters were substituted into the model and solved for the pressure variation, as shown in Fig. 2. The magnitude of pressure variation is horizontal well near wellbore area > volumetric fracture modified zone > matrix unmodified zone. Meanwhile, the change in formation fluid flow rate is shown in Fig. 3, and the arrows in the figure reflect the direction of formation fluid flow. Looking at the broader perspective, fluid flow in the reservoir initially takes place in the vicinity of the wellbore, where the flow rate is more rapid. The fluid flows away from the fracture modification zone and matrix recharge inflow fluid and into the wellbore, and the whole formation fluid flow is oval around the horizontal wellbore.
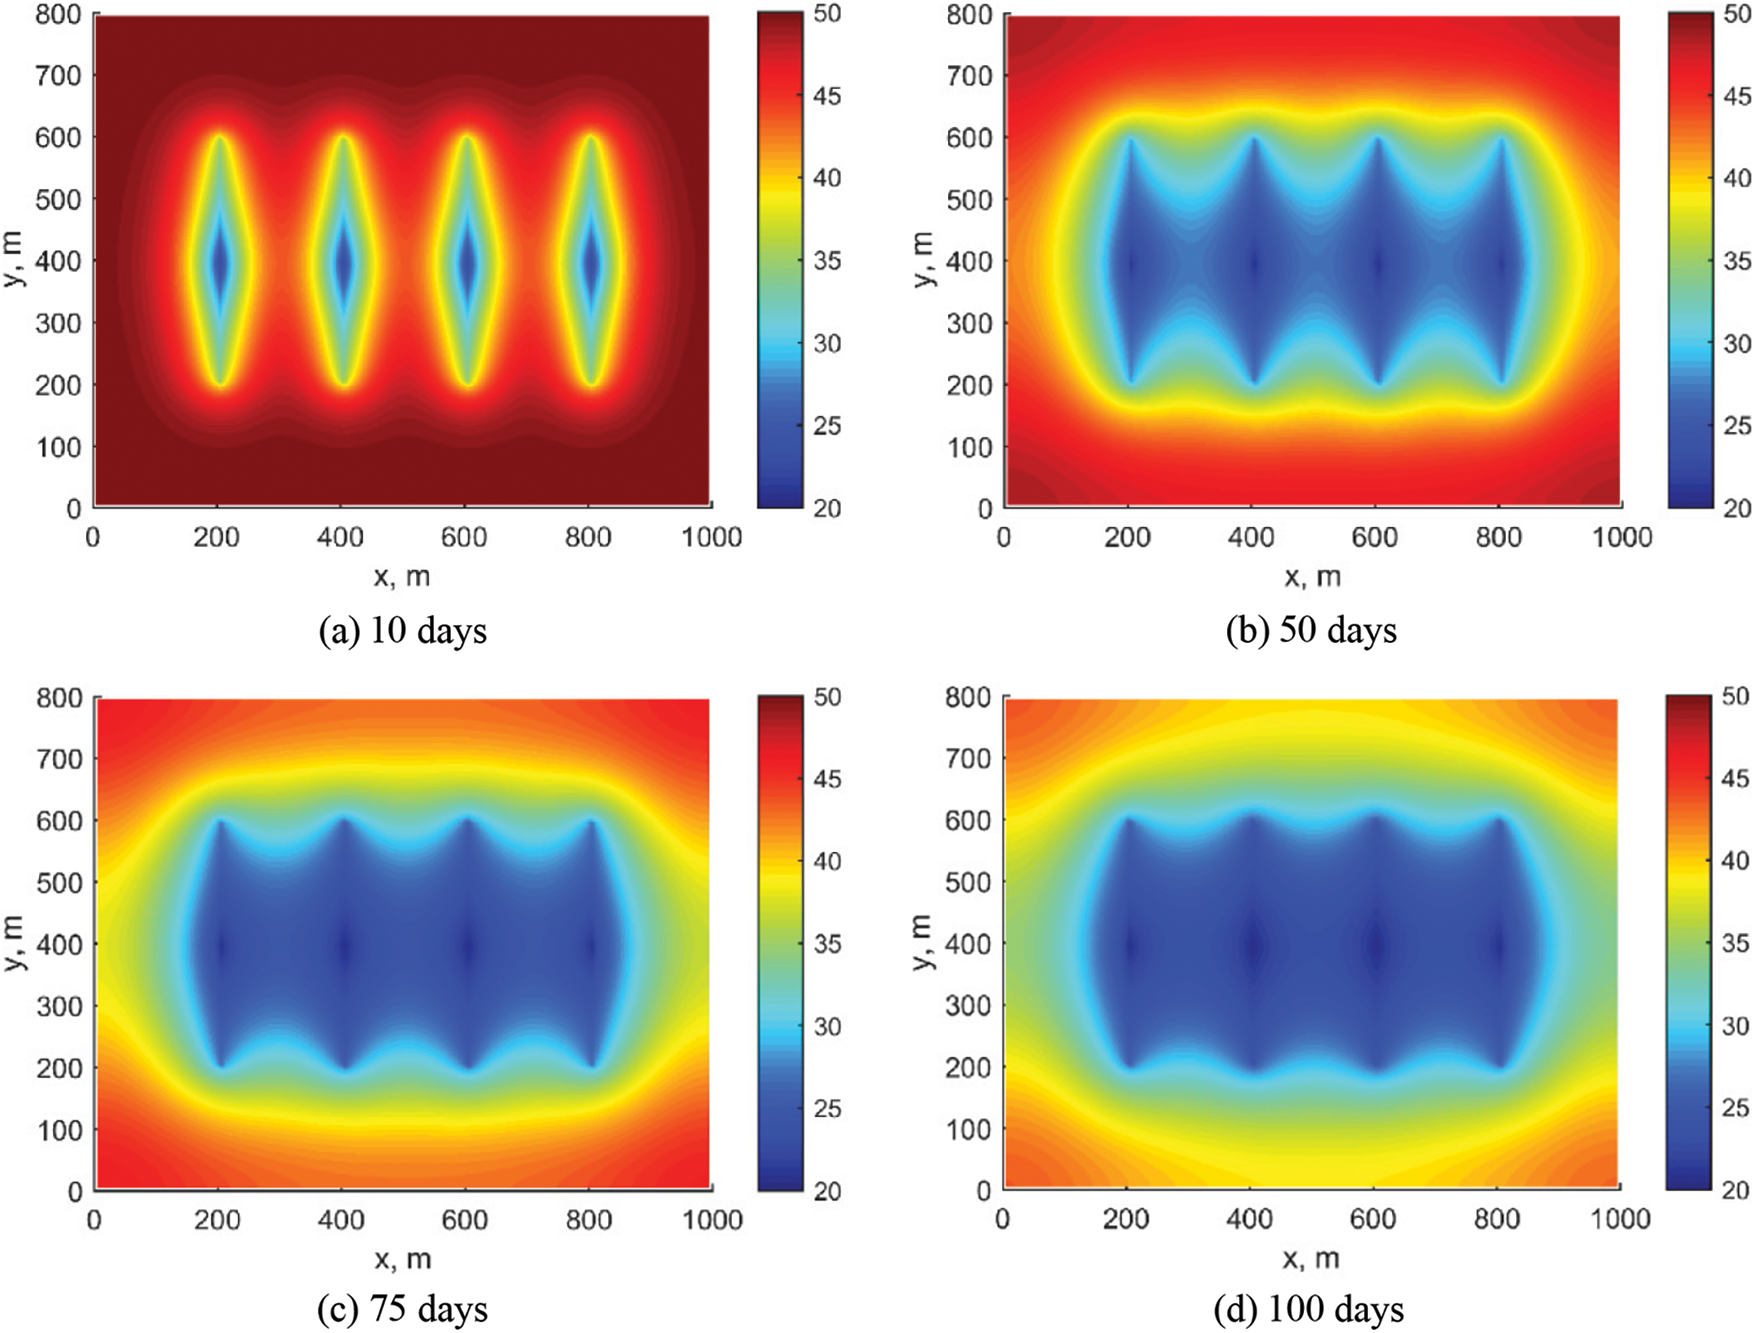
Figure 2: Pressure
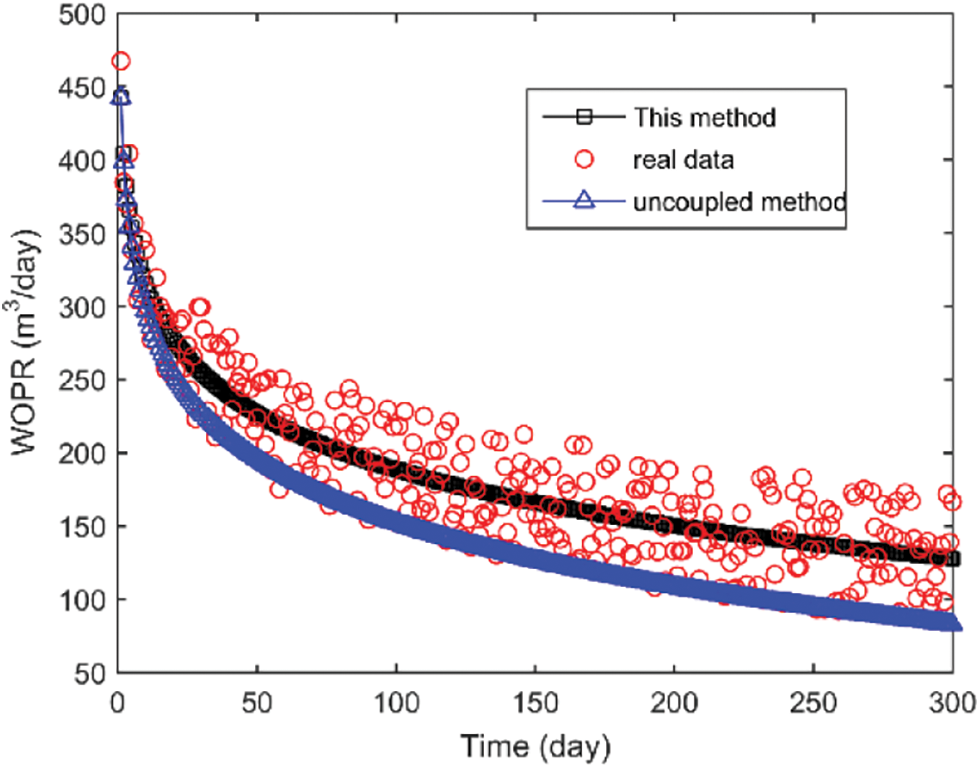
Figure 3: Daily oil production rate
The actual production curves of the well were fitted for comparative analysis, as shown in Fig. 3. The correlation coefficient between the results considering fluid-solid coupling and real data is 0.91, while the coefficient for the curve without considering coupling is 0.88. The figure demonstrates that the actual daily oil production and the simulation outcomes from the fluid-solid coupling model have a smaller margin of error. This is more precise than conventional numerical simulators that do not account for fluid-solid coupling. Consequently, the fluid-solid coupling model for fractured horizontal wells in sand and gravel reservoirs, as developed in this study, can be employed to forecast production changes in horizontal wells within real-world fields.
4.1 Effect of Stress Sensitivity
The fluid-solid coupling model for tight reservoirs, established earlier, reveals that the primary influence on fluid-solid coupling in the reservoir stems from alterations in pore permeability properties due to pressure fluctuations during the production process. Among these factors, permeability changes are more significant. The effective stress sensitivity factor is a parameter that represents the impact of stress variations on permeability, taking into account the comprehensive rock mechanical properties of the tight reservoir. Using the developed model, a single-factor analysis is conducted with actual parameters while maintaining flow pressure at 20 MPa and keeping other parameters constant. Fractures are set as inclined fractures. The simulation assesses the influence on oil production for various stress sensitivity coefficient scenarios.
As shown in Fig. 4, well oil production rate (WOPR) decreases as the stress sensitivity factor increases. As illustrated in Fig. 5, this is mainly because reservoir permeability, especially the initial permeability of the SRV zone modified by volume fracturing, is higher due to stress effects. With stress changes, permeability loss is larger, resulting in reduced production. Within the parameter range provided in this paper, the impact of the stress sensitivity factor is not significant at the beginning of production. However, approximately 50 days after production, the stress sensitivity coefficient ranges from 0.02 to 0.08 MPa−1, with production decline noticeably slower at 0.02 MPa−1. Fig. 6 presents the pressure distribution maps at 100 days under these four stress sensitivity coefficients. It can be observed that the higher the stress sensitivity coefficient, the more pronounced the pressure at the matrix. Hence, throughout the production process, managing stress sensitivity is essential to minimize the influence of fluid-solid coupling effects on production.

Figure 4: WOPR under different effective stress sensitivity factors

Figure 5: FOPT under different effective stress sensitivity factors
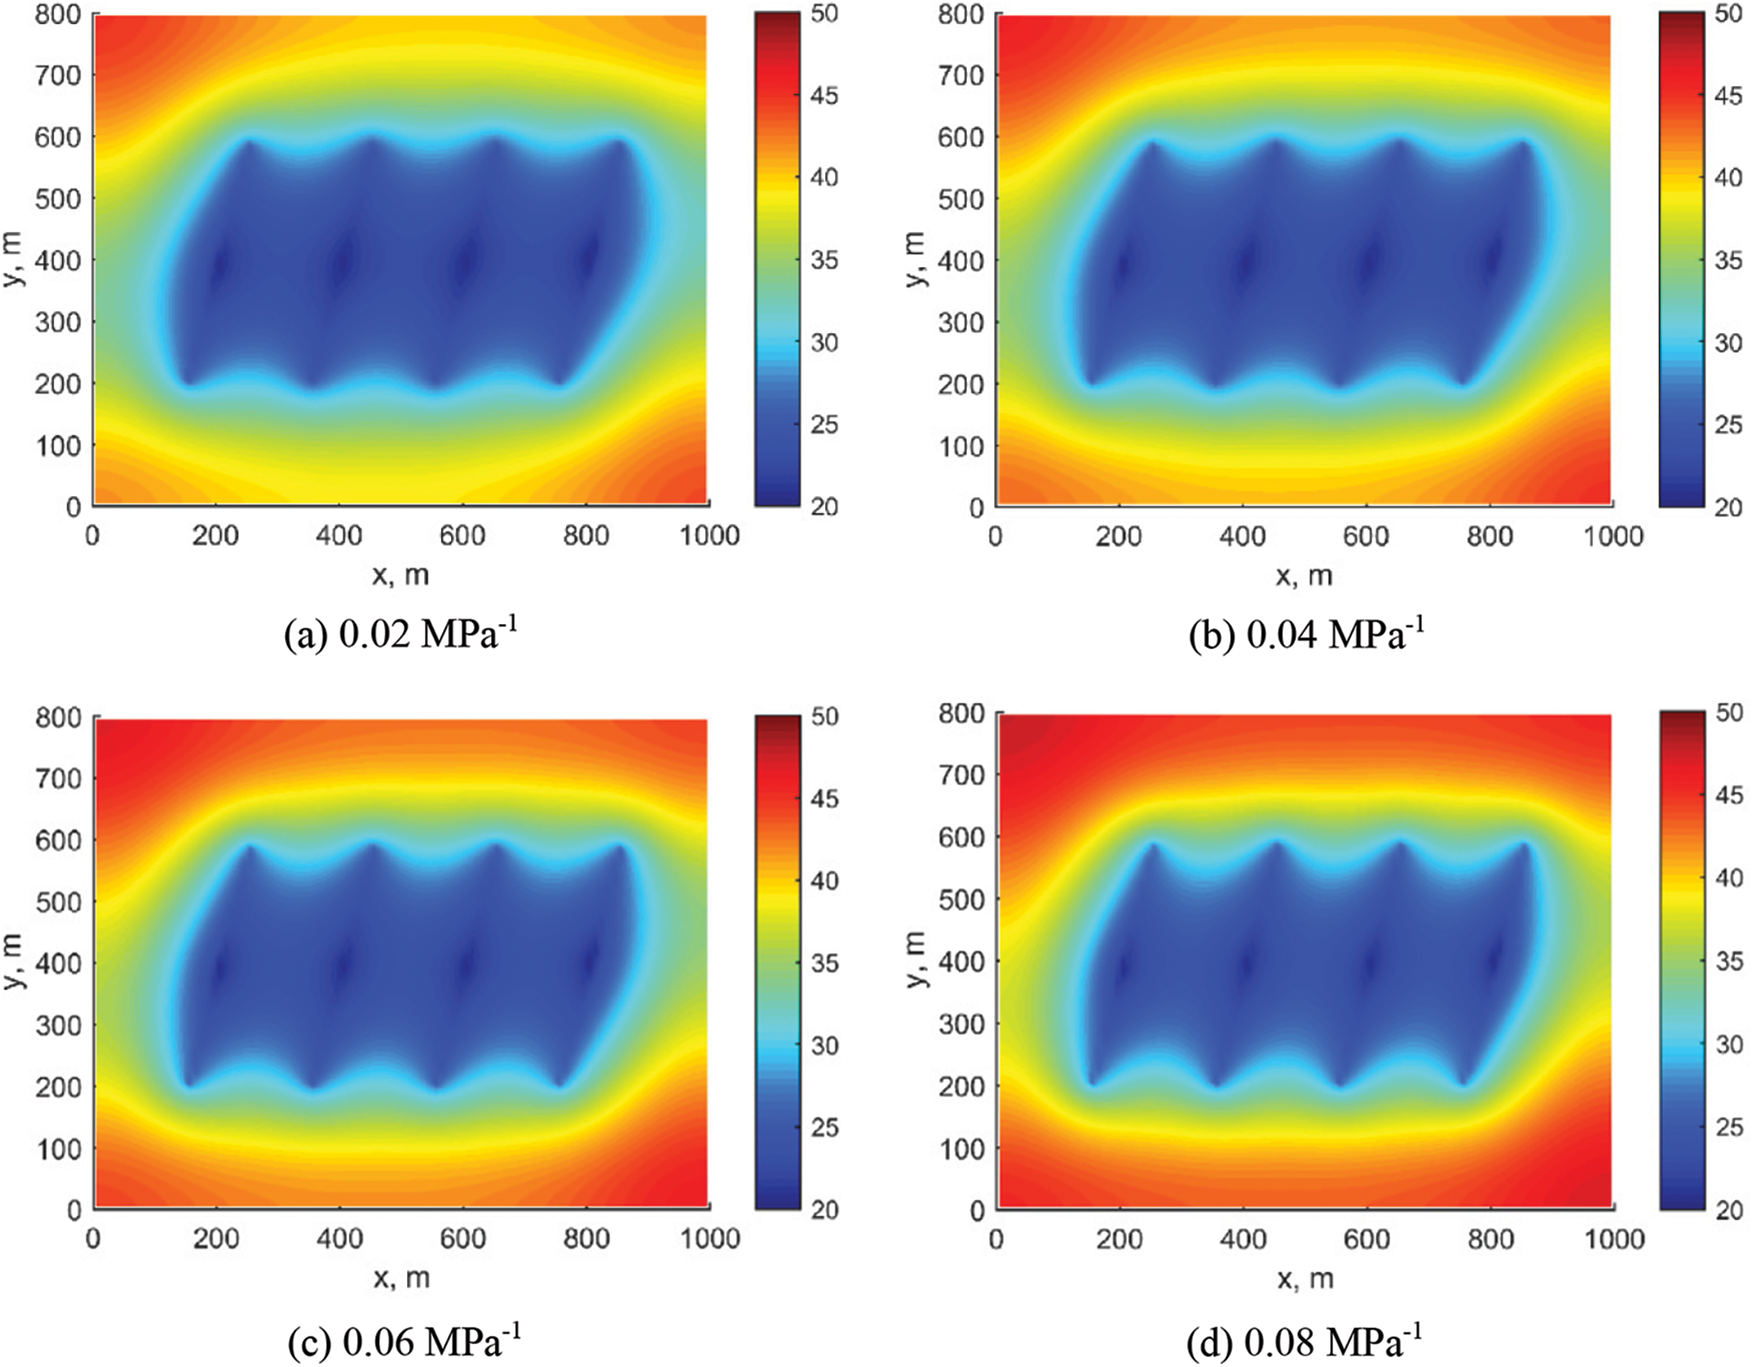
Figure 6: Pressure distribution under varying stress sensitivity factors
4.2 Effect of Fracture Half-Length
Volume-based hydraulic fracturing in horizontal wells forms an SRV (Stimulated Reservoir Volume) zone around the wellbore, allowing for the production of a large volume of fluids. The size of the SRV zone significantly impacts production. By extending the fracture length, the reservoir area can be effectively expanded, greatly influencing the production rate of horizontal wells.
Fig. 7 demonstrates that the FOPT substantially increases as the fracture half-length grows. However, as the fracture length increases linearly, the rise in cumulative oil production diminishes. For instance, the FOPT increases by 6000 m3 when the fracture half-length expands from 100 to 150 m, but only by 2700 m3 when it extends from 200 to 250 m. Fig. 8 indicates that at 300 days, the matrix pressure drops to around 25 MPa when the fracture half-length is 250 m, while it remains at approximately 32 MPa when the half-length is 100 m. It is evident that the initial oil production rate is higher with a longer fracture half-length. However, due to the rapid pressure decline, the stabilization period for production is also shorter. Given the economic costs of oil field fracturing, there is potential for optimizing the fracture length.

Figure 7: FOPT with different fracture half-length cases
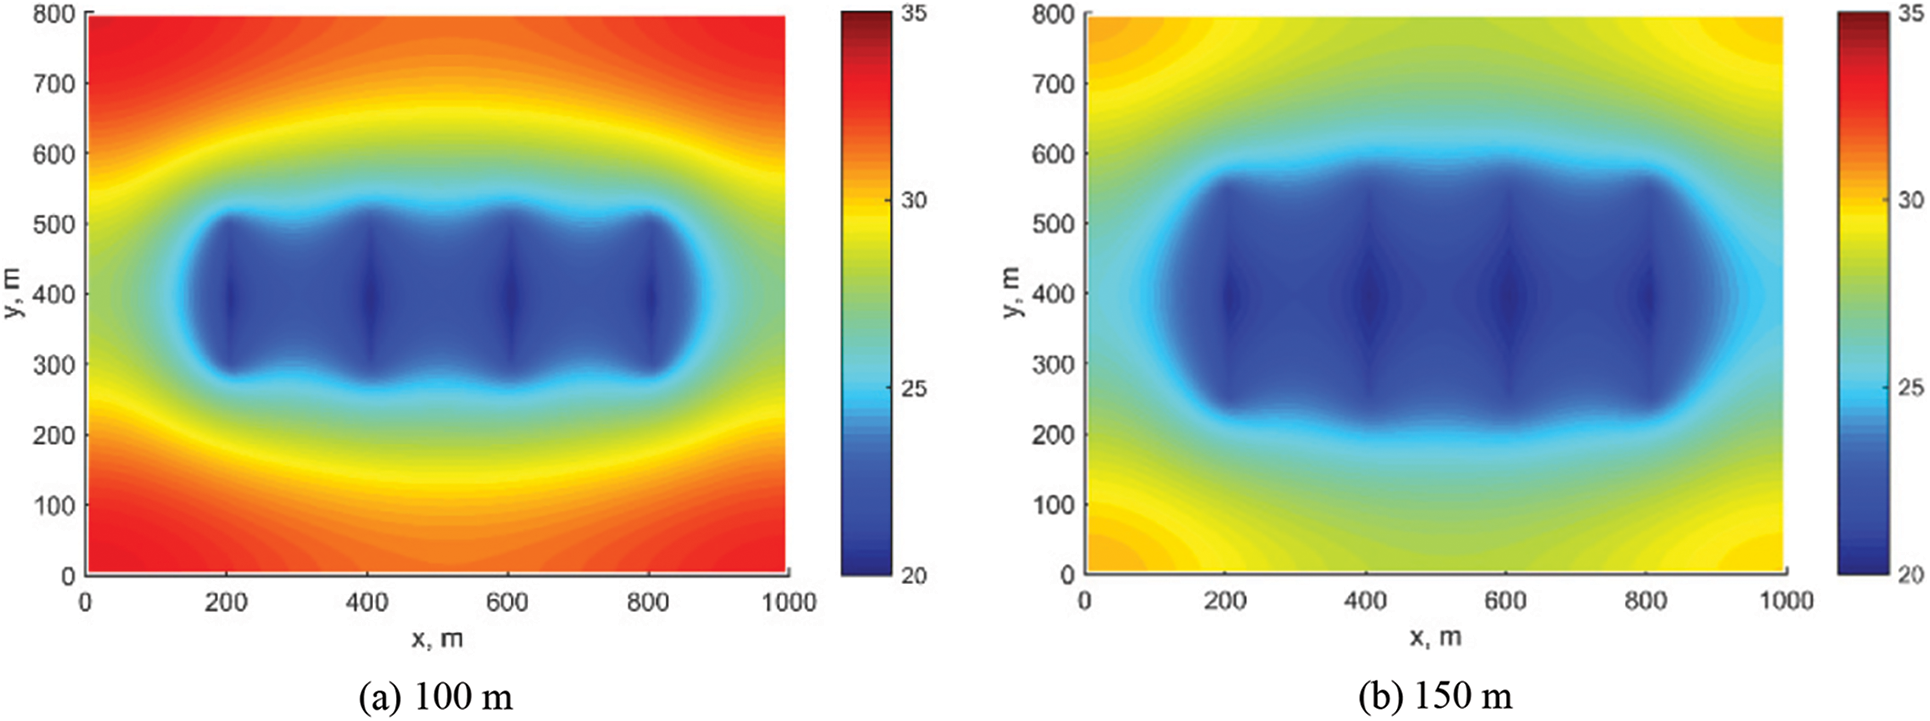
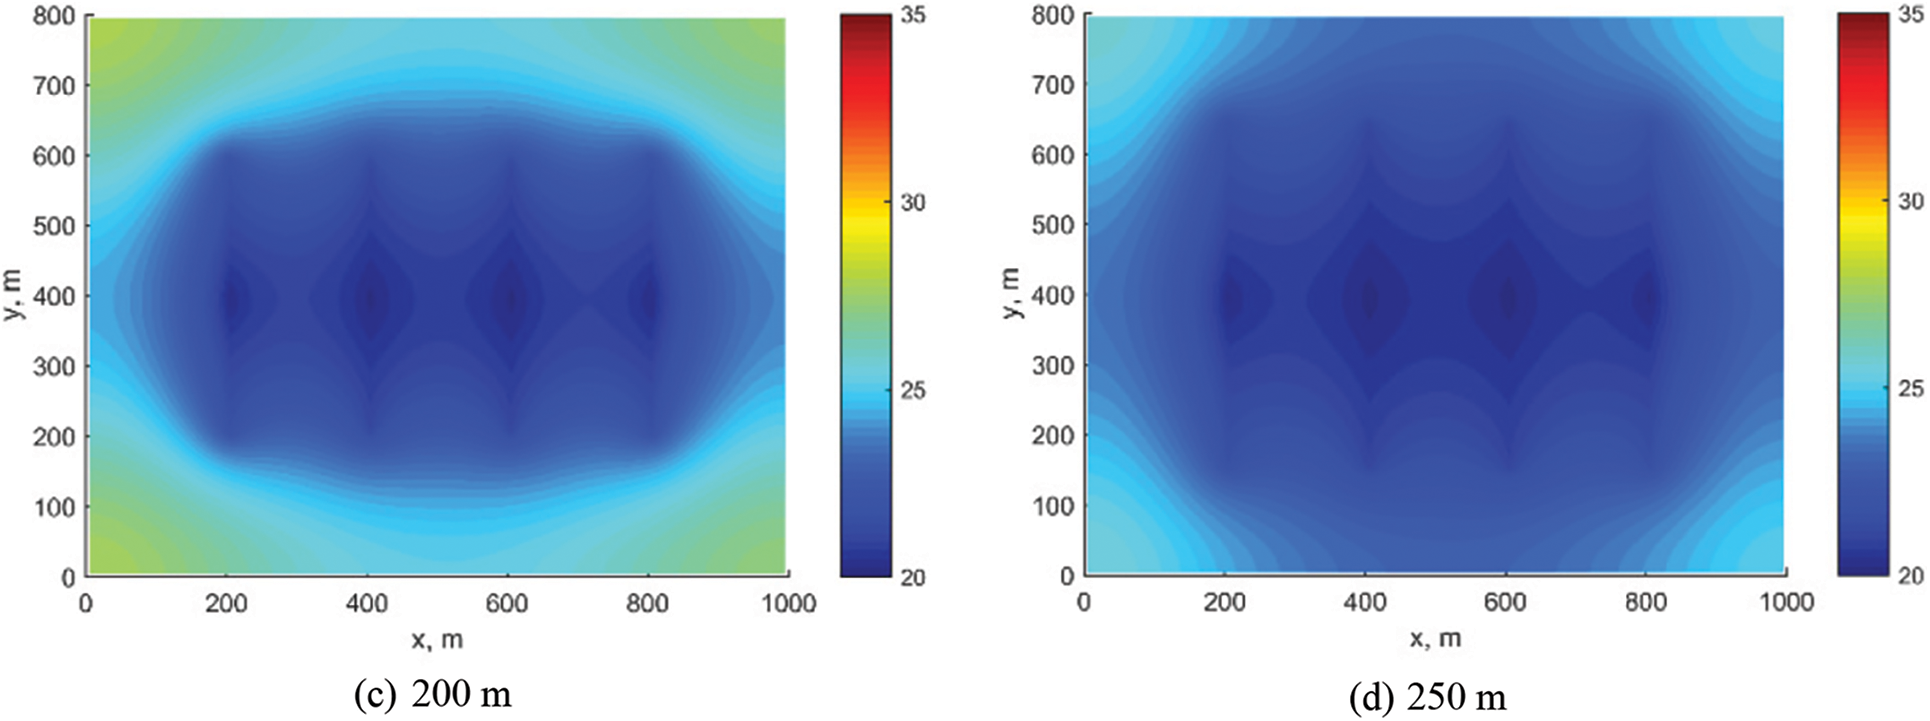
Figure 8: Pressure distribution under different fracture half-length
The size of the SRV zone has a significant impact on production, and the number of fractures is another crucial parameter controlling the size of the SRV zone. By creating more fractures, the seepage around the wellbore can be effectively enhanced, offering considerable advantages for initial oil production. Nevertheless, in cases where the length of horizontal well sections is limited, increasing the number of fractures may cause interference issues between fractures, affecting the production of horizontal wells. Therefore, the changes in production are studied by constructing different numbers of fractures.
As illustrated in Figs. 9 and 10, the number of fractures has a more considerable influence on the early production of horizontal wells. This is likely because, during the initial production phase of horizontal wells, crude oil is mainly supplied from the SRV zone to the horizontal wellbore, while it comes from the reservoir matrix at later number. The unaltered reservoir matrix has low seepage conditions, leading to relatively weaker oil supply production and minor differences in daily output during later fracture number. Nevertheless, even though the total number of fractures per increases linearly, the growth in cumulative production decreases. With 4 and 5 fracture number, the production remains relatively stable. When the number of fracture bars increased from 2 to 3, the cumulative oil production increased by 6,000 m3, an increase of 12.5%. In contrast, when the number of fractures increased from 4 to 5, the cumulative oil production increased by only 1000 m3, an increase of only 1.8%.

Figure 9: WOPR with different fracture number

Figure 10: FOPT with different fracture number
As observed from the pressure distribution comparison in Fig. 11, the decline in matrix pressure becomes more noticeable with an increasing number of fractures. However, when the number of fractures is 4 or 5, the matrix pressure remains around 28 MPa.
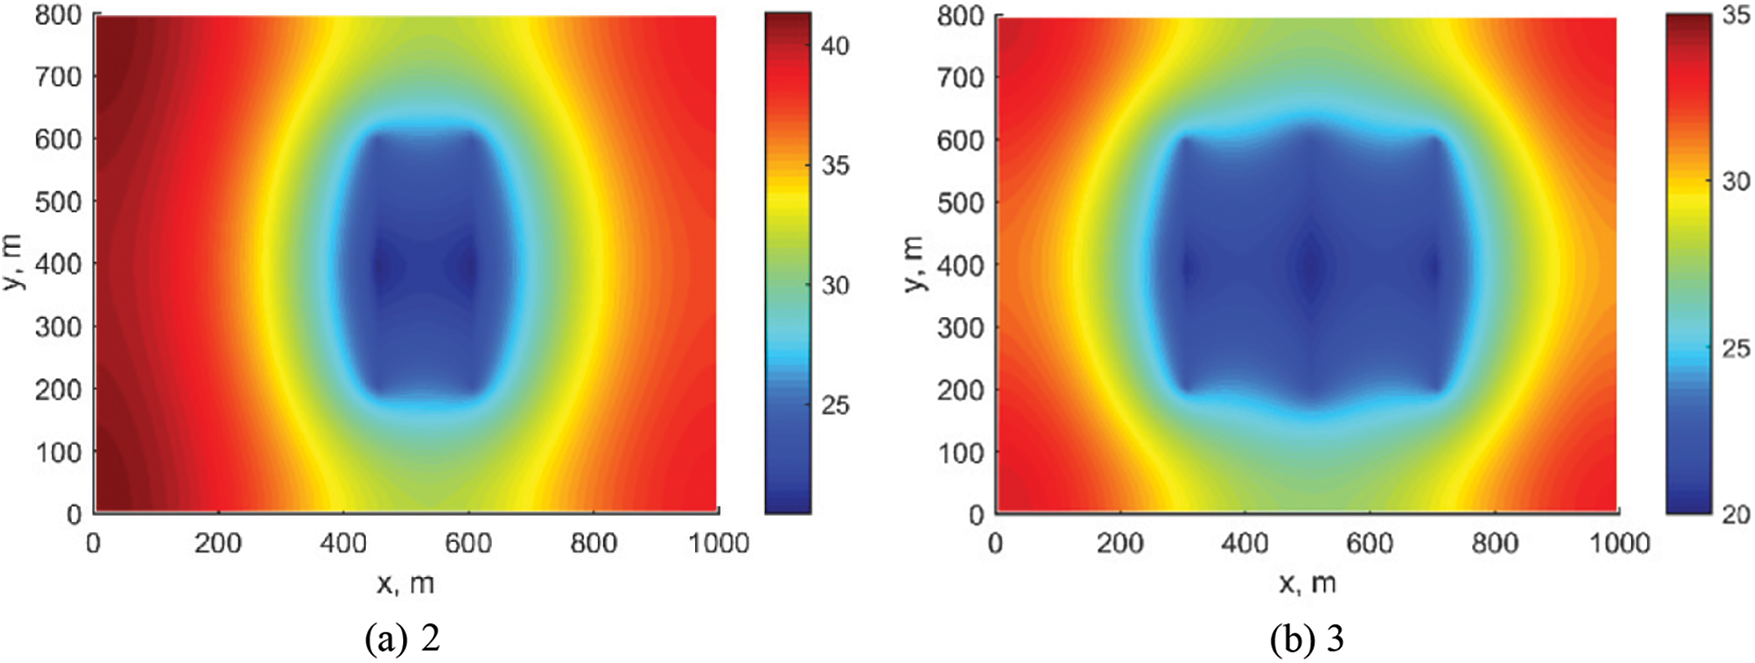

Figure 11: Pressure distribution under different fracture number
4.4 Effect of Matrix Permeability
Alongside stress sensitivity, fracture half-length, and the number of fractures, permeability stands as a pivotal geological parameter impacting fluid dynamics within the reservoir. In Section 4.4, we extend our sensitivity analysis to explore the influence of matrix permeability on well productivity and reservoir behavior.
As demonstrated in Fig. 12, variations in WOPR are distinctly observable at different matrix permeabilities. Specifically, WOPR shows a marked increase when matrix permeability transitions from 1 to 2 mD but begins to plateau beyond 3 mD, indicating diminishing returns at higher permeabilities. Fig. 13 elucidates the impact on FOPT, wherein a 1 mD increase in permeability results in a 5% enhancement in cumulative oil production. The pressure distribution field, depicted in Fig. 14, reveals that higher permeability levels lead to a more even pressure distribution across the reservoir, thus potentially alleviating issues related to pressure drops. These findings corroborate the pivotal role of matrix permeability alongside other geological parameters like stress sensitivity, fracture half-length, and fracture numbers. Given these observations, a strategic manipulation of matrix permeability could serve as a significant lever in optimizing well design and reservoir management.
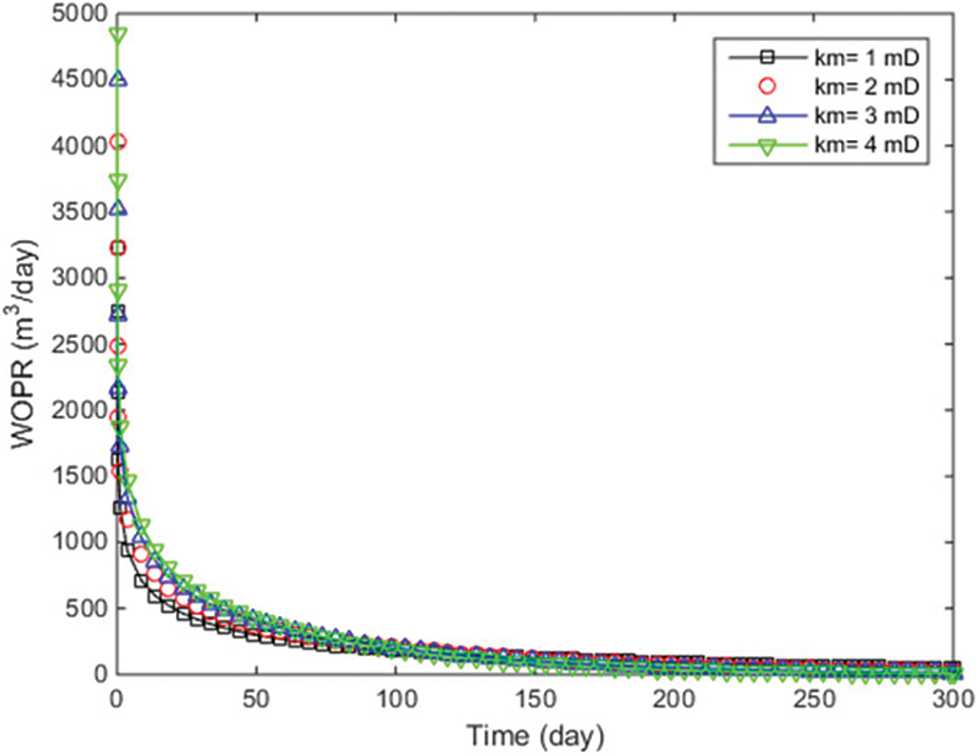
Figure 12: WOPR with different matrix permeability
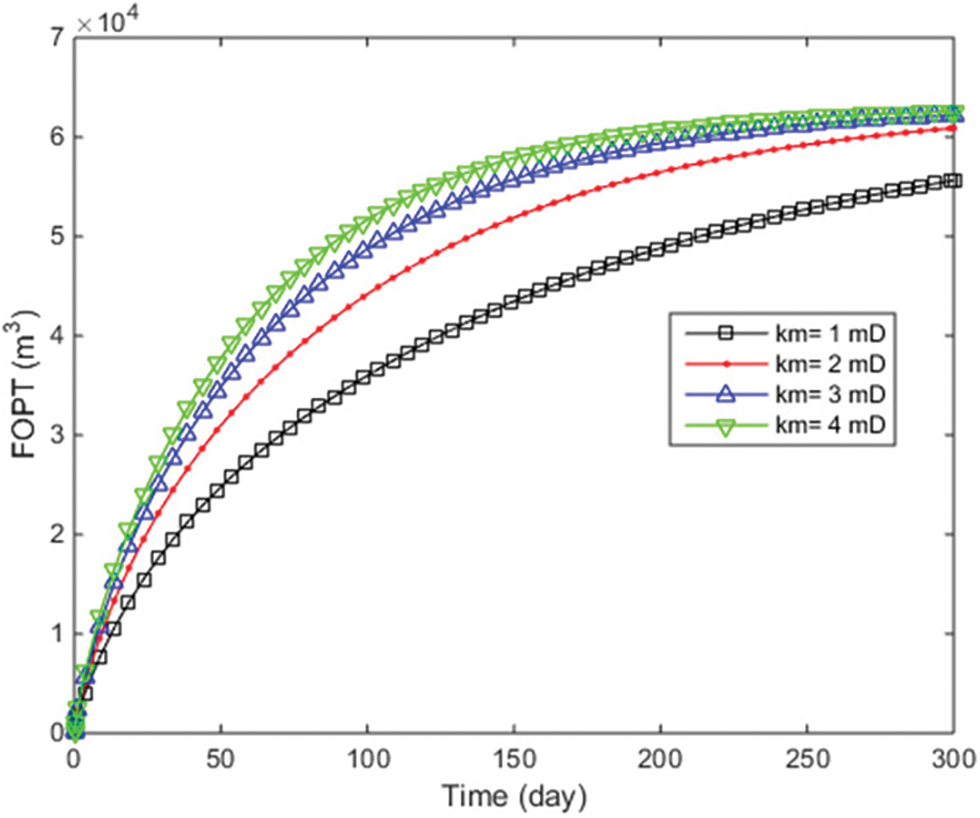
Figure 13: FOPT with different matrix permeability
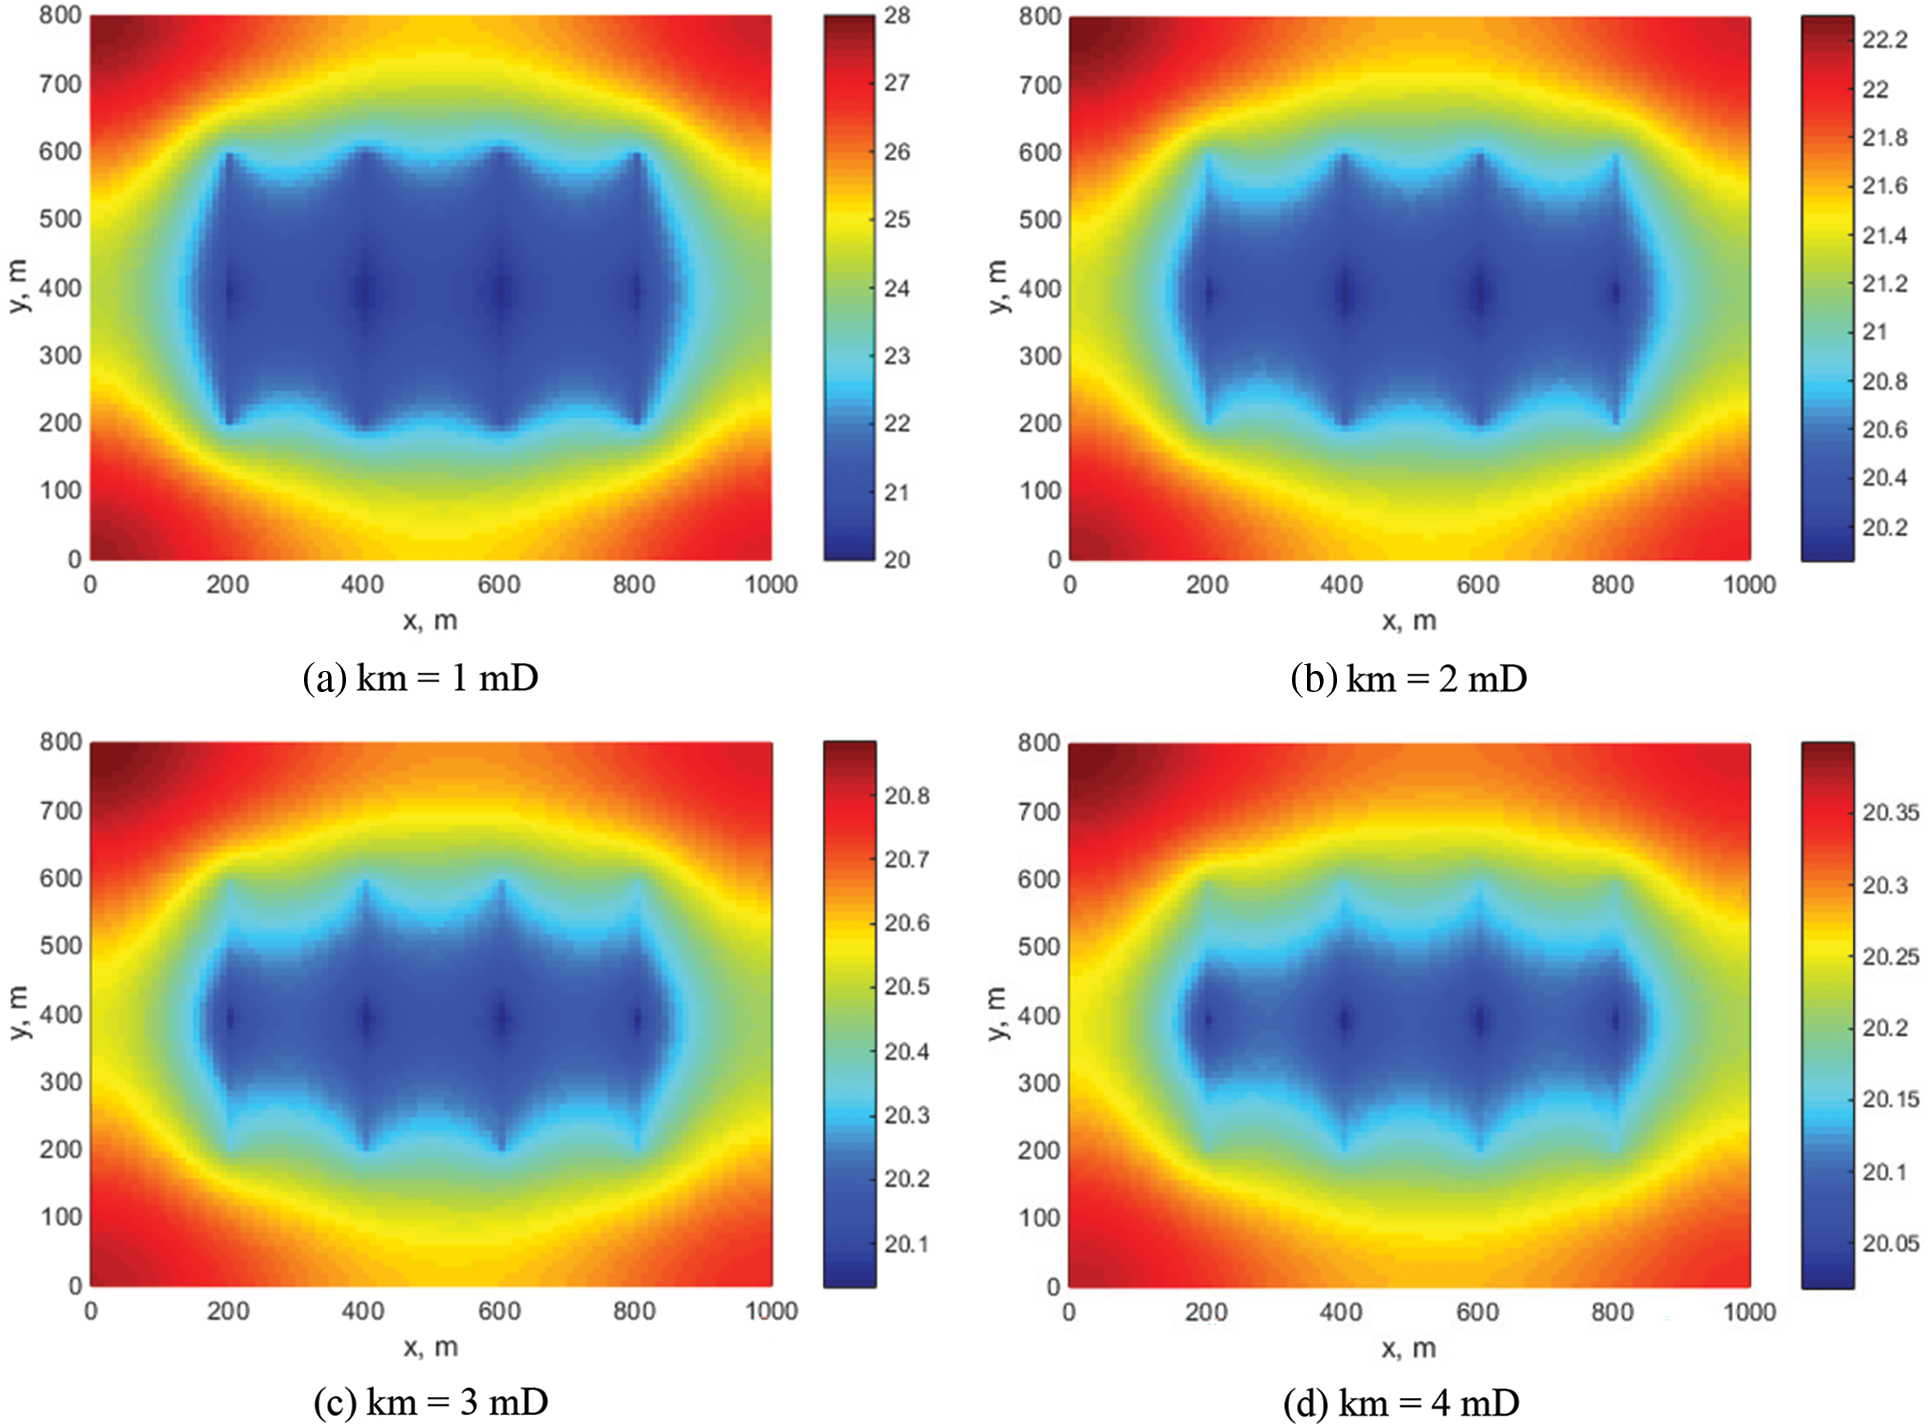
Figure 14: Pressure distribution under different matrix permeability
This study focuses on the problem of mutual coupling of stress and seepage fields in tight reservoirs during the development process. To address this issue, a flow-solid coupling model was developed for volumetrically fractured horizontal wells in dense sandy conglomerate reservoirs. The model was based on the cross-coupling relationship of permeability stress, which was improved through seepage mechanics, rock mechanics, and numerical model analysis.
The primary findings of this study include the following. First, the model takes into account the dual medium composed of a fracture network and matrix by integrating artificial fractures. Second, a production prediction model was developed and its accuracy was validated by comparing it with real production wells through finite element numerical simulation. Third, the fluid-solid coupled model was employed to assess the impact of various factors on reservoir production, such as stress sensitivity, fracture length, and the number of fracture clusters.
The results show that the productivity of horizontal wells is negatively affected by the increase of stress sensitivity coefficient. When the coefficient is 0.02 MPa−1, the production reaches its maximum. The trend of cumulative oil production increase with fracture length becomes more evident, achieving the maximum production when the fracture length is 250 m. Within the range of fracture number provided in this study, although more fracture number lead to an increase in cumulative oil production, well interference may also occur.
In this study, sensitivity analyses reveal that stress sensitivity, fracture half-length, number of fractures, and matrix permeability emerge as critical factors influencing the productivity of horizontal wells in tight reservoirs. Specifically, a stress sensitivity coefficient of 0.02 MPa−1 slows the production decline significantly, while fracture half-length shows diminishing returns in FOPT beyond 250 m. The number of fractures has a more considerable impact on early production, with diminishing incremental gains beyond 4 fractures. Matrix permeability, as detailed in Section 4.4, exhibits a non-linear relationship with both WOPR and FOPT, indicating an optimal permeability range for maximizing production. Therefore, an integrated consideration of these four parameters is crucial for the optimization of well design and reservoir management.
Acknowledgement: None.
Funding Statement: The authors received no specific funding for this study.
Author Contributions: The authors confirm contribution to the paper as follows: study conception and design: XZ; data collection: XZ; analysis and interpretation of results: XZ, ML, KY; draft manuscript preparation: KY, LY. All authors reviewed the results and approved the final version of the manuscript.
Availability of Data and Materials: The data that support the findings of this study are available from the corresponding author, upon reasonable request.
Conflicts of Interest: The authors declare that they have no conflicts of interest to report regarding the present study.
References
1. Ozkan, E., Brown, M., Raghavan, R., Kazemi, H. (2011). Comparison of fractured-horizontal-well performance in tight sand and shale reservoirs. SPE Reservoir Evaluation & Engineering, 14(2), 248–259. [Google Scholar]
2. Denney, D. (2010). Practical solutions for pressure-transient responses of fractured horizontal wells in unconventional reservoirs. Journal of Petroleum Technology, 62(2), 63–64. [Google Scholar]
3. Meyer, B. R., Bazan, L. W., Jacot, R. H., Lattibeaudiere, M. G. (2010). Optimization of multiple transverse hydraulic fractures in horizontal wellbores. The SPE Unconventional Gas Conference, Pittsburgh, Pennsylvania, USA. https://doi.org/10.2118/131732-MS [Google Scholar] [CrossRef]
4. Mahmoud, O., Ibrahim, M., Pieprzica, C., Larsen, S. (2018). EUR prediction for unconventional reservoirs: State of the art and field case. The SPE Trinidad and Tobago Section Energy Resources Conference, Trinidad and Tobago, Port of Spain. https://doi.org/10.2118/191160-MS [Google Scholar] [CrossRef]
5. Ren, L., Lin, R., Zhao, J., Rasouli, V., Zhao, J. et al. (2018). Stimulated reservoir volume estimation for shale gas fracturing: Mechanism and modeling approach. Journal of Petroleum Science and Engineering, 166, 290–304. [Google Scholar]
6. Wang, J., Jia, A., Wei, Y., Jia, C., Qi, Y. et al. (2019). Optimization workflow for stimulation-well spacing design in a multiwell pad. Petroleum Exploration and Development, 46(5), 1039–1050. [Google Scholar]
7. Guo, J., Tao, L., Zeng, F. (2019). Optimization of refracturing timing for horizontal wells in tight oil reservoirs: A case study of cretaceous qingshankou formation, Songliao Basin, NE China. Petroleum Exploration and Development, 46(1), 153–162. [Google Scholar]
8. Fang, B., Hu, J., Xu, J., Zhang, Y. (2020). A semi-analytical model for horizontal-well productivity in shale gas reservoirs: Coupling of multi-scale seepage and matrix shrinkage. Journal of Petroleum Science and Engineering, 195, 107869. [Google Scholar]
9. Nguyen, K., Zhang, M., Garcez, J., Ayala, L. F. (2020). Multiphase transient analysis of flowback and early production data of unconventional gas wells. The SPE Annual Technical Conference and Exhibition, Virtual. https://doi.org/10.2118/201303-MS [Google Scholar] [CrossRef]
10. Tian, L., Chai, X., Wang, P., Wang, H. (2020). Productivity prediction model for stimulated reservoir volume fracturing in tight glutenite reservoir considering fluid-solid coupling. Frontiers in Energy Research, 8, 573817. [Google Scholar]
11. Fan, Y., Liu, L. F., Ran, Q. Q., Kong, J. P., Xu, M. Y. et al. (2020). The characteristics of unconventional tight oil reservoir and its modification technology and productivity prediction. Earth Sciences Research Journal, 24(4), 507–512. [Google Scholar]
12. Zeng, L., Liu, H. (2010). Influence of fractures on the development of low-permeability sandstone reservoirs: A case study from the Taizhao District, Daqing Oilfield, China. Journal of Petroleum Science and Engineering, 72(1–2), 120–127. [Google Scholar]
13. Xie, C. Y., Hu, Y. Q., Chen, X., Ma, Y. (2014). Fracturing well production dynamic simulation in fractured tight sandstone gas reservoir. Applied Mechanics and Materials, 457, 410–415. [Google Scholar]
14. Vogler, D., Walsh, S. D., Dombrovski, E., Perras, M. A. (2017). A comparison of tensile failure in 3D-printed and natural sandstone. Engineering Geology, 226, 221–235. [Google Scholar]
15. Feng, G., Kang, Y., Chen, F., Liu, Y. W., Wang, X. C. (2018). The influence of temperatures on mixed-mode (I+II) and mode-II fracture toughness of sandstone. Engineering Fracture Mechanics, 189, 51–63. [Google Scholar]
16. Wu, Z., Hu, Y., Jiang, T., Liu, J., Wu, C. (2019). Research and application of horizontal well cross-layer fracturing technology in tight sandstone reservoir. International Field Exploration and Development Conference, pp. 439–451. Singapore, Springer. [Google Scholar]
17. Li, Y., Yang, S., Zhang, L., Yao, F. (2021). A study of fracture penetration law of tight sandstone gas reservoir in block LX. IOP Conference Series: Earth and Environmental Science, 692(4), 042115. [Google Scholar]
18. Fuchs, S. J., Crandall, D., Moore, J. E., Sivaguru, M., Fouke, B. W. et al. (2021). Geochemically induced shear slip in artificially fractured dolomite-and clay-cemented sandstone. International Journal of Greenhouse Gas Control, 111, 103448. [Google Scholar]
19. Obara, Y., Nakamura, K., Yoshioka, S., Sainoki, A., Kasai, A. (2020). Crack front geometry and stress intensity factor of semi-circular bend specimens with straight through and chevron notches. Rock Mechanics and Rock Engineering, 53, 723–738. [Google Scholar]
20. Zhang, Y., Yu, R., Yang, W., Tian, Y., Song, Y. et al. (2022). Plugging mechanism of upper and lower tip of hydraulic fracture in tight sandstone reservoir. Arabian Journal for Science and Engineering, 47(9), 11329–11344. [Google Scholar]
21. Rao, X., Cheng, L., Cao, R., Jia, P., Liu, H. et al. (2020). A modified projection-based embedded discrete fracture model (pEDFM) for practical and accurate numerical simulation of fractured reservoir. Journal of Petroleum Science and Engineering, 187, 106852. [Google Scholar]
22. Xu, Y., Sheng, G., Zhao, H., Zhou, Y., Ma, J. (2021). A new approach for gas-water flow simulation in multi-fractured horizontal wells of shale gas reservoirs. Journal of Petroleum Science Engineering, 199, 108292. [Google Scholar]
23. Stalgorova, E., Mattar, L. (2021). Analytical model for history matching and forecasting production in multifrac composite systems. The SPE Canadian Unconventional Resources Conference, Calgary, Alberta, Canada. https://doi.org/10.2118/162516-MS [Google Scholar] [CrossRef]
Cite This Article
 Copyright © 2023 The Author(s). Published by Tech Science Press.
This work is licensed under a Creative Commons Attribution 4.0 International License , which permits unrestricted use, distribution, and reproduction in any medium, provided the original work is properly cited.


 Submit a Paper
 Propose a Special lssue
 View Full Text
 Download PDF
 Downloads
 Citation Tools