
 Submit a Paper
 Propose a Special lssue
 Open Access
ARTICLE

Parameters Identification for Extended Debye Model of XLPE Cables Based on Sparsity-Promoting Dynamic Mode Decomposition Method
1 Guiyang Power Supply Bureau, Guizhou Power Grid Co., Ltd., Guiyang, 550004, China
2 College of Electrical Engineering, Sichuan University, Chengdu, 610065, China
* Corresponding Author: Weijun Wang. Email:
Energy Engineering 2023, 120(10), 2433-2448. https://doi.org/10.32604/ee.2023.028620
Received 22 December 2022; Accepted 10 March 2023; Issue published 28 September 2023
 View Full Text
 Download PDF
Abstract
To identify the parameters of the extended Debye model of XLPE cables, and therefore evaluate the insulation performance of the samples, the sparsity-promoting dynamic mode decomposition (SPDMD) method was introduced, as well the basics and processes of its application were explained. The amplitude vector based on polarization current was first calculated. Based on the non-zero elements of the vector, the number of branches and parameters including the coefficients and time constants of each branch of the extended Debye model were derived. Further research on parameter identification of XLPE cables at different aging stages based on the SPDMD method was carried out to verify the practicability of the method. Compared with the traditional differential method, the simulation and experiment indicated that the SPDMD method can effectively avoid problems such as the relaxation peak being unobvious, and possessing more accuracy during the parameter identification. And due to the polarization current being less affected by the measurement noise than the depolarization current, the SPDMD identification results based on the polarization current spectral line proved to be better at reflecting the response characteristics of the dielectric. In addition, the time domain polarization current test results can be converted into the frequency domain, and then used to obtain the dielectric loss factor spectrum of the insulation. The integral of the dielectric loss factor on a frequency domain can effectively evaluate the insulation condition of the XLPE cable.Keywords
Cross-linked polyethylene (XLPE) cable has become the core transmission equipment in urban distribution networks because of its excellent electrical and mechanical properties, simple installation, large transmission capacity and other advantages [1]. However, during the long-term operation, the insulation performance of XLPE cables will deteriorate gradually due to the combined effects of electrical, thermal, moisture and mechanical stresses. Therefore, the rapid and effective diagnosis of the cable insulation state can provide a guarantee for the safe and stable operation of the power system. In recent years, dielectric response technology has attracted more and more attention as a non-destructive test method on insulating materials. The polarization and depolarization current (PDC) measurement in time-domain is especially suitable for the on-field diagnosis of high-voltage electrical equipment because of its fast, accurate, and abundant test information [2–6].
The extended Debye model is an abstract model based on the dielectric response theory, with consideration of the relaxation and conductance process inside the dielectric. The model has clear physical concept and concise model parameters. With the help of this model, the details of dielectric measurements such as PDC can be well explained and analyzed [6–8]. As per the assessment of the dielectric status using the extended Debye model, accurate and unique identification of the model parameters is a prerequisite. The traditional method to derive the model parameters is mainly by fitting, that is, the mathematical expression of polarization/depolarization current is first listed according to the Debye equivalent circuit with a preset fixed number of branches, and then the model parameters are obtained by fitting the current curve according to the formula [9]. With the development of intelligent algorithms, various optimization algorithms are used to improve the accuracy of the identification of the extended Debye model parameters. References [8,10] introduced the cuckoo search algorithm and gray wolf optimization algorithm for parameter identification of the extended Debye model, respectively. However, intelligent algorithms have some natural shortcomings, such as slow convergence speed and being easy to fall into local optimal solution, which leads to a non-unique parameter identification result. In addition, fitting methods essentially take the established model as the research object, that is, the number of relaxation branches of the extended Debye model needs to be set artificially according to relevant experience or theoretical support. However, for the dielectric with ambiguous relaxation mechanism, the number of relaxation branches is always difficult to determine. In order to solve this problem, references [11,12] preseted multiple equivalent circuits with different numbers of branches, and use the fitting method to process them respectively, and finally select the multi-branch equivalent circuit model with the highest fitting goodness as the identification result. However, this kind of heuristic processing method requires manual modification of algorithm parameters for many times, which is inefficient. In addition, manually setting branches without actual relaxation processes loses the physical meaning of the extended Debye model.
For this reason, reference [6] first determined the number of branches of the model by using the piecewise analytical method, and the depolarization current differential method combined with the current spectral line characteristics, respectively, and then further solves the model parameters on this basis. Although the above methods take the determination of the number of model branches into account, subsequent studies have shown that the identification accuracy is greatly affected when the time constant distribution of the medium relaxation process is close [13]. In addition, the identification accuracy of the above methods is easily affected by the measurement noise.
In addition, all the above methods take the depolarization current spectral line as the original data, without considering the use of the measured polarization current results. The advantages of using polarization current to identify parameters are as follows: i. According to the basic principle of PDC test, if the model parameters can be identified only by polarization current spectral lines, the test time can be halved, and the power outage time of the field test can be greatly reduced. The research results of reference [14] showed that the dielectric response analysis and parameter calculation results using only polarization current and using polarization/depolarization current at the same time are consistent, which verifies the rationality and effectiveness of polarization current as the original data. ii. The influence of noise on the test results and identification results of polarization current is relatively small [15]. The specific reason is that the polarization current contains a steady-state DC conduction current component, and the existence of DC bias makes the measured amplitude larger than that of the depolarization current, thus possessing a stronger anti-noise capability.
In order to solve the above problems, the extended Debye model of XLPE cable based on the polarization current characteristics is first introduced in this paper. Afterwards, the sparsity-promoting dynamic mode decomposition (SPDMD) method is introduced to realize the identification of model parameters, while meeting the requirements of clear physical meaning and mathematical fitting goodness at the same time. The advantages and rationality of adopting the polarization current spectral lines as the analytic object of the model are discussed in detail. Finally, the effectiveness of the proposed method is verified by the practical application of the method to XLPE cable samples with different thermal aging statuses.
2 Extended Debye Model of XLPE Cables
The extended Debye model of the dielectric is represented by a multi-branch R-C equivalent circuit composed of a series of resistors and capacitors, as shown in Fig. 1. Each branch of the R-C equivalent circuit represents the relaxation process of the dielectric [16]. In the polarization stage of the PDC test,
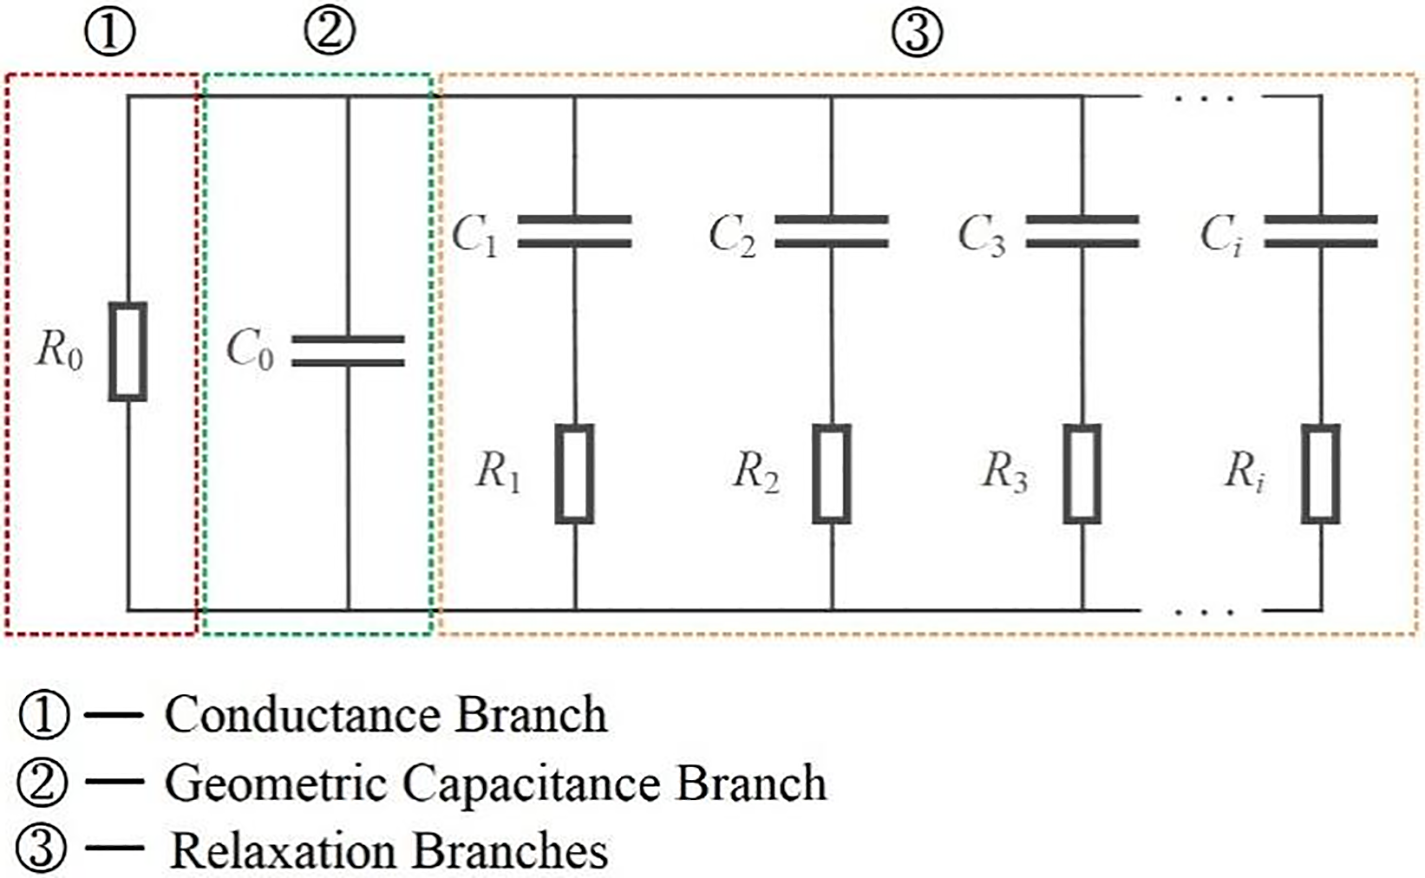
Figure 1: Extended Debye equivalent circuit model
where,
Further have
where
To sum up, to identify the extended Debye model parameters, it is necessary to determine the number
3 Parameter Identification Based on SPDMD Method
Based on the characteristics of the extended Debye model and the PDC test current signal, the performance of the commonly used dominant modal parameter identification method is comprehensively analyzed. It is found that the identification results of the Prony algorithm are greatly affected by the measurement noise [17], and the TLS-ESPRIT algorithm has a large demand for computing power consumption due to the existence of two singular value decompositions [18]. The matrix pencil algorithm and the random subspace algorithm also have the disadvantage that the order of the model is difficult to be uniquely determined. The SPDMD method extracts the dominant mode according to the spatiotemporal evolution law of the test signal, and comprehensively considers the influence of noise interference and computational complexity. Therefore, it has its unique advantages in the identification of the dielectric parameters of the Debye model of polarization current [19].
3.1 Mode Decomposition of Polarization Current Signal Based on DMD Algorithm
Firstly, the polarization current sampling signal
Let
where,
where
F can be obtained by calculating the Eqs. (6)–(8). Afterwards, perform the eigenvalue decomposition on matrix
where
When the traditional DMD method is used to identify the Debye model parameters of the measured PDC signal, the existence of measurement noise will make the zero eigenvalue in the eigenvalue matrix
First, the Vandermonde matrix
Through the optimized solution of the signal DMD mode amplitude [16], the amplitude vector shown below can be finally obtained as
In this formula,
After obtaining the DMD modal, amplitude vector
where
Through the construction of the enhanced sparse amplitude vector, the problems of screening the dominant mode of the model and eliminating the false mode introduced by noise are solved. In amplitude vector
3.3 Parameter Identifying Process
When the above algorithm is used to identify the parameters of the Debye model derived from the polarization current, it can be seen from Eq. (1) that the steady-state conductance current A0 can be equivalent to the current of the relaxation branch with a maximum decay time, that is, the Eq. (1) can be unified as the following:
In Eq. (14),
The Debye model parameter
where
To sum up, the steps of the extended Debye model parameter identification based on the polarization current are summarized as follows:
i. measuring the polarization current signal, recording the amplitude of the applied polarization voltage and the sampling frequency, and then constructing a Hankel standardized matrix
ii. calculating the matrix
iii. constructing a Vandermonde matrix
iv. calculating the parameters of the Debye model by using the Eqs. (15) and (16). It should be noted that the steady-state DC conductance is solved as a dielectric relaxation process, and its decay time constant is very large.
4 Simulation Results and Analysis
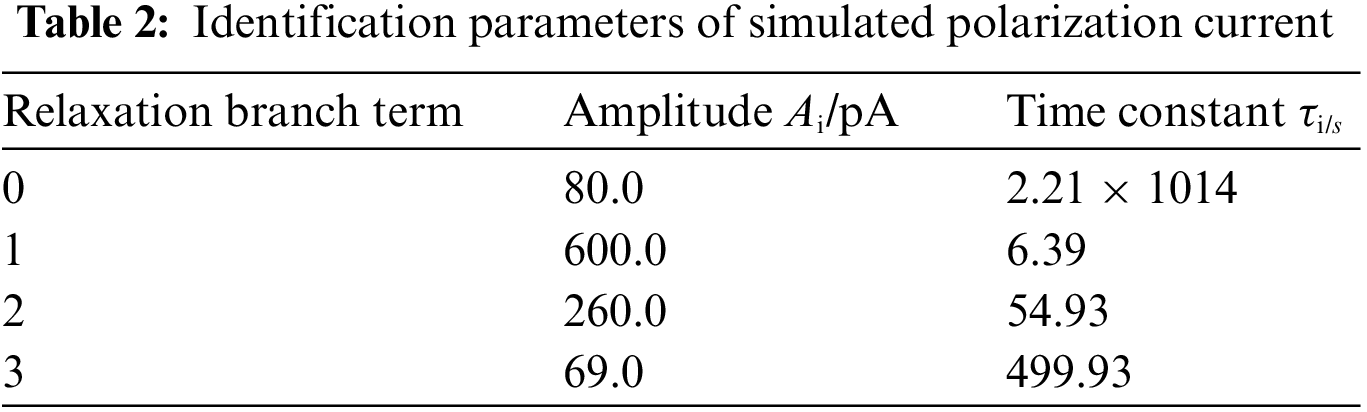
With the help of the mathematical model of polarization current given by Eq. (1), a group of polarization current signals with three relaxation branches are simulated. The parameter settings are shown in Table 1. The branch with a coefficient of 0 is the steady-state DC branch. The polarization time is set to 1000 s, and the sampling frequency is 1.2 Hz, which is consistent with the parameters of the measured PDC described later. Fig. 2 shows the simulated polarization current waveform.
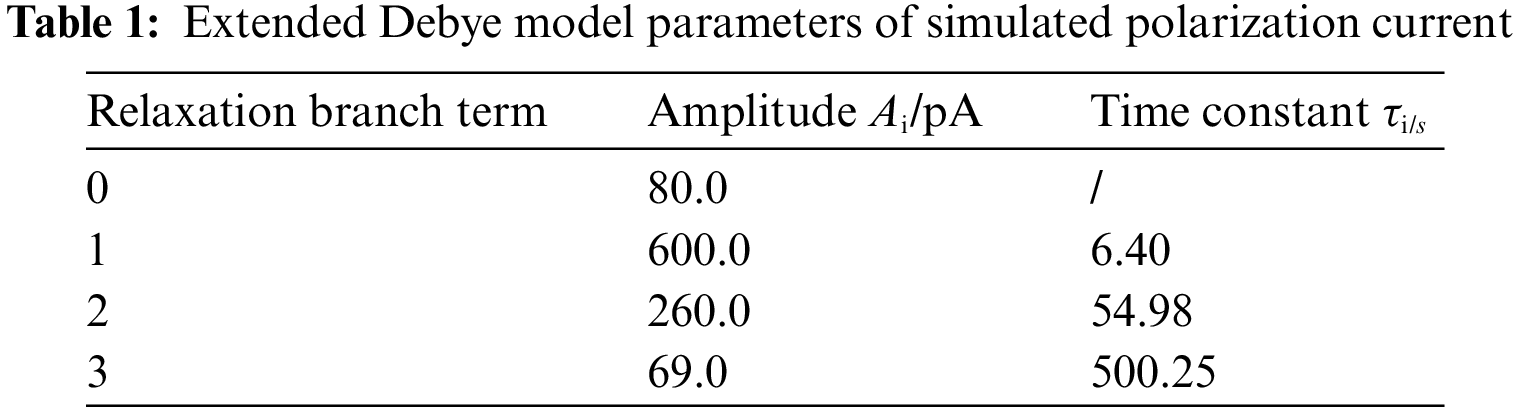
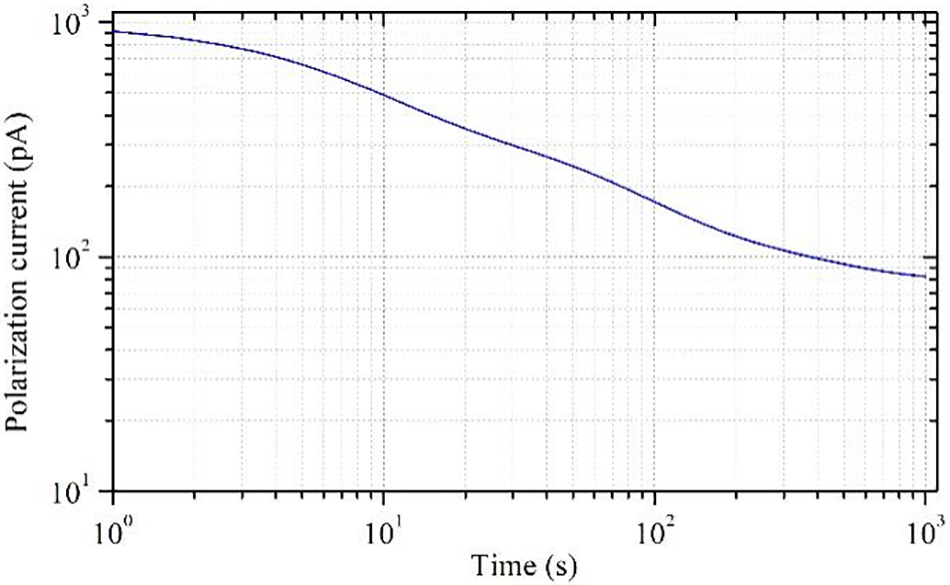
Figure 2: Simulated polarization current
Fig. 3 shows the vector
Figure 3: Sparsity-promoting amplitude vector results
In order to illustrate the superiority of the SPDMD method in determining the order of the number of branches of the Debye model, Fig. 4 shows the identification results of the polarization current curve shown in Fig. 2 by using the traditional differential method.
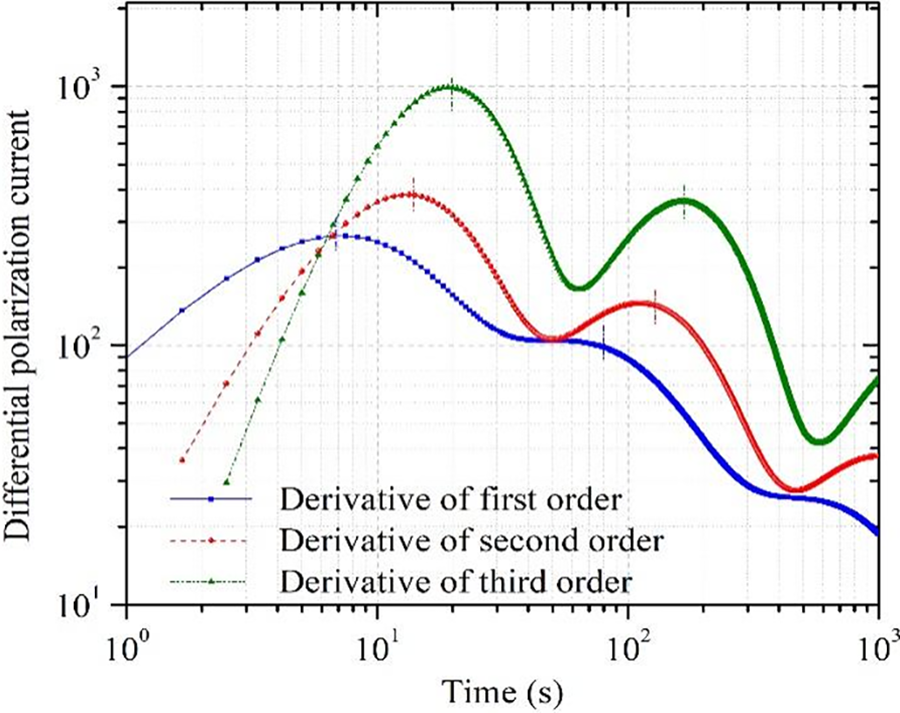
Figure 4: Identification result of simulated polarization current based on differential method
It can be seen from Fig. 4 that although there are three types of differential spectral lines, only two relaxation peaks can be distinguished, proving that the identification effect is not good. Through further analysis of the principle of the traditional differential method, its identification characteristics can be summarized as follows: the first derivative spectral line is prone to the superposition effect of relaxation peaks, which leads to the coverage of the peak points. Although the peak position can be effectively highlighted by increasing the differential order to reduce the half-peak width, it is achieved on the basis of sacrificing the maximum time constant of identification. Specifically, the maximum time constant value that can be effectively identified by the second derivative is 1/2 of the test time of PDC polarization/depolarization current, and the percentage of the third derivative is 1/3. Therefore, when there are relaxation processes with similar time constant or large time constant, there will be a blind area of identification by using traditional differential method. The SPDMD method introduced in this paper overcomes the above drawbacks in the application process.
4.2 Analysis of Anti-Noise Performance
The existence of the measurement noise is an unavoidable problem in the PDC test process, especially in substations with complex electromagnetic environments and dense distribution of buses and feeders [20]. Therefore, it is necessary to evaluate the anti-noise performance of the proposed PDC data analysis. In this section, Gaussian white noise with different intensities is added to the simulated polarized current signal, and then the parameters of the noised current signal are identified. Since the PDC current spectral line shows an exponential decay trend as a whole, the environmental noise mainly has a greater impact on the low amplitude period at the end of the signal. Therefore, the noise level
The determination coefficient
where
Afterwards, 200 times of Monte Carlo simulations are carried out for each group of noisy polarization current signals to exclude the influence of accidental factors. Table 3 shows the identification results of the extended Debye model parameters of the polarization current under the interference of different noise levels. It should be noted that the results are the average values of 200 times of simulation. Fig. 5 shows the polarization current spectral lines established according to the parameters in the table. It can be seen that the method in this paper has an excellent effect on the identification of polarization current under the condition of low noise, and only when the noise intensity is above 5%, the identification parameters of the large time constant branch will be significantly affected.
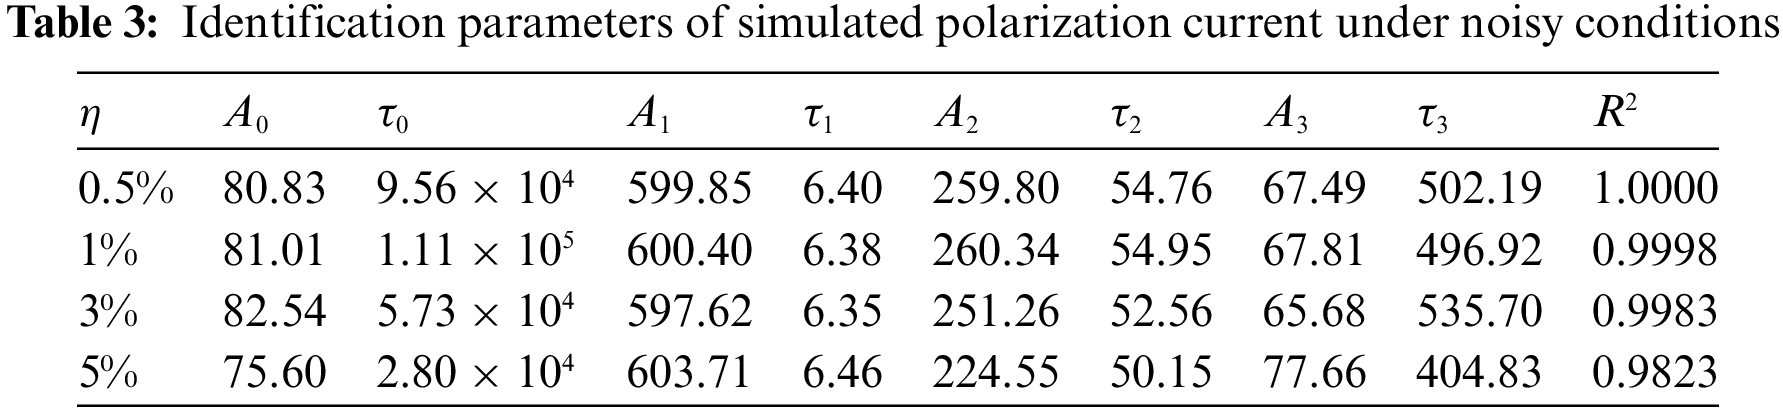
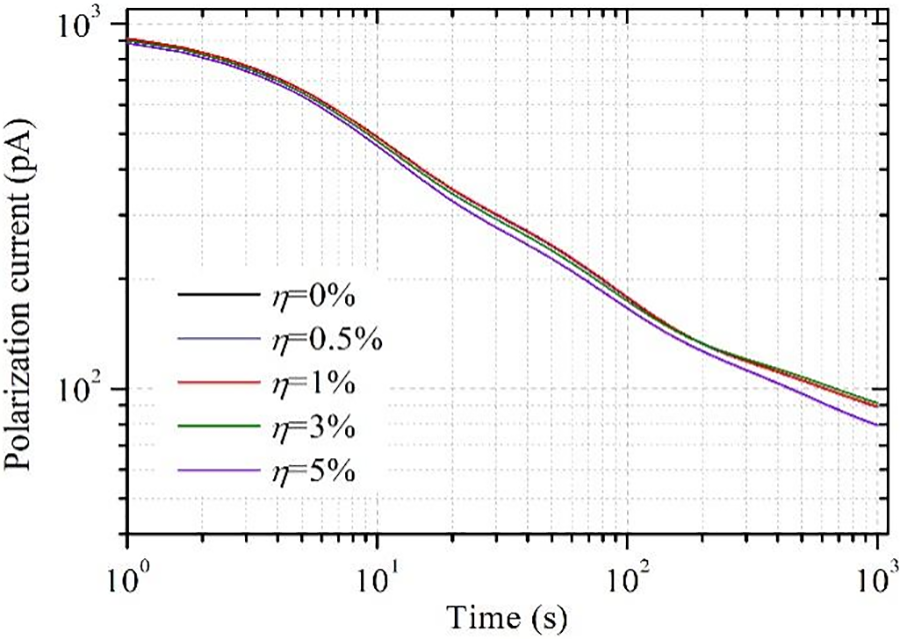
Figure 5: Identified polarization current curve under noisy conditions
5.1 Parameter Identification of Cables at Different Aging Stages
In order to test the effect of the proposed SPDMD method in the identification of dielectric parameters of actual power cables, the YJLV22-8.7/15 kV XLPE cable produced by Sunway Co., Ltd., China is selected as the experimental object. Firstly, several short cable samples with a length of 50 cm are made and put into the temperature and humidity control tank for thermal aging. The aging temperature and the relative humidity are set to 135°C and 0%, respectively. The samples are taken periodically from the tank and measured with PDC method, upon which the parameters of the cables are identified. PDC test platform is shown in Fig. 6. The test time is set to 1000 s. The sampling frequency is 1.2 Hz, and the test voltage is 1 kV.
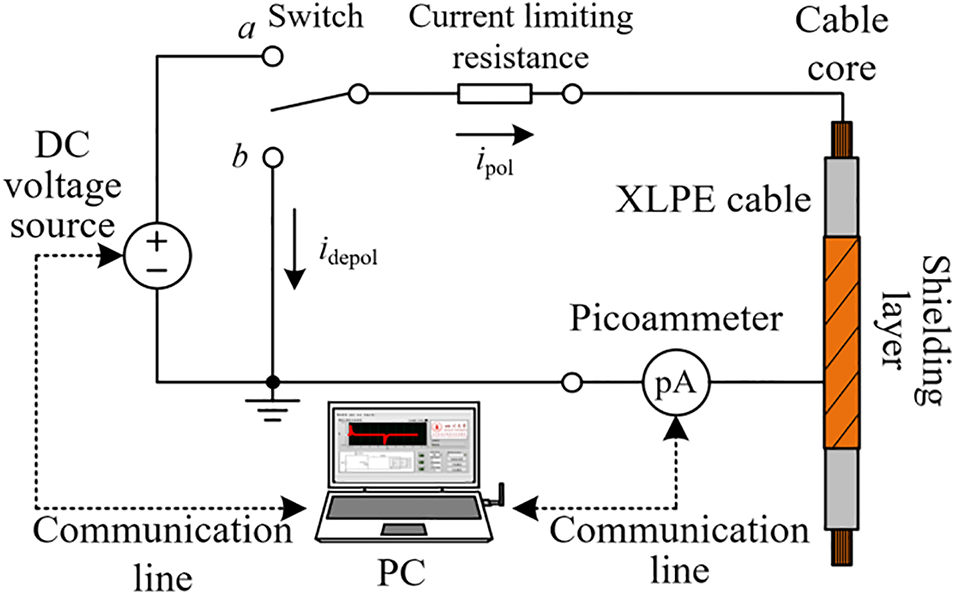
Figure 6: Diagram of the PDC measurement
In this section, the SPDMD method is used to identify the parameters of the extended Debye model derived from the polarization current of the new cable sample, the sample thermally aged for 15 days and the sample thermally aged for 30 days. The results are shown in Tables 4–6, respectively. Based on the value of the enhanced sparse amplitude vector αsp, the number of relaxation branches of the cable’s extended Debye model has increased from four branches before aging to five branches after aging, which indicates that a new relaxation process has occurred during the thermal degradation of the cable insulation. Also, the results indicate that the fitting method may make the parameter identification fall into an ill-conditioned state due to the lack of steps to determine the number of model branches. Fig. 7 shows the comparison of the polarization current curves drawn from the identification parameters and the actual measured, where the calculated fitting coefficients R2 are 0.9993, 0.9996 and 0.9990, respectively. The results prove the superiority of the SPDMD method. Besides, we also adopt the SPDMD method on the depolarization current of PDC test to identify the parameters of the Debye model. The fitting coefficient R2 are 0.9316, 0.9143 and 0.8971, respectively, indicating that the SPDMD method is more accurate when being adopted to the polarization current rather than the depolarization current of PDC test.
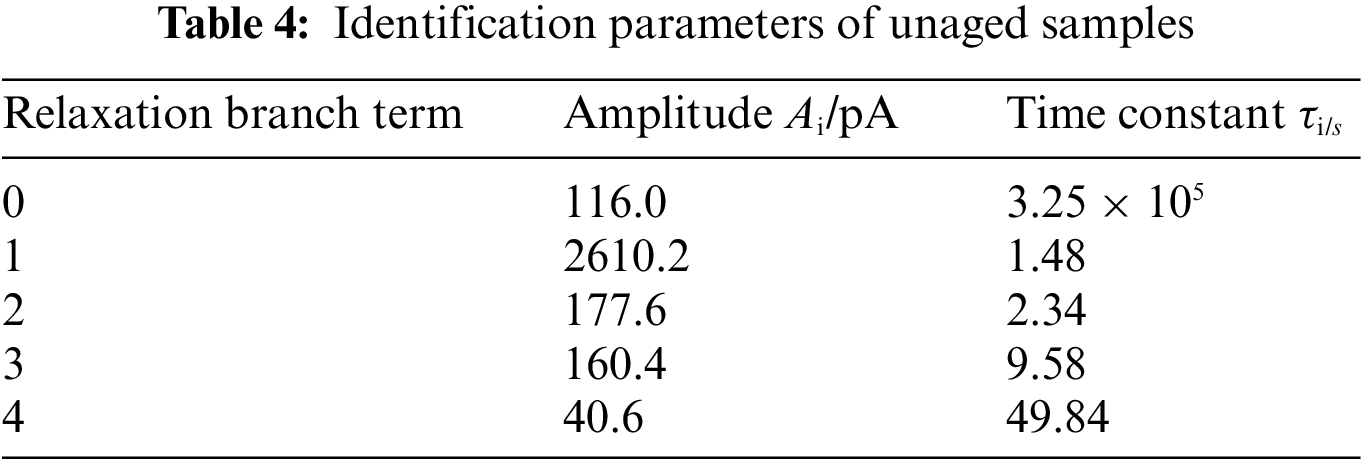
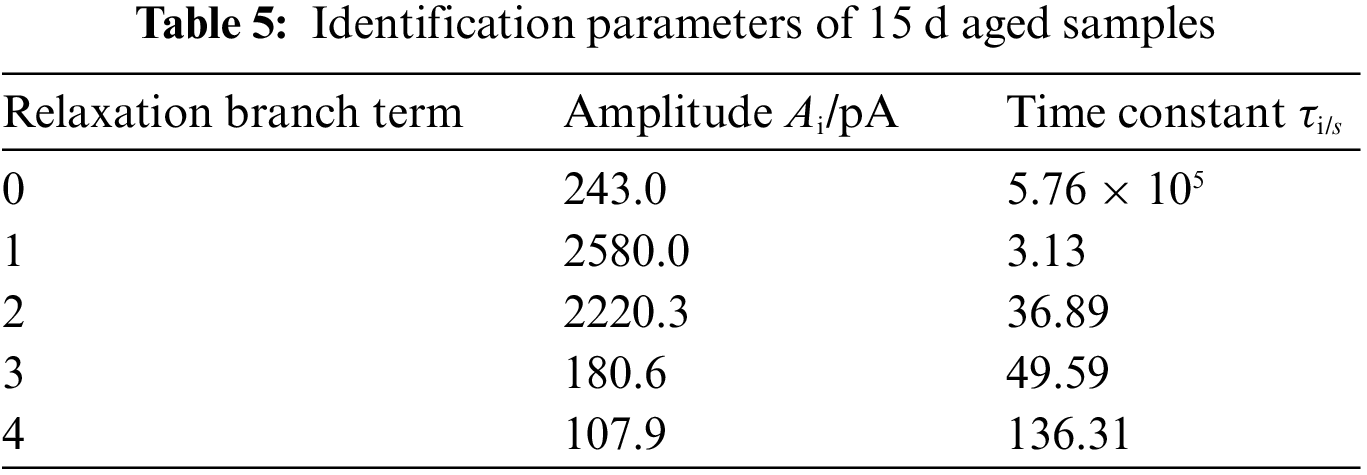
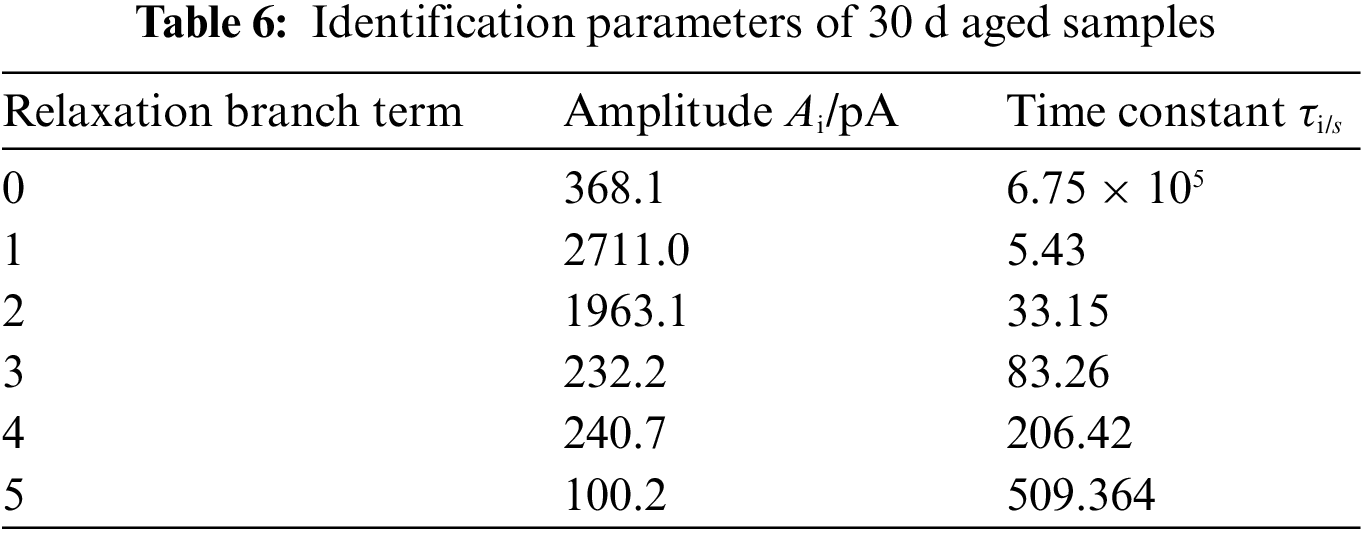
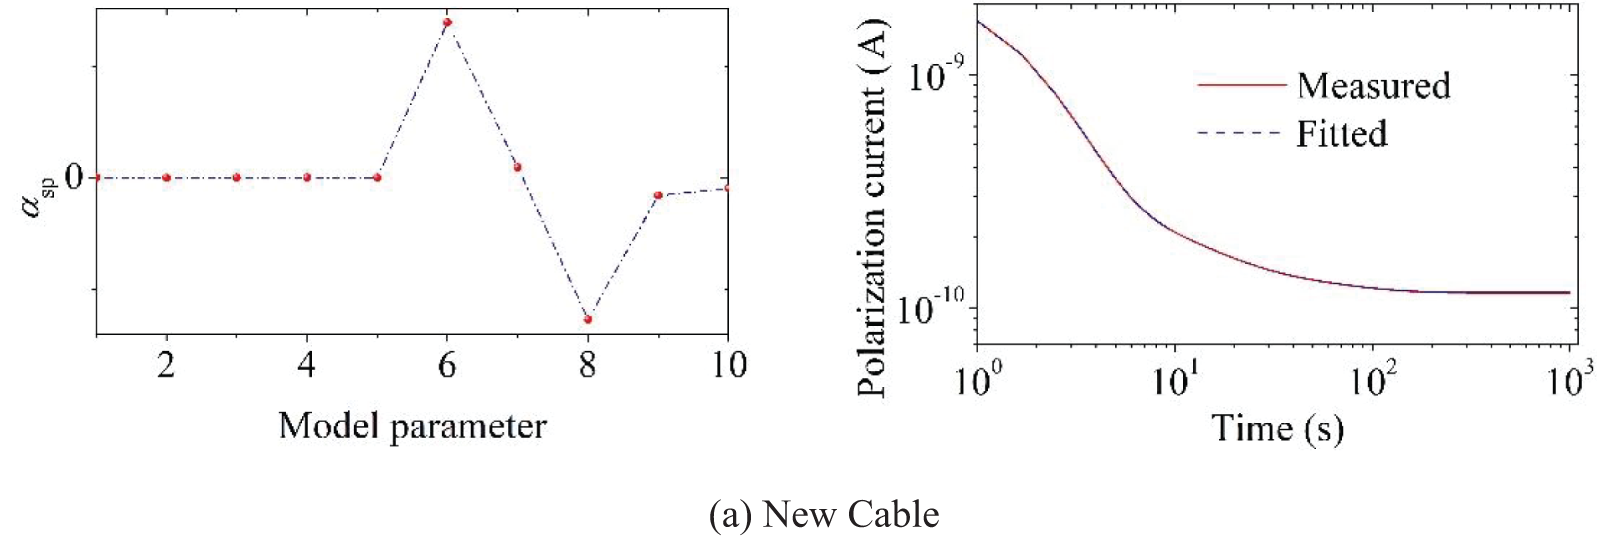
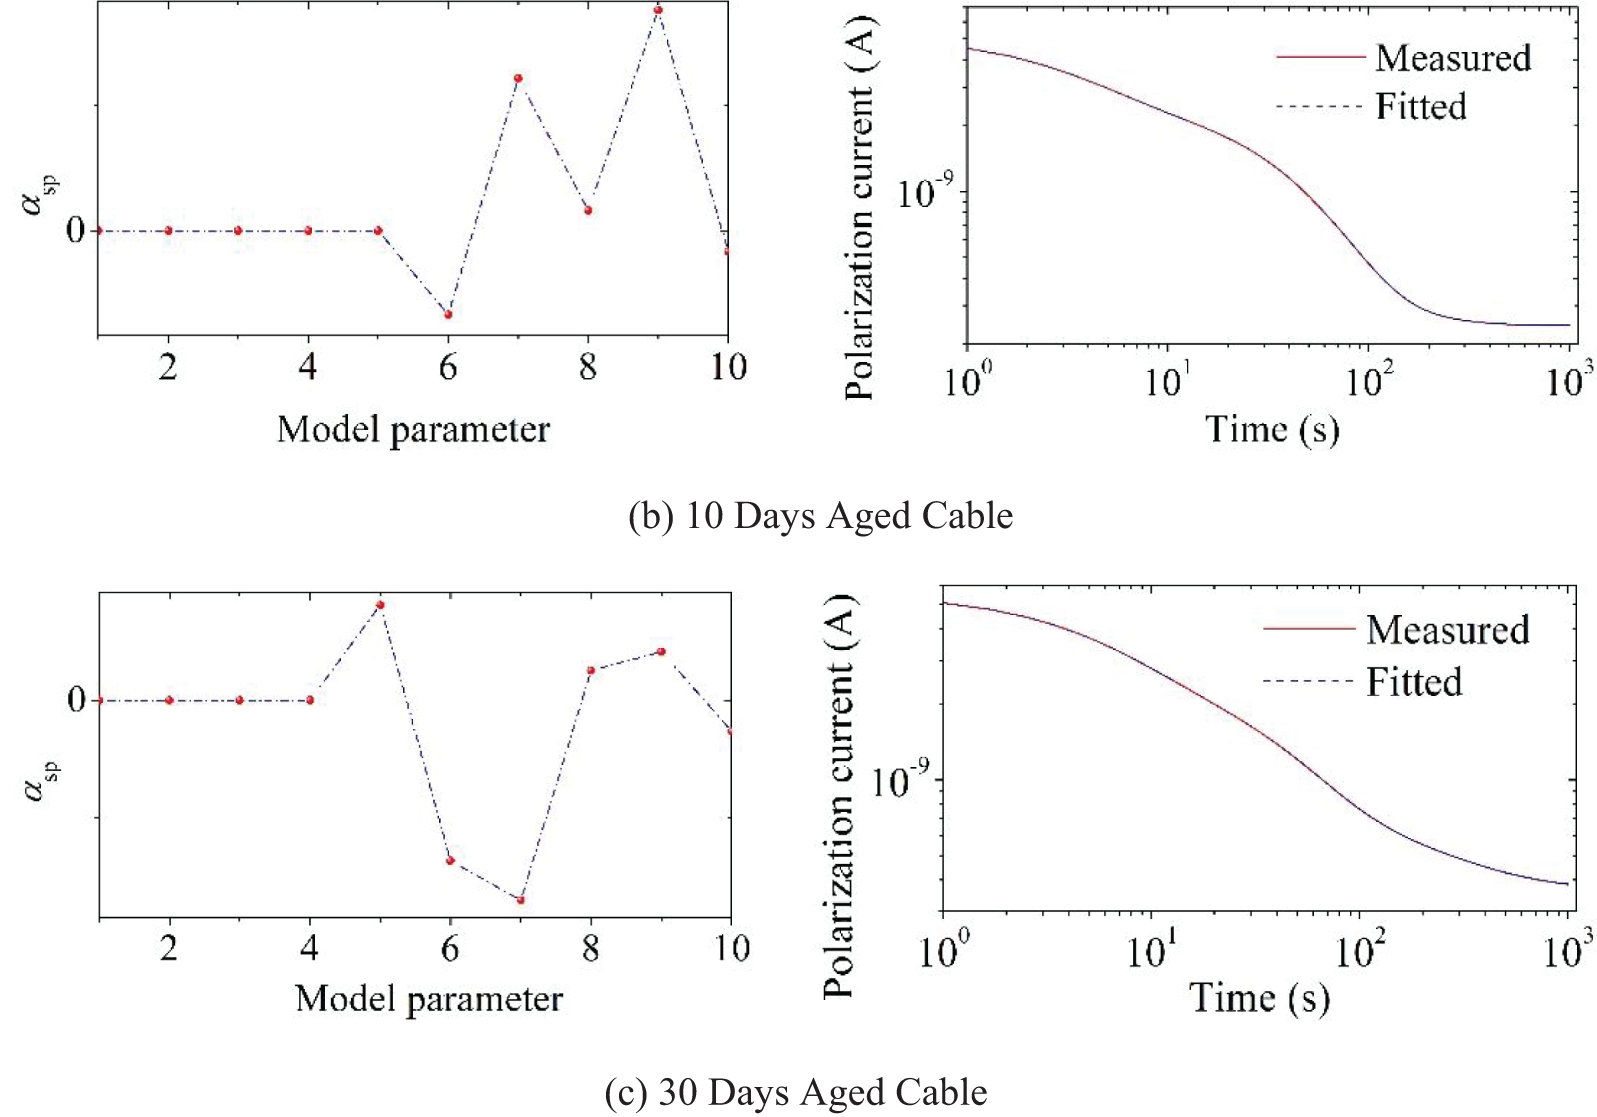
Figure 7: Polarization current and amplitude vector value of cable samples with different insulation states
Fig. 8 shows the first, second and third differential spectral lines constructed by using the simulated polarization current obtained from the SPDMD identification. For the PDC current curve measured by the actual cable sample, it is difficult to distinguish the position of the relaxation peak by the first differential method. Although the second and third differential methods can make the peak stand out, only three relaxation peaks can be identified at most. There is an obvious discrepancy with the actual situation, which further demonstrates the excellent performance of the SPDMD method for parameter identification of the measured XLPE cable.
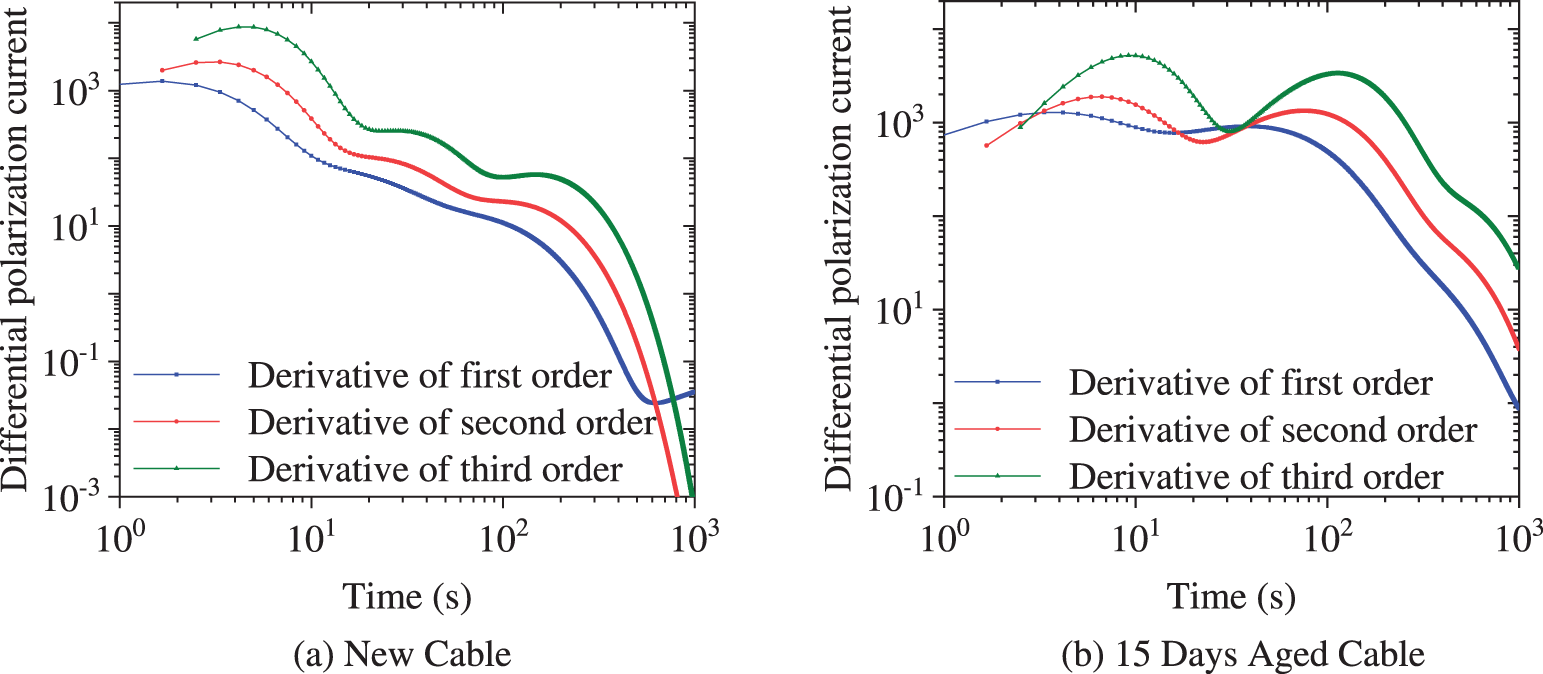
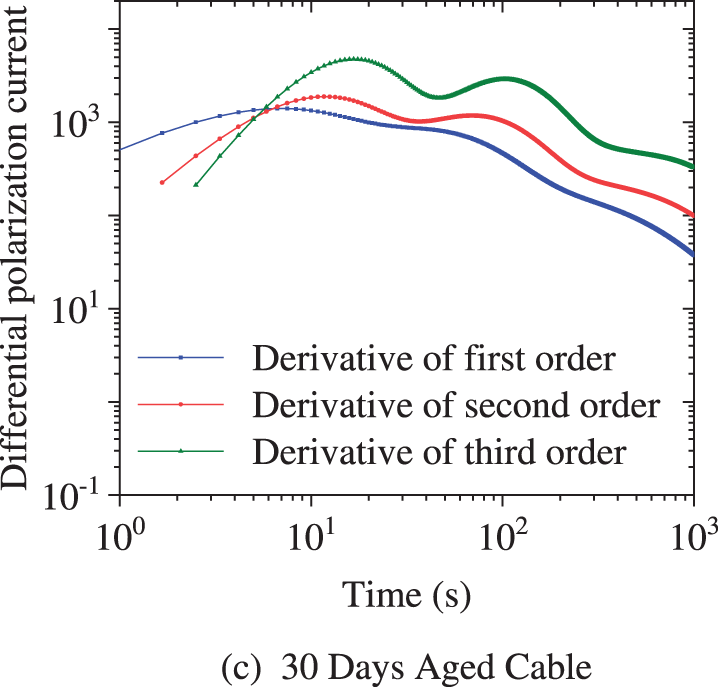
Figure 8: Time-domain differential spectral lines of cables with different insulation states
5.2 Insulation Condition Assessment of Cables Based on SPDMD Results
It is one of the most effective analysis methods for PDC at present to transform the time domain test results of PDC into the frequency domain expression, to obtain the dielectric loss factor spectrum of the insulation, and to diagnose the insulation condition [11]. The complex capacitance of an insulating dielectric can be expressed in terms of the extended Debye equivalent circuit element parameters as follows:
The dielectric loss factor is then
Fig. 9 shows the calculated dielectric loss factor spectra of the cable samples at different thermal aging stages. According to the PDC test settings in the previous experiment, the frequency domain range of the dielectric loss factor spectra in this section is 10−3 Hz–0.6 Hz. Studies have shown [21] that in the low-frequency range, the parameters obtained by converting the PDC test results to the frequency domain are in good agreement with the direct test results of actual frequency domain measurement methods (such as frequency domain dielectric spectroscopy). It can be seen from Fig. 9 that the dielectric loss factor of the cable after aging increases significantly. References [22] and [23] both showed that the integral Stanδ of dielectric loss factor with respect to frequency can be used as a characteristic parameter for effectively evaluating the aging condition of the insulation,
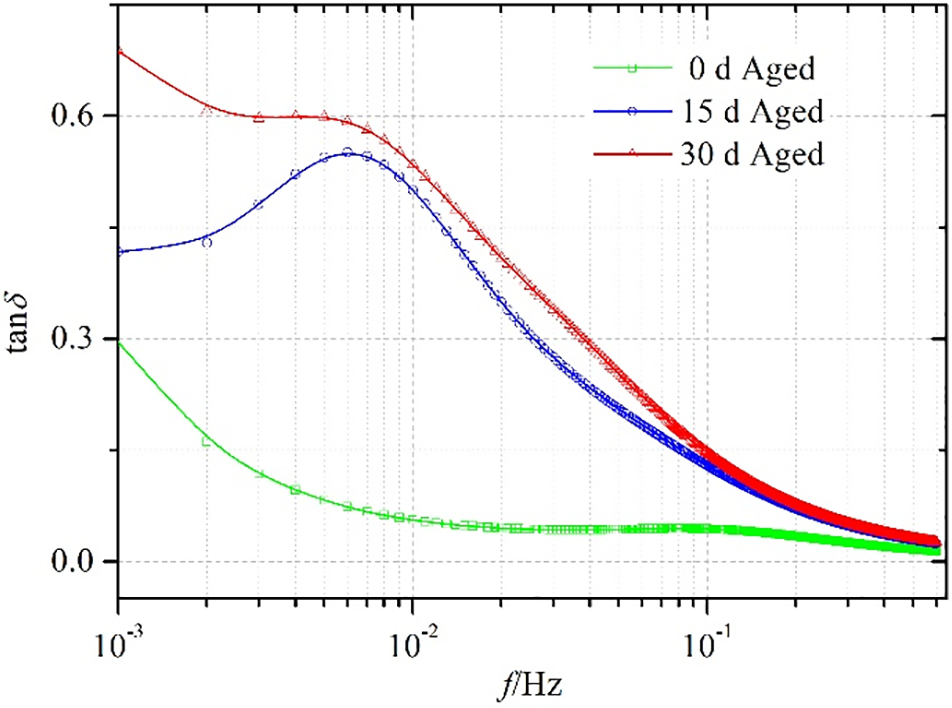
Figure 9: Loss factor spectrum of cables with different insulation conditions
Afterwards, the relationship between
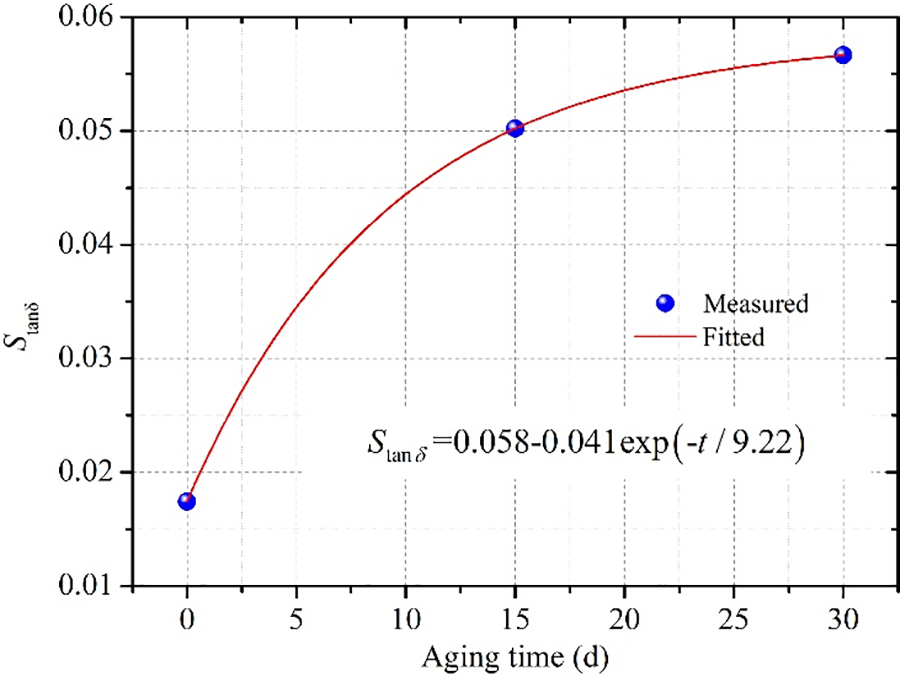
Figure 10: Characteristic parameter Stanδ of different aging time
This study introduces the sparsity-promoting dynamic mode decomposition algorithm, to identify the equivalent circuit parameters of the extended Debye model. Conclusions are drawn as follows:
i. The number of branches of the extended Debye model can be obtained by calculating the number of non-zero elements in the amplitude vector
ii. For the measured PDC data, the polarization current is less affected by the measurement noise than the depolarization current, which makes the SPDMD identification result based on the polarization current spectral line being better to reflect the response characteristics of the dielectric.
iii. Based on the circuit parameters of the extended Debye model, the time domain PDC test results can be converted into the frequency domain results, and then used to obtain the dielectric loss factor spectrum of the insulation. The integral of the dielectric loss factor on frequency domain can effectively evaluate the insulation condition of the XLPE cable.
Acknowledgement: The authors would like to express their gratitude to the reviewers and the editor.
Funding Statement: This work is supported by the Science and Technology Project of Guizhou Power Grid Co., Ltd. (No. GZKJXM20210405).
Author Contributions: The authors confirm contribution to the paper as follows: study conception and design: W. Wang, M. Chen; data collection: H. Yin; analysis and interpretation of results: W. Wang, Y. Li; draft manuscript preparation: W. Wang, Y. Li. All authors reviewed the results and approved the final version of the manuscript.
Availability of Data and Materials: The data presented in this study are available on request from the corresponding author.
Conflicts of Interest: The authors declare that they have no conflicts of interest to report regarding the present study.
References
1. Morsalin, S., Sahoo, A., Phung, B. T. (2019). Recovery voltage response of XLPE cables based on polarisation and depolarisation current measurements. IET Generation, Transmission & Distribution, 13(24), 5533–5540. [Google Scholar]
2. Zaengl, W. S. (2003). Applications of dielectric spectroscopy in time and frequency domain for HV power equipment. IEEE Electrical Insulation Magazine, 19(6), 9–22. [Google Scholar]
3. Thabet, A., Fouad, M. (2021). Assessment of dielectric strength and partial discharges patterns in nanocomposites insulation of single-core power cables. Journal of Advanced Dielectrics, 11(4), 2150022. [Google Scholar]
4. Thabet, A., Fouad, M. (2022). Dielectric strength and patterns of partial discharges in nanocomposites insulation of three-core belted power cables. Transactions on Electrical and Electronic Materials, 23(2), 136–148. [Google Scholar]
5. Mohamed, A. T. (2021). Emerging nanotechnology applications in electrical engineering. Hershey, Pennsylvania, USA: IGI Global. [Google Scholar]
6. Saha, T. K., Purkait, P., Muller, F. (2005). Deriving an equivalent circuit of transformers insulation for understanding the dielectric response measurements. IEEE Transactions on Power Delivery, 20(1), 149–157. [Google Scholar]
7. Morsalin, S., Phung, B. T. (2019). Modeling of dielectric dissipation factor measurement for XLPE cable based on Davidson-Cole model. IEEE Transactions on Dielectrics and Electrical Insulation, 26(3), 1018–1026. [Google Scholar]
8. Wang, D. Y., Zhou, L. J., Yang, Z. X., Cui, Y., Jiang, J. et al. (2020). A new testing method for the dielectric response of oil-immersed transformer. IEEE Transactions on Industrial Electronics, 67(12), 10833–10843. [Google Scholar]
9. Liu, J. F., Zhang, Y. Y., Xu, J. J., Rui, J., Zhang, G. J. et al. (2017). Quantitative relationship between aging condition of transformer oil-paper insulation and large time constant of extend Debye model. Electric Power Automation Equipment, 37(3), 197–202. [Google Scholar]
10. Liao, W., Zhou, L. J., Li, Z. X., Wang, D. Y., Zhang, J. et al. (2021). An IGBA algorithm based curve reconstruction method of frequency-domain dielectric spectroscopy for OIP bushing with non-uniform moisture distribution. IEEE Transactions on Transportation Electrification, 7(4), 3194–3203. [Google Scholar]
11. Morsalin, S., Phung, B. T. (2020). Dielectric response study of service-aged XLPE cable based on polarization and depolarization current method. IEEE Transactions on Dielectrics and Electrical Insulation, 27(1), 58–66. [Google Scholar]
12. Tang, M. J., Lei, M., Bai, F., Wei, J. L., Xu, H. et al. (2014). Parameter identification based on vector fitting method for extended Debye model of oil-paper insulation system. High Voltage Engineering, 40(2),548–556. [Google Scholar]
13. Rao, X. J., Zhou, K., Xie, M., Li, M. Z., Xi, H. (2020). Application of stabilization diagram method for solving polarization equivalent circuit parameters. Transactions of China Electrotechnical Society, 35(10), 2248–2256. [Google Scholar]
14. Banerjee, C. M., Baral, A., Chakravorti, S. (2020). De-trapped charge-affected depolarization-current estimation using short-duration dielectric response for diagnosis of transformer insulation. IEEE Transactions on Instrumentation and Measurement, 69(10), 7695–7702. [Google Scholar]
15. Dey, D., Chatterjee, B., Chakravorti, S., Munshi, S. (2010). Importance of denoising in dielectric response measurements of transformer insulation: An uncertainty analysis-based approach. Measurement, 43(1), 54–66. [Google Scholar]
16. Gao, Y. F., Liang, X. D., Chalashkanov, N. M., Wu, C., Dissado, L. A. (2018). Application and significance of the equivalent circuit method in the analysis of dielectric response. Proceedings of the CSEE, 38(1), 300–308+368. [Google Scholar]
17. Qi, J., Jiang, Q. Y., Cao, Y. J. (2008). A general prony identification algorithm for power system transfer function. Proceedings of the CSEE, 28(1), 41–46. [Google Scholar]
18. He, C. B., Li, H. K., Zhao, X. W., Wang, W. M., Wu, S. M. (2019). Analysis method for under-sampled blade tip-timing signal based on the rotational invariance technique with total least squares principle. Journal of Mechanical Engineering, 55(19), 103–111. [Google Scholar]
19. Mihailo, R. J., Schmid, P. J., Nichols, J. W. (2014). Sparsity-promoting dynamic mode decomposition. Physics of Fluids, 26(2), 024103–024124. [Google Scholar]
20. Zhao, A. X., Chen, X., Xu, L., Li, J. M., Deng, J. B. et al. (2020). Application of dielectric response in diagnoses of time and frequency domain on XLPE cable insulation. High Voltage Engineering, 46(1), 292–302. [Google Scholar]
21. Deng, Y. X., Yang, L. J., Guo, X. J., Nie, W., Liao, R. J. et al. (2020). Nonlinear dielectric response characteristics of damp oil-paper insulation and application of H-W model in time-frequency conversion. IEEE Transactions on Dielectrics and Electrical Insulation, 27(6), 2078–2086. [Google Scholar]
22. Du, L., Tan, J. Y., Wu, X. G., Wang, D. S., Chen, X. X. (2020). Study on accelerated electrical aging frequency domain feature of ZnO valve based on extended Debye model. High Voltage Engineering, 46(5), 1759–1767. [Google Scholar]
23. Wu, G. N., Xia, G. Q., Su, M., Zhu, H., Yang, F. B. et al. (2019). Evaluation method for moisture content and aging degree of transformer oil-paper insulation based on frequency dielectric spectroscopy and compensation factor. High Voltage Engineering, 45(3), 691–700. [Google Scholar]
Cite This Article
 Copyright © 2023 The Author(s). Published by Tech Science Press.
This work is licensed under a Creative Commons Attribution 4.0 International License , which permits unrestricted use, distribution, and reproduction in any medium, provided the original work is properly cited.
 Downloads
 Citation Tools