 Open Access
ARTICLE
Research on the MPPT of Photovoltaic Power Generation Based on the CSA-INC Algorithm
1 School of Automation and Electrical Engineering, Lanzhou Jiaotong University, Lanzhou, 730070, China
2 Rail Transit Electrical Automation Engineering Laboratory of Gansu Province (Lanzhou Jiaotong University), Lanzhou, 730070, China
* Corresponding Author: Shan Wang. Email:
Energy Engineering 2023, 120(1), 87-106. https://doi.org/10.32604/ee.2022.022122
Received 22 February 2022; Accepted 29 April 2022; Issue published 27 October 2022
Abstract
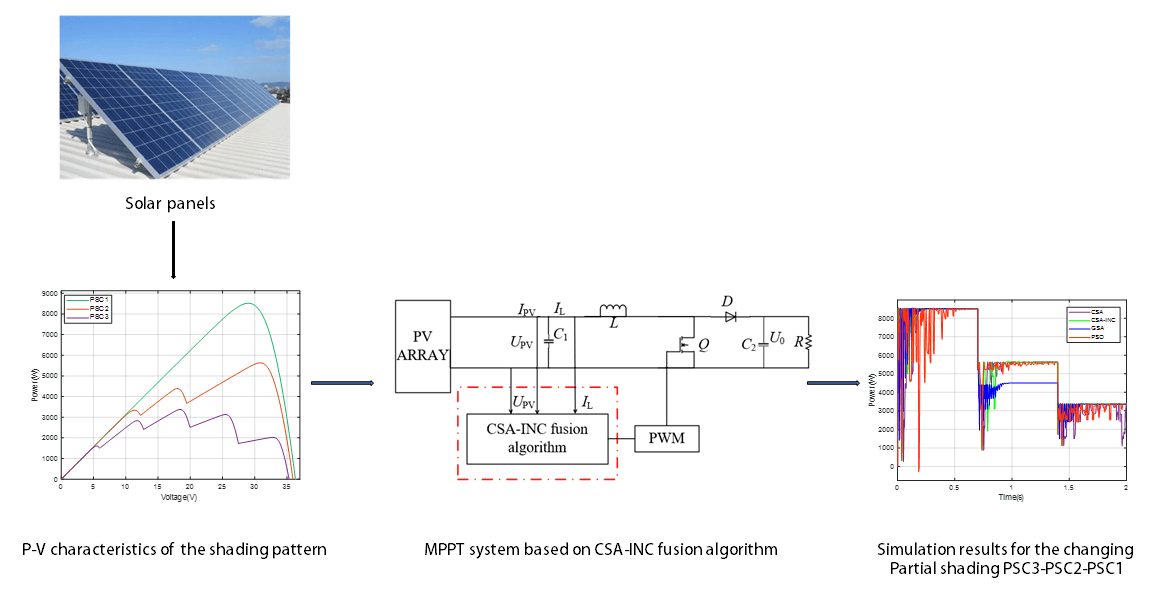
The existing Maximum Power Point Tracking (MPPT) method has low tracking efficiency and poor stability. It is easy to fall into the Local Maximum Power Point (LMPP) in Partial Shading Condition (PSC), resulting in the degradation of output power quality and efficiency. It was found that various bio-inspired MPPT based optimization algorithms employ different mechanisms, and their performance in tracking the Global Maximum Power Point (GMPP) varies. Thus, a Cuckoo search algorithm (CSA) combined with the Incremental conductance Algorithm (INC) is proposed (CSA-INC) is put forward for the MPPT method of photovoltaic power generation. The method can improve the tracking speed by more than 52% compared with the traditional Cuckoo Search Algorithm (CSA), and the results of the study using this algorithm are compared with the popular Particle Swarm Optimization (PSO) and the Gravitational Search Algorithm (GSA). CSA-INC has an average tracking efficiency of 99.99% and an average tracking time of 0.19 s when tracking the GMPP, which improves PV power generation’s efficiency and power quality.Graphic Abstract
Keywords
Human civilization faces many challenges due to the excessive use of non-renewable energy resources such as coal, oil, etc. The exponential growth of greenhouse gases (mainly carbon dioxide emissions) is a significant existential and practical problem, leading to severe environmental damage, thus threatening human society and the entire ecosystem [1]. In order to solve the aforementioned problems, governments of the world are calling for in-depth research into non-polluting, new, renewable energy sources to replace non-renewable sources. The development of clean energy, such as solar energy and wind energy, has received extensive attention [2]. Solar energy accounts for a significant portion of new energy development around the world, and photovoltaic power generation converts solar energy into electricity. Improving the efficiency of photovoltaic power generation, therefore, has been a hot topic of research by scholars both at home and abroad [3].
Currently, Hill Climbing (HC) [4,5], Perturb and Observe (P&O) [5,6], and the Incremental conductance Algorithm (INC) [6] are the most traditional MPPT methods, which have the advantages of simple structure and easy implementation. They oftentimes also obtain excellent control performance under uniform light intensity. However, because they can not distinguish the GMPP among the several peaks existing in the P-V curve under PSC, these methods mostly trap at a local peak (LP) [7]. Thus, the conventional methods are not a favorable option for handling the PSC in PV systems due to their failures regarding the aforementioned.
In recent years, scholars from various countries have proposed numerous advanced MPPT algorithms to solve the GMPP problem under PSC. Jiang et al. [8] and others proposed the PSO algorithm to realize GMPP tracking effectively. Chao et al. [9] designed an Ant Colony Optimization (ACO) algorithm with few parameters and rapid convergence. Al-Wesabi et al. [10] proposed the CSA-PID to find GMPP quickly. Moghassemi et al. [11] used the advantages of the Whale Optimization Algorithm (WOA), such as fast convergence and no power fluctuations, to implement MPPT under PSC with fewer and less computationally demanding algorithms parameters adjusted. The Gravitational Search Algorithm (GSA) [12] is a new swarm intelligence algorithm with global solid search capability and fast convergence. It is commonly used in problems such as classification and fault diagnosis of multi-classified data sets. However, it is less applied in multi-peak curve finding with PV MPPT control as an example [13].
The CSA is a new biomimetic intelligent optimization algorithm proposed by Yang et al. in 2009 based on the hatching parasitic behavior of the cuckoo [14,15], which has the advantages of high generality, few control parameters, and fast algorithm execution. Its overall performance is better than the PSO, GA, ACO, and Simulated Annealing (SA) algorithm.
However, the CSA, similar to other intelligent heuristics, suffers from the problem of inefficient search. The simulation verifies that the CSA has slow convergence speed, apparent power fluctuation, inaccurate tracking of PV MPPT, and easy to fall into LP under PSC. Based on the above problems, this paper proposes a Cuckoo search algorithm combined with the Incremental conductance Algorithm (CSA-INC). The main features and focuses of this paper are as follows:
(1) This paper proposed a CSA-INC applied to MPPT in PV systems.
(2) The algorithm utilizes the efficient global search capability of CSA to track to the vicinity of GMPP quickly and then uses the good local search and fast convergence properties of INC to quickly and accurately track to GMPP. Improves the convergence speed and tracking efficiency.
(3) The proposed algorithm can track true global power in less time and minimizes the oscillations under five different shading patterns, and compared with GSA, CSA, and PSO, it shows its superiority.
2 Mathematical Model of Photovoltaic Array
The P-V, I-V characteristics, and maximum power point parameters of photovoltaic arrays are related to external environmental factors, such as temperature, light intensity, etc. [16]. The Double diode photovoltaic cell model in Fig. 1 and the output characteristic equation are shown in Eq. (1).
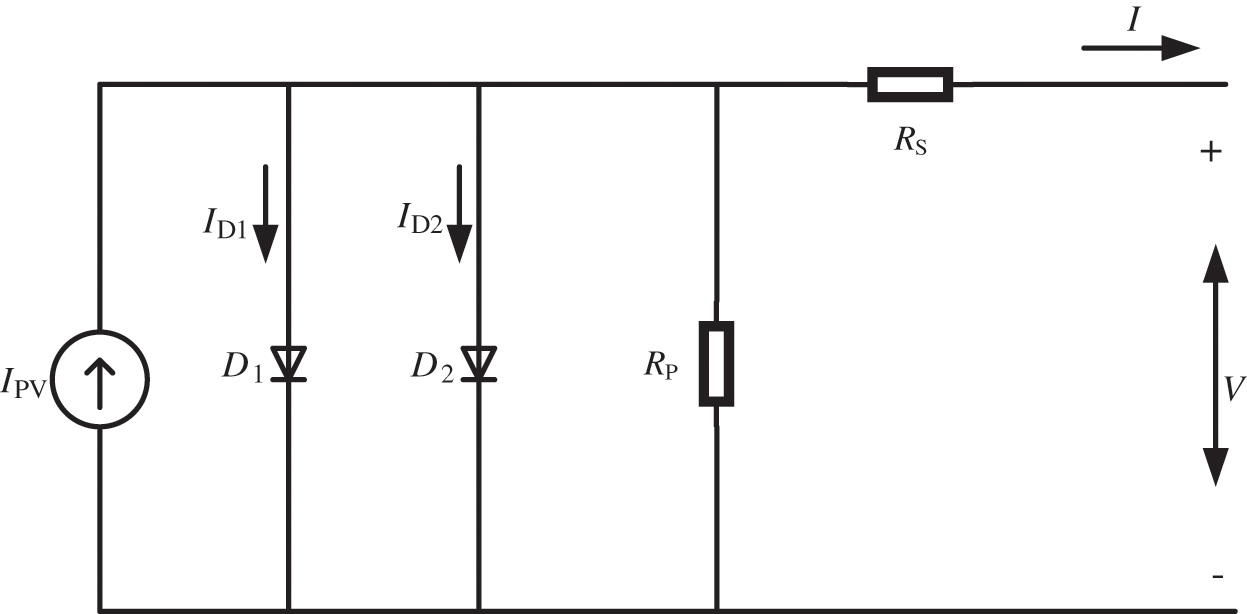
Figure 1: Double diode photovoltaic cell model
As double diodes can better improve the model's accuracy, this model is used to model in this paper. The output voltage-current characteristics of the photovoltaic cell are:
ID1 and ID2 are the reverse saturation currents of diodes D1 and D2, respectively, and the calculation formula is shown in Eq. (2).
ISC_STC and VOC_STC are the short-circuit current and the open-circuit voltage of the photovoltaic cell in the ideal state, respectively. K1 and K2 are the current temperature coefficient and the voltage temperature coefficient.
2.1 Output Characteristics of Photovoltaic Cells
Under conditions of uniform irradiance, the P-V characteristics of the PV module show a unique peak which is the MPP. However, this is not the case for the PV module with bypass diodes under PSCs. In case the PV cells receive different irradiance levels, the P-V curve exhibits several peaks. The multi-peak characteristic is obtained using the bypass diodes, and the number of the peaks depends on the total irradiance levels. The peak corresponding to the highest power is treated as the global MPP, whereas the remaining peaks are LMPPs [17]. Assuming that the photovoltaic system is simulated with a 5 × 1 array, the surface temperature of each cell remains consistent and constant. Three different shadow conditions are simulated: PSC 1: The light intensity received by the five battery modules is 1000 W/m2; At this point, the P-V curve has only one wave peak. PSC 2: The light received by the five battery modules are 1000, 1000, 800, 600, and 600 W/m2, respectively. The P-V curve has three wave peaks. PSC 3: The light received by the five battery modules is 1000, 800, 600, 400, and 200 W/m2, respectively. The P-V curve has five-wave peaks. Under three different solar radiation conditions, simulations are performed. The I-V and P-V curves under three different shading patterns are illustrated in Fig. 2.
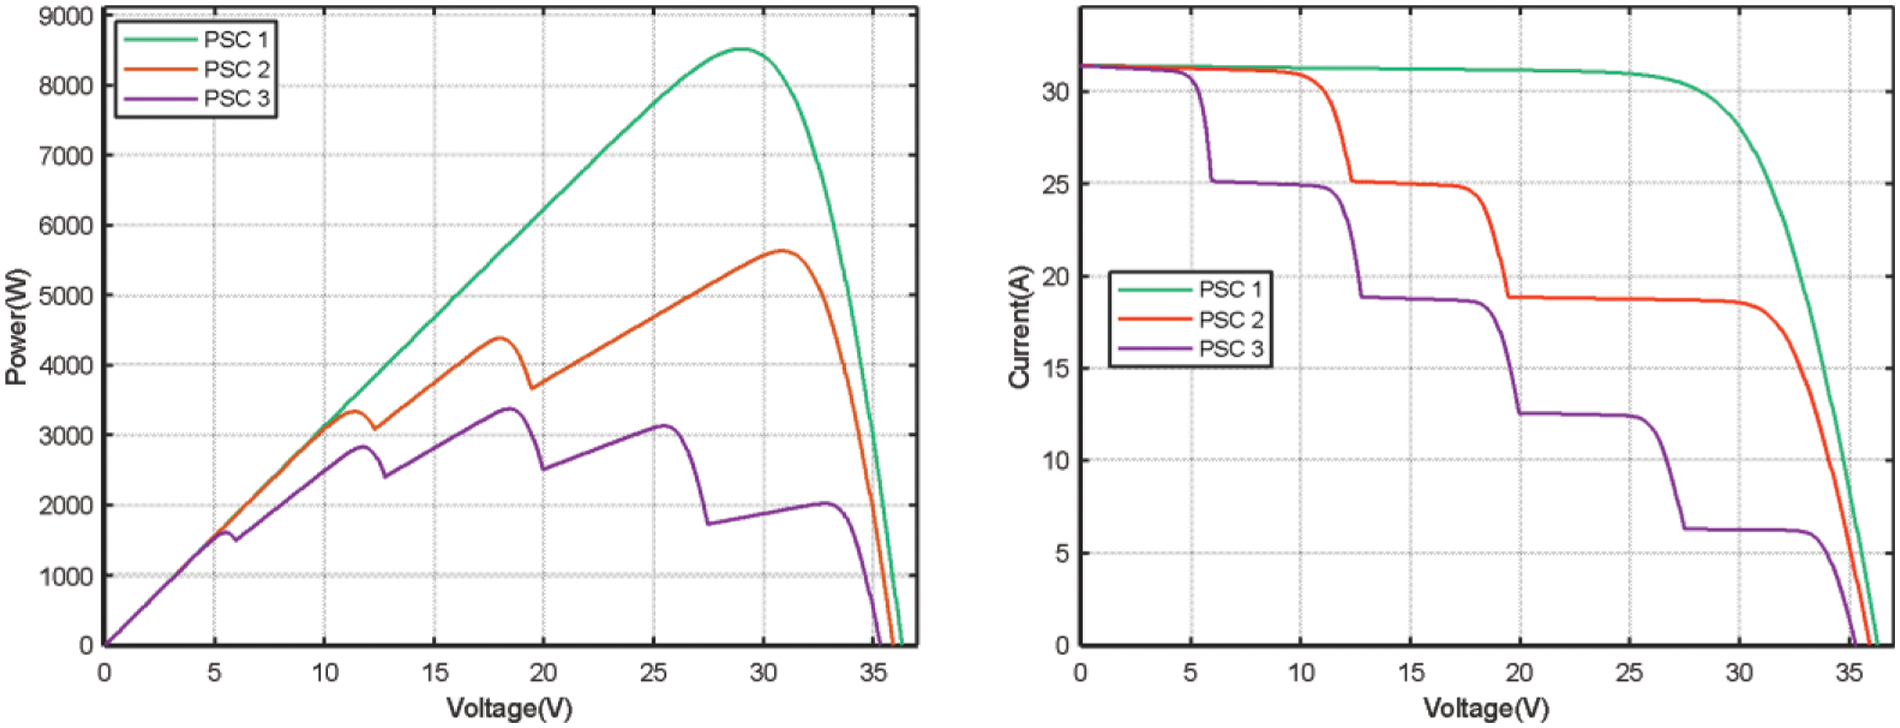
Figure 2: I-V and P-V characteristics of the shading pattern
3 MPPT Method Based on CSA-INC
The convergence speed of CSA is not sensitive to the selected parameters to a certain extent. It has the characteristics of simplicity, efficiency, superior search path, and strong global search capability. However, CSA also has a problem regarding how the convergence speed in the later optimization stage has a tendency to slow down. To overcome this shortcoming, we combine the CSA with the INC algorithm in this paper. We first use the cuckoo search algorithm to quickly find the range interval of the global maximum power point and then apply the conductivity increment algorithm to find the maximum power point in that interval.
The Cuckoo search algorithm comes from the following three rules:
(1) Each cuckoo lays an egg each time and puts it in a randomly selected host bird nest;
(2) The birds’ nest with the best quality will appear in the next generation;
(3) The number of available host birds is fixed, and the host bird finds the eggs laid by the cuckoo with probability
In this paper, the cuckoo egg position update adopts the Lévy Flight method, improving the global search ability, having fewer adjustment parameters, fast convergence, and prevent the algorithm from falling into the optimal local solution to a large extent [18]. The formula of Lévy Flight is shown in Eq. (3).
where
In the formula,
where
The basic process of CSA is as follows:
(1) Initialize the parameters of the cuckoo algorithm, the number of bird nests after initialization is N, and the probability of bird eggs found by other birds
(2) The position of the bird’s nest is initialized. Randomly generate the position of the bird’s nest Xi = [X1,X2,…,XS], i=1,2,…,Nπ;
(3) Evaluate the quality of the bird’s nest. Calculate the quality of the bird’s nest, which is the corresponding fitness value, and record the optimal quality Pbest and the position of the bird’s nest;
(4) Improve and update the position of the bird's nest through Lévy Flight;
(5) The improved bird's nest quality is calculated and compared with the previous bird’s nest quality, and N bird’s nests with better quality are retained;
(6) Improve and update the position of the bird's nest according to the probability
(7) Update and record the quality and location of the bird's nest;
(8) Output the best nest quality value, judge whether the end condition is met, and return to Step 3 if the end condition is not met;
Applying the Cuckoo algorithm to the maximum power point tracking control in the photovoltaic system, the position of the bird's nest corresponds to the duty cycle, and the quality of the bird's nest is the corresponding power.
The PSO algorithm is equivalent to the particular case of the cuckoo algorithm (equivalent to the specific case where other birds find cuckoo probability
The flow chart of the MPPT method based on the CSA is shown in Fig. 3.
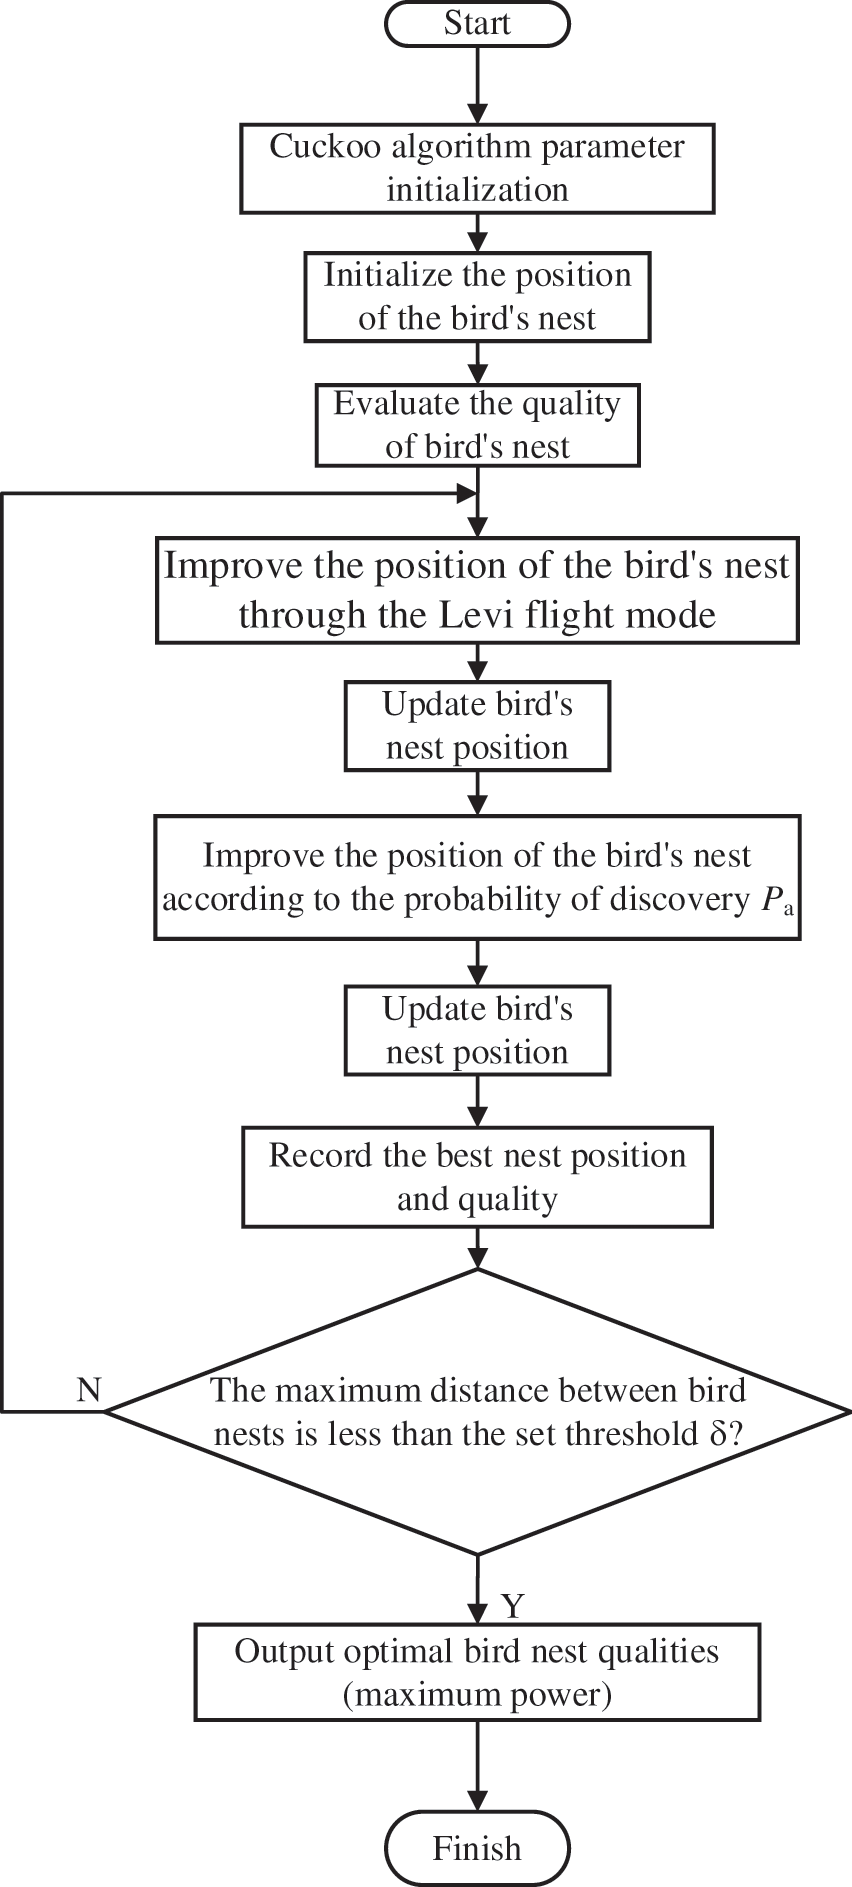
Figure 3: Flow chart of MPPT method based on CSA
3.2 Incremental Conductance Algorithm
The Incremental conductance Algorithm is a conventional maximum power point tracking algorithm. The principle of the algorithm is to track the maximum power by differentiating the power and voltage equal to zero. Its main principles are as follows:
The photovoltaic power formula is shown in Eq. (7).
Taking the derivation of V at both ends of the above equation simultaneously, it can get Eq. (8).
The power is on the left of the maximum powerpoint. At this time, the control duty cycle D is reduced, and the parallel voltage increases.
The power is on the right of the maximum powerpoint. At this time, the control duty cycle D is increased, and the parallel voltage is reduced.
The power is at the maximum powerpoint. The control duty cycle D remains unchanged, and the maximum power point is tracked.
3.3 MPPT Method Based on CSA-INC Fusion Algorithm
This paper combines the cuckoo search algorithm and Incremental conductance Algorithm for MPPT. The Cuckoo search algorithm is first applied to perform a global search and converge quickly to the vicinity of the MPP. Then the conductivity increment algorithm is introduced to optimize and improve the problem that the Cuckoo algorithm tends to fall into local optimums and slow convergence at a later stage using the conductivity increment algorithm's good local search and fast convergence characteristics.
To speed up the convergence speed of the CSA-INC algorithm, we need to set the CSA’s termination condition and introduce the INC algorithm in time. When the maximum position difference of the bird’s nest is less than a small threshold δ, the operation of the cuckoo algorithm is ended, the Incremental conductance Algorithm is started, and δ = 0.05 is set. In the tracking process of the Incremental conductance Algorithm, the termination discriminant is as follows:
When Eq. (9) holds, it is considered that the global MPP has been tracked. The disturbance is stopped to avoid fluctuating output power, and the maximum power Pmpp is output.
3.3.2 Algorithm Restart Conditions
When moving clouds, dust, and bird excrement cover part of the shadow or light intensity changes, the output power of the photovoltaic system will also change. To reduce the power mismatch and reduce the power generation efficiency, the algorithm needs to be restarted. The output power changes to
The formula
The flow chart of the MPPT method based on CSA-INC is shown in Fig. 4.
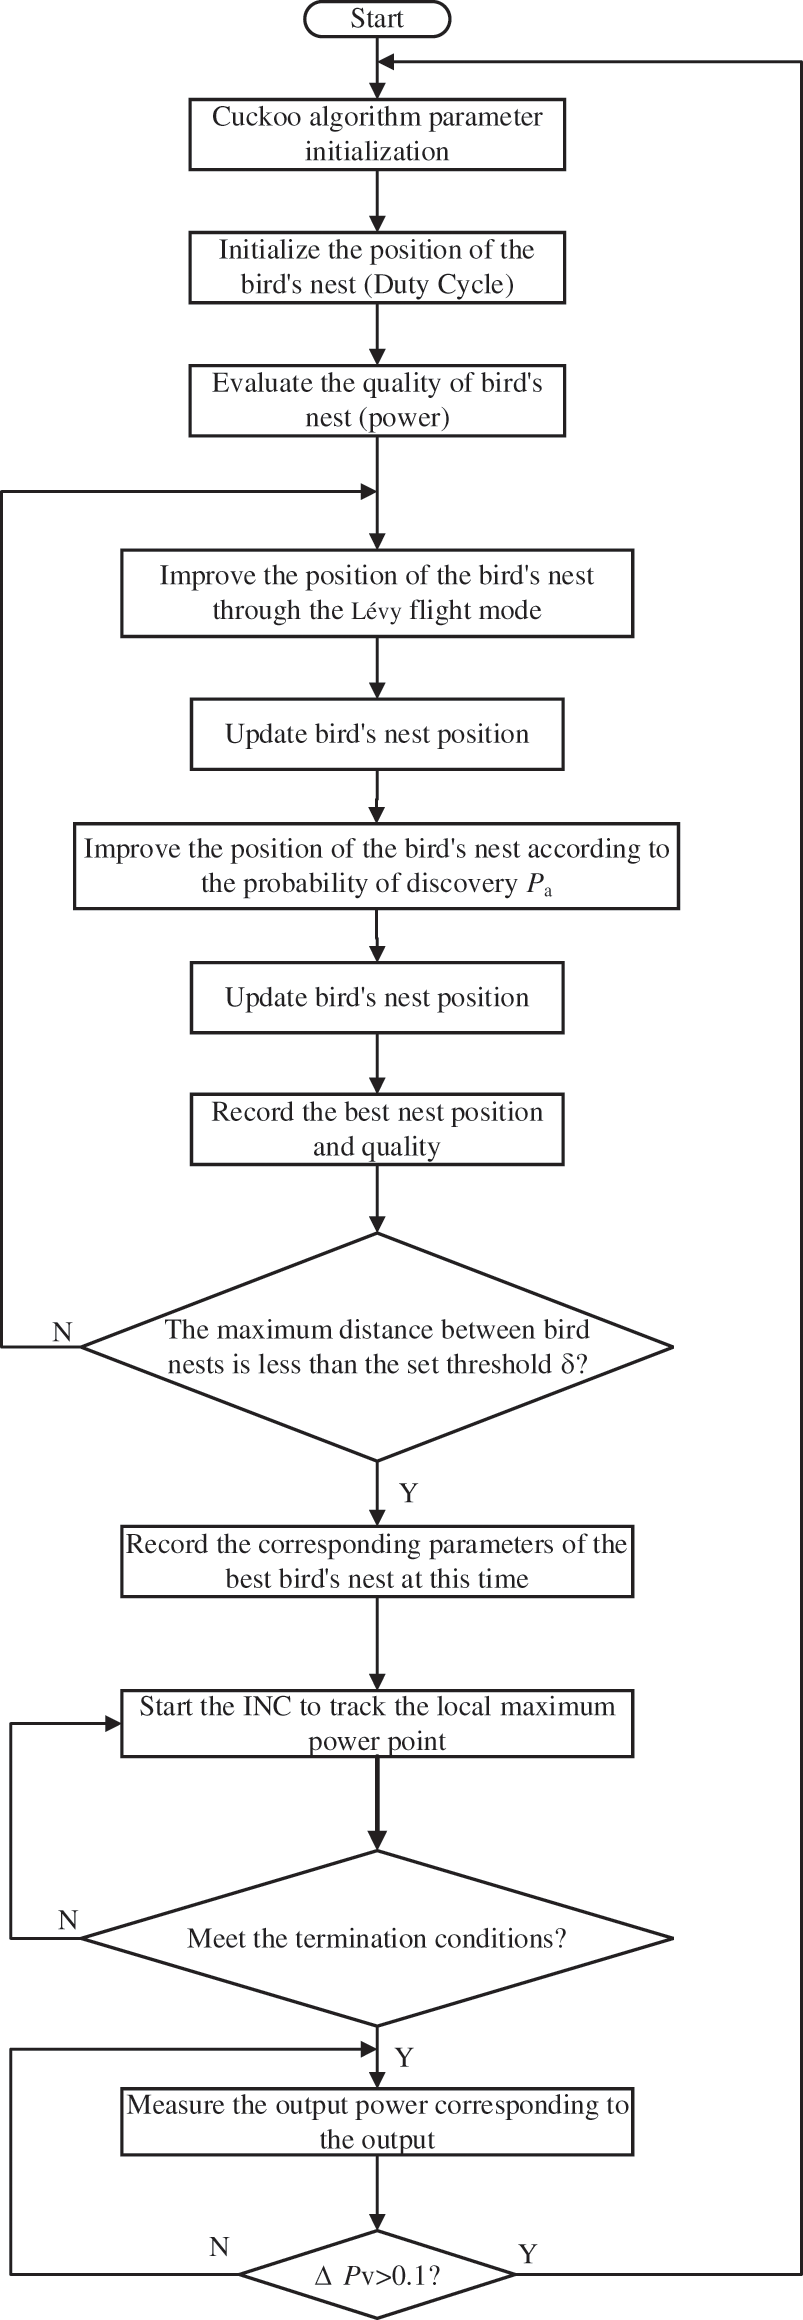
Figure 4: Flow chart of MPPT method based on CSA-INC
MATLAB/SIMULINK is used to perform simulations and check the performance of the CSA-INC based MPPT. The PV system model contains 5 × 1 PV arrays, and each PV module contains four parallel and two series-connected PV cells. The photovoltaic module is an Aavid Solar ASMS-165P, and detailed Specifications of the PV module used in Table 1 and the given values for the boost converter components: Cin = 10 uF, Cout = 60 uF, and L = 1 mH. The switching frequency is 30 kHz, and the MPPT controller’s sampling time is set to 0.01 s.

The model of MPPT system based on CSA-INC fusion algorithm is shown in Fig. 5. Five case studies are performed to test the performance of the CSA-INC; three PSCs and two rapidly changing PSCs. The details of the irradiance cases used in simulations are in Table 2. The corresponding P-V curves are illustrated in Fig. 6. The performance of the CSA-INC is compared with that of three algorithms; the CSA, GSA, and PSO. The population size for all algorithms is set to 4, while the maximum number of iterations is 10. The initial values of the duty cycles are chosen to be uniformly distributed within the search space range of the duty cycle from 0 to 1, which are [0 0.3 0.5 0.7]. The parameters used for each algorithm are selected based on high MPPT efficiency as follows:

Figure 5: MPPT system based on CSA-INC fusion algorithm

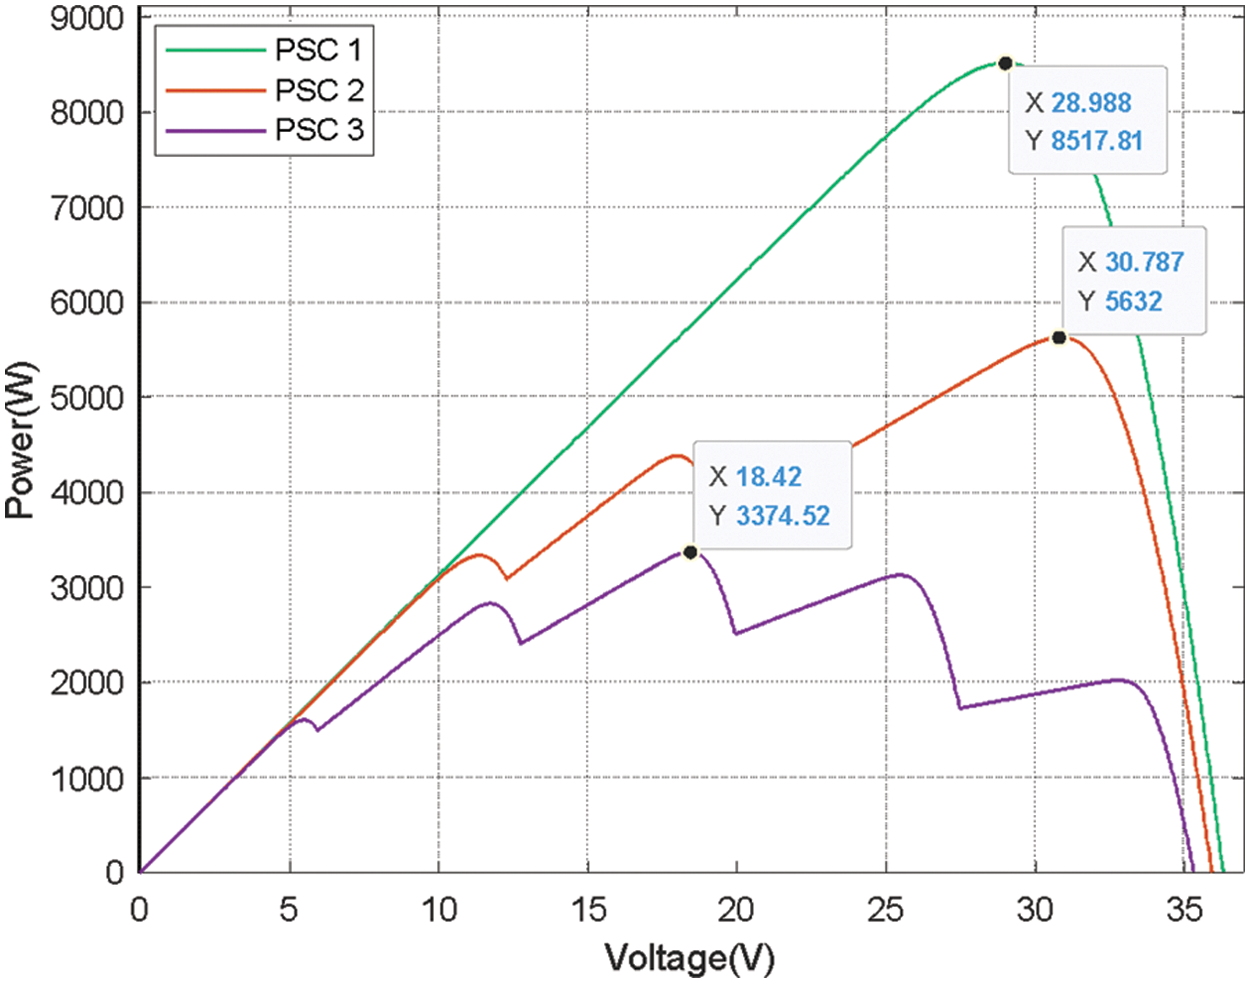
Figure 6: The P-V curves of the PV array under the studied partial shading cases
CSA-INC: N = 4, Pa = 0.25, α = 0.05, β = 1.5,
CSA: N = 4, Pa = 0.25, α = 0.05, β = 1.5.
GSA:
PSO: w = 0.4, C1 = 1.2, C2 = 1.6.
The simulation results of the different algorithms' PV power and duty cycle for the first case of PSC 1 are presented in Fig. 7. This pattern shows a one-wave peak of the P-V curve with 8517.81 W. The power achieved by the PSO, GSA, CSA, and CSA-INC is 8516.82 W, 8517.33 W, 8517.26 W, and 8517.58 W, with an efficiency of 99.98%, 99.99%, 99.99%, and 99.99%, respectively. The tracking times are 0.75 s, 0.25 s, 0.26 s, and 0.18 s for the PSO, GSA, CSA, and CSA-INC, respectively. The CSA-INC tracking time is reduced by 76% compared to the PSO. It can be noticed from the results that the power fluctuations for the CSA-INC during the tracking time are fewer than PSO and CSA. All four algorithms tracked GMPP under PSC 1.
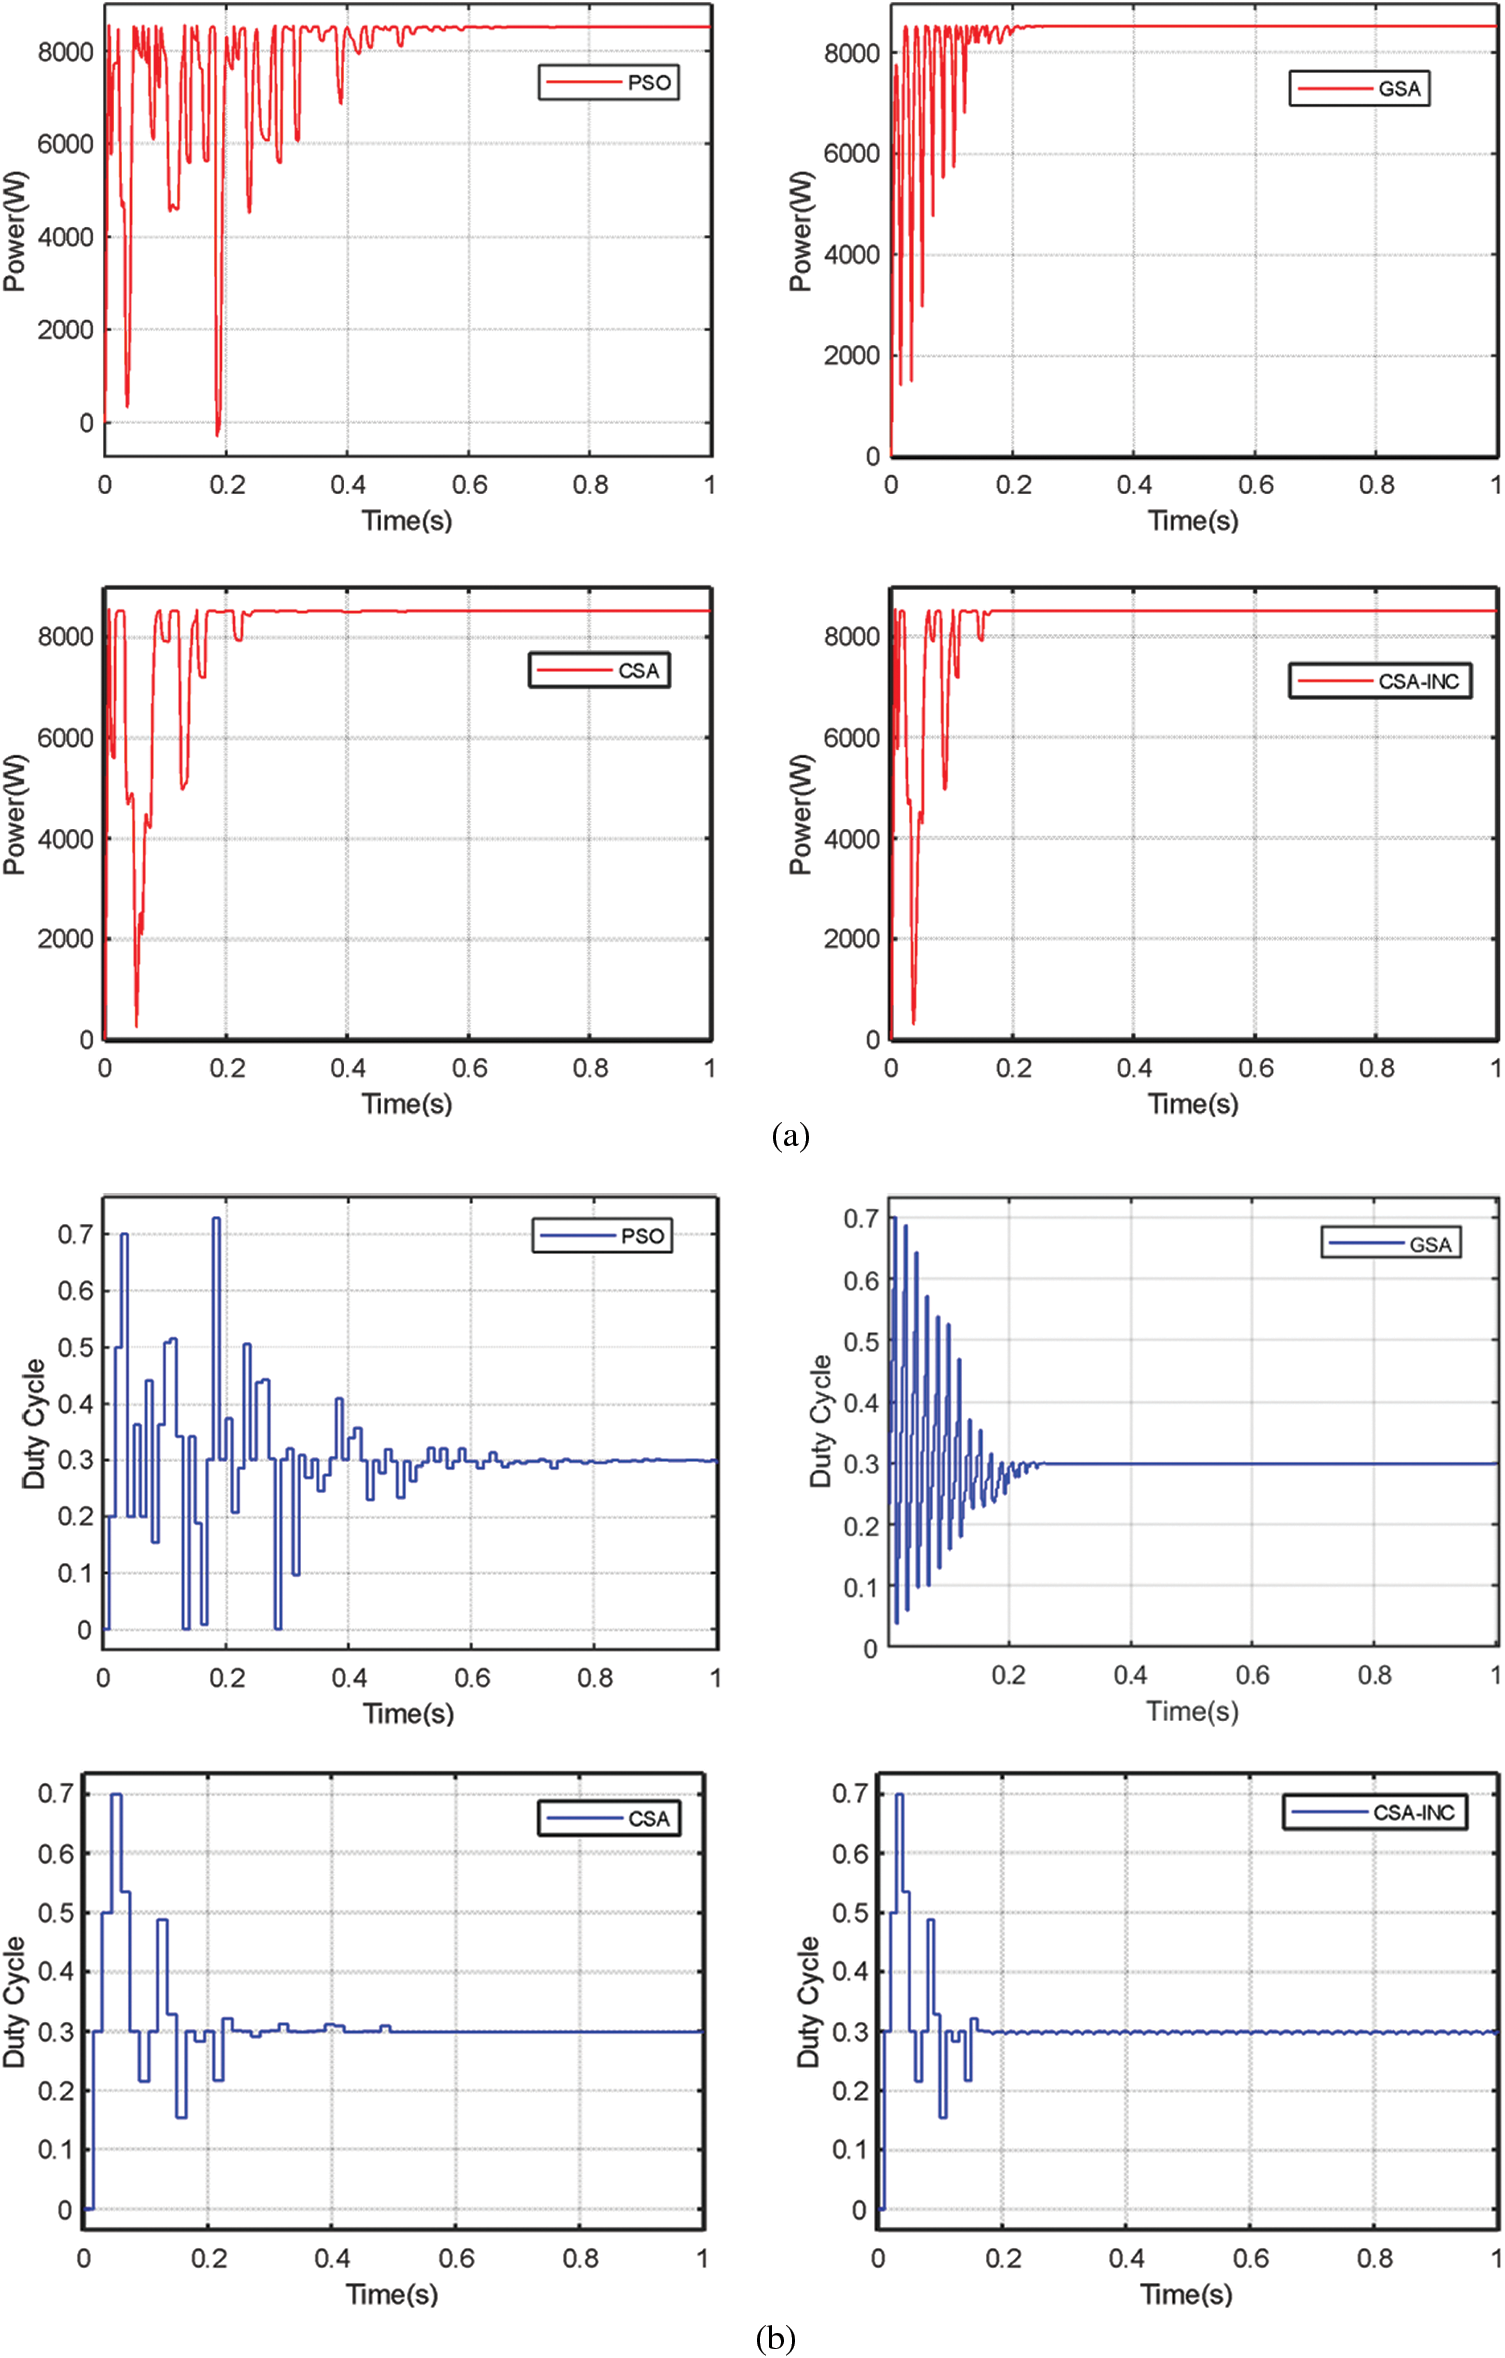
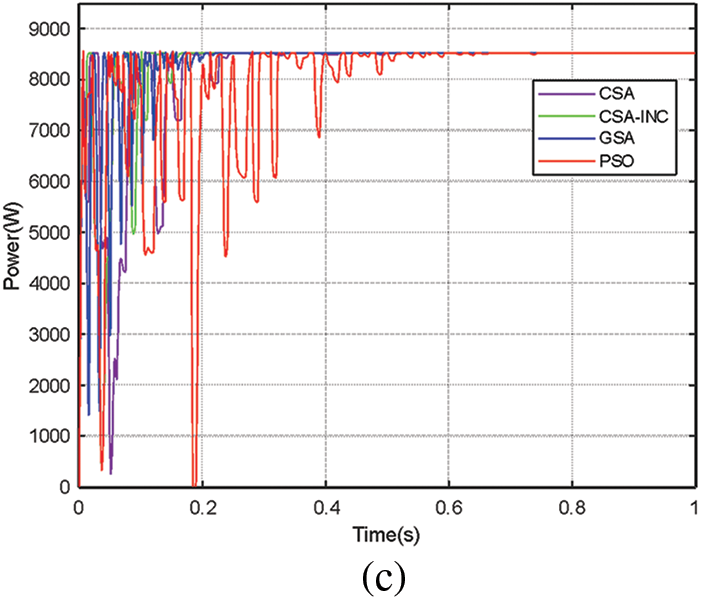
Figure 7: Simulation results for the first partial shading case PSC 1: (a) PV power (b) Duty cycle (c) Four algorithms power comparison
The simulation results of the different algorithms' PV power and duty cycle for the second case of PSC 2 are presented in Fig. 8. This pattern shows three-wave peaks of the P-V curve with 5632 W. The PSO, GSA, CSA, and CSA-INC achieved a power of 5221.84 W, 4376.82 W, 5532.52 W, and 5631.99 W with an efficiency of 92.72%, 77.71%, 98.23%, and 99.99%, respectively. The tracking times are 0.13 s, 0.28 s, 0.52 s, and 0.22 s for the PSO, GSA, CSA, and CSA-INC, respectively. The CSA-INC tracking time is reduced by 58% compared to the CSA. Although PSO and GSA trace times are faster than CSA-INC, they fail to trace GMPP. Trace efficiency is low. CSA-INC has less power fluctuation, higher tracking efficiency, and excellent MPPT performance than the other three algorithms.
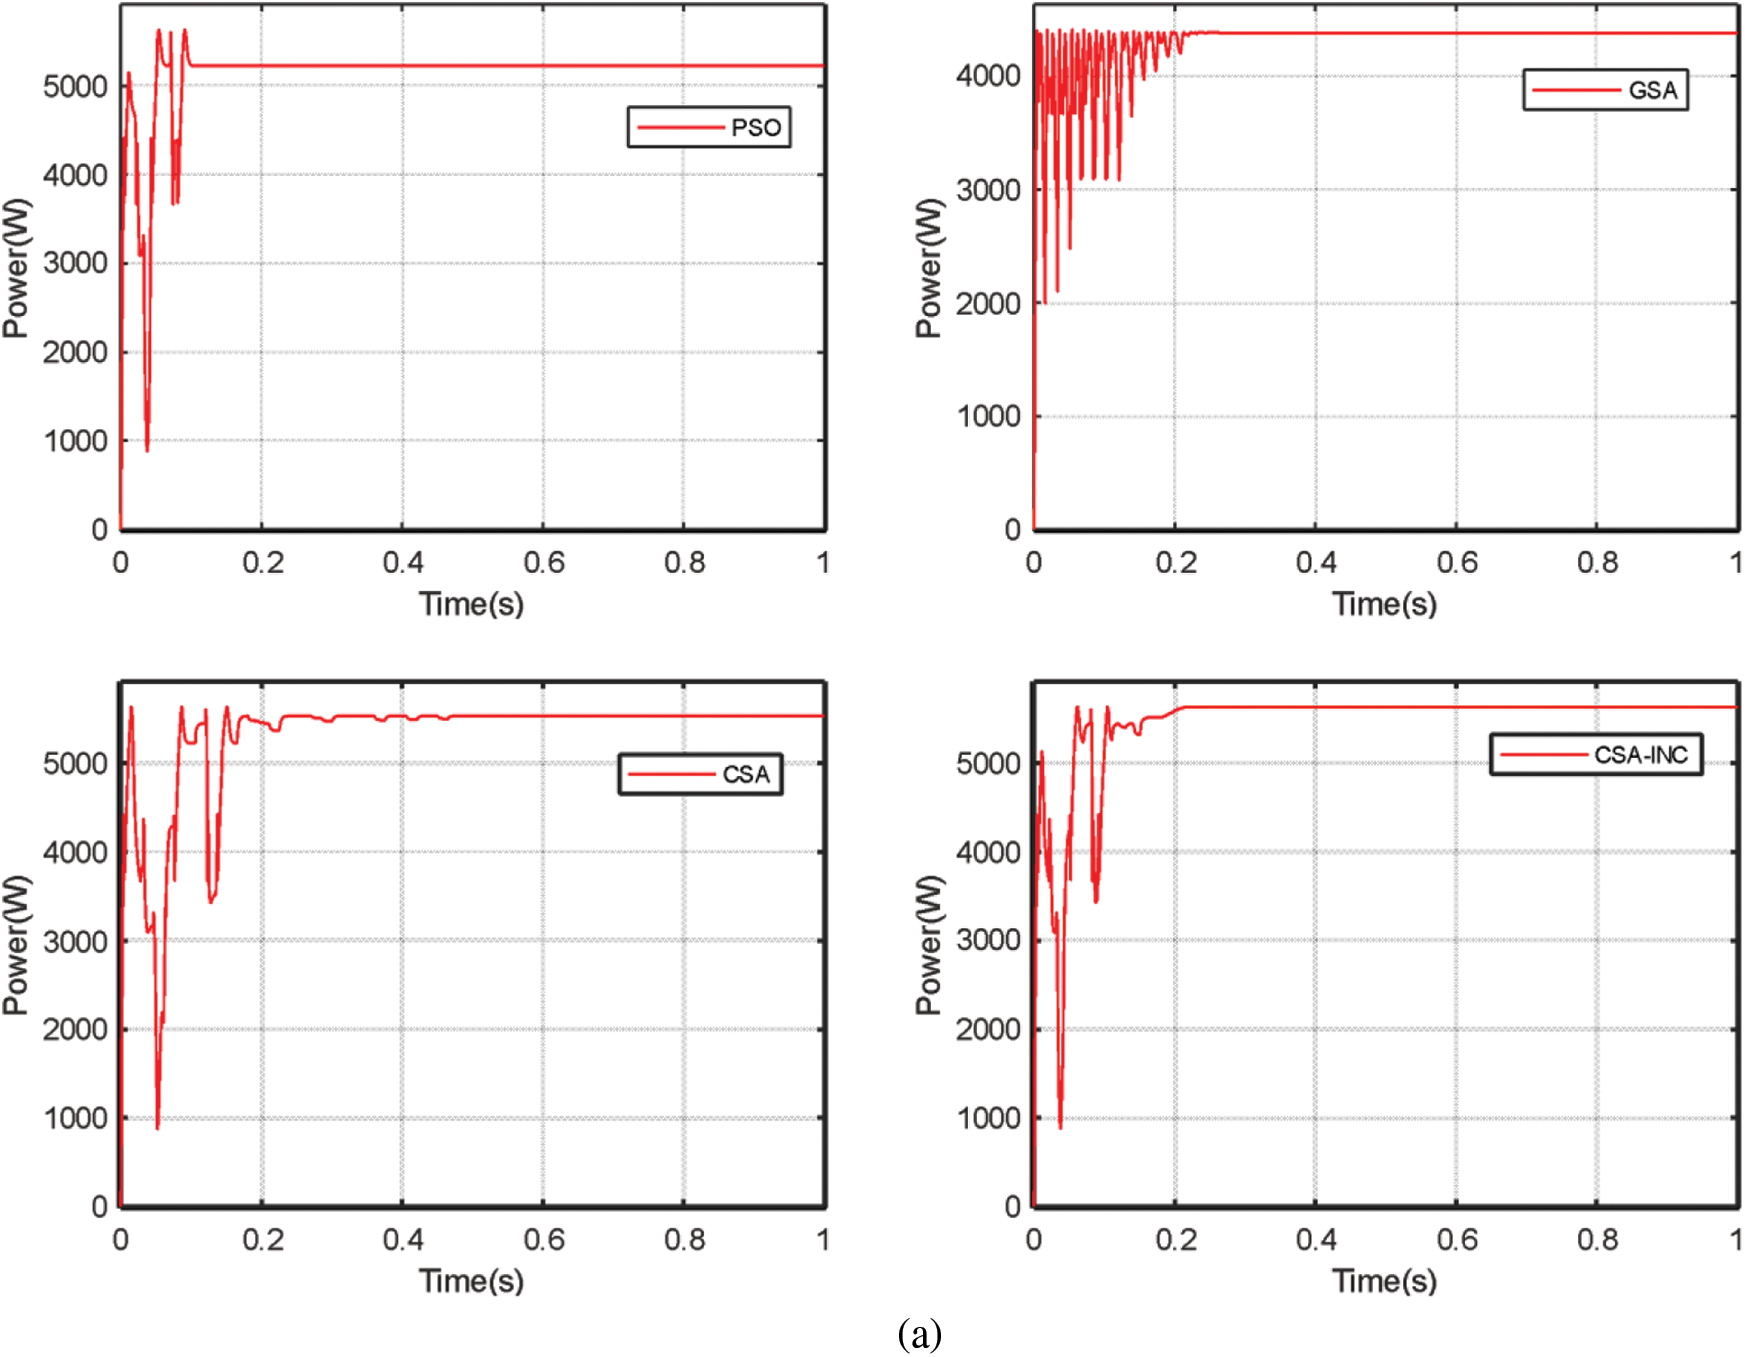
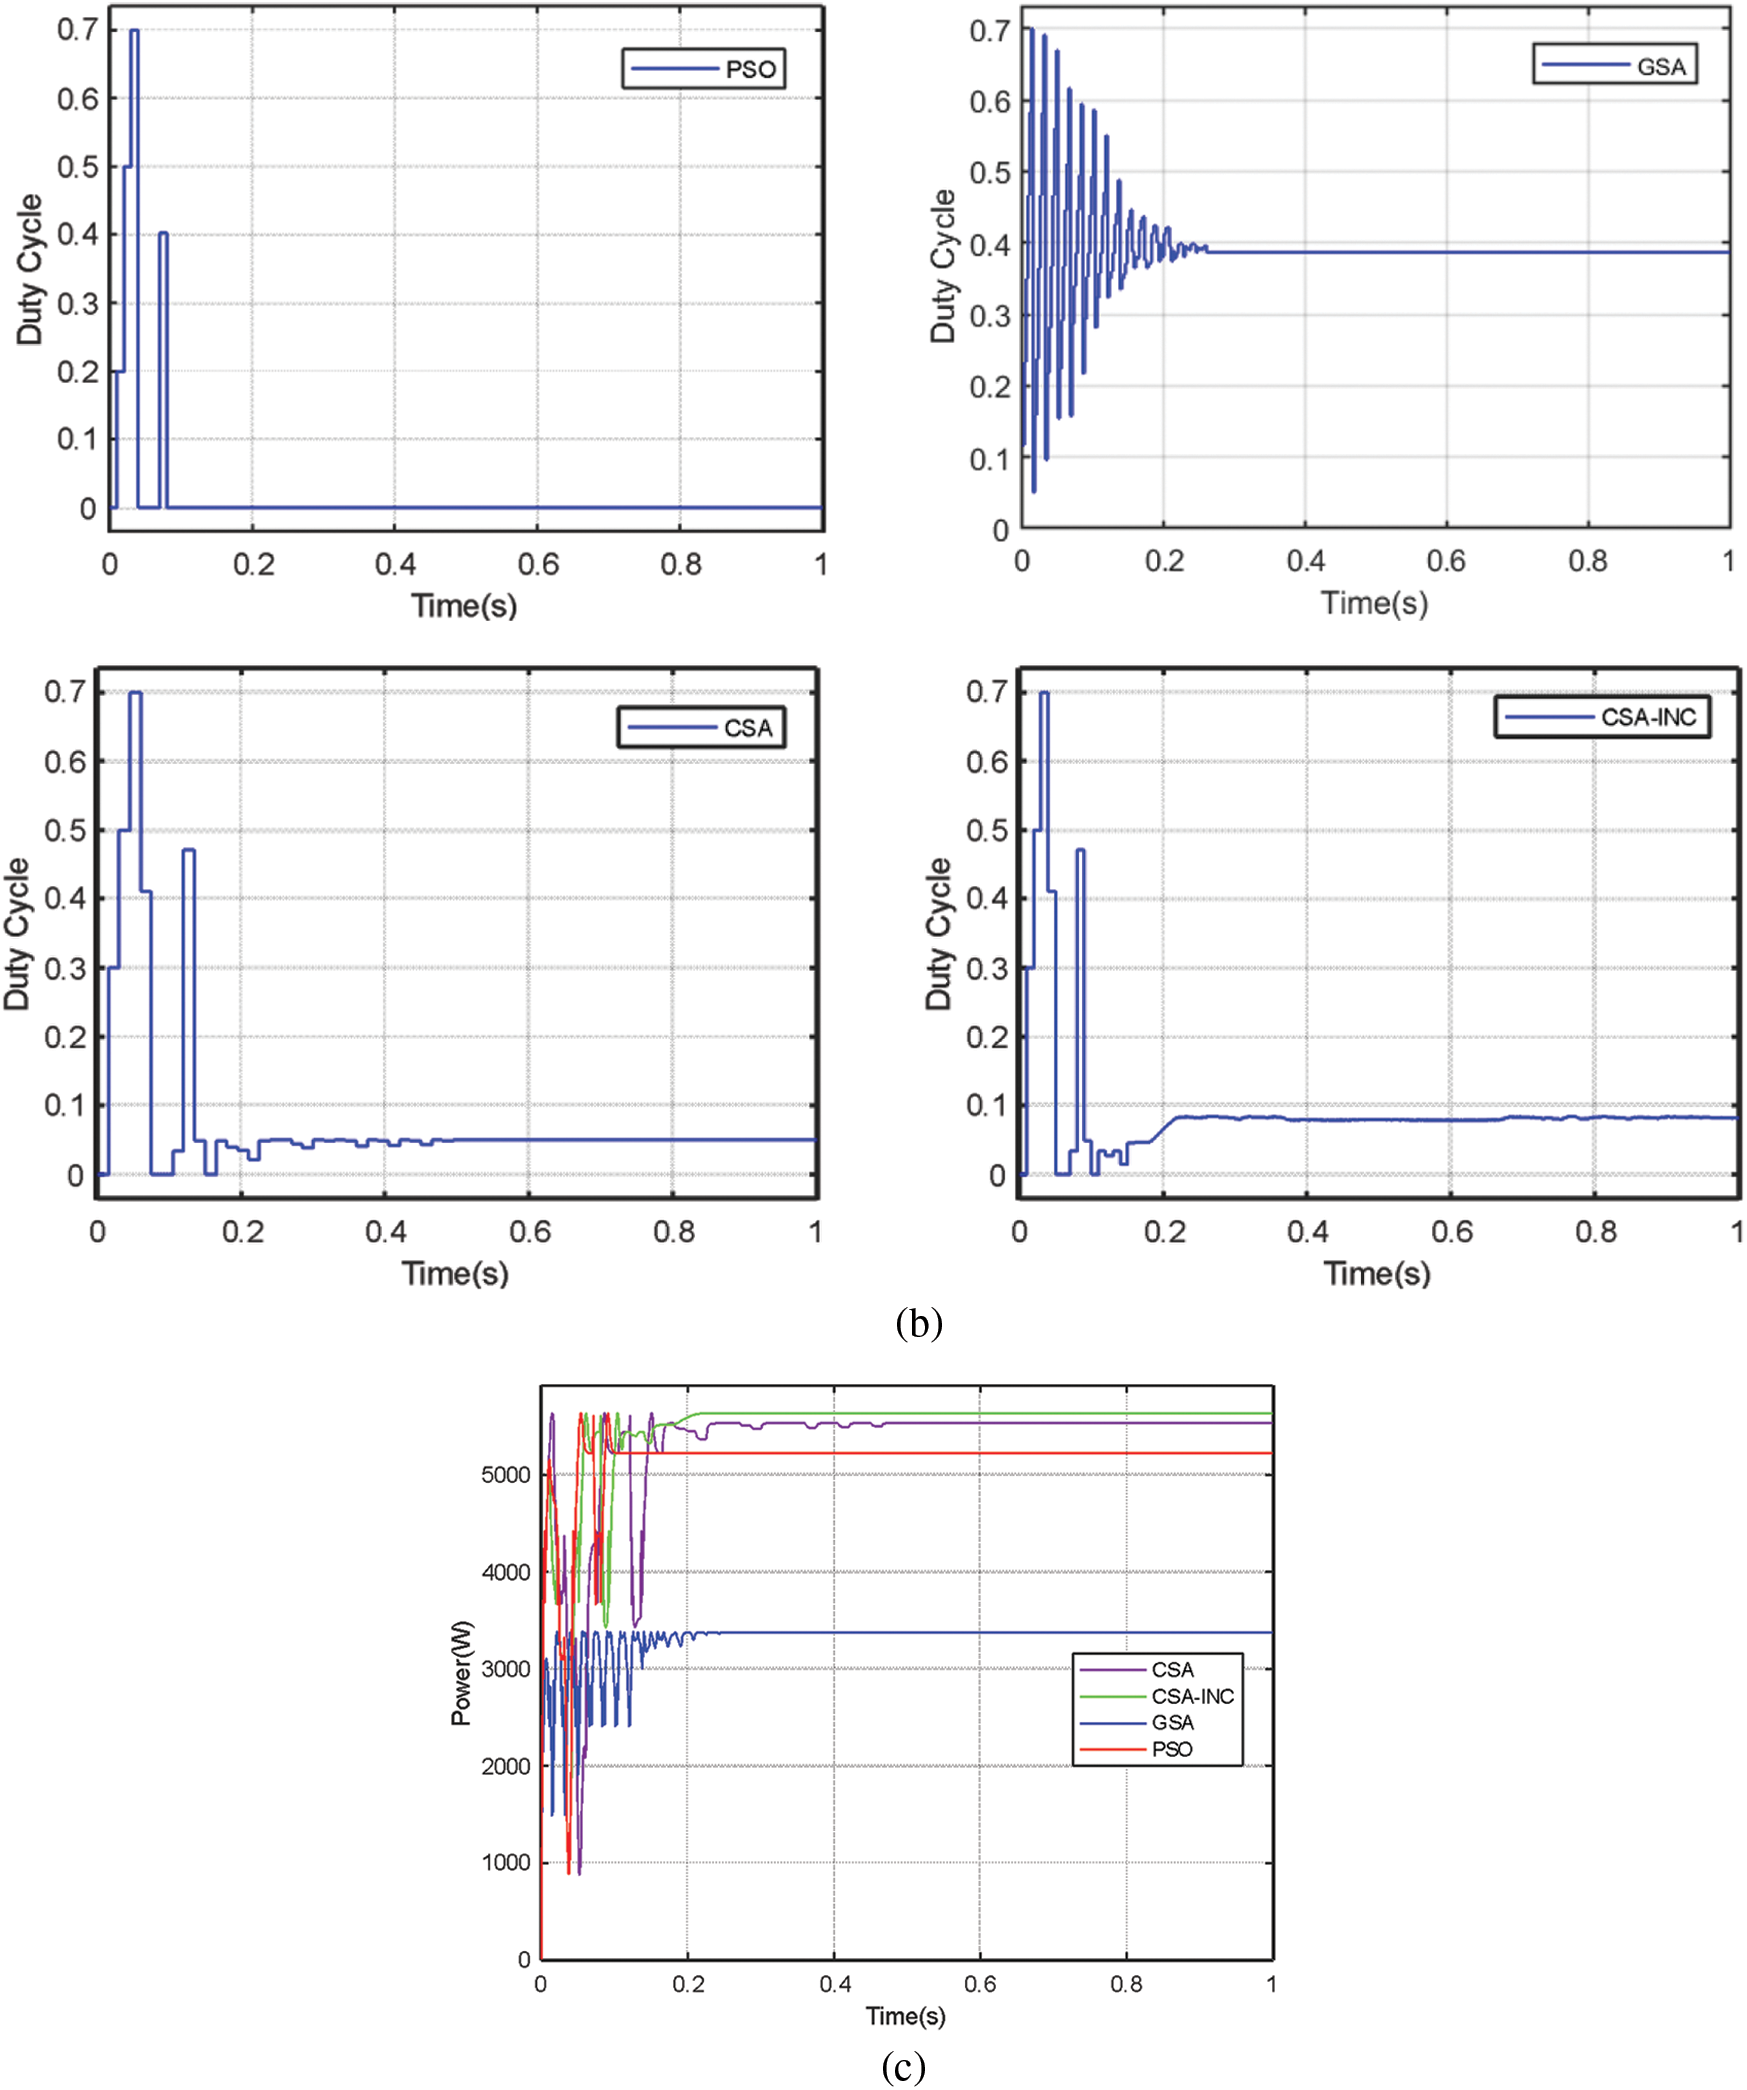
Figure 8: Simulation results for the second partial shading case PSC 2: (a) PV power (b) Duty cycle (c) Four algorithms power comparison
The third case, PSC 3, shows a GMPP of 3374.52 W and five-wave peaks of the P-V curve. The obtained simulation results for the four algorithms are presented in Fig. 9. As can be noticed from these results, The CSA-INC was the faster in the tracking process. The PSO, GSA, CSA, and CSA-INC achieved a power of 3372.46 W, 3373.77 W, 3373.21 W, and 3374.47 W with an efficiency of 99.93%, 99.97%, 99.96%, and 99.99%, respectively. The tracking times are 0.62 s, 0.28 s, 0.52 s, and 0.17 s for the PSO, GSA, CSA, and CSA-INC, respectively. The CSA-INC reduced the tracking time by 73%, 59%, and 67% compared with PSO, GSA, and CSA. As shown in Fig. 8, all four algorithms tracked GMPP when there were five-wave peaks in the P-V curve, and CSA-INC tracked GMPP the fastest and most efficiently, showing excellent MPPT performance.
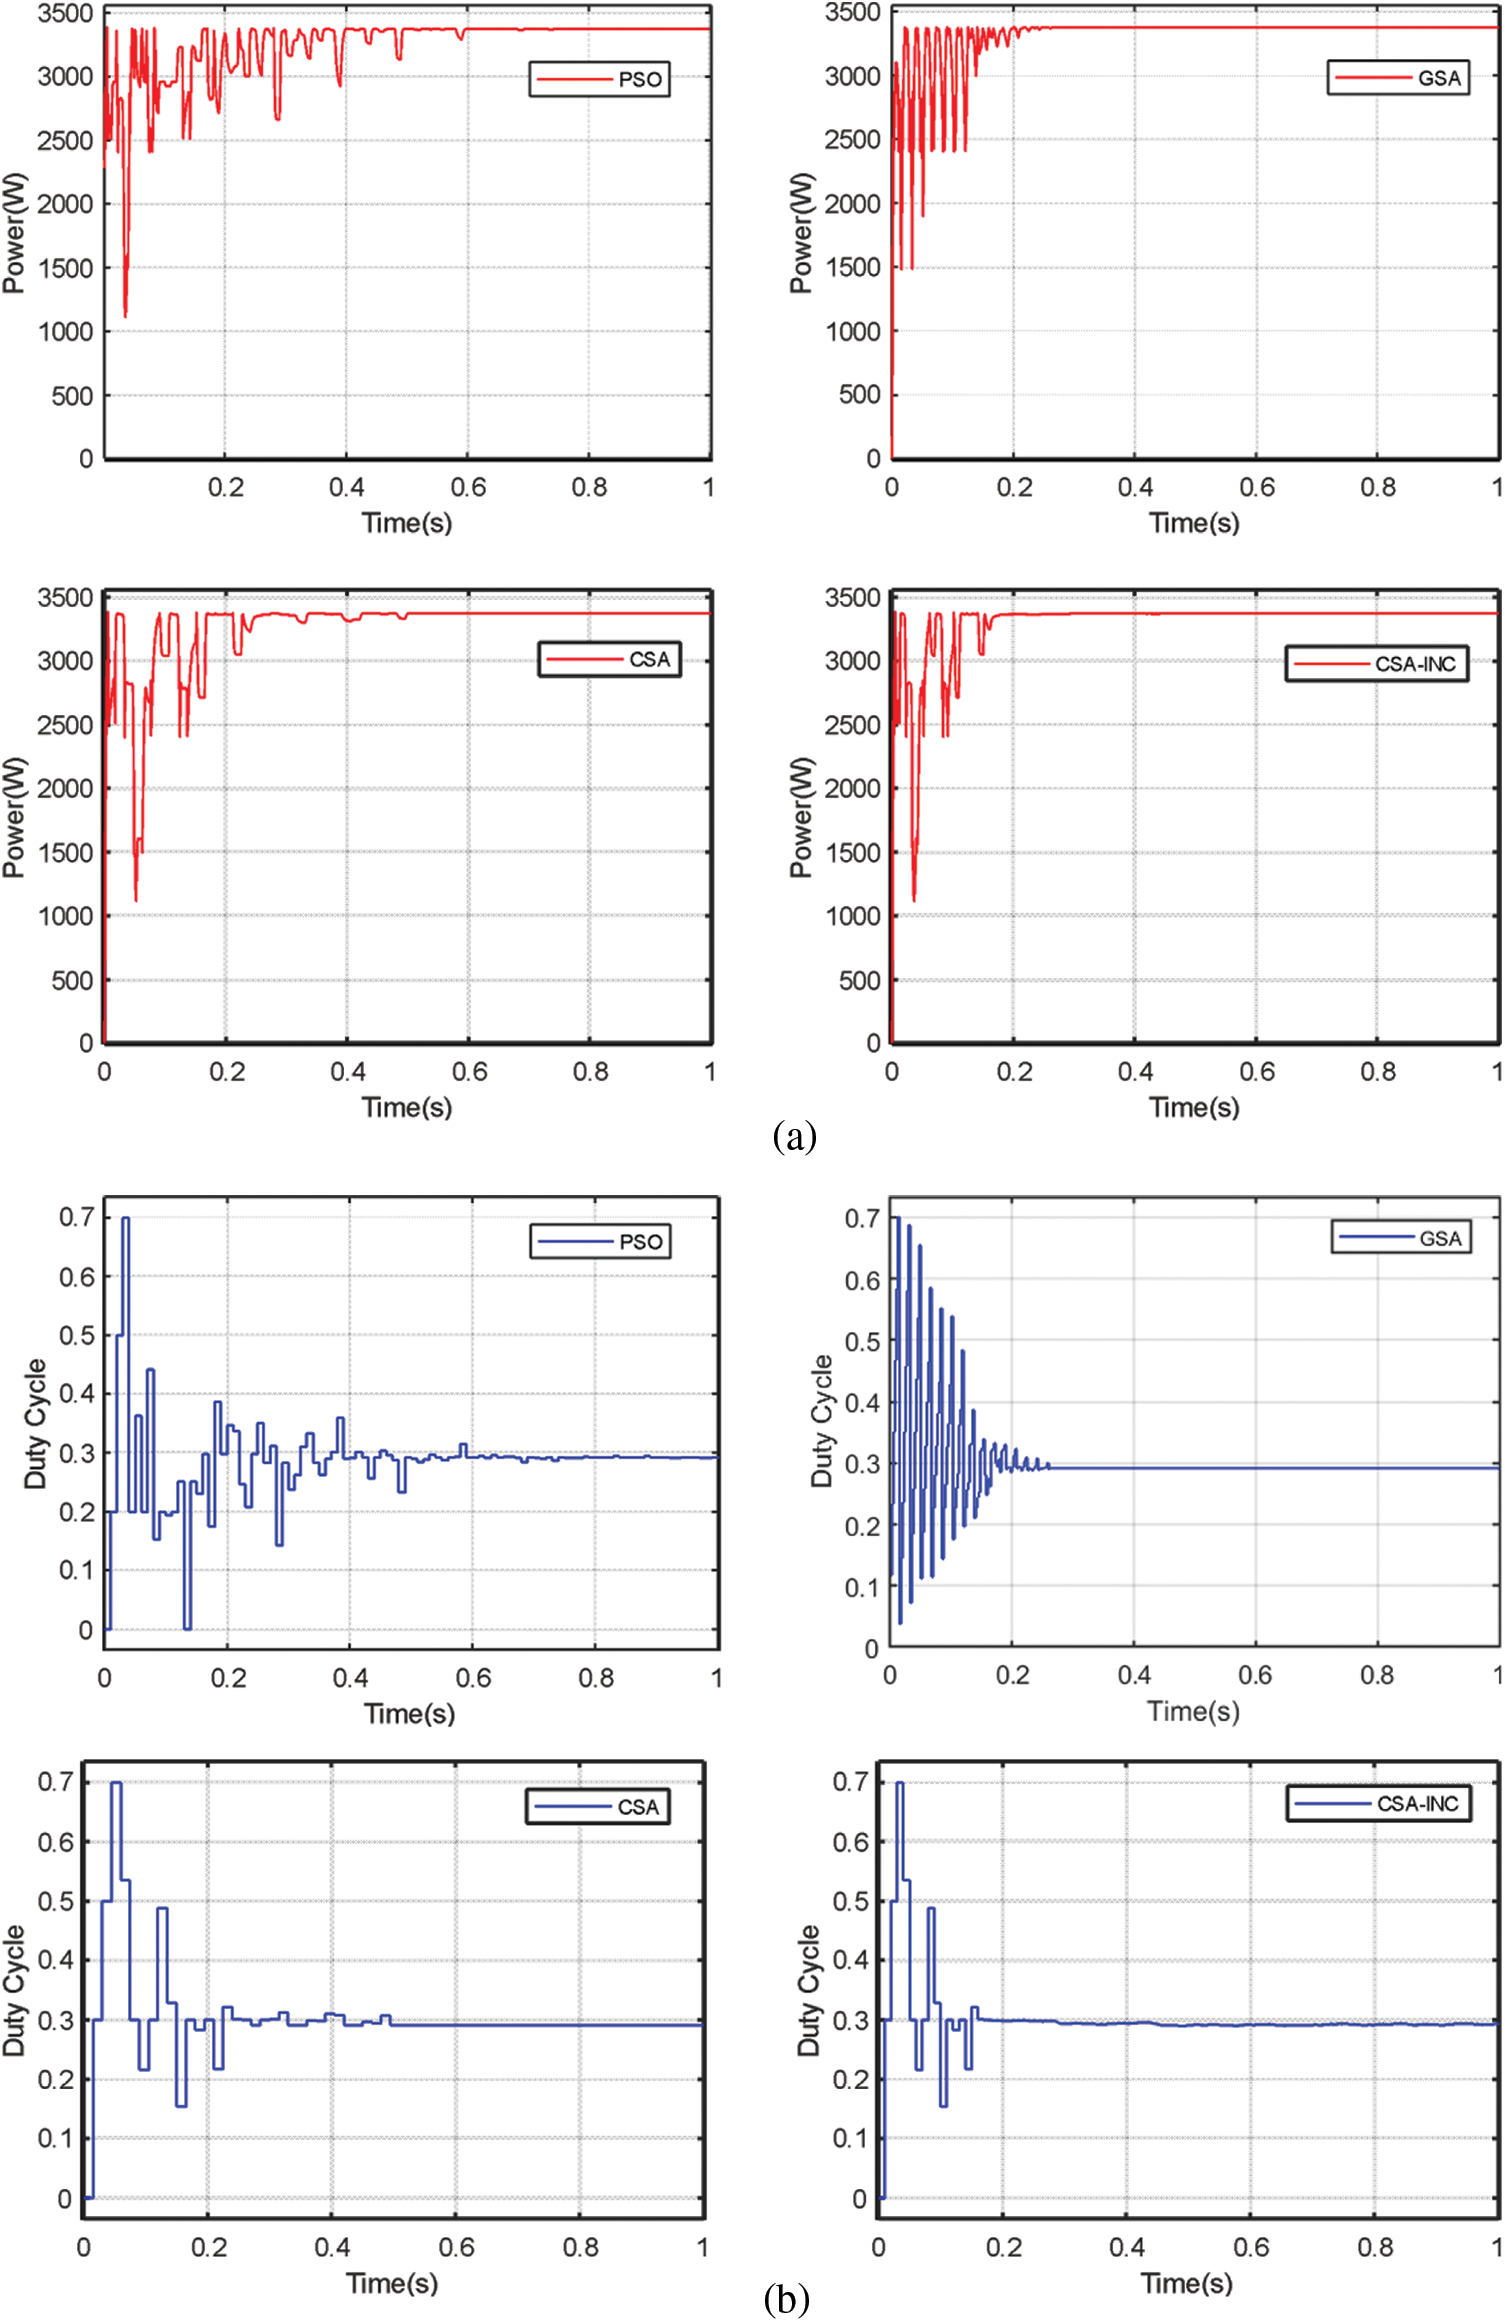
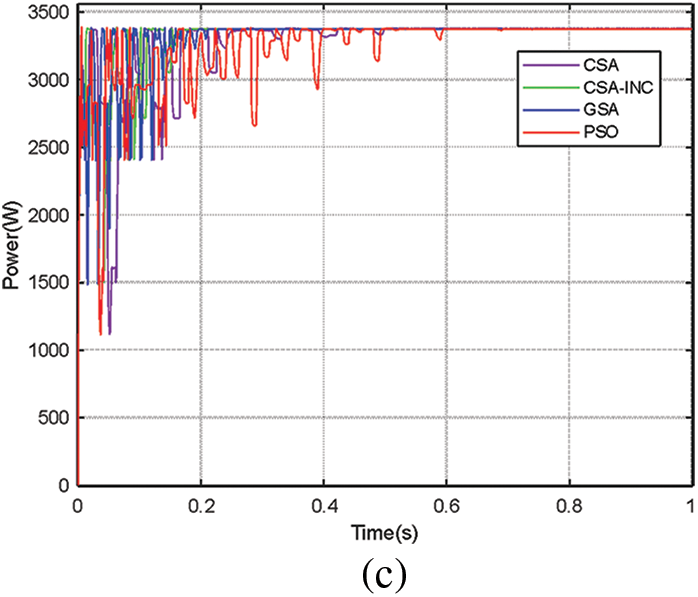
Figure 9: Simulation results for the three partial shading case PSC 3: (a) PV power (b) Duty cycle (c) Four algorithms power comparison
The PSO, GSA, CSA, and CSA-INC simulation results are tabulated in Table 3. For the fourth and fifth cases, a variation of PSC was performed; PSC 1-PSC 2-PSC 3 was chosen to demonstrate the PV P-V curve from one to three peaks and three to five peaks. The light intensity will gradually decrease. In addition, PSC 3-PSC 3-PSC 1 is the case of going from five wave peaks to three wave peaks and then from three wave peaks to one wave peak. The light intensity gradually increases. The solar radiation changes abruptly at 0.7 s and 1.4 s, respectively. The simulation results, PV power, and duty cycle are shown in Figs. 10 and 11.

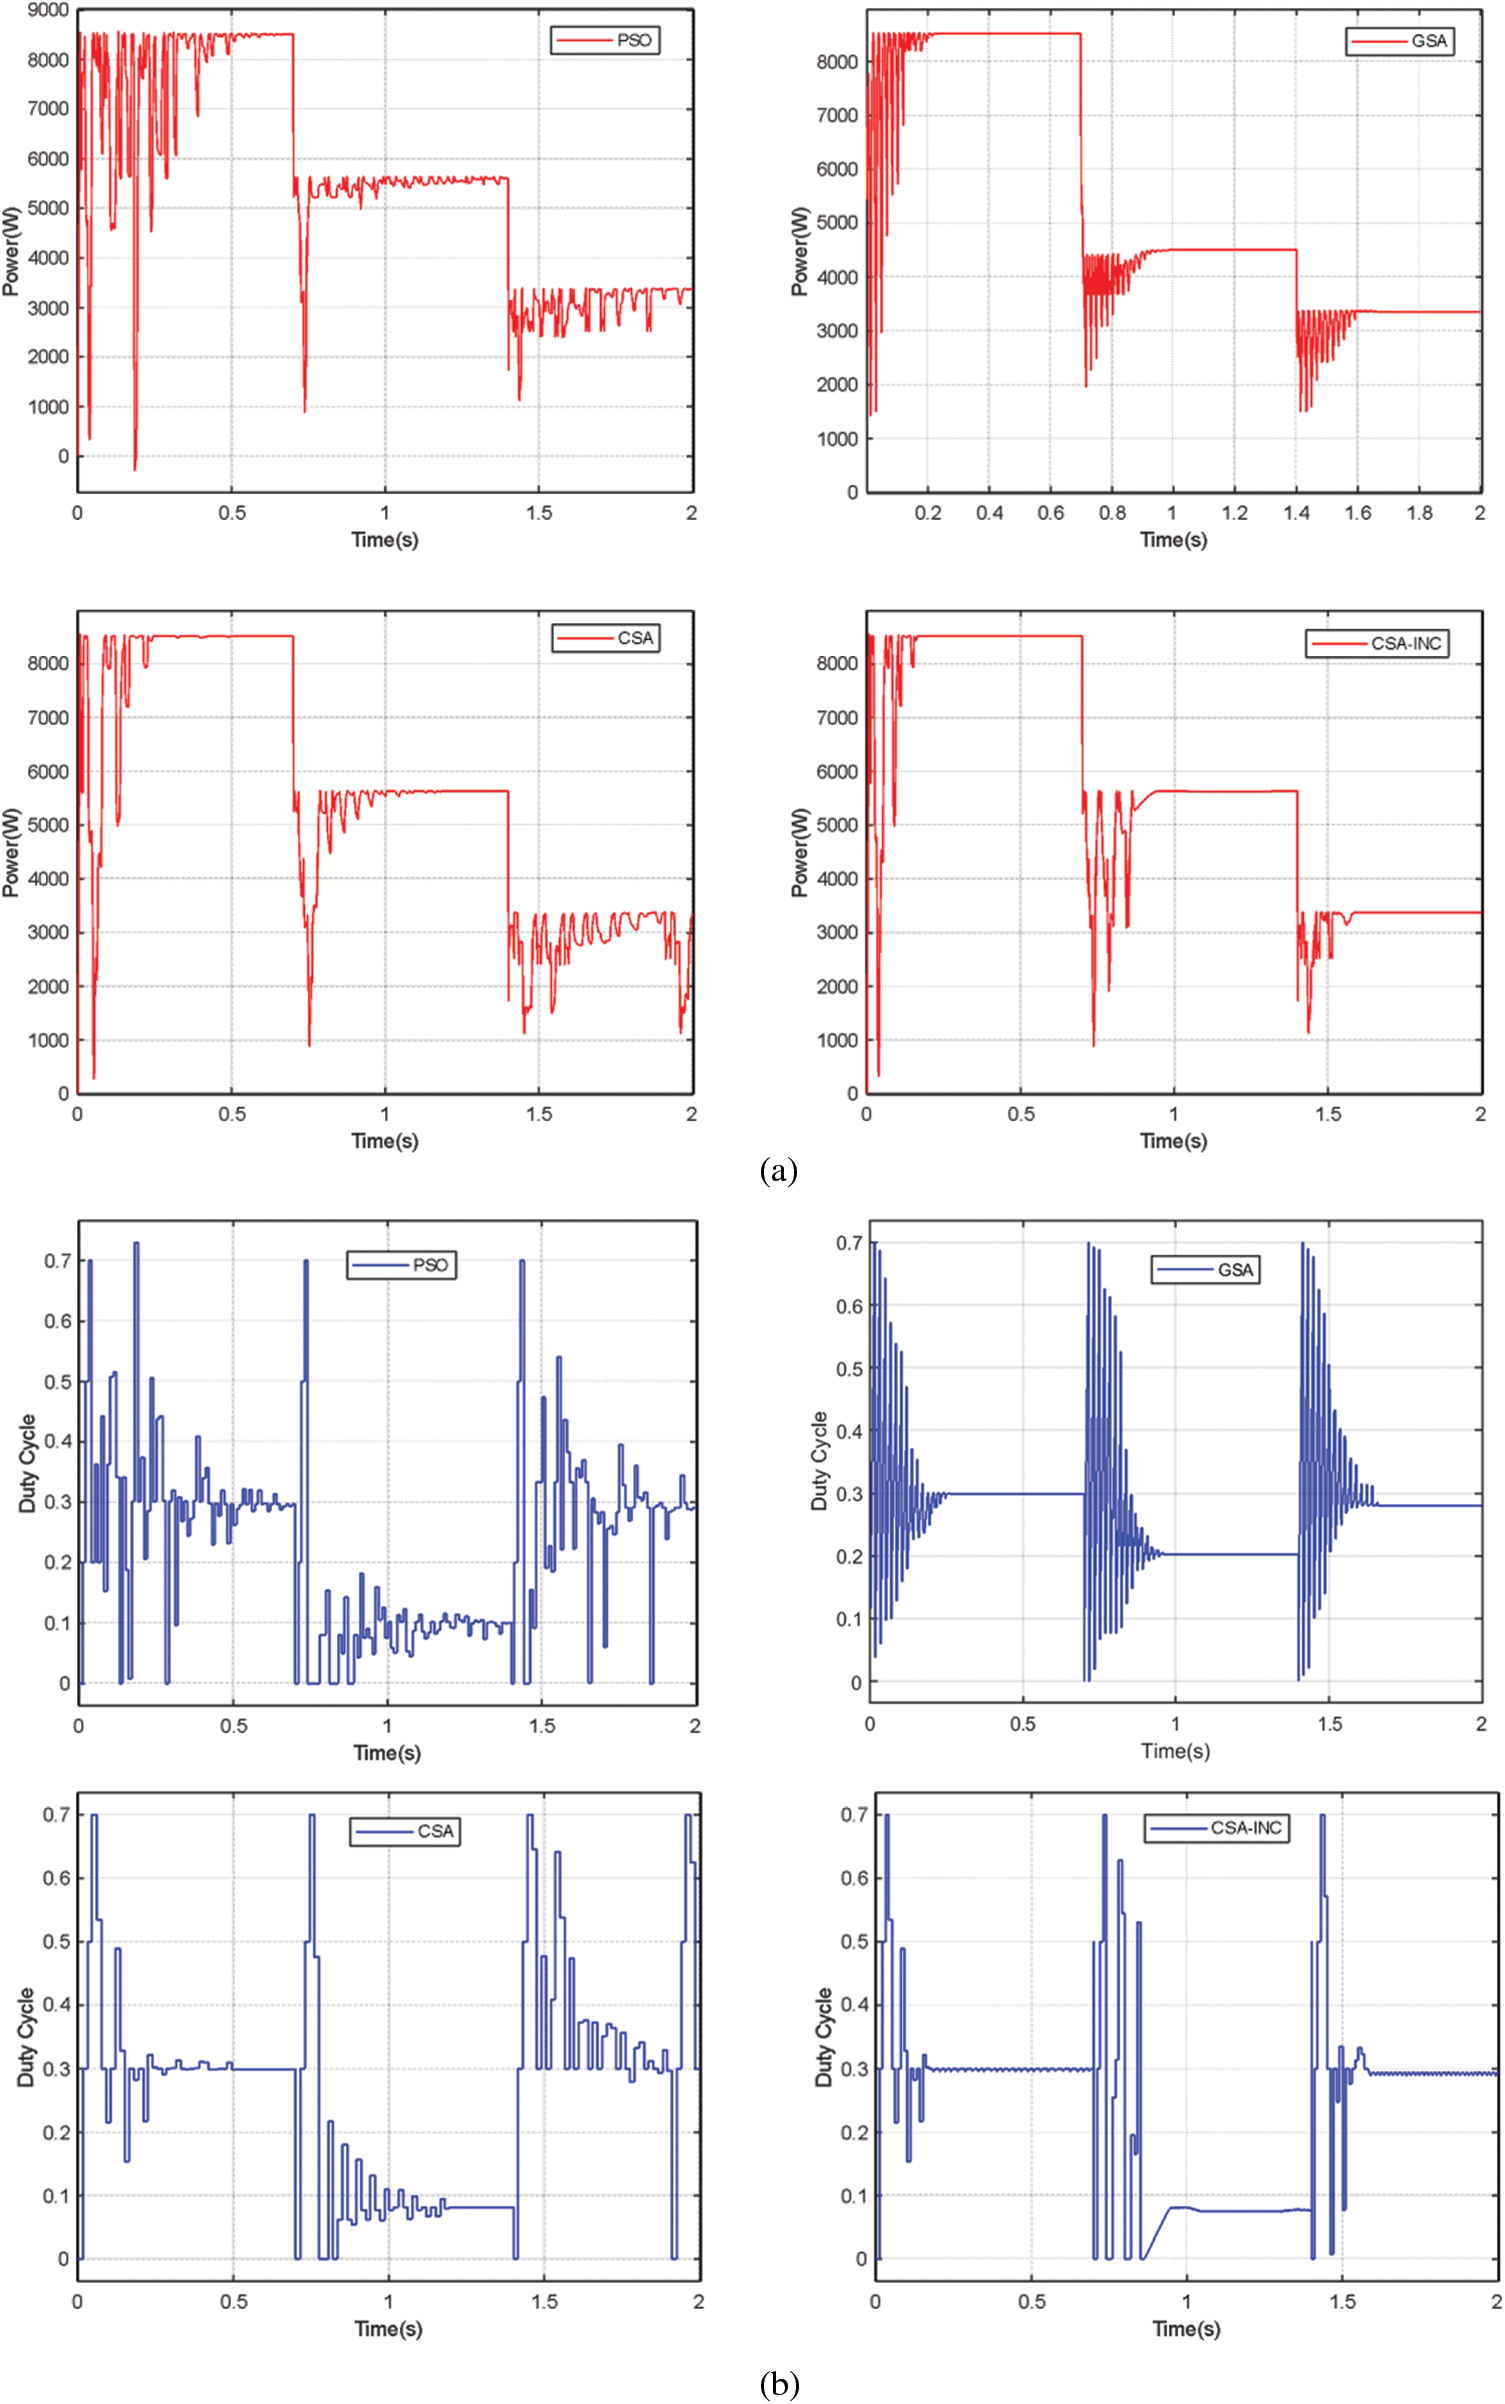
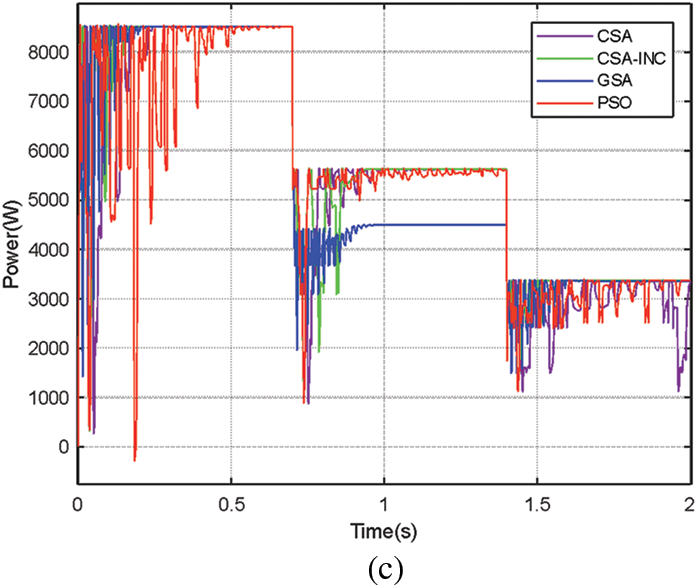
Figure 10: Simulation results for the changing partial shading PSC 3-PSC 2-PSC 1: (a) PV power (b) Duty cycle (c) Four algorithms power comparison
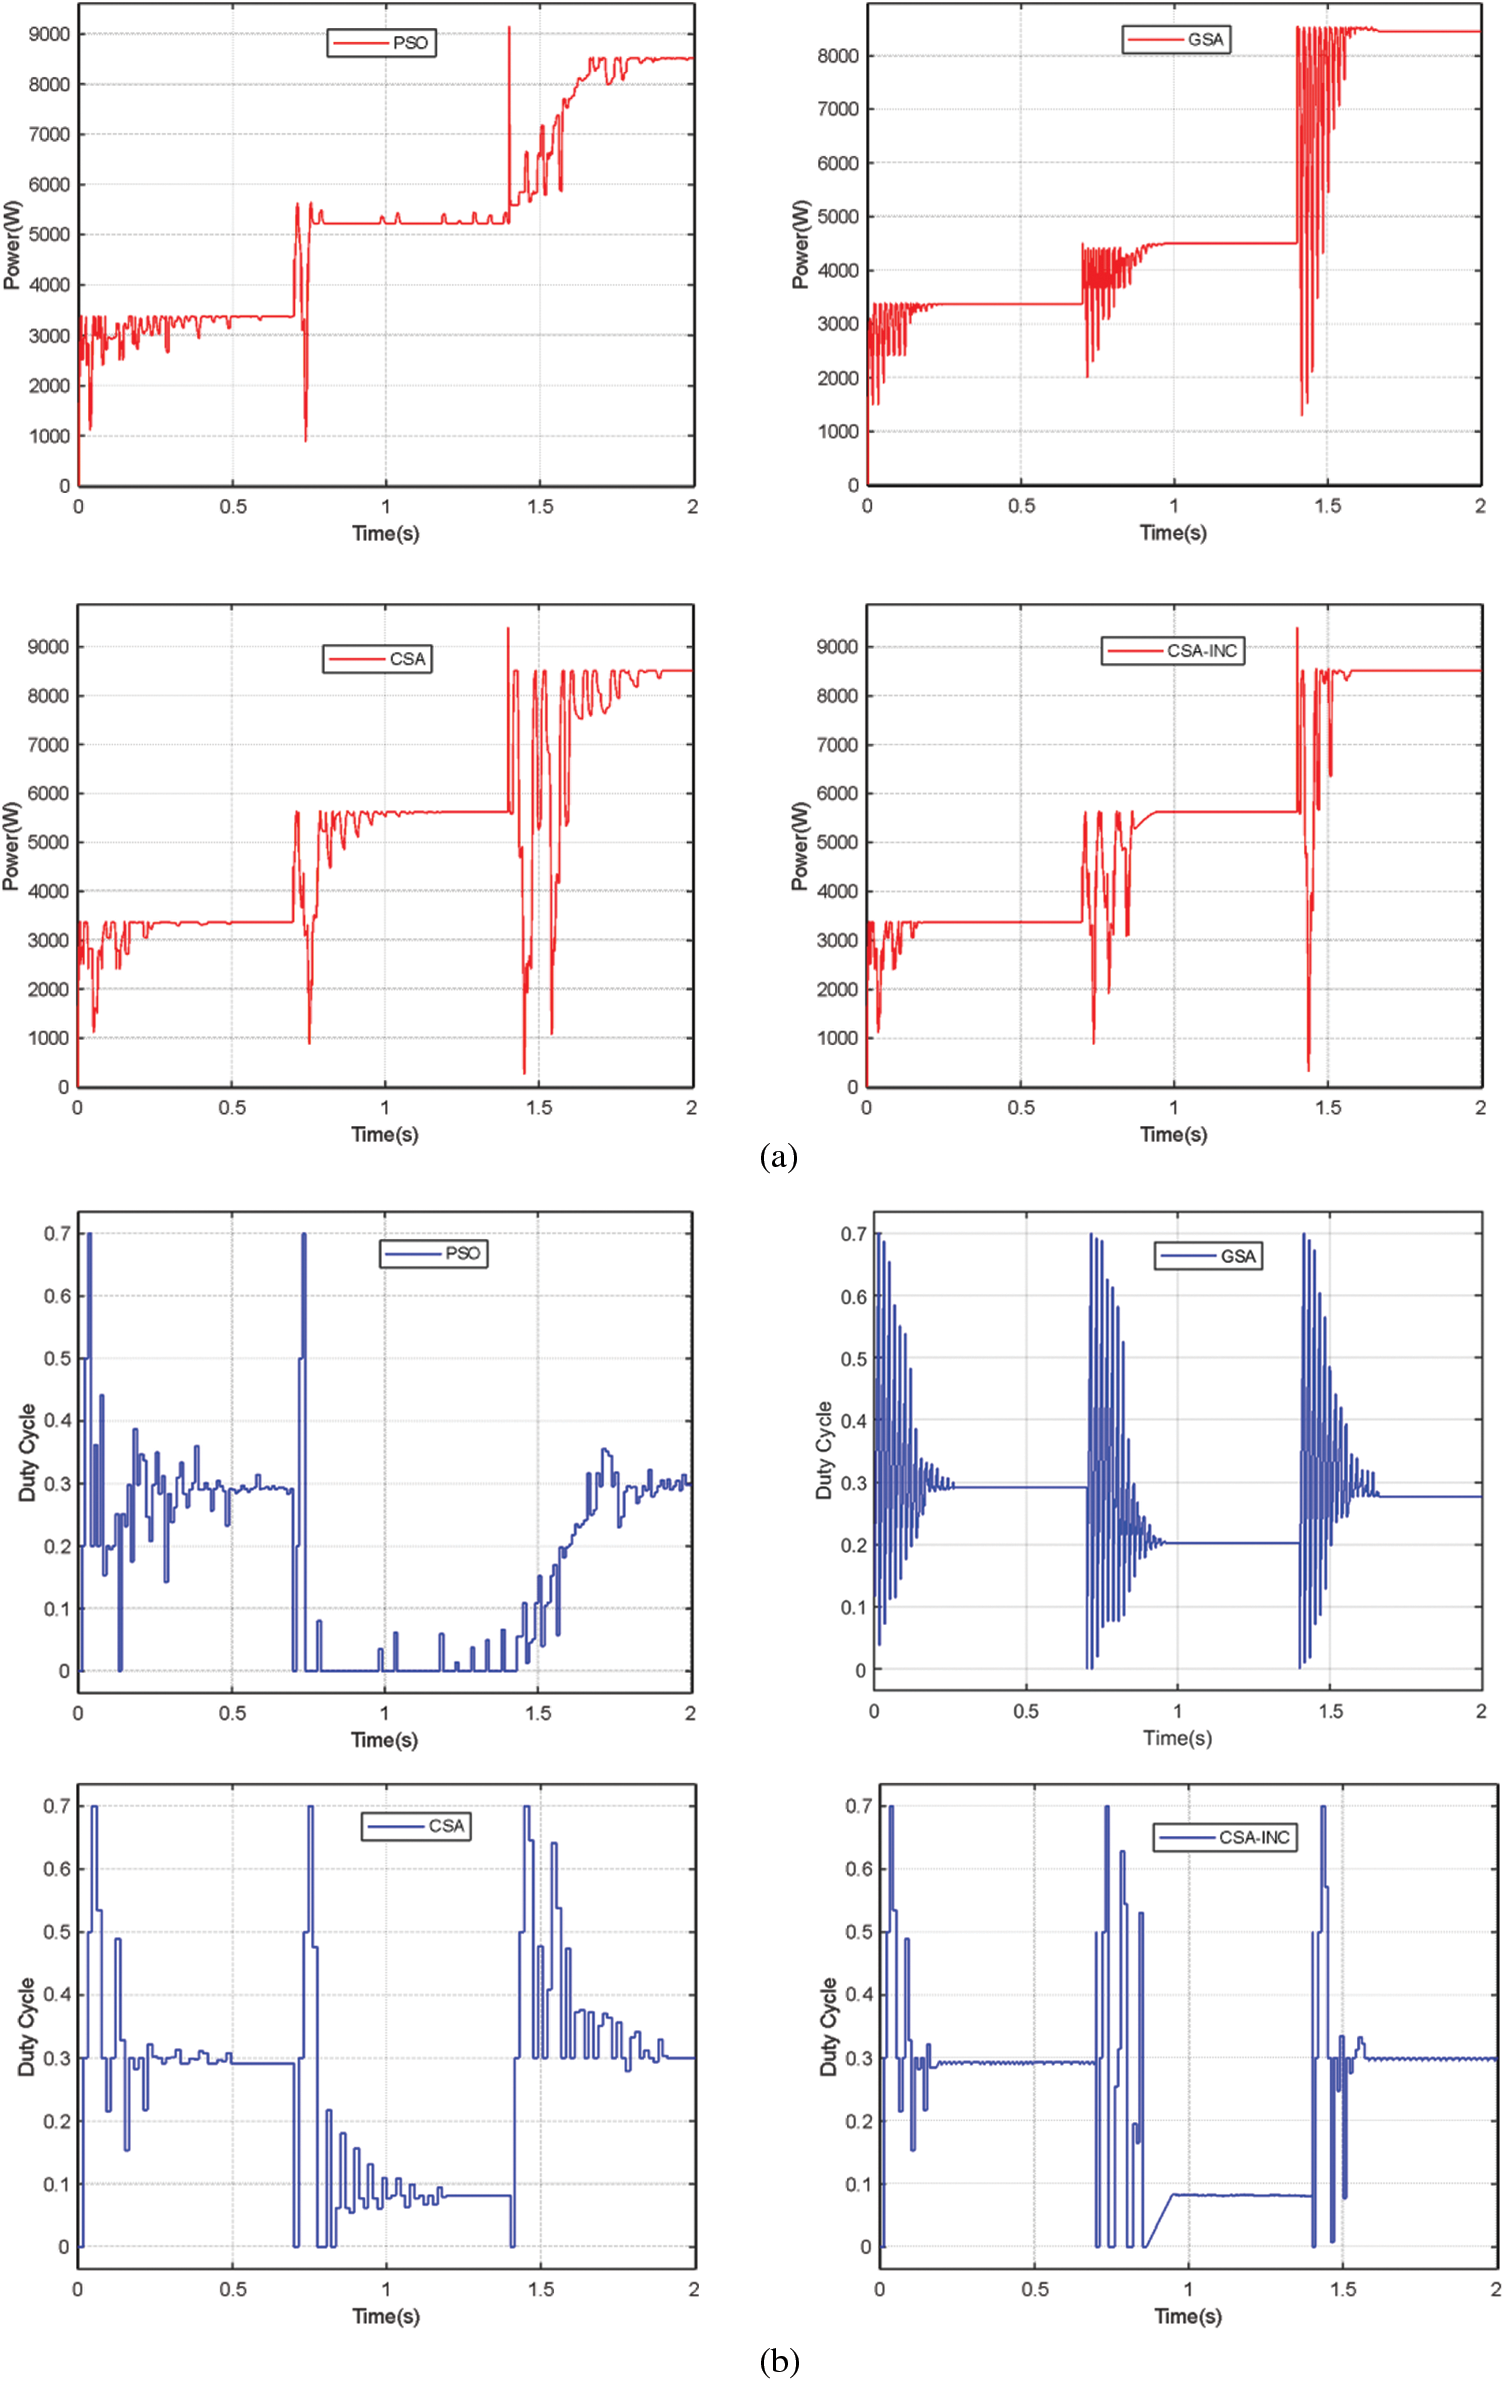
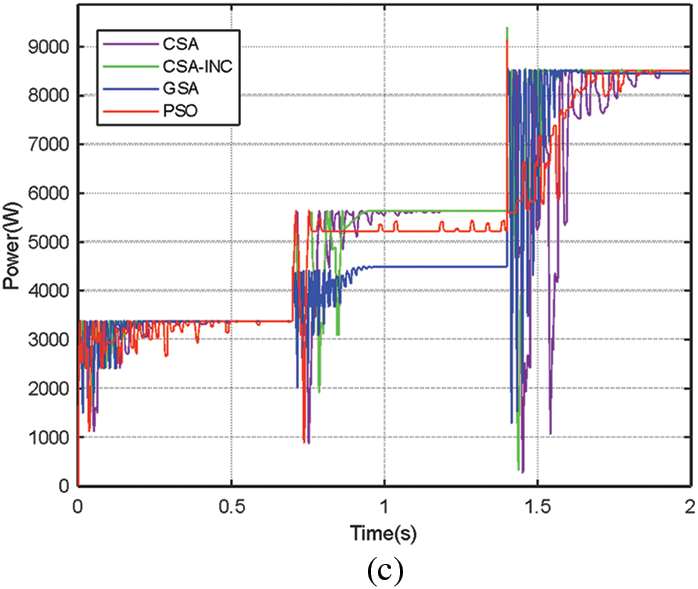
Figure 11: Simulation results for the changing partial shading PSC 3-PSC 2-PSC 1: (a) PV power (b) Duty cycle (c) Four algorithms power comparison
As shown in Fig. 10, it is clear that all four algorithms are reinitialized when PSC 1 changes to PSC 2 and then to PSC 3. In the two phases, PSC 1-PSC 2-PSC 3, the PSO has a long convergence time with large power fluctuations during the tracking process. In the PSC 2 stage, GSA fails to track the GMPP, and the tracking efficiency is low, although it converges quickly. CSA has a long convergence time and more significant power fluctuations during tracking. In the PSC 3 stage, all four algorithms tracked the MPP. from this. We can conclude that CSA-INC shows higher tracking efficiency, convergence speed, and power fluctuation performance than the other three algorithms.
As shown in Fig. 11, all four algorithms are reinitialized when PSC 3 changes to PSC 2 and then to PSC 1. PSO can track the MPP in all three phases but converges slowly and has high power fluctuations during tracking. GSA converges quickly and has low power fluctuations. However, it fails to track the MPP in the PSC 2 stage and has low tracking efficiency. CSA can track the MPP in all stages, but in PSC 3, low light intensity leads to slow tracking time and significant power fluctuation, makings it difficult to track the MPP. Compared with the other three algorithms, CSA-INC shows excellent performance in tracking speed, power fluctuation, and tracking efficiency. MPPT performance.
As can be observed through the simulation results, the performance of the PSO and CSA algorithms is similar. However, in case of sudden changes in light intensity, the PSO saves the best global solution and the best solution reached by each particle before the current iteration, which requires memory when implementing the algorithm. Whereas CSA only needs to save the worst solution. Therefore, the CSA algorithm outperforms the PSO algorithm when there is a sudden change in light intensity. Although the GSA has fast convergence and stable power fluctuations, the tracking efficiency is low. CSA-INC takes advantage of the efficient global search capability of CSA to track to the vicinity of the GMPP quickly and then take advantage of the good local search and fast convergence properties of INC, which has faster tracking speed, less power fluctuation, and higher tracking efficiency than the other three algorithms.
In this paper, we address the problems of existing MPPT methods, such as low tracking efficiency, poor stability, and ease of falling into the local maximum power point under PSC, resulting in the degradation of output power quality and efficiency. We propose a CSA-INC algorithm with excellent MPPT performance, which utilizes the efficient global search capability of CSA to fast track to the GMPP range and then utilizes the good local search and fast convergence properties of INC to fast track to the GMPP. The proposed MPPT algorithm is compared with PSO, GSA, and CSA algorithms in terms of MPPT performance. The MPPT performance of CSA-INC is better than the above methods, and CSA-INC has higher tracking performance in all cases regardless of the light intensity variations. In addition, the average convergence time is reduced by more than 52%, and the power fluctuation is significantly reduced compared to CSA. The convergence speed is within 0.19 s. The results demonstrate the feasibility of the proposed method and its ability to track GMPP with high efficiency of over 99.99% in all test cases.
Funding Statement: This work was supported by the Natural Science Foundation of Gansu Province (Grant No. 21JR7RA321). Hou Tao. http://kjt.gansu.gov.cn/.
Conflicts of Interest: The authors declare that they have no conflicts of interest to report regarding the present study.
References
1. Quereshi, S., Jadhao, P. R., Pandey, A., Ahmad, E., Pant, K. K. (2021). Overview of sustainable fuel and energy technologies. In: Sustainable fuel technologies handbook, pp. 3–25. DOI 10.1016/B978-0-12-822989-7.00001-9. [Google Scholar] [CrossRef]
2. Jaiswal, S. P., Shrivastava, V., Palwalia, D. K. (2021). Opportunities and challenges of PV technology in power system. Materials Today: Proceedings, 34, 593–597. [Google Scholar]
3. Zhang, N., Yang, H. M., Xu, Y., Wang, D. (2020). Charge and discharge control method for solar cell-supercapacitor devices under local shading conditions. Power System Protection and Control, 48(4), 72–79. [Google Scholar]
4. Ately, V., Azzopardi, B., Joshi, J., Sharma, A., Arora, S. (2021). Experimental analysis of hill-climbing MPPT algorithms under low irradiance levels. Renewable and Sustainable Energy Reviews, 150, 111467. DOI 10.1016/j.rser.2021.111467. [Google Scholar] [CrossRef]
5. Zhao, S. Q., Xiao, H., Liu, Z. B., Zhu, Z. J. (2020). Maximum power point tracking of photovoltaics under local shading based on CSA-IP&O. Power System Protection and Control, 48(5), 26–32. DOI 10.19783/j.cnki.pspc.190471. [Google Scholar] [CrossRef]
6. Bhattacharyya, S., Samanta, S., Mishra, S. (2020). Steady output and fast tracking MPPT (SOFT-MPPT) for P&O and INC algorithms. IEEE Transactions on Sustainable Energy, 12(1), 293–302. DOI 10.1109/TSTE.2020.2991768. [Google Scholar] [CrossRef]
7. Celikel, R., Yilmaz, M., Gundogdu, A. (2022). A voltage scanning-based MPPT method for PV power systems under complex partial shading conditions. Renewable Energy, 184(4), 361–373. DOI 10.1016/j.renene.2021.11.098. [Google Scholar] [CrossRef]
8. Jiang, P., Luan, Y. J., Zhang, W., Tian, J., Dai, J. C. (2021). A study of multi-peak MPPT based on improved PSO under partial shading. Journal of Solar Energy, 42(8), 140–145. [Google Scholar]
9. Chao, K. H., Rizal, M. N. (2021). A hybrid MPPT controller based on the genetic algorithm and ant colony optimization for photovoltaic systems under partially shaded conditions. Energies, 14(10), 2902. DOI 10.3390/en14102902. [Google Scholar] [CrossRef]
10. Al-Wesabi, I., Fang, Z., Farh, H. M. H., Al-Shamma’a, A. A., Al-Shaalan, A. M. et al. (2022). Cuckoo search combined with PID controller for maximum power extraction of partially shaded photovoltaic system. Energies, 15(7), 2513. DOI 10.3390/en15072513. [Google Scholar] [CrossRef]
11. Moghassemi, A., Ebrahimi, S., Padmanaban, S., Mitolo, M., Holm-Nielsen, J. B. (2022). Two fast metaheuristic-based MPPT techniques for partially shaded photovoltaic system. International Journal of Electrical Power & Energy Systems, 137(12), 107567. DOI 10.1016/j.ijepes.2021.107567. [Google Scholar] [CrossRef]
12. Jiang, P. C., Tang, Z. J., Liu, P. L. (2020). Research on maximum power point tracking algorithm of photovoltaic system under local shading based on gravitational search algorithm. Chemical Automation and Instrumentation, 47(3), 226–230+283. [Google Scholar]
13. Lou, A., Yao, M. L., Jia, W. M., Yuan, D. (2020). Adaptive gravitational search algorithm for hybrid method optimization. Systems Engineering and Electronics Technology, 42(1), 148–156. [Google Scholar]
14. Yang, X. S., Deb, S. (2010). Engineering optimisation by cuckoo search. International Journal of Mathematical Modelling and Numerical Optimisation, 1(4), 330–343. DOI 10.1504/IJMMNO.2010.035430. [Google Scholar] [CrossRef]
15. Kordestani, J. K., Firouzjaee, H. A., Reza Meybodi, M. (2018). An adaptive bi-flight cuckoo search with variable nests for continuous dynamic optimization problems. Applied Intelligence, 48(1), 97–117. DOI 10.1007/s10489-017-0963-7. [Google Scholar] [CrossRef]
16. Khan, M. J. (2021). A novel hybrid maximum power point tracking controller based on artificial intelligence for solar photovoltaic system under variable environmental conditions. Journal of Electrical Engineering & Technology, 16(4), 1879–1889. DOI 10.1007/s42835-021-00734-4. [Google Scholar] [CrossRef]
17. Jately, V., Bhattacharya, S., Azzopardi, B., Montgareuil, A., Joshi, J. et al. (2021). Voltage and current reference based MPPT under rapidly changing irradiance and load resistance. IEEE Transactions on Energy Conversion, 36(3), 2297–2309. DOI 10.1109/TEC.2021.3058454. [Google Scholar] [CrossRef]
18. Kotla, R. W., Yarlagadda, S. R. (2020). Design and analysis of PSOA and CSA based MPPT algorithms for partial shading conditions. Xi’an Jianzhu Keji Daxue Xuebao/Journal of Xi'an University of Architecture & Technology, 12(7), 817–823. [Google Scholar]
Cite This Article
 Copyright © 2023 The Author(s). Published by Tech Science Press.
This work is licensed under a Creative Commons Attribution 4.0 International License , which permits unrestricted use, distribution, and reproduction in any medium, provided the original work is properly cited.


 Submit a Paper
 Propose a Special lssue
 View Full Text
 Download PDF
 Downloads
 Citation Tools