
 Submit a Paper
 Propose a Special lssue
 Open Access
ARTICLE
The Effects of Turbulence Intensity and Tip Speed Ratio on the Coherent Structure of Horizontal-Axis Wind Turbine Wake: A Wind Tunnel Experiment
1 School of Energy and Power Engineering, Inner Mongolia University of Technology, Hohhot, 010051, China
2 Key Laboratory of Wind Energy and Solar Energy Utilization Technology, Ministry of Education, Inner Mongolia University of Technology, Hohhot, 010051, China
3 Power Research Institute, Inner Mongolia Electric Power Group Co., Ltd., Hohhot, 010020, China
* Corresponding Author: Jianwen Wang. Email:
(This article belongs to the Special Issue: Wind Energy Development and Utilization)
Energy Engineering 2022, 119(6), 2297-2317. https://doi.org/10.32604/ee.2022.020858
Received 16 December 2021; Accepted 08 March 2022; Issue published 14 September 2022
 View Full Text
 Download PDF
Abstract
The evolution laws of the large-eddy coherent structure of the wind turbine wake have been evaluated via wind tunnel experiments under uniform and turbulent inflow conditions. The spatial correlation coefficients, the turbulence integral scales and power spectrum are obtained at different tip speed ratios (TSRs) based on the time-resolved particle image velocity (TR-PIV) technique. The results indicate that the large-eddy coherent structures are more likely to dissipate with an increase in turbulence intensity and TSR. Furthermore, the spatial correlation of the longitudinal pulsation velocity is greater than its axial counterpart, resulting into a wake turbulence dominated by the longitudinal pulsation. With an increase of turbulence intensity, the integral scale of the axial turbulence increases, meanwhile, its longitudinal counterpart decreases. Owing to an increase in TSR, the integral scale of axial turbulence decreases, whereas, that of the longitudinal turbulence increases. By analyzing the wake power spectrum, it is found that the turbulent pulsation kinetic energy of the wake structure is mainly concentrated in the low-frequency vortex region. The dissipation rate of turbulent kinetic energy increases with an increase of turbulence intensity and the turbulence is transported and dissipated on a smaller scale vortex, thus promoting the recovery of wake.Keywords
When air flows through a rotating wind wheel, the momentum tends to decrease thereby forming a local viscous region wherein the wind speed decreases in the downstream of the wind wheel rotor. This region in the wind turbine is known as wake, which is a continuous large-scale turbulent coherent structure that comprises associated vortexes and ordered vortexes components in the space range [1]. The characteristics of fluid diffusion, mixing, and transportation dominate in the wake, thus rendering it the main source of flow noise [2,3]. Therefore, an in-depth study of the characteristics of the coherent structure of the wake can provide significant guidance for the control of energy transport, mixing, and aerodynamic noise.
In recent years, with the application of computational fluid dynamics technology [4–10] and advanced experimental measurement methods, significant advancements have been made in the study of turbulence mechanisms occurring within the coherent structures [11–14], especially in the complex-wall turbulence structures [15–19]. Numerous scholars have also carried out relevant studies on wind turbine wake turbulence. Chamorro et al. [20] used high-frequency particle image velocimetry (PIV) to conduct spectral analysis and correlation analysis of the turbulence characteristics of a wind turbine, particularly, they explored the coherent structure and interactions between a wind turbine's wake model and the mainstream outside. España et al. [21] used a hot-wire anemometer to test the velocity spectrum and the space-time correlation characteristics of the wake of a wind turbine model and the actuator disk in a wind tunnel, respectively. Toloui et al. [22] used spectral analysis to find the peak flow frequency near the tip, and inferred that it was caused by tip vortex shedding. Based on PIV experiments performed via autocorrelation and scale-independent analysis, Howard et al. [23] found that large-scale wake meander due to the small-scale vortex motions of the hub vortex and wake shear layers. Jin et al. [24] analyzed the wake structure of a wind turbine using two models (free flow and grid flow), thereby focusing on the evolution laws of the integral scale and the contribution of background turbulence to the large-scale vortex motion, results indicated that background turbulence plays a central role in the flow recovery in the turbine wake. Liu et al. [25] used a hot-wire anemometer in a wind tunnel to test the wake of two wind farm models with different layouts, while studying the spatial distribution laws of the integral time scale of turbulence in a wind farm. As a result, they found that the arrangement spacing of units can affect the evolution of the integral time scale of turbulence.
The above mentioned results have contributed to the understanding of the structures of wind turbine wakes, while revealing the flow mechanism of the wind turbine wake to some extent. However, there is a need to visualize the influence of turbulence intensity on the motion trajectory of the blade tip vortex. Furthermore, the evolution laws for the large-vortex coherent structures still need to be determined [26,27].
The time-resolved PIV (TR-PIV) technology can not only display the physical form of the wake and provide quantitative information of the instantaneous flow field, but it can also break through the shortcomings of the single-point measurement methods, such as the hot-wire anemometer and the laser doppler velocity methods. Moreover, it can obtain the turbulence integral scale directly by the method of spatial correlation of pulsation velocity [28–30], and has a precision capability similar to that of hot-wire anemometers and its qualitative results are similar to those obtained using the flow display technology. Compared with the traditional two-dimensional PIV technique, TR-PIV technology has a high spatial and temporal resolution, which is suitable for measuring the dynamic parameters of an unsteady flow field, such as Reynolds stress, turbulent intensity, and turbulent kinetic energy. Therefore, the TR-PIV technology is applicable to wake turbulence and other complex flow measurements [31,32], moreover, it can effectively reveal the transient characteristics of the blade tip vortex [33,34]. Furthermore, it can determine the spatial correlation of the wake structure.
In the present study, the wake of a horizontal axis wind turbine was studied under uniform and turbulent inflow conditions using TR-PIV in the closed test section of a low-speed wind tunnel. Based on this, we obtained the wake turbulence characteristics, correlation coefficient, and turbulence integral scale of the wind turbine model. This is conducive to further understanding the essence of turbulence, which would reveal the unsteady evolution laws of a large-eddy coherent structure, and provide experimental data for performing numerical calculations of a wind turbine wake.
The wind tunnel is mainly composed of a dynamic section, a rectification section, a contraction section, a closed test section, a diffuser, and an open test section, with a length of 24.59 m. The maximum inflow wind speed can reach 60 m/s. All experiments are conducted in the closed test section that has a 2.5 m length, a half expansion angle of 0.46° and a square cross-sectional area increases from 920 mm × 920 to 1000 mm × 1000 mm.
The NACA4415 horizontal axis wind turbine model is installed at the closed test section of the B1/K2 wind tunnel. Fig. 1 shows the wind turbine model. It is a 100 W miniature two-blade wind turbine with a diameter of D = 300 mm, and the size rate of the model to the wind prototype is 1:4.7. The main shaft of the wind turbine model has a distance of 450 mm from the ground. The nacelle has a length of 54 mm and a diameter of 35 mm, and the tower diameter is 20 mm. The blockage ratio of the wind tunnel is 8.4% < 10% which ratio meets the requirements of the wind tunnel test [35,36].
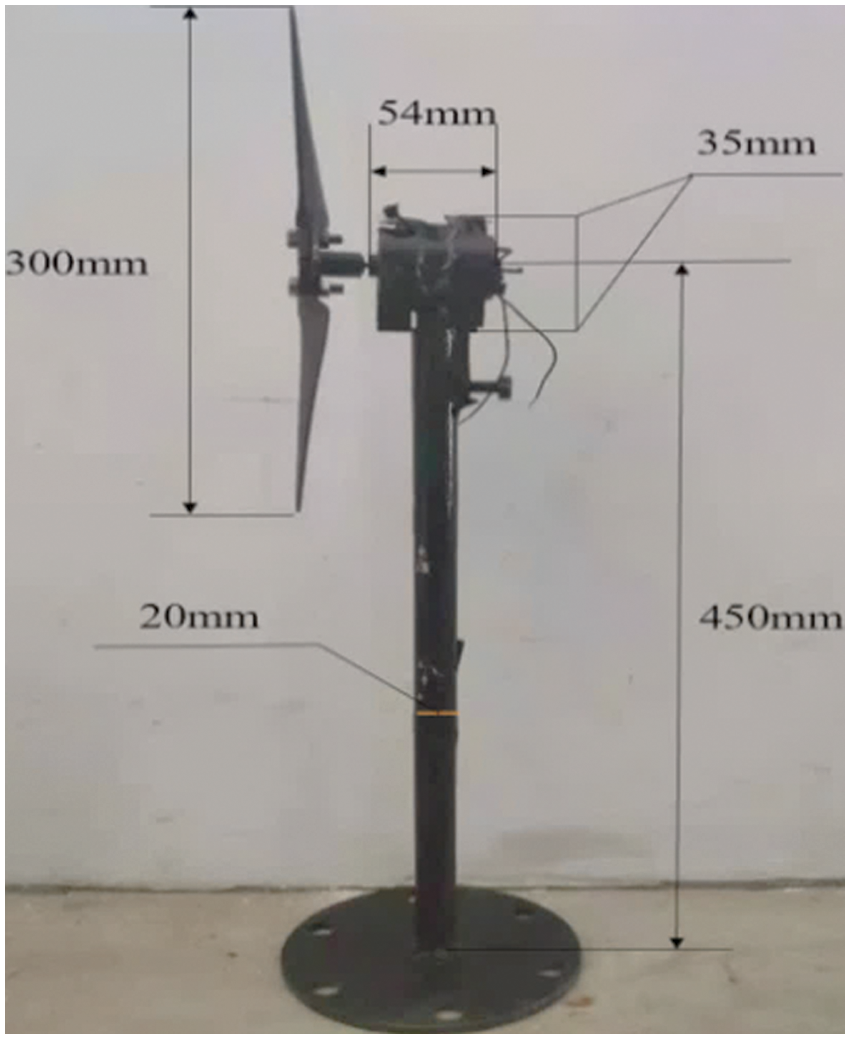
Figure 1: Wind turbine model of NACA airfoil
Turbulence intensity (TI) is one of the important parameters to describe the characteristics of wake flow of wind turbines. The mathematical representation is as follows:
where,
Typically, the turbulence intensity is less than 0.2% when the atmospheric boundary layer of the wind tunnel flows freely. According to the information provided by IEC61400-1 [37], in wind farms, when the annual average wind speed is in the range of 5–20 m/s, the turbulence intensity exists between 10%–20%. Consequently, for this study, two types of square grids with porosity, double-sided wooden structure were designed, manufactured, and used as turbulence generators to form a flow field with turbulence intensity between 10%–20%.
The two types of grids used in the experiment are: grid A, with 67% porosity and 16% turbulence intensity of inflow; and grid B, with 45% porosity and 12% turbulence intensity of inflow. The schematic diagrams of these grids are provided in Fig. 2.
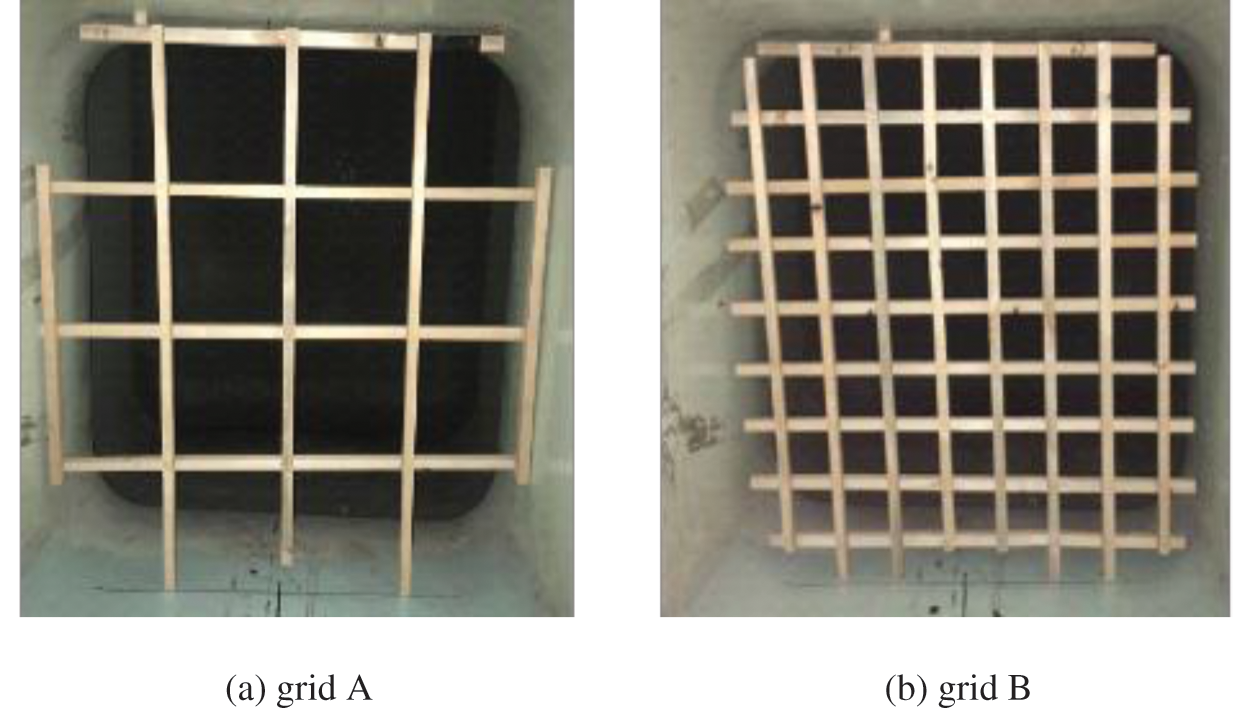
Figure 2: Model of grid A and grid B
In this experiment, the TR-PIV test system uses the Nd:YLF DY300 high repetition rate laser (German LaVision Company, Germany) with the maximum output power of 150 W, pulse width of 100 ns. The maximum frame rate of high-speed 12 bit charge-coupled device (CCD) camera can be up to 5400 fps, and the frame rate in this experiment is set at 1000 fps, while the corresponding resolution is 1024 × 1024 pixels. Tracer particles are using glycol and glycerol, and its average particle diameter is 1–3 μm. Sampling frequency range is 1–10 kHz, that is, 103–104 samples can be collected per second, which is suitable for the study of turbulence characteristics.
By vector calculation, the TR-PIV data and the mode for the correlation can be obtained. The cross correlation algorithm is used to calculate the vector field of two single-exposure images. TR-PIV is evaluated using a multi-channel method with decreasingly smaller window sizes, and the window sizes are between 32 × 32 pixels and 64 × 64 pixels and overlapping rates of 75% and 50%, respectively. Furthermore, the high accuracy mode for the final passes is applied in order to a more sophisticated reconstruction algorithm can be used for the image correction and reconstruction.
The size of the experimental shooting window is 200 mm × 200 mm, as shown in the Fig. 3. The horizontal direction of the downstream development of wake is considered as the positive direction of the X-axis and the upward direction perpendicular to the tip is the positive Y-axis.
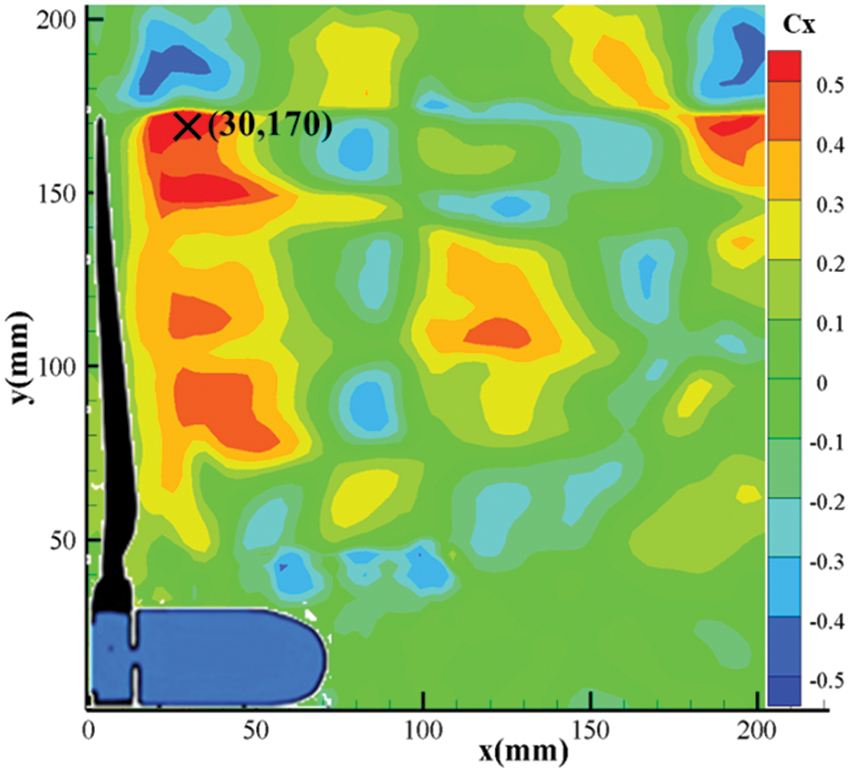
Figure 3: TR-PIV shooting window
During the test, the axial position of the mobile wind turbine model and the grid is adopted to replace the position of the moving CCD camera and the laser light source for shooting. This ensures that the phase position of the shooting surface, laser generator, and high-speed acquisition CCD camera can be fixed, which improves the testing accuracy and shortens the testing time.
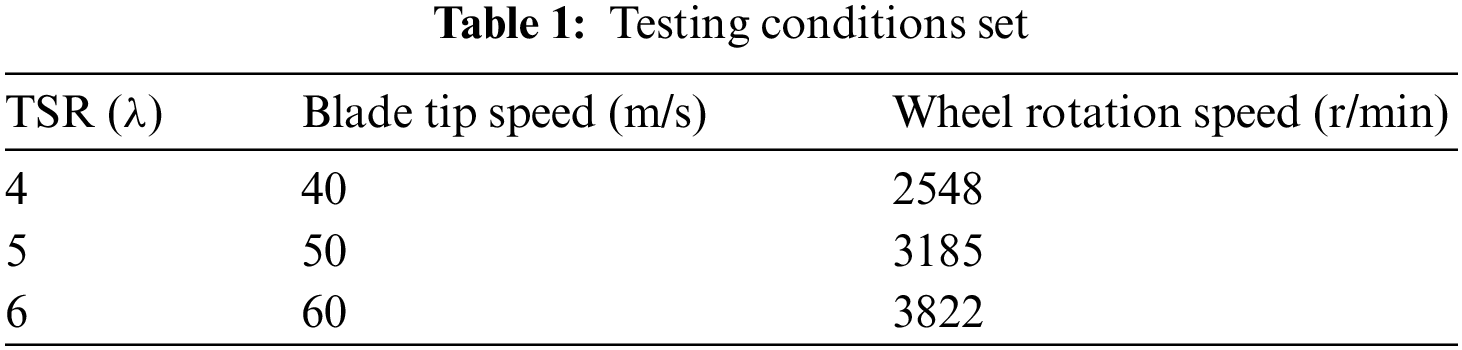
Considering limitations of the experimental conditions in the closed test section, the wind turbine moves an axial position every 300 mm (i.e., 1
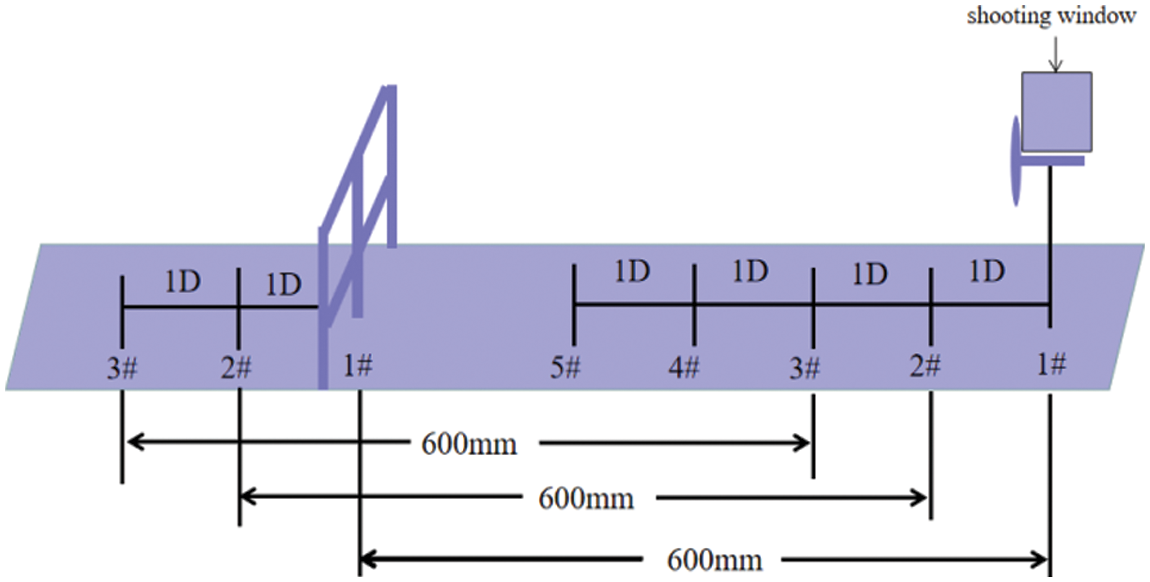
Figure 4: Schematic diagram of measurement method
2.5 Experimental Error Analysis
The turbulence intensity in the closed test section of the wind tunnel is 0.1% by conducting statistical analysis on the sample data of 1000 velocity vector graphs, which can meet the requirements of a stable incoming wind speed for the wind turbine. This ensures that the incoming flow field in the test area is uniform, stable, and horizontal.
3 Experimental Results and Analysis
The spatial correlation coefficient is used to quantitatively describe the spatial dependence of physical quantities. Through the spatial correlation coefficient, the correlation of the pulsation velocity between the study points and the target point in the wake region can be analyzed, and on this basis, the significant coherent structure characteristics in the flow can be obtained. The expression of spatial correlation coefficient is as follows Eq. (2):
The point near the blade tip behind the wind rotor is more suitable for power spectrum analysis of fluctuating wind speed because that the tip vortex area is a typical large-eddy coherent structure. Therefore, the point (30 mm, 170 mm) near the blade tip behind the wind rotor at location 1# is selected as the target point. The symbol of “×” represents its location in Fig. 3. By TR-PIV post-processing system, the cloud diagrams of correlation coefficients of the axial and longitudinal pulsation velocities were obtained under uniform inflow (
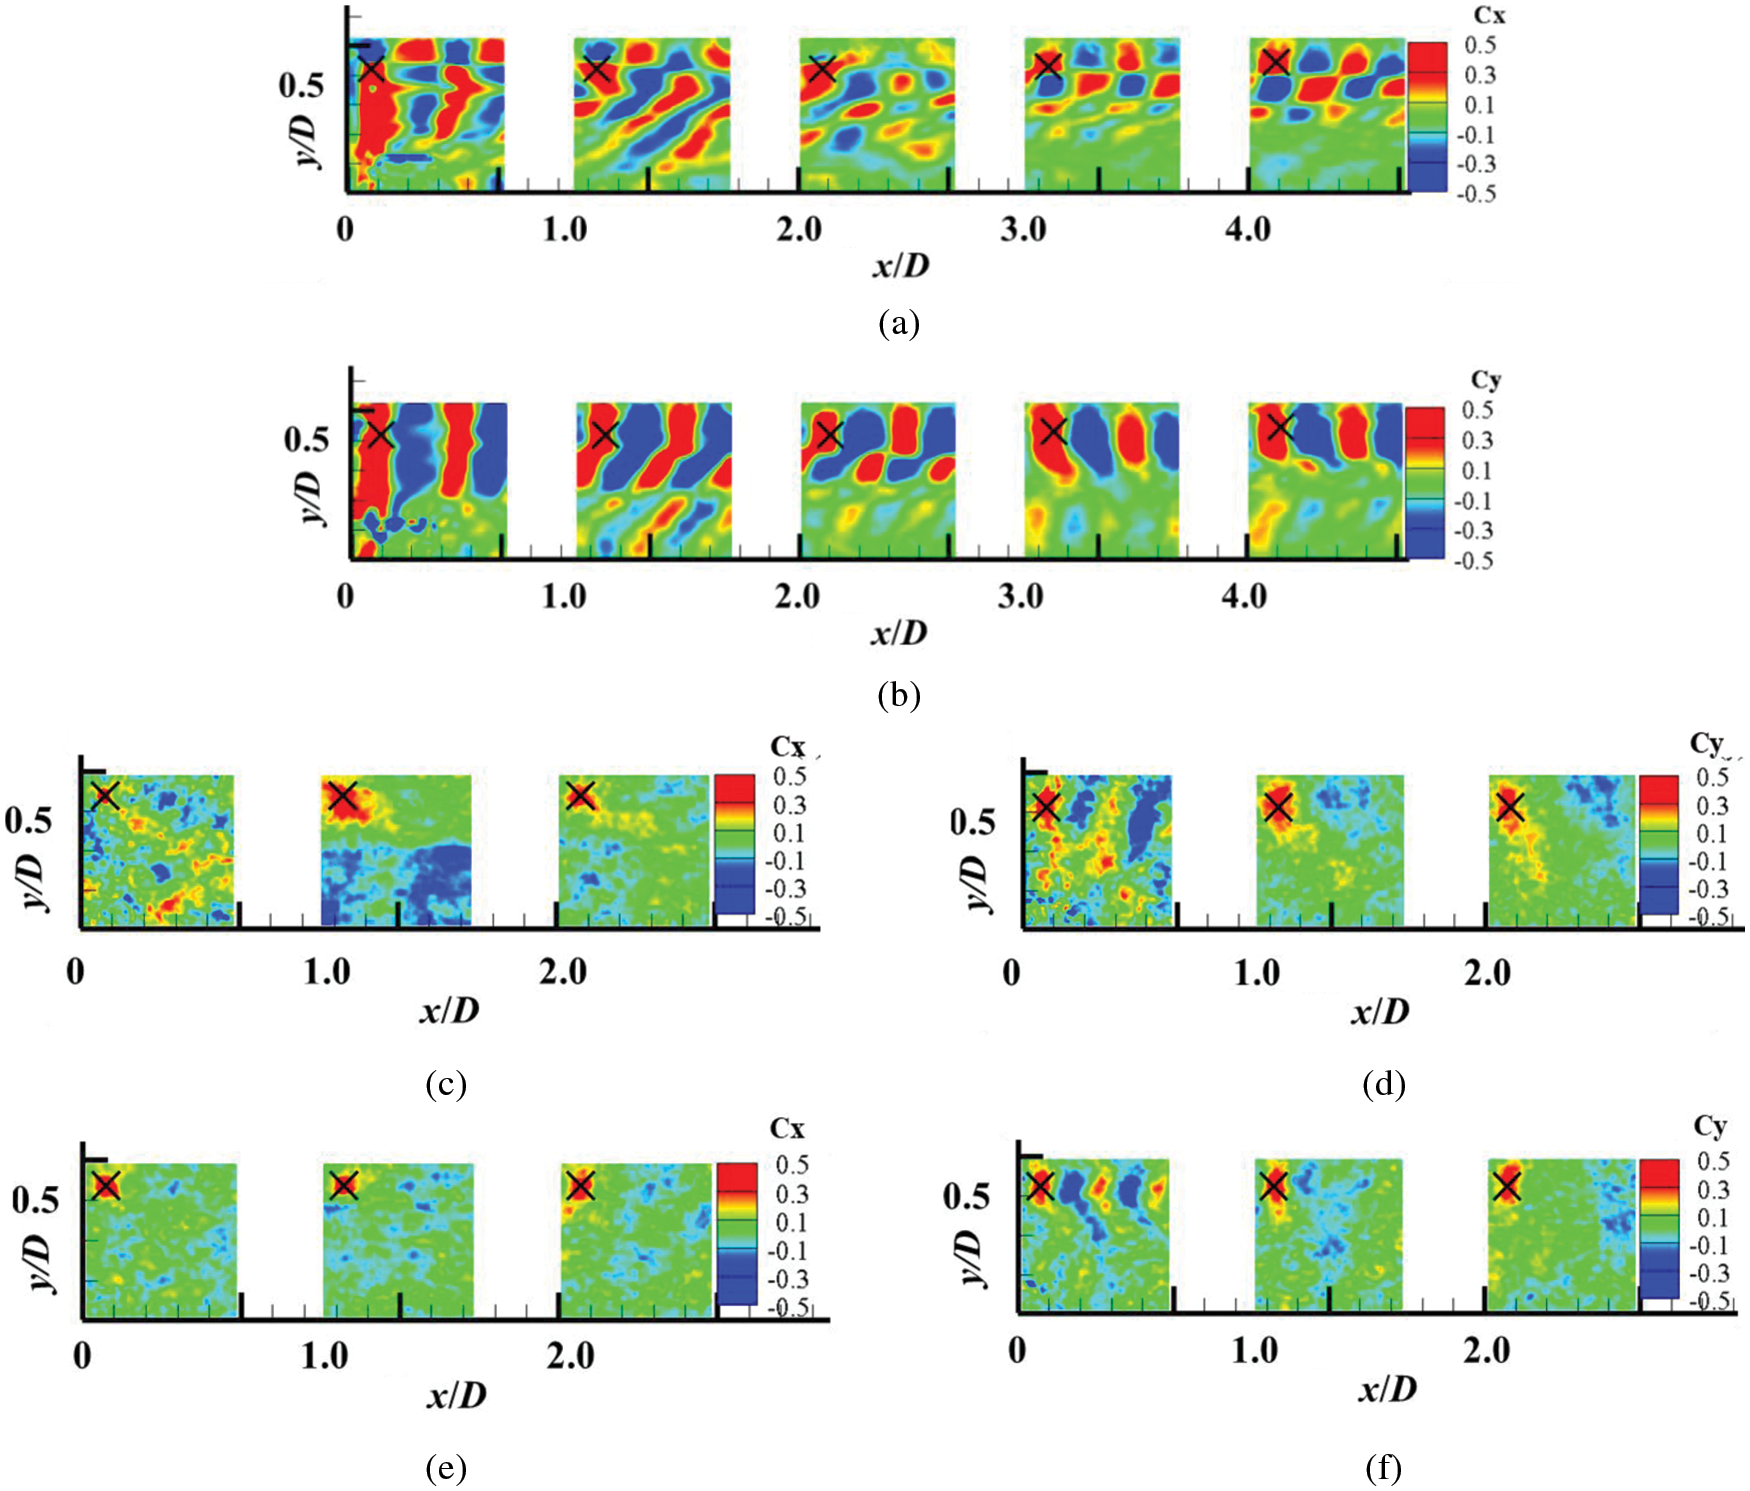
Figure 5: Cloud diagram of axial and longitudinal space correlation coefficients at different inflow conditions by PIV post-processing system (a)
3.1 Coherent Structure Analysis
Based on the instantaneous velocity data measured by TR-PIV, the correlation between the research points at locations 2#–5# and the target point at location 1# were calculated by programming in PYTHON according to Eq. (2). The coherent structure evolution law caused by the wake turbulence was presented, which made up for the shortage of spatial correlation calculation of TR-PIV post-processing system. The correlation coefficients of the axial and longitudinal pulsation velocities were obtained under uniform inflow and turbulent inflow, when
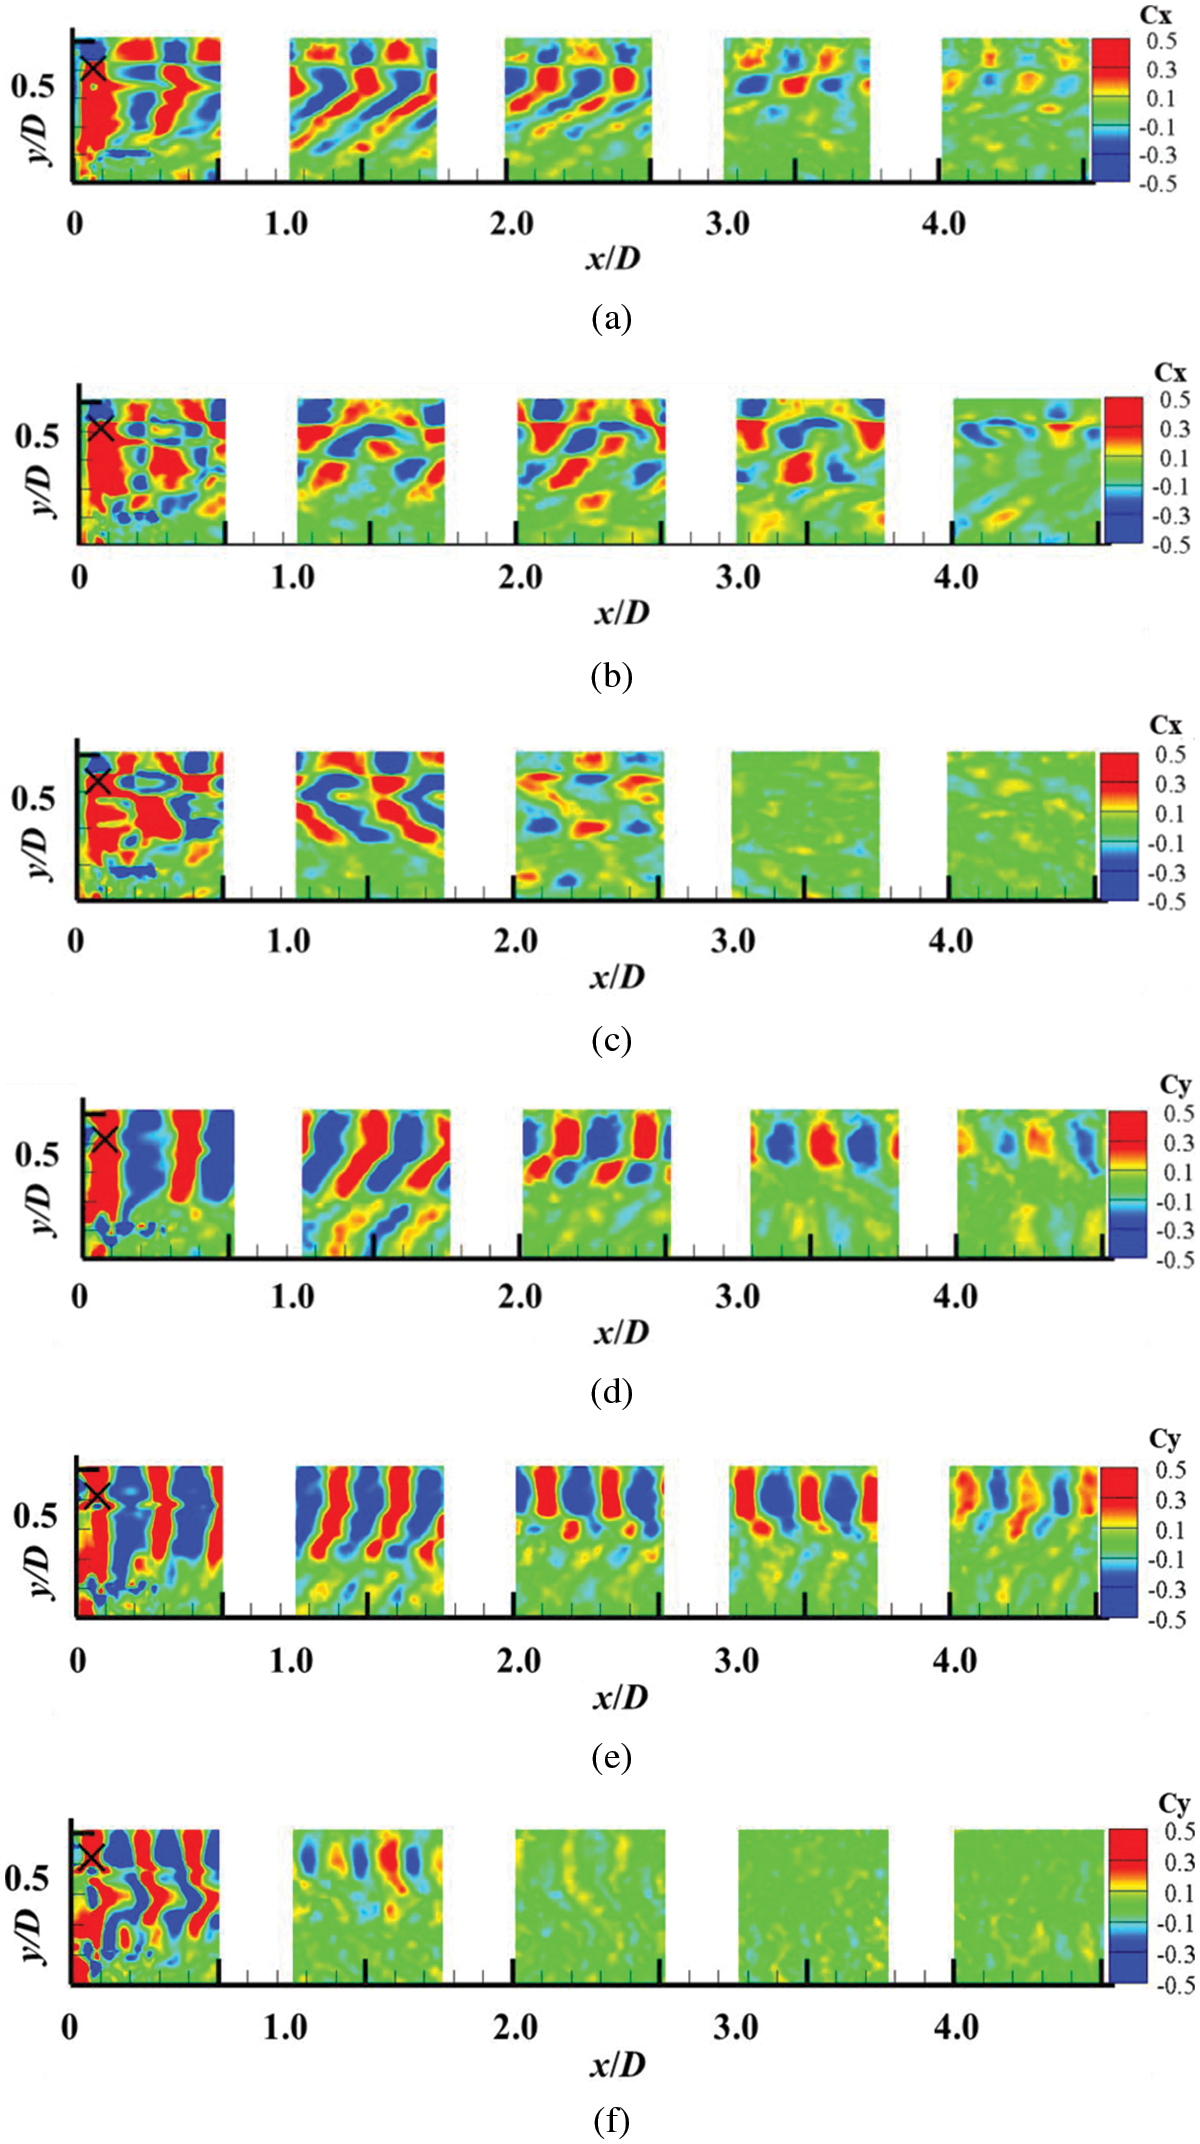
Figure 6: Cloud diagrams of axial and longitudinal space correlation coefficients of uniform inflow
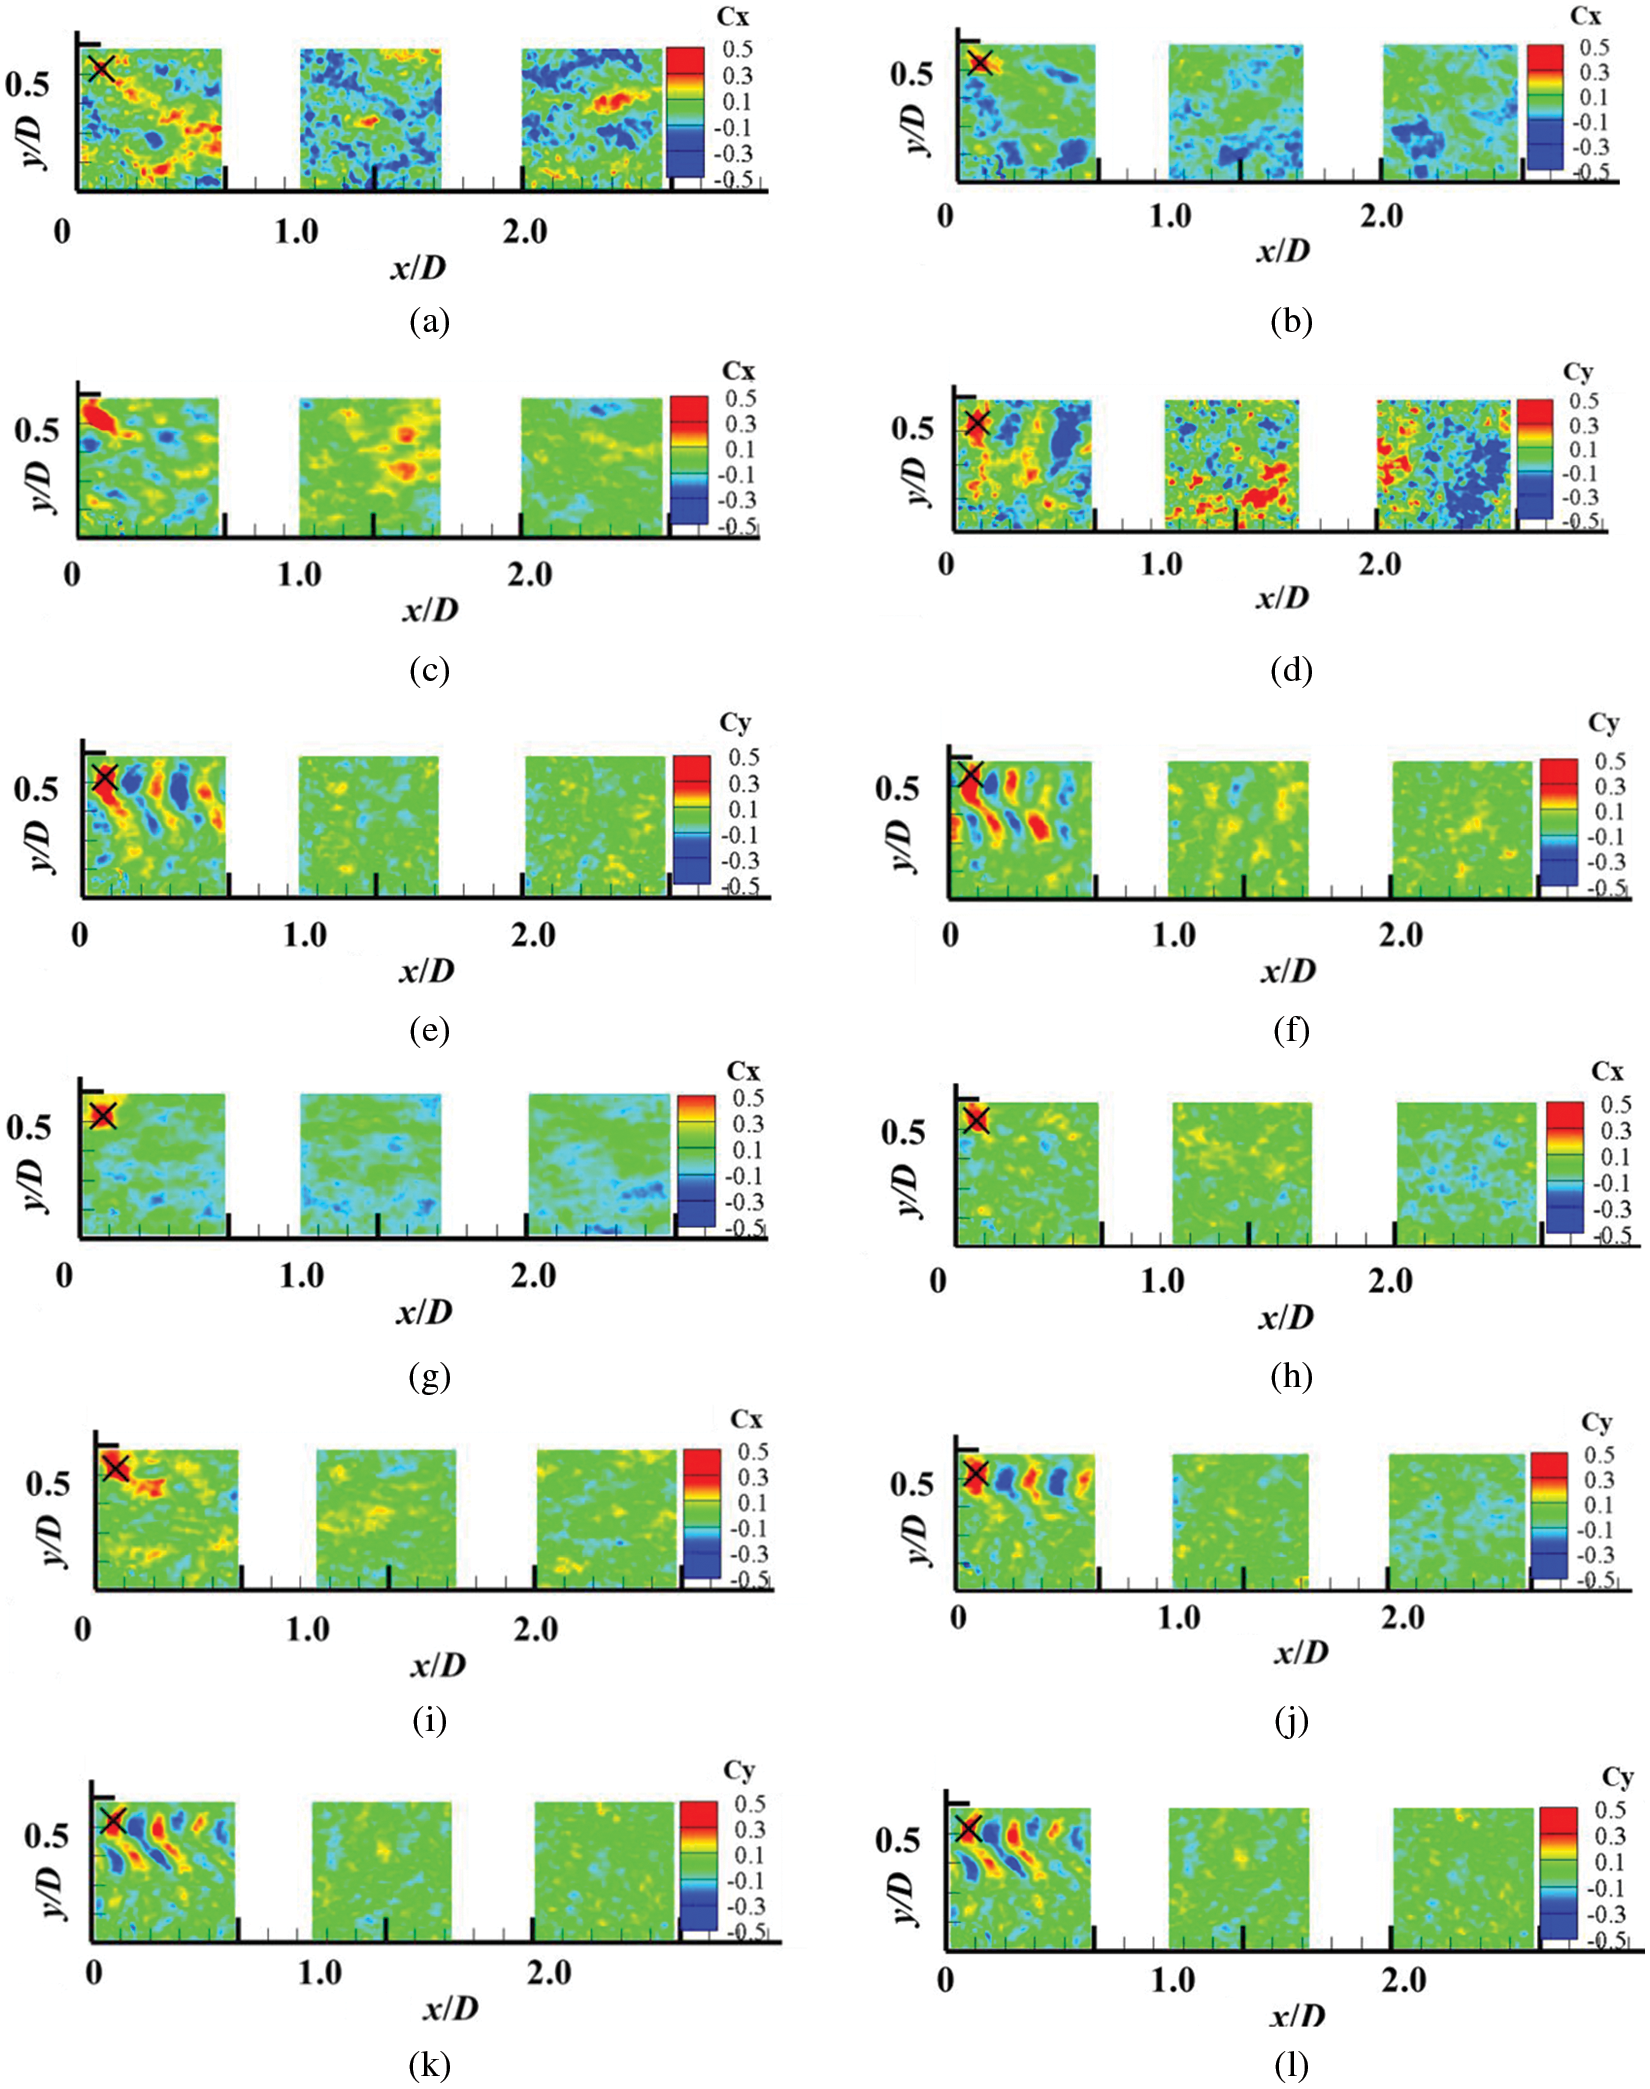
Figure 7: Cloud diagrams of axial and longitudinal space correlation coefficients under turbulent inflow at different λ by PYTHON programming (a)
Figs. 6a–6c depict that there are obvious periodic coherent structures of the axial pulsation velocity under uniform inflow. Each independent correlation area corresponds to a pair of opposite coherent structures in the longitudinal direction, and every two pairs of positive and negative correlation structures represent the axial distribution of a complete tip vortex tube structure. The positive correlation characterizes the axial pulsation velocity of the calculated point in the same direction as the study point and in the same vortex core. The negative correlation indicates that the calculated point's axial pulsation velocity is either opposite to that of the study point, or in different vortex structures. Under test conditions, two and a half of the tip vortex tube structure at the 1# test window whereas only one and a half of the same structure at the test window 5# can be observed. With the migration of trajectory expansion and outward motion, the number of recognizable axial coherent structures decreases. Simultaneously, a dissipation trend of the tip vortex is observed due to the viscous effect in addition to an increase in the vortex core diameter, even when the bigger vortexs merge.
Through the analysis of Figs. 6d–6f, it shows that there are also regular coherent structures of the longitudinal pulsation velocity. Different from Figs. 6a–6c, with the development of wakes, positive and negative coherent structures are alternately generated from left to right to represent the distribution characteristics of the longitudinal pulsation velocity correlation of the wake spiral vortex tube. With the downstream development of the wake, the longitudinal coherent structures gradually become shorter and then dissipate gradually.
By comparing Figs. 6 and 7, it can be seen that, when
Under turbulent inflow, the axial and longitudinal coherent structures in the location 1# can also be identified, however, those in the locations 2# and 3# cannot be identified. By comparison, it is found that the large-eddy coherent structure of the longitudinal pulsation velocity is dominant to that of the axial one. This indicates that the behavior of longitudinal entrainment is stronger than the axial diffusion of coherent structures.
The number of identified coherent structures increases with an increase in tip speed ratio, it also shows that the tip vortex distance decreases, namely, the wake cycle of the coherent structure is reduced, coherent structures become closer, the enhanced interaction between tip vortexes makes the coherent structures more vulnerable to breakage.
3.2 Spatial Correlation Coefficient Analysis
The quantitative analysis of the coherent structures in Figs. 6 and 7 is shown in Figs. 8–10. An analysis of Figs. 8–10 presents that there are several obvious peaks in the axial and longitudinal correlation coefficient within the 4.5 D range, which gradually attenuates as the wake develops downstream under uniform inflow. The external mainstream disturbance is strengthened, and the peak value of spatial correlation coefficient and the number of peaks decrease significantly under turbulent inflow, indicating that the decay of periodic coherent structures is accelerated and the coherent structures finally disappear.
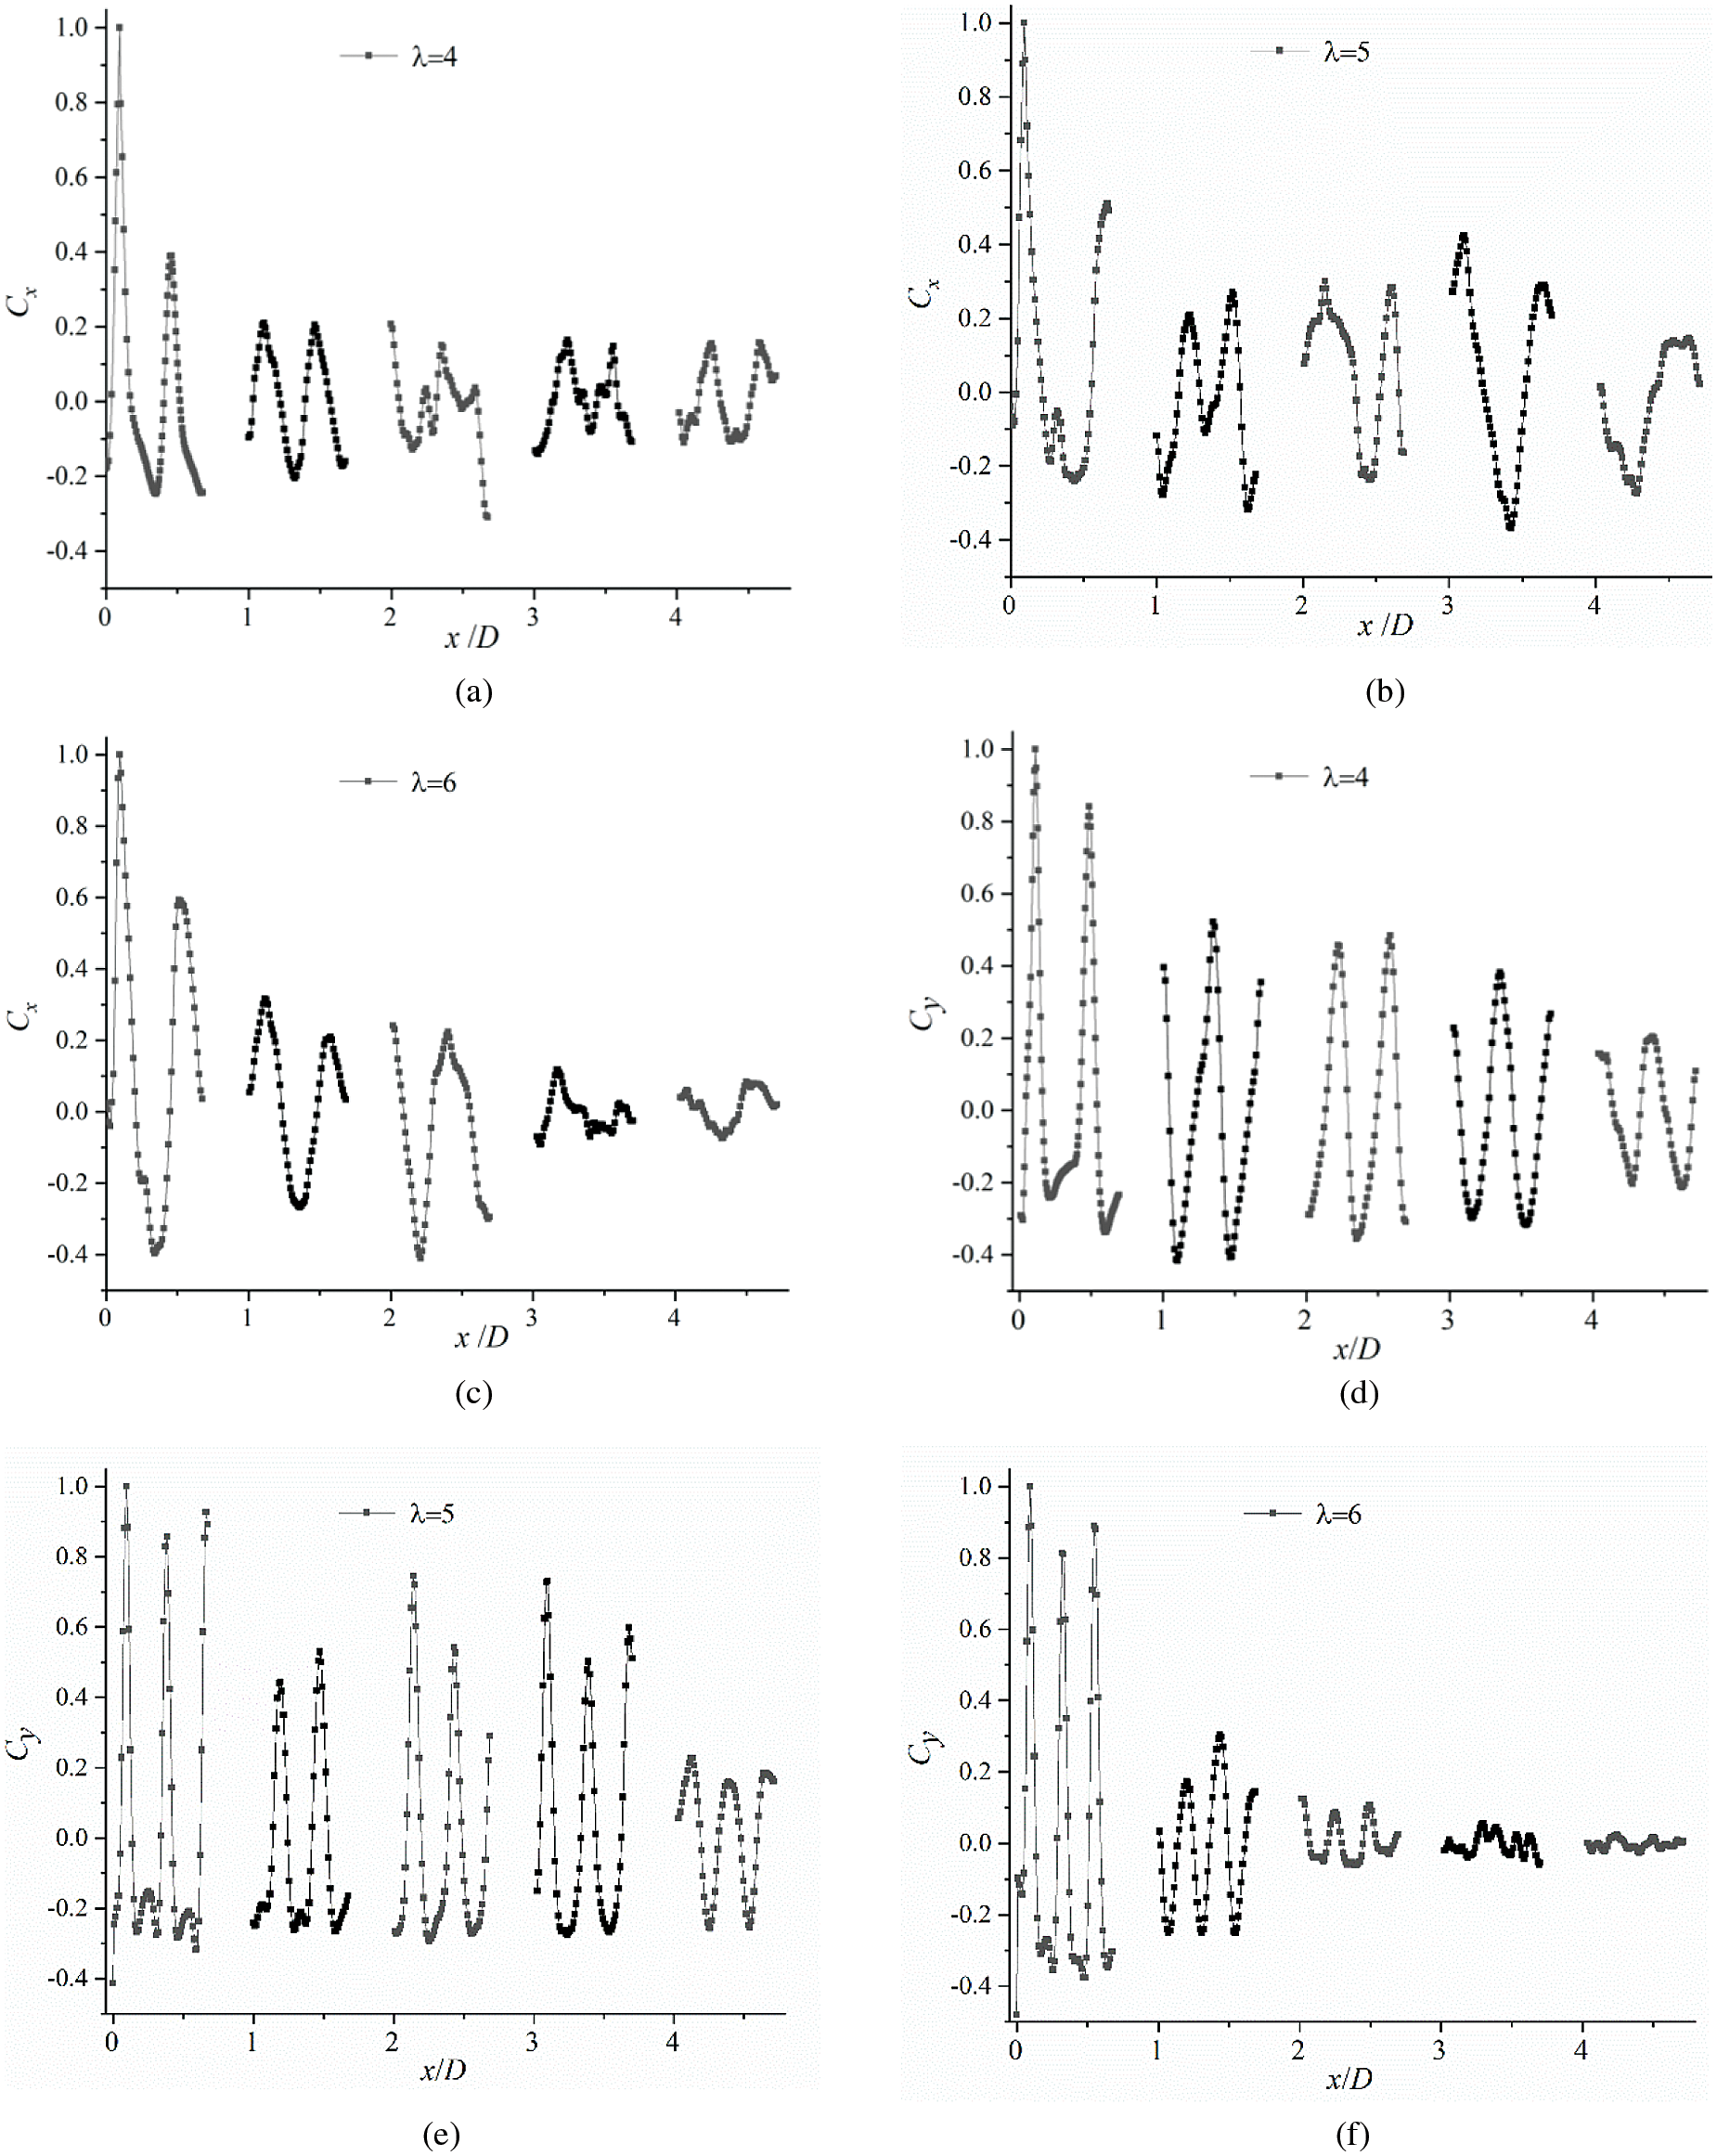
Figure 8: Distribution of axial and longitudinal space correlation coefficients at different
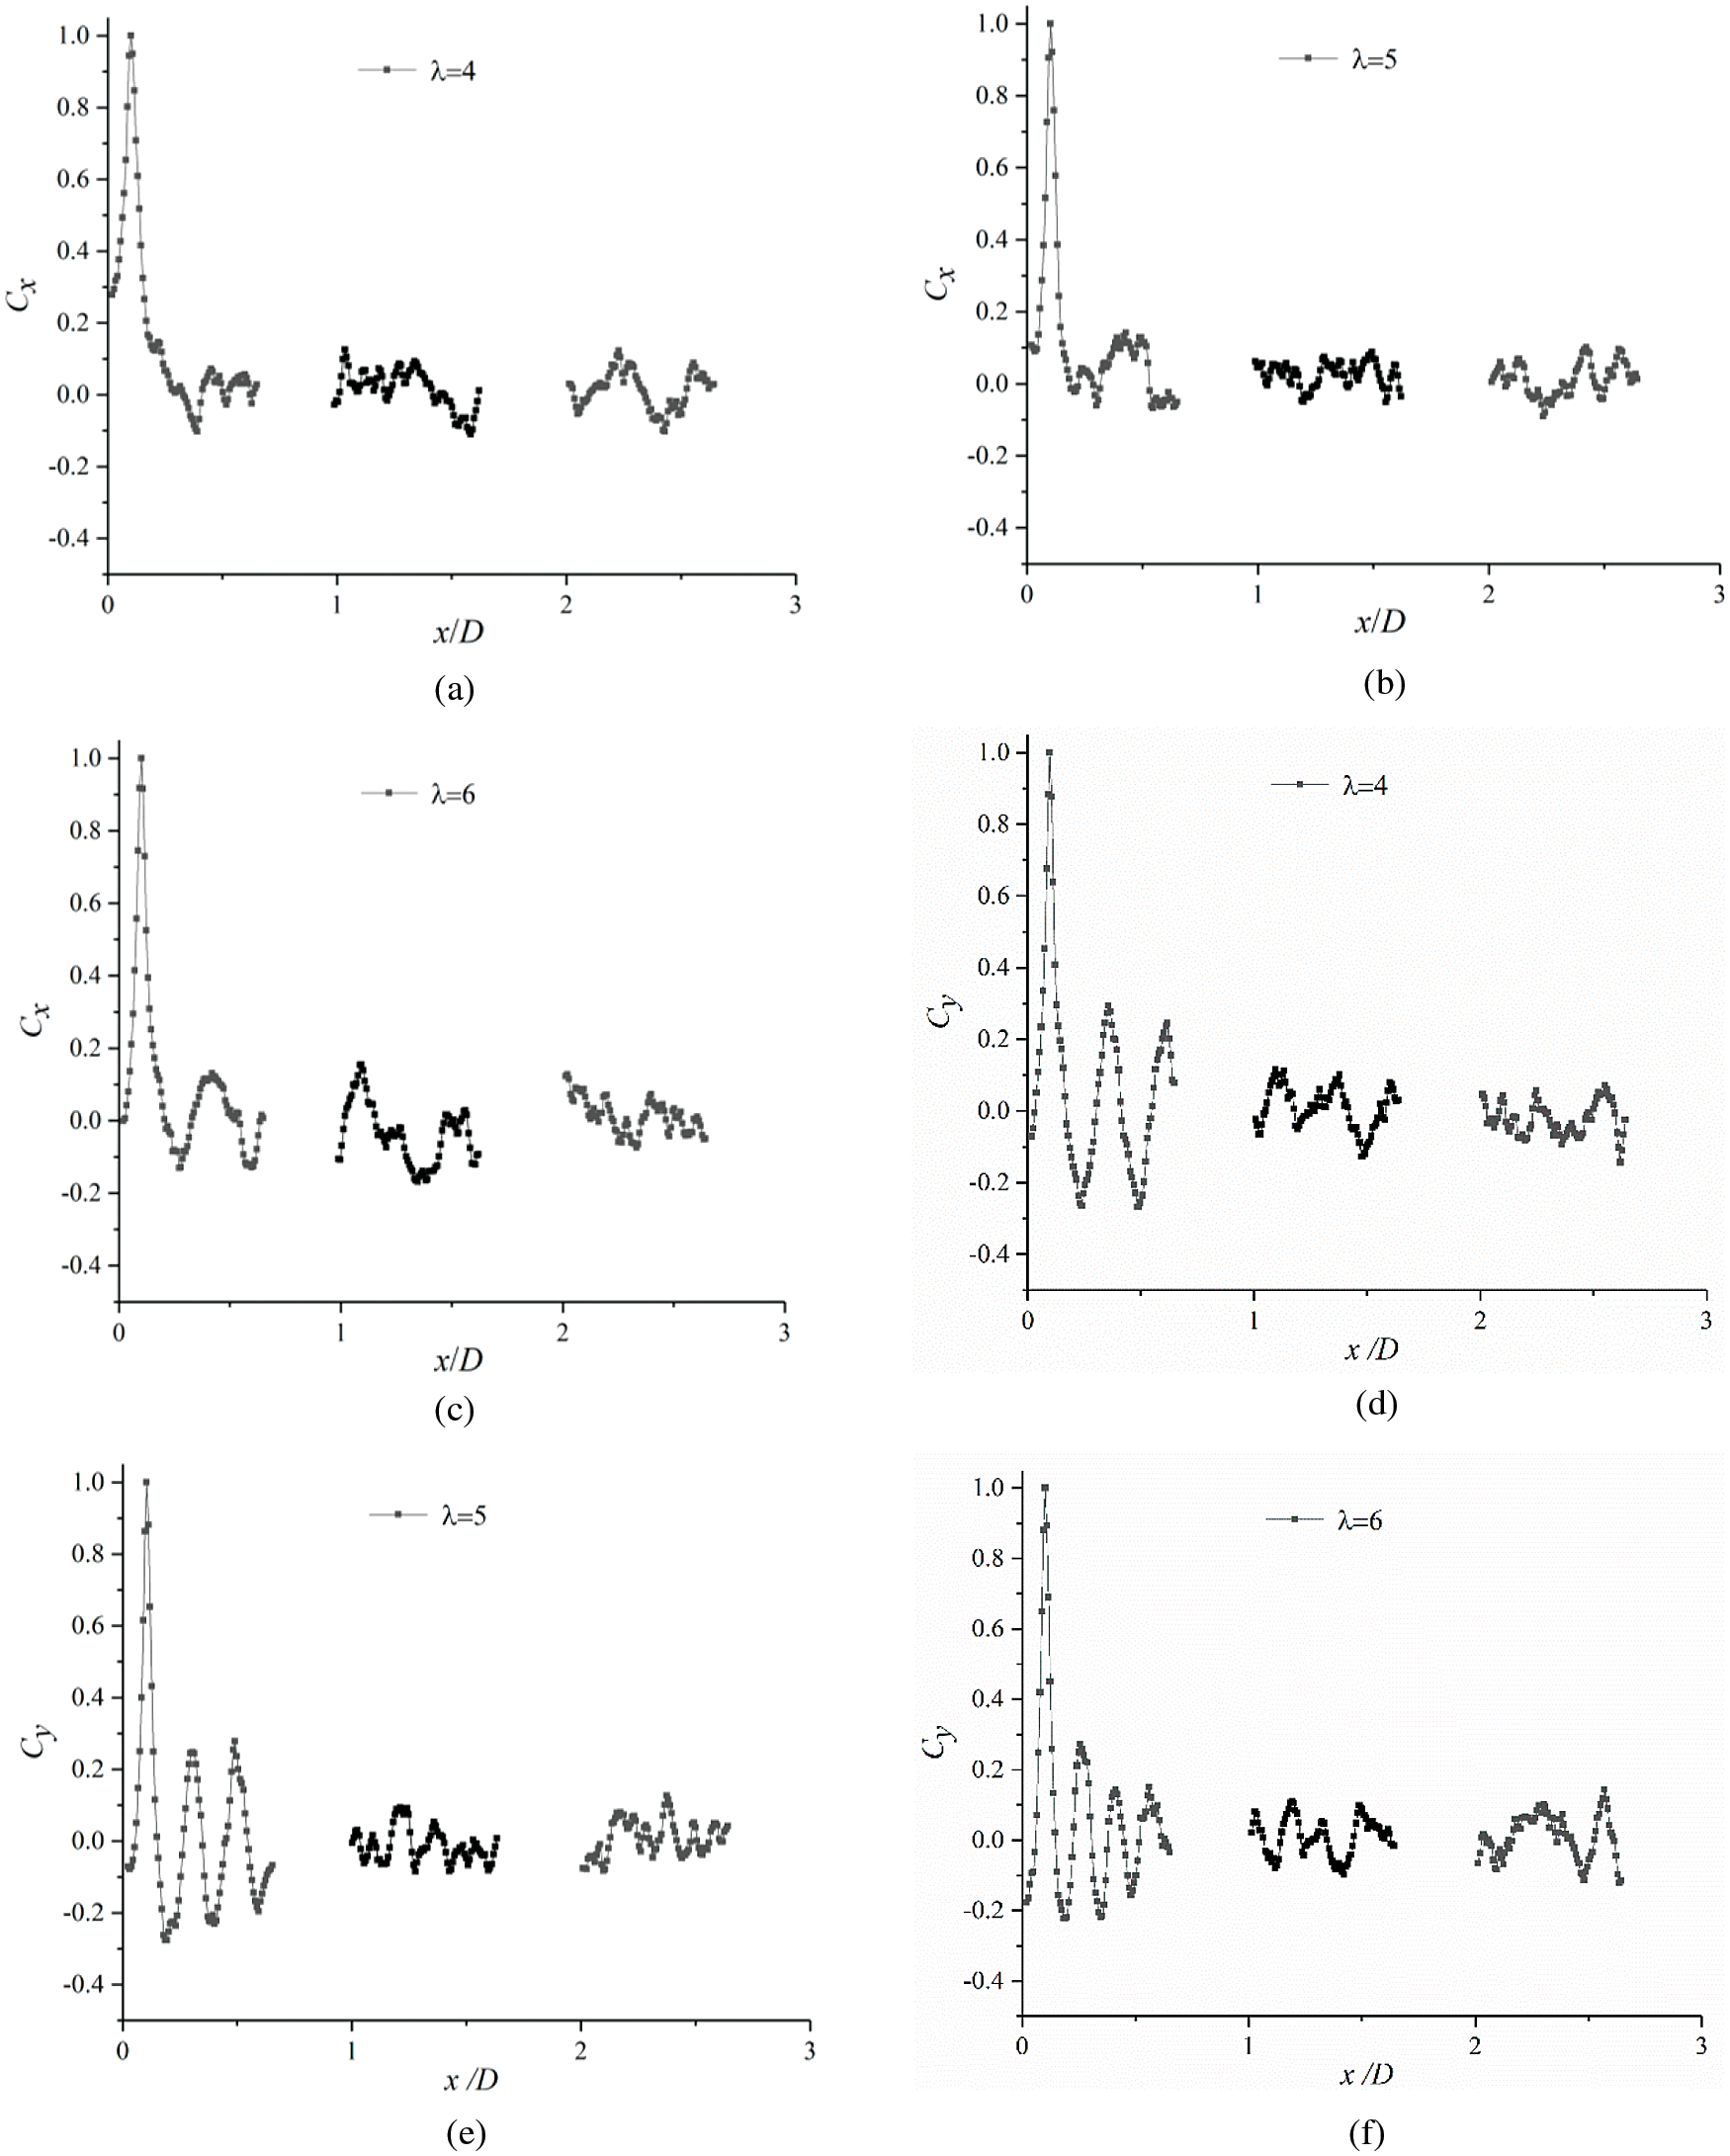
Figure 9: Distribution of axial and longitudinal space correlation coefficients at different
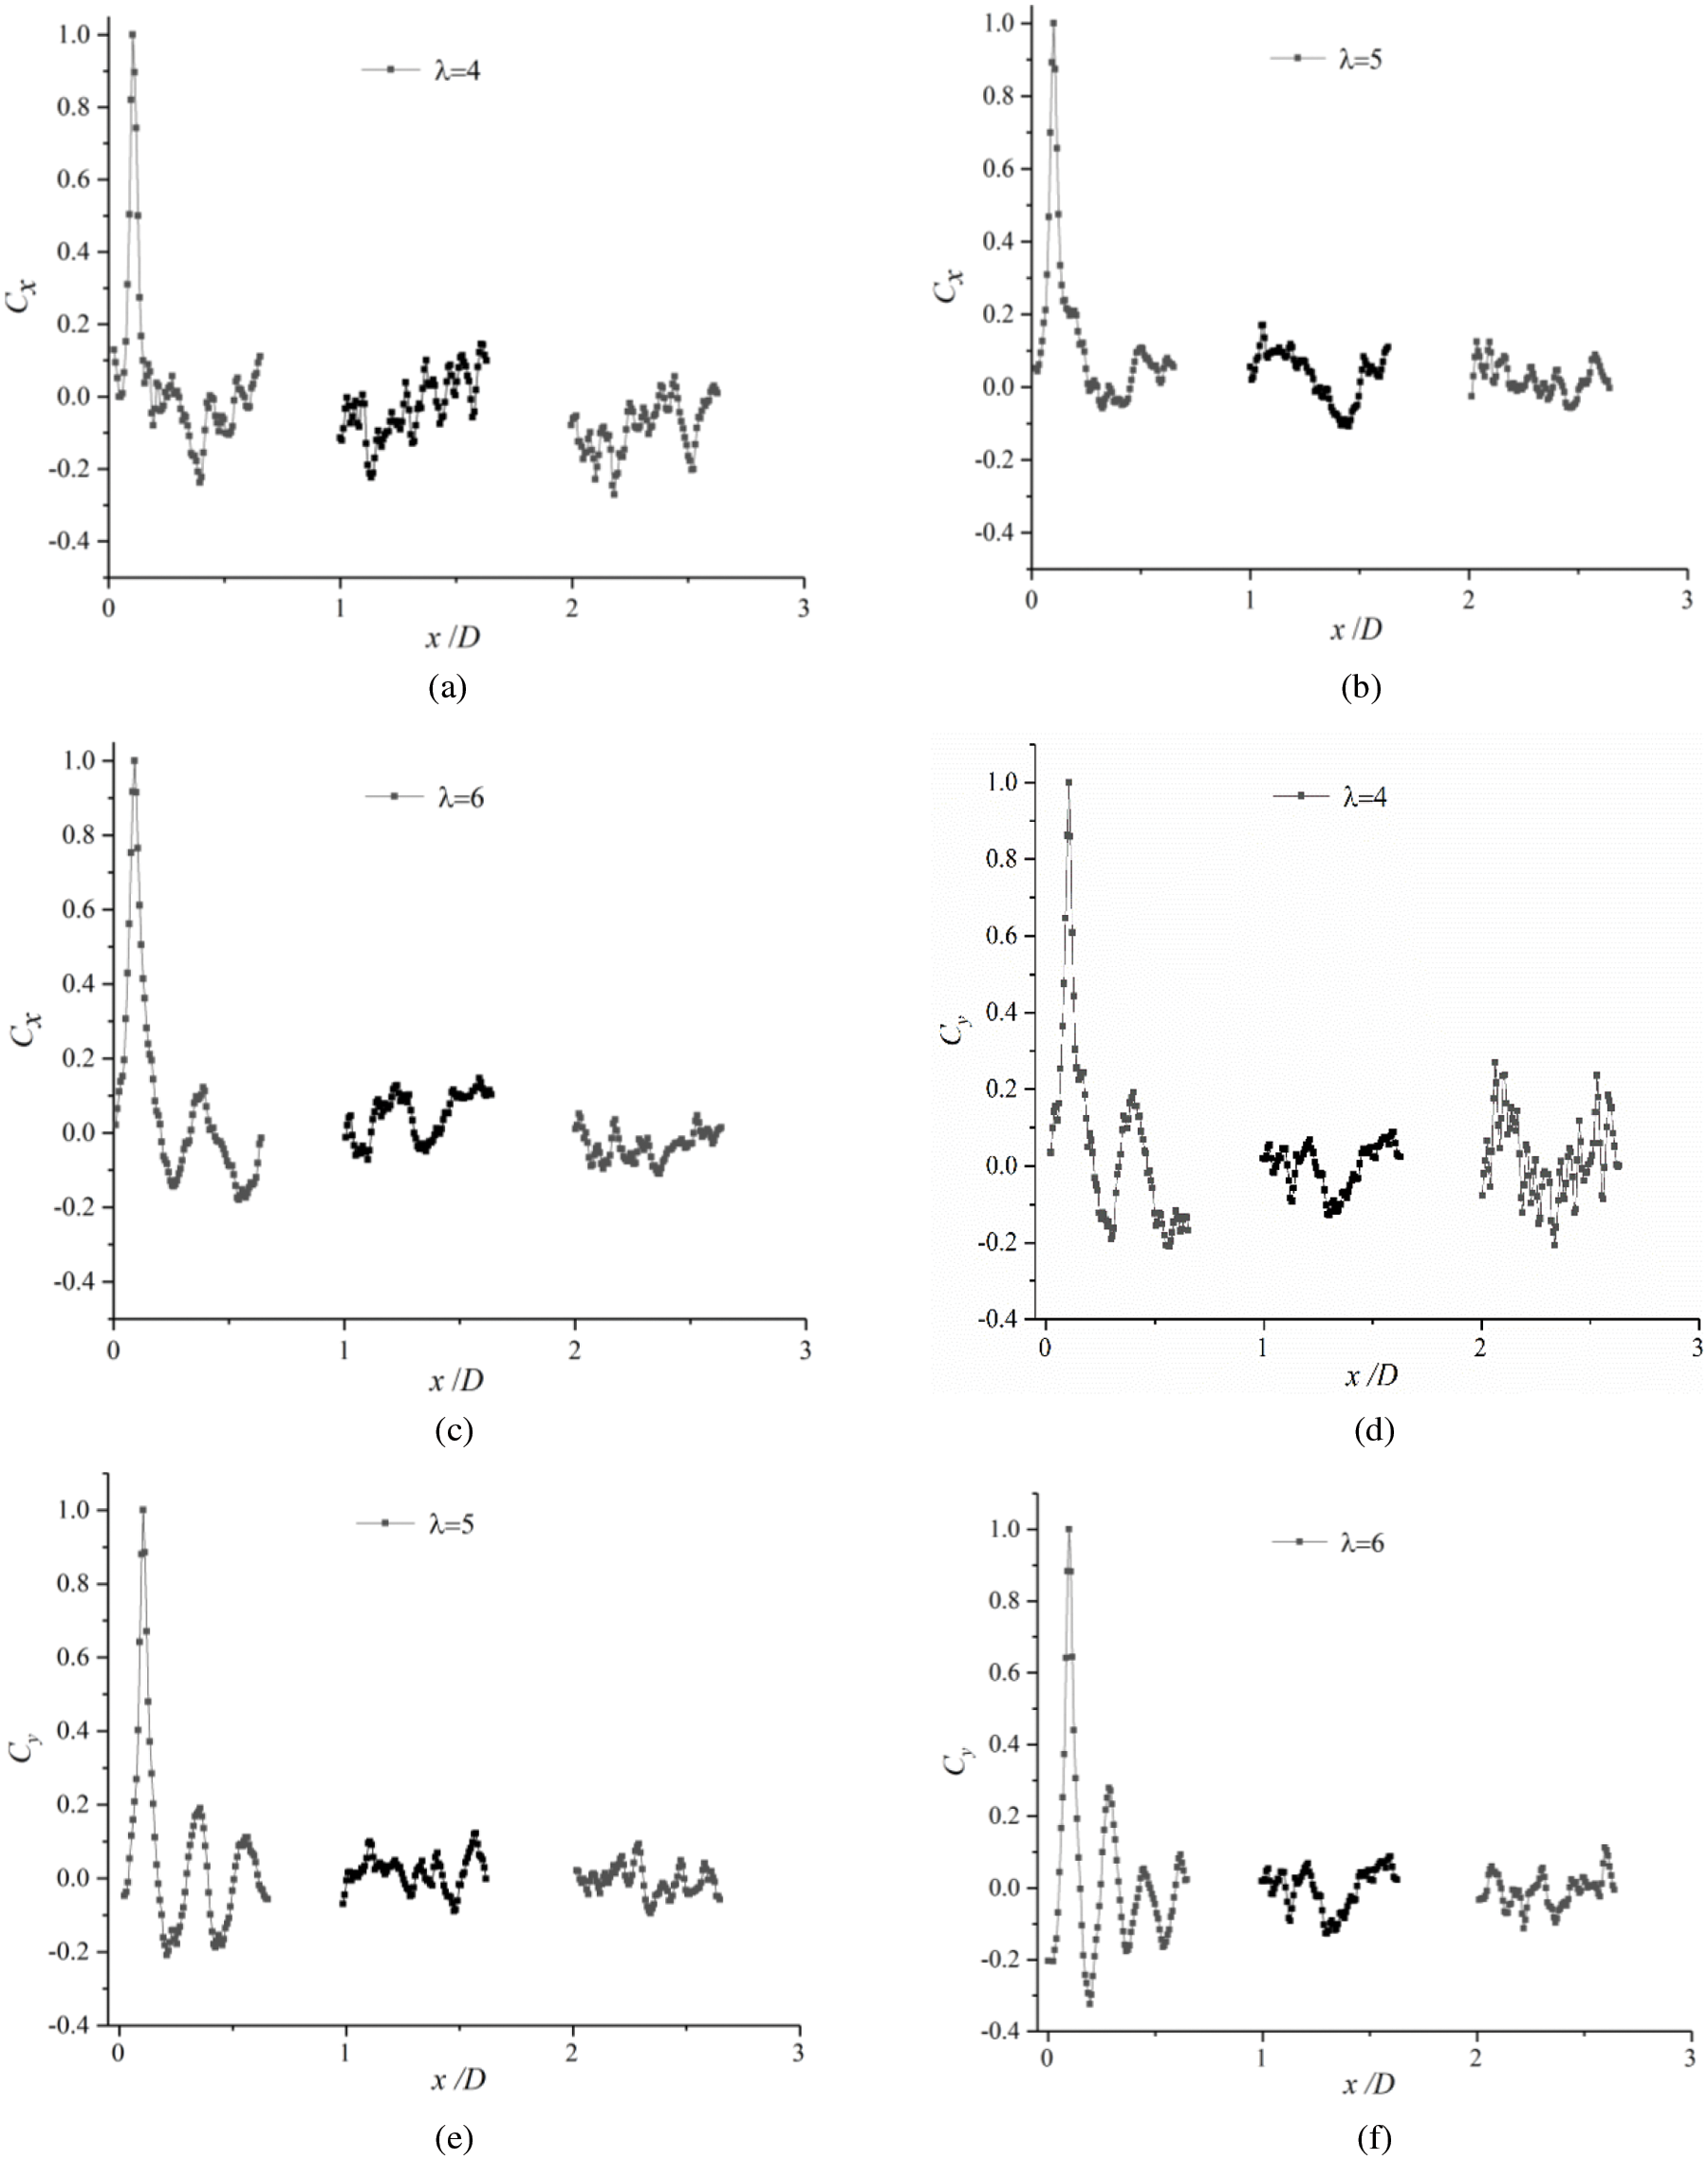
Figure 10: Distribution of axial and longitudinal space correlation coefficients at different
The number of peaks and peak value of the correlation coefficient of the axial and longitudinal space increases along with an increase in the tip speed ratio. This indicates an increasing of the number of identifiable coherent structure, however, the peak attenuation speed accelerates simultaneously. The longitudinal spatial correlation coefficient is significantly greater than that in the axial direction. This indicates that the longitudinal correlation structure is less likely to decay than the axial one. Moreover, the wake turbulence is characterized by longitudinal pulsation, which is consistent with the conclusions derived earlier in Subsection 3.1.
3.3 Turbulence Integral Scale Analysis
From a physical view, the pulsation velocity correlation coefficient between two points can represent the influence range of the vortex strength. If r (represents the distance between the target point and the research point) is large,
The turbulence integral scale is a concept based on the statistical average, which can approximately reflect the average scale of the overall vortex in the turbulence field, and is called the “large scale” of turbulence, i.e., the scale of the large vortex. By integrating the spatial correlation coefficient along the radial direction, the quantity with length dimension is obtained, which is called the turbulence integral length scale
The spatial correlation coefficient of the pulsation velocity were extracted, when
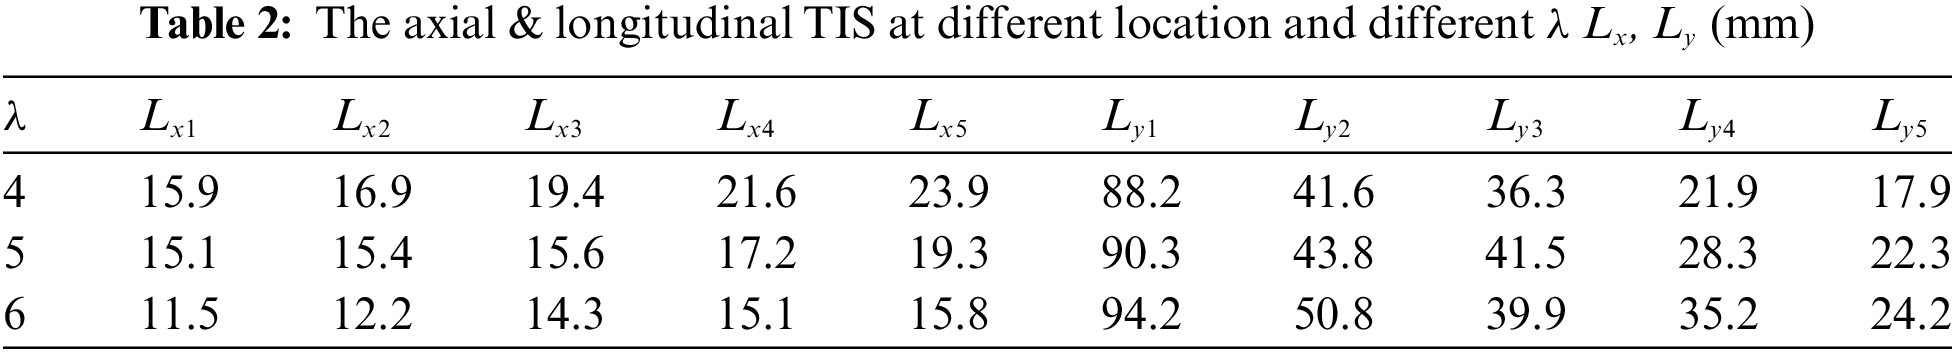
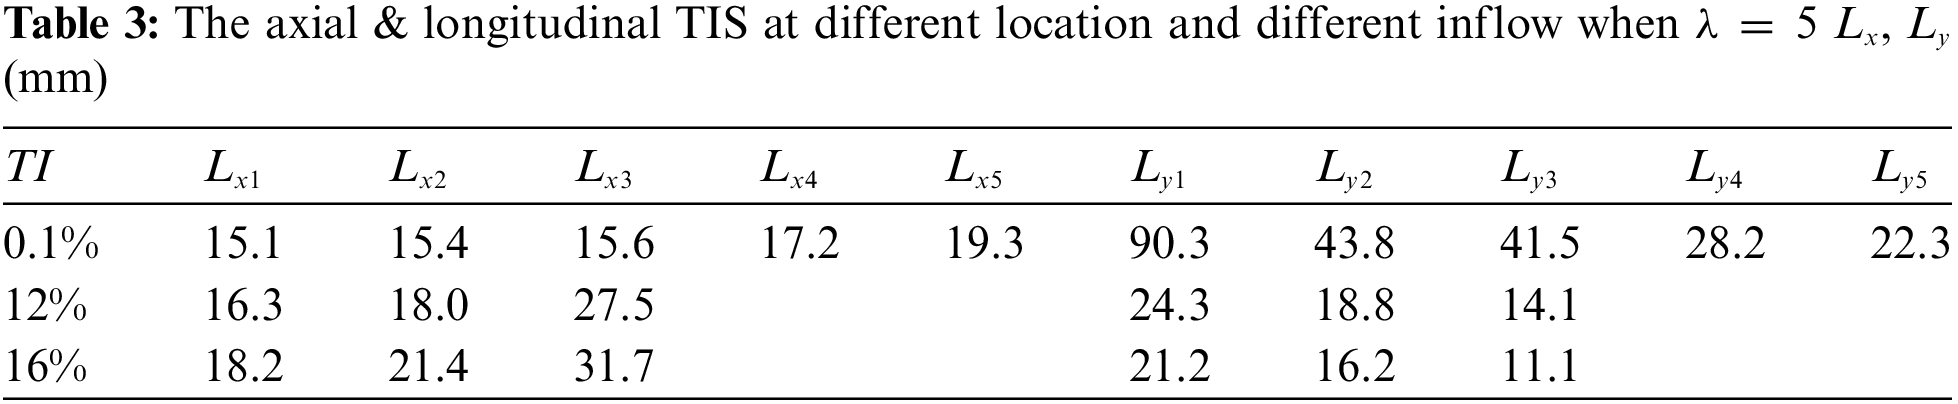
By comparative analysis, it is found that the integral scale of axial turbulence gradually increases with the downstream development of wake, which indicates that the large-scale vortex gradually expands and diffuses along the mainstream direction. On the contrary, the integral scale of longitudinal turbulence gradually decreases, which indicates that the vortex structure is squeezed in the longitudinal direction. With an increase in the tip speed ratio, the integral scale of axial turbulence decreases, while that of longitudinal turbulence increases. With an increase in turbulence intensity, the integral scale of axial turbulence increases, meanwhile, that of its longitudinal counterpart decreases.
The Fourier transform of the signal is the frequency spectrum, which is another way of representing the signal. The power spectrum is the Fourier transform of the autocorrelation function of the signal, that is, the signal is calculated autocorrelation, and then the Fourier Transformation, which describes the relationship between the energy characteristics of a signal and the frequency, can be used to analyze the carrying of different frequency components [39].
Eq. (4) is the power spectrum of the random process
According to the K41 theory, the energy spectrum curve of homogeneous isotropic turbulence with large Reynolds number has energy region, inertia sub-region and dissipative region. The transport process of turbulent kinetic energy in the inertia sub-region is as follows: turbulent pulsation transmits step by step from large-scale vortex (energy-containing region) to small-scale vortex (dissipative region), The turbulent vortex absorbs the energy of the large scale vortex and transfers it to the small scale turbulent vortex without dissipation. The slope of inertial sub-region distribution in the energy spectrum is −5/3. To better understand the multi-scale characteristics of wind turbine wakes we need to understand the influence of the scale range on wake structure to carry out pulsating velocity power spectrum analysis on wind turbine wakes, and to discuss the energy transfer characteristics between multi-scale vortex systems.
Under uniform inflow and turbulent inflow,
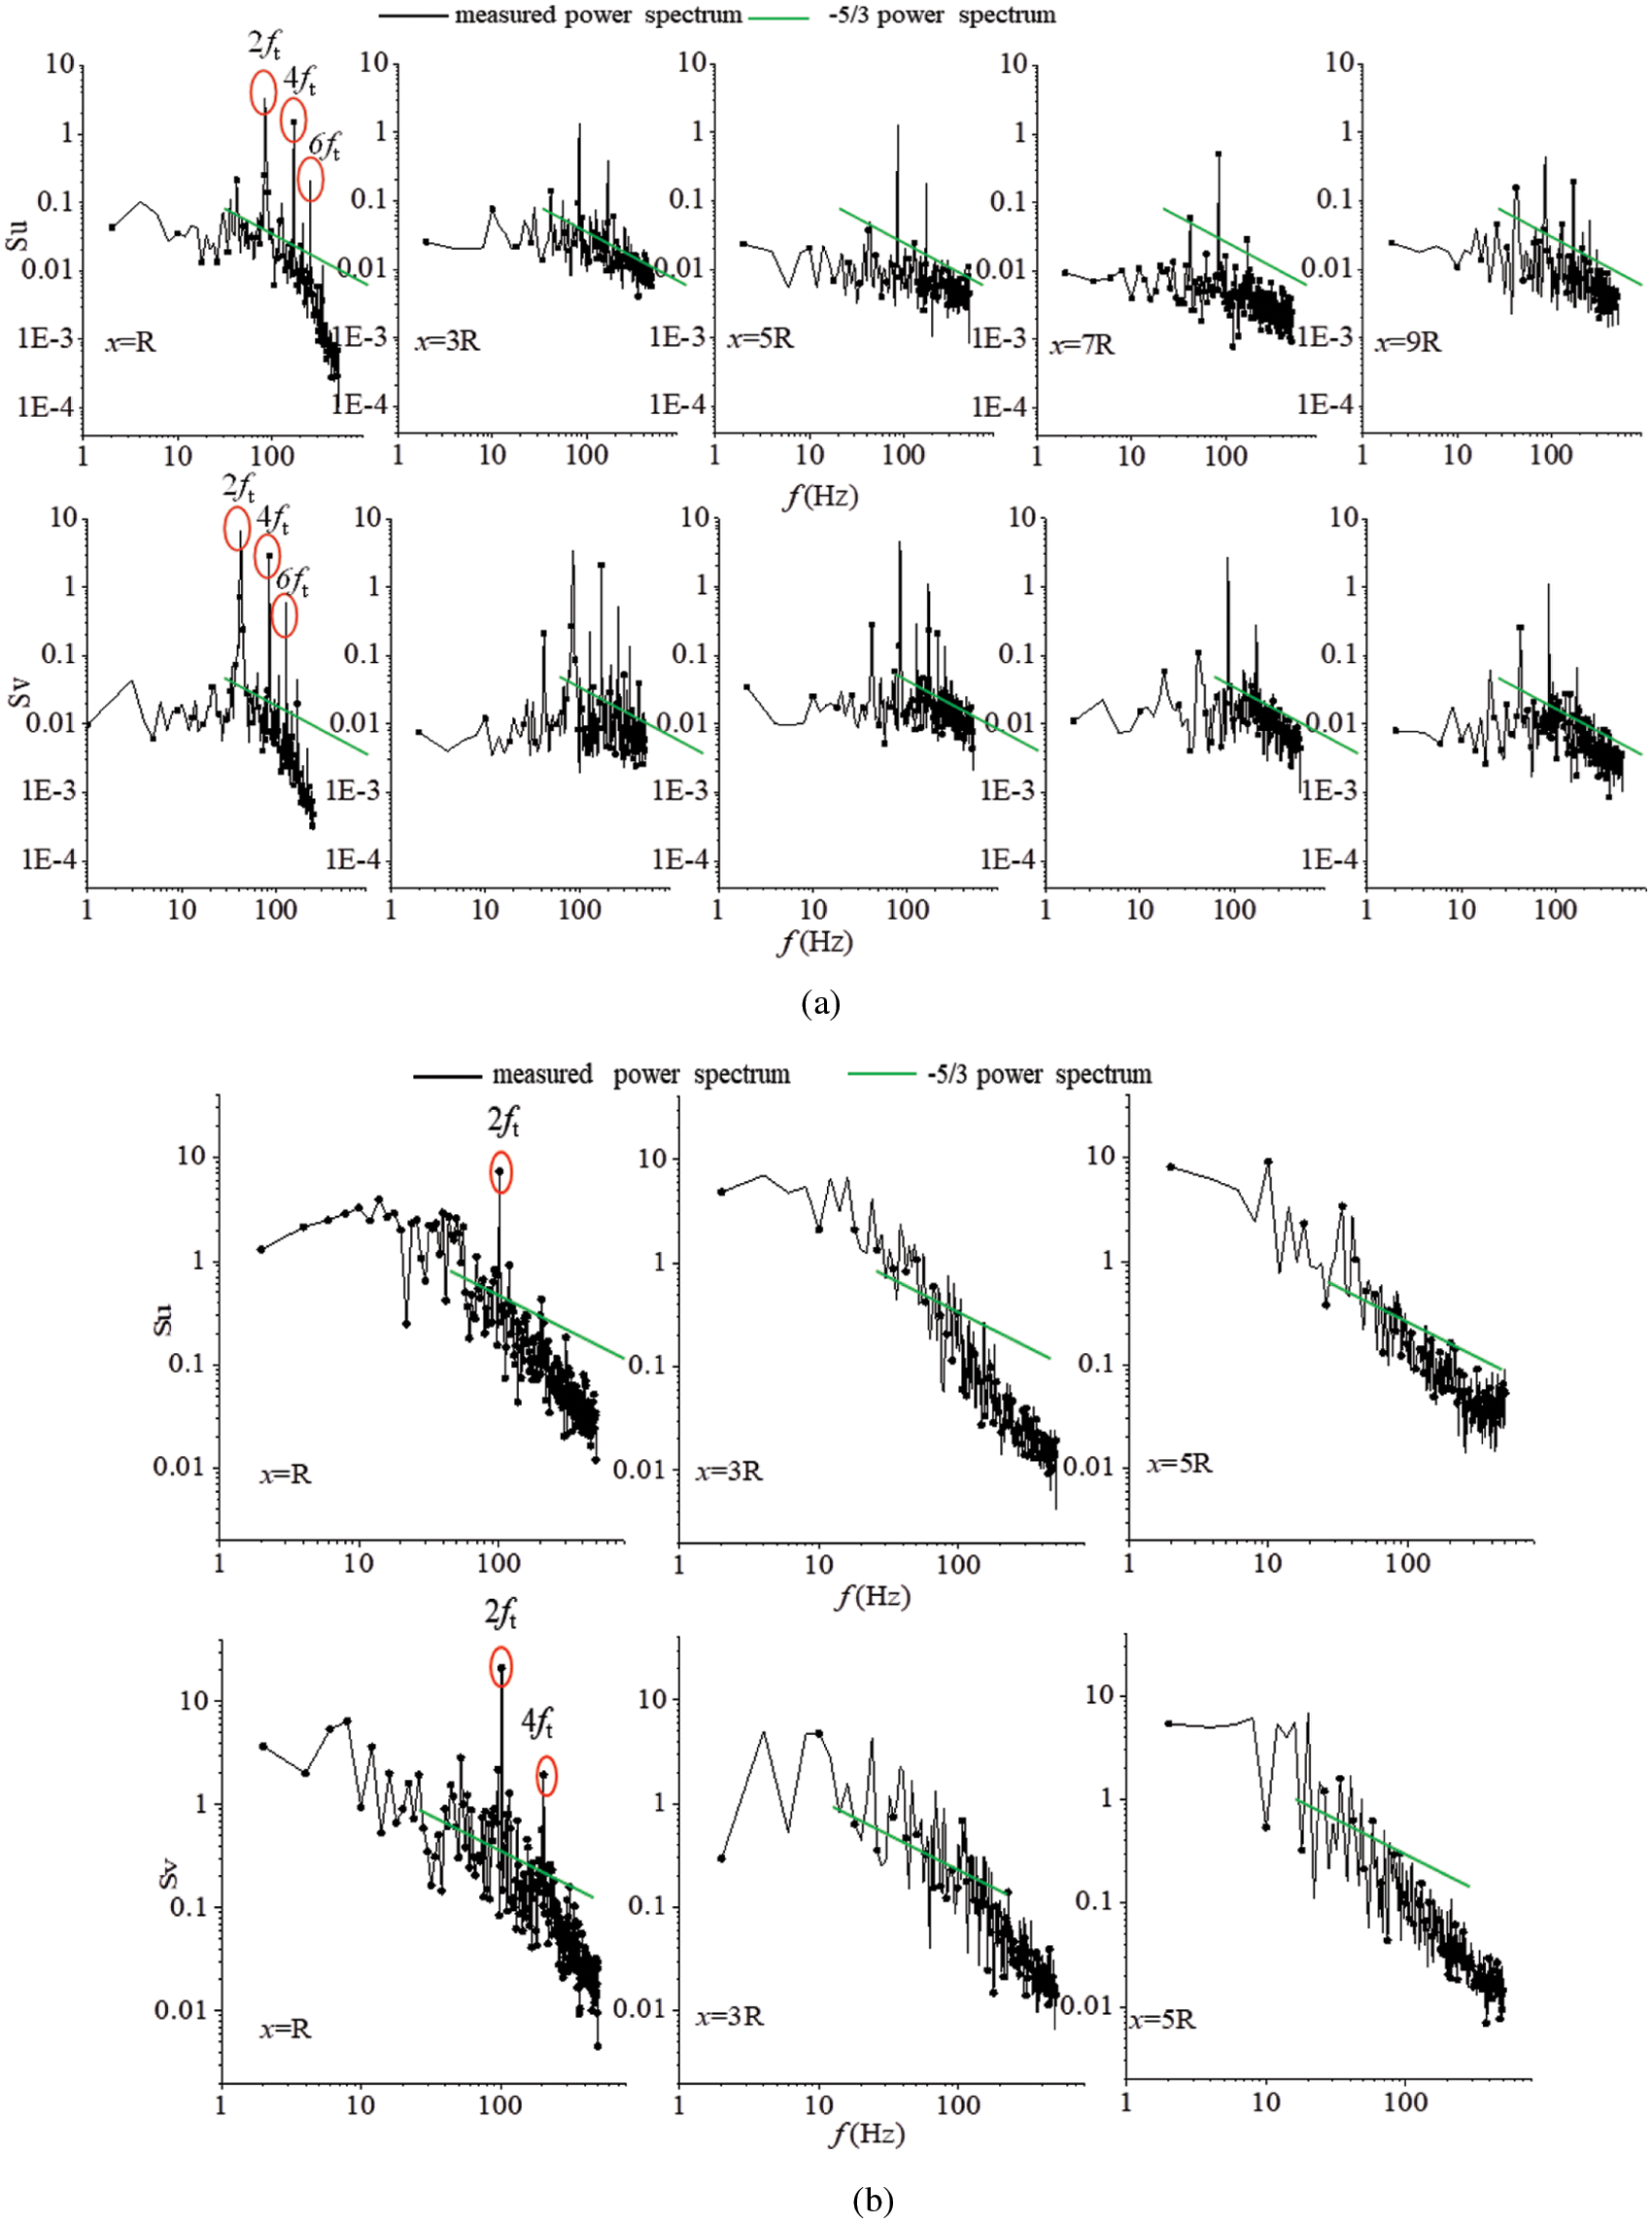
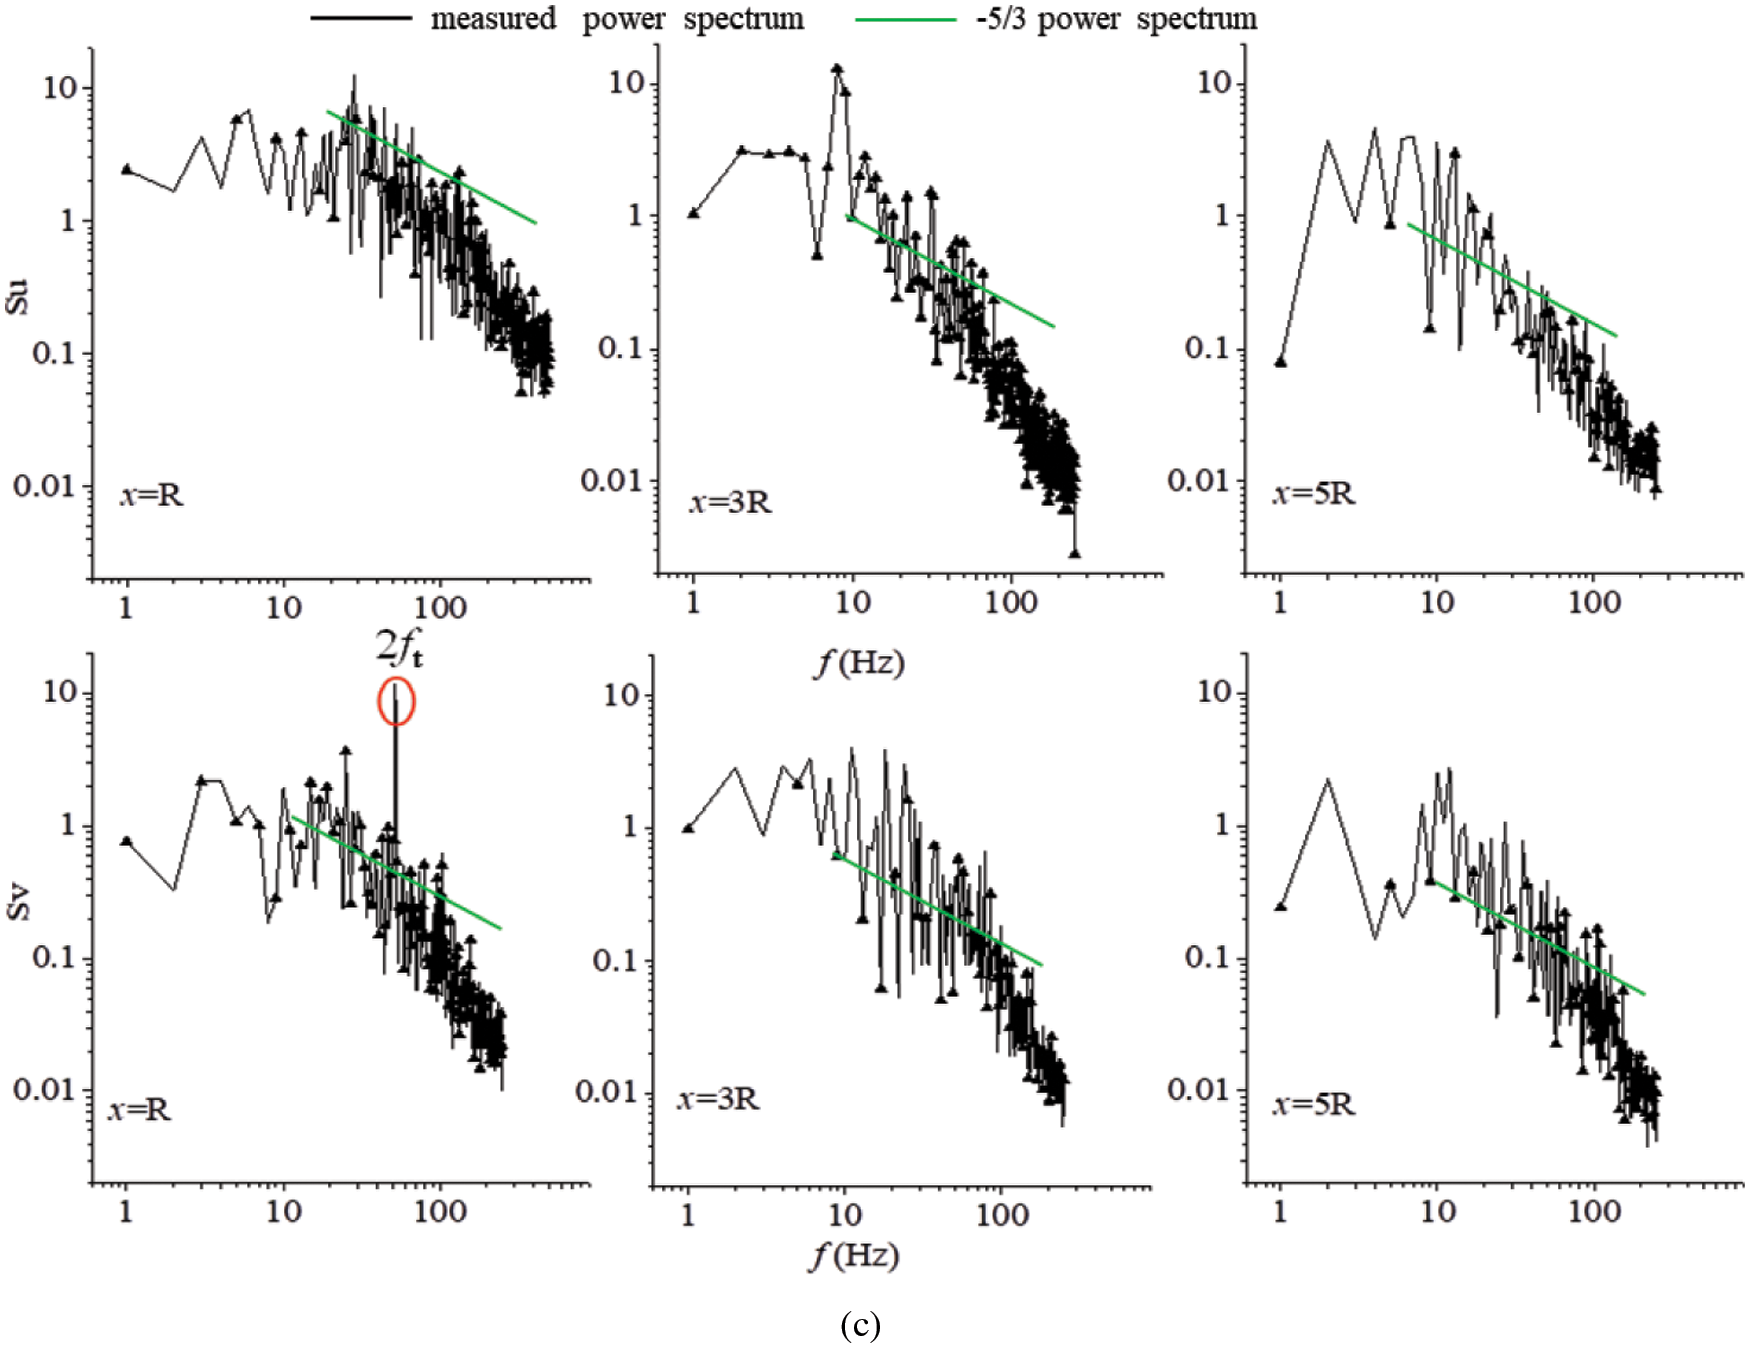
Figure 11: Power spectrum at different location (a)
The turbulent power spectrum value in either direction decreases rapidly as an increase of the frequency, which indicates that the turbulent pulsation kinetic energy gradually attenuates. It can be seen that the turbulent pulsation kinetic energy is mainly provided by the vortex with low frequency. From the perspective of the turbulent power spectrum value, the power spectrum peak in the X direction is significantly smaller than in the Y direction with the wake moving downstream. This implies that the attenuation of the turbulent pulsation kinetic energy in the Y direction is weaker than that in the X direction. Furthermore, this confirms the conclusion that longitudinal correlation is greater than axial correlation.
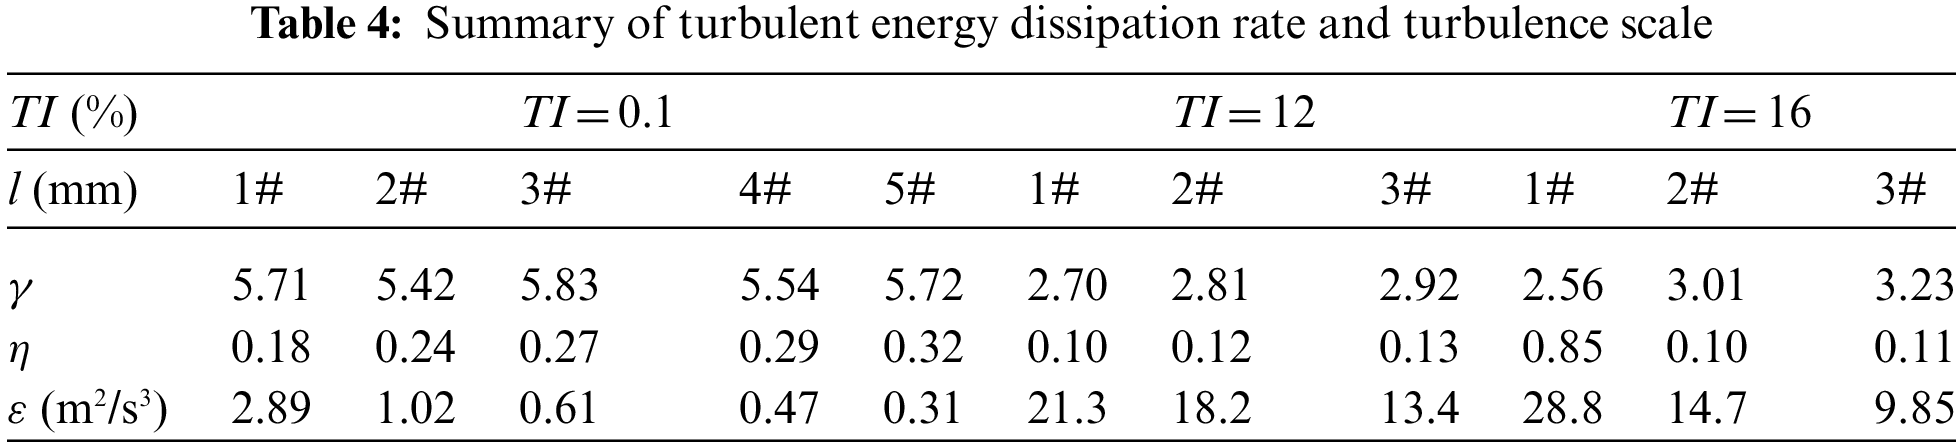
If the pulsation components of various frequencies are considered as turbulent vortexs of different scales, these scales are a concept of uncertainty. There are several typical scales in wake turbulence [40]:
According to the cascade process of turbulent kinetic energy proposed by Richardson, the dissipation rate of the turbulent kinetic energy (
Using the instantaneous velocity field data measured by TR-PIV, the spatial correlation coefficients of the pulsating velocity were calculated, with and without the grid. Subsequently, we obtained the coherent structure, turbulence integral scale of the wind turbine wake and power spectrum under different working conditions and explored the evolution laws of the large vortex coherent structure in the wake of the wind turbine.
(1) The large vortex coherent structures in the wake of a wind turbine are periodic in nature. With the wake developing downstream, the coherent structures gradually dissipate and spatial correlation of pulsation velocity the correlation becomes worsen. The spatial correlation of the longitudinal pulsation velocity is greater than that of the axial one, moreover, the wake turbulence pulsation is dominated by the longitudinal pulsation. Furthermore, as the wake developed downstream, the integral scale of axial turbulence gradually increases, whereas that of the longitudinal turbulence decreases simultaneously. This indicates that the large-scale vortex evolves and diffuses along the mainstream direction and that the vortex structure is squeezed in the longitudinal direction.
(2) With an increase of turbulent intensity, the coherent structures tend to dissipate. When
(3) Several isolated peaks in the power spectrum represent the existence of coherent structure. If the isolated peak cannot be identified in the power spectrum, it indicates the disappearance of coherent structure. At this time, the large vortex is broken into small vortex, indicating that the wake enters the far wake region. The isolated peak value could still be identified within 4.5
(4) Through the wake power spectrum analysis, it is found that the turbulent pulsation kinetic energy of the wake structure is mainly concentrated in the low-frequency large-scale vortex region. The momentum transport in the inertial sub-region increases with the increase in turbulence intensity, and that the width of the inertial sub-region (gradient = −5/3) increases with the downstream wake development. Moreover, with an increase in turbulence intensity, the dissipation rate of the turbulent kinetic energy increase, and the Taylor and dissipation scales decrease. In other words, turbulence is transported and dissipated on a smaller scale vortex, which is more conducive to the energy transfer between multi-scale vortexes in the wake and promotes wake recovery.
Funding Statement: This work was financially supported by the Inner Mongolia Autonomous Region Natural Science Foundation Research Project (Grant No. 2020MS05026); the Doctor Fund Project of Inner Mongolia University of Technology (Grant No. BS2020033), and the National Natural Science Foundation of China (Grant Nos. 52066014 and 51966013).
Conflicts of Interest: The authors declare that they have no conflicts of interest to report regarding the present study.
References
1. Vermeer, L. J., Sørensen, J. N., Crespo, A. (2003). Wind turbine wake aerodynamics. Progress in Aerospace Sciences, 39(6), 467–510. DOI 10.1016/S0376-0421(03)00078-2. [Google Scholar] [CrossRef]
2. Bogey, C., Bailly, C. (2007). An analysis of the correlations between the turbulent flow and the sound pressure fields of subsonic jets. Journal of Fluid Mechanics, 583, 71–97. DOI 10.1017/S002211200700612X. [Google Scholar] [CrossRef]
3. Tam, C. K., Viswanathan, K., Ahuja, K. P. (2008). The sources of jet noise: Experimental evidence. Journal of Fluid Mechanics, 615(1), 253–292. DOI10.1017/S0022112008003704. [Google Scholar] [CrossRef]
4. Mo, J. O., Choudhry, A., Arjomandi, M., Kelso, R., Lee, Y. H. (2013). Effects of wind speed changes on wake instability of a wind turbine in a virtual wind tunnel using large eddy simulation. Journal of Wind Engineering and Industrial Aerodynamics, 117, 38–56. DOI 10.1016/j.jweia.2013.03.007. [Google Scholar] [CrossRef]
5. Allah, V. A., Mayam, M. H. S. (2017). Large eddy simulation of flow around a single and two in-line horizontal-axis wind turbines. Energy, 121, 533–544. DOI 10.1016/j.energy.2017.01.052. [Google Scholar] [CrossRef]
6. Chen, G., Liang, X. F., Li, X. B. (2022). Modelling of wake dynamics and instabilities of a floating horizontal-axis wind turbine under surge motion. Energy, 239, 1–18. DOI 10.1016/j.energy.2021.122110. [Google Scholar] [CrossRef]
7. Chen, G., Li, X. B., Liang, X. F. (2022). IDDES simulation of the performance and wake dynamics of the wind turbines under different turbulent inflow conditions. Energy, 238, 1–15. DOI 10.1016/j.energy.2021.121772. [Google Scholar] [CrossRef]
8. Li, L., Huang, Z., Ge, M. W., Zhang, Q. Y. (2022). A novel three-dimensional analytical model of the added stream wise turbulence intensity for wind-turbine wakes. Energy, 238, 1–16. DOI 10.1016/j.energy.2021.121806. [Google Scholar] [CrossRef]
9. Kimura, K., Tanabe, Y., Aoyama, T., Matsuo, Y., Arakawa, C. et al. (2016). CFD simulations of a wind turbine for analysis of tip vortex breakdown. Journal of Physics, 749(1), 12–13. DOI 10.1088/1742-6596/749/1/012013. [Google Scholar] [CrossRef]
10. Sorensen, J. N., Shen, W. Z. (2002). Numerical modeling of wind turbine wakes. Journal of Fluids Engineering, 124, 393–399. DOI 10.1115/1.1471361. [Google Scholar] [CrossRef]
11. Shin, D., Ko, K. (2022). Experimental study on application of nacelle-mounted LiDAR for analyzing wind turbine wake effects by distance. Energy, 243, 1–8. DOI 10.1016/j.energy.2021.123088. [Google Scholar] [CrossRef]
12. Xue, Q. Y., Zhang, G. P., Huang, Z. Y., Lu, L. Z., Zhang, J. (2011). Experimental investigation of turbulent flow characteristics of airfoil model wake by PIV in cavitation tunnel. Journal of Ship Mechanics, 15(7), 730–738. DOI 10.3969/j.issn.1007-7294.2011.07.004. [Google Scholar] [CrossRef]
13. Bao, H. H., Gu, Z. Q., Tan, P. (2014). Experimental analysis of automobile wake field turbulent characteristics under the yaw angle condition. Journal of Experiment Mechanics, 29(4), 460–466. DOI 10.7520/1001-4888-13-187. [Google Scholar] [CrossRef]
14. Zhai, S. C., Zhang, J., Hong, F. W., Zhao, F. (2011). Measurement and analysis of turbulent flow behind airfoil by Tr-PIV. Ship Science and Technology, 33(2), 18–23. DOI 10.3404/j.issn.1672-7649.2011.02.004. [Google Scholar] [CrossRef]
15. Lian, Q. X. (2006). Experimental study on coherent structure in turbulent boundary layers. Advances in Mechanics, 36(3), 373–388. DOI 10.1016/j.mineng.2005.09.006. [Google Scholar] [CrossRef]
16. Xu, C. X. (2015). Coherent structures and drag-reduction mechanism in wall turbulence. Advances in Mechanics, 45(4), 111–140. DOI 10.6052/1000-0992-15-006. [Google Scholar] [CrossRef]
17. Tang, Z. Q., Jiang, N., Schroder, A., Geisler, R. (2012). Tomographic PIV investigation of coherent structures in a turbulent boundary layer flow. Acta Mechanica Sinica, 28(3), 572–582. DOI 10.1007/s10409-012-0082-y. [Google Scholar] [CrossRef]
18. Zhao, W., Li, W. P. (2007). Experimental studies on SL scaling law and spatial scales of coherent structures in near-wall turbulent boundary layer. Theoretical and Applied Mechanics, 39(1), 23–36. DOI 10.1016/S1874-8651(08)60032-0. [Google Scholar] [CrossRef]
19. Schroder, A., Geisler, R., Gerrit, E., Scarano, F., Dierksheide, U. (2008). Investigation of a turbulent spot and a tripped turbulent boundary layer flow using time-resolved tomographic PIV. Experimental Fluids, 44, 305–316. DOI 10.1007/s00348-007-0403-2. [Google Scholar] [CrossRef]
20. Chamorro, L., Lee, S. J., Arndt, R., Univ, F. (2012). Spatial characterization of the turbulent structure of a model wind turbine: High speed PIV measurements. 12th Annual Meeting of the APS Division of Fluid Dynamics, Texas Tech University. [Google Scholar]
21. España, G., Aubrun, S., Loyer, S., Devinant, P. (2012). Wind tunnel study of the wake meandering downstream of a modelled wind turbine as an effect of large scale turbulent eddies. Journal of Wind Engineering and Industrial Aerodynamics, 101, 24–33. DOI 10.1016/j.jweia.2011.10.011. [Google Scholar] [CrossRef]
22. Toloui, M., Chamorro, L. P., Hong, J. R. (2015). Detection of tip-vortex signatures behind a 2.5 MW wind turbine. Journal of Wind Engineering and Industrial Aerodynamics, 143, 105–112. DOI 10.1016/j.jweia.2015.05.001. [Google Scholar] [CrossRef]
23. Howard, K. B., Singh, A., Sotiropoulos, F., Guala, M. (2015). On the statistics of wind turbine wake meandering: An experimental investigation. Physics of Fluids, 27(7), 75–103. DOI 10.1063/1.4923334. [Google Scholar] [CrossRef]
24. Jin, Y. Q., Liu, H. W., Aggarwal, R., Singh, A., Chamorro, L. P. (2016). Effects of freestream turbulence in a model wind turbine wake. Energies, 9(10), 830. DOI 10.3390/en9100830. [Google Scholar] [CrossRef]
25. Liu, H. W., Hayat, I., Jin, Y. Q., Chamorro, L. P. (2018). On the evolution of the integral time scale within wind farms. Energies, 11(93), 1–11. DOI 10.3390/en11010093. [Google Scholar] [CrossRef]
26. Hong, J. R., Toloui, M., Chamorro, L. P., Guala, M., Howard, K. et al. (2014). Natural snowfall reveals large-scale flow structures in the wake of a 25-MW wind turbine. Nature Communications, 6, 1–9. DOI 10.1038/ncomms5216. [Google Scholar] [CrossRef]
27. Yang, X. L., Hong, J. R., Barone, M., Sotiropoulos, F. (2016). Coherent dynamics in the rotor tip shear layer of utility-scale wind turbines. Fluid Mechanics, 804, 90–115. DOI 10.1017/jfm.2016.503. [Google Scholar] [CrossRef]
28. Chen, Y. C., Kalt, P. A. M., Masri, A. R. (1999). Feasibility study of integral length scale measurements in turbulent jet flows using DPIV. 2nd Australian Conference on Laser Diagnostics in Fluid Mechanics and Combustion, pp. 9–10. Monash University. [Google Scholar]
29. Liu, G., Wang, Y., Wang, X. Y., Shi, J. T., Wang, J. (2007). PIV measurements of the ILS on in-cylinder gas turbulent flow field of gasoline engine. Journal of Experiments in Fluid Mechanics, 21(1), 59–63. DOI 10.1007/s10483-007-0101-x. [Google Scholar] [CrossRef]
30. Pang, J. B., Ge, Y. J., Lu, Y. (2002). Methods for analysis of turbulence integral length in atmospheric boundary-layer. Journal of Tongji University, 30(5), 622–626. [Google Scholar]
31. Han, Y. X., Wang, J. W., Li, X., Sun, B., Liu, Z. (2019). Experimental study on the influence of turbulent intensity on the wake vortex structure of wind turbine. Acta Energiae Solaris Sinica, 40(4), 1179–1184. [Google Scholar]
32. Dong, X. Q., Liu, Z., Wang, J. W., Zhang, S. C., Han, Y. X. (2019). Experimental study on trajectory of tip vortex in wake of horizontal axis wind turbine wake. Acta Energiae Solaris Sinica, 40(2), 326–332. DOI 10.29252/jafm.73.245.27878. [Google Scholar] [CrossRef]
33. Zhang, L. R., Xing, J. K., Wang, J. W., Yuan, R. Y., Dong, X. Q. et al. (2017). Experimenal study of the wake characteristics of a two-blade horizontal axis wind turbine by time-resolved PIV. Science China Technical Science, 60, 593–601. DOI 10.1007/s11431-016-0558-1. [Google Scholar] [CrossRef]
34. Luo, K., Yuan, R. Y., Dong, X. Q., Wang, J. W., Zhang, S. X. et al. (2017). Large-eddy simulation and experimental study on the turbulent wake flow characteristics of a two-bladed wind turbine. Science China Technical Sciences, 60, 1–9. DOI 10.1007/s11431-017-9109-7. [Google Scholar] [CrossRef]
35. Chen, T. Y., Liou, L. R. (2011). Blockage corrections in wind tunnel tests of small horizontal-axis wind turbines. Experimental Thermal and Fluid Science, 35, 565–569. DOI 10.1016/j.expthermflusci.2010.12.005. [Google Scholar] [CrossRef]
36. Chu, C. R., Chiang, P. H. (2014). Turbulence effects on the wake flow and power production of a horizontal-axis wind turbine. Journal of Wind Engineering and Industrial Aerodynamics, 124, 82–89. DOI 10.1016/j.jweia.2013.11.001. [Google Scholar] [CrossRef]
37. IEC61400-1 (2019). Wind energy generation systems–Part1. Design requirements (Edition 4.0). [Google Scholar]
38. Han, Y. X., Wang, J. W., Liu, Z., Dong, X. Q., Sun, B. (2019). Experimental study on the coherent structure of wind turbine wake based on TR-PIV. Acta Energiae Solaris Sinica, 40(10), 2892–2898. [Google Scholar]
39. Guo, T. (2018). Study on wake characteristics of horizontal axis wind turbine in neutral atmospheric boundary layer. Lanzhou University of Technology, China. [Google Scholar]
40. Han, Y. X. (2019). Experimental study on the influence of turbulence intensity on wake recovery of wind turbine and its mechanism analysis. Inner Mongolia University of Technology, China. [Google Scholar]
Cite This Article
 Copyright © 2022 The Author(s). Published by Tech Science Press.
This work is licensed under a Creative Commons Attribution 4.0 International License , which permits unrestricted use, distribution, and reproduction in any medium, provided the original work is properly cited.
 Downloads
 Citation Tools