
 Submit a Paper
 Propose a Special lssue
 Open Access
ARTICLE
Application of Submerged Ultrafiltration in Pretreatment of Flue Gas Desulfurization Wastewater
1 School of Energy, Power and Mechanical Engineering, North China Electric Power University, Beijing, 102206, China
2 Hebei Construction & Investment Group Xuanhua Thermal Power Co., Ltd., Zhangjiakou, 075100, China
* Corresponding Author: Dan Gao. Email:
(This article belongs to the Special Issue: Advanced Materials and Technologies for Sustainable Energy)
Energy Engineering 2022, 119(6), 2277-2296. https://doi.org/10.32604/ee.2022.020795
Received 13 December 2021; Accepted 10 March 2022; Issue published 14 September 2022
 View Full Text
 Download PDF
Abstract
Nowadays, the zero liquid discharge of flue gas desulfurization (FGD) wastewater from coal-fired units has attracted the attention of all countries in the world. The pretreatment methods generally have the problems of high operation cost, small treatment capacity, and poor flexibility. However, the membrane method can avoid the above problems. In the current research, it has not been found that someone directly uses submerged ultrafiltration to pretreat FGD wastewater. Therefore, this paper innovatively proposed to directly use ceramic ultrafiltration membrane to treat FGD wastewater, which can ensure effluent quality and improve the flexibility of the pretreatment system. In this paper, the performance of submerged ultrafiltration membrane for the filtration of FGD wastewater from a power plant was studied to optimize the filtration performance and improve the effluent quality. The effects of operating parameters such as membrane permeate flux, aeration rate and filtration/backwashing time combination on the membrane performance were studied. The results showed that when the filtration/backwashing time combination was 15 min/30 s, with the increased in permeate flux from 55 L/(m2·h) to 100 L/(m2·h), the steady transmembrane pressure (TMP) increased from 39 kPa to 70 kPa, and the fouling rate increased significantly from 4.5 kPa/h to 7.3 kPa/h; When the aeration rate increased from 10 m3/(m2·h) to 30 m3/(m2·h), the membrane pollution was much reduced. Excessive aeration rate cannot further alleviate the membrane pollution, but also brought greater energy consumption; Increasing backwashing time can effectively inhibit the formation of gel layer on the surface of the membrane and prolong the initial stage of low-pressure operation; The rejection of suspended solids (SS) and turbidity of the equipment studied in this paper can reach more than 99% under various working conditions, which can satisfy the water quality requirements of the subsequent steps. The submerged ultrafiltration membrane was suitable for the pretreatment of FGD wastewater because it can ensure the quality of permeate under the premise of long-term operation.
Keywords
By 2020, China’s installed power generation capacity has reached 2.12 billion kilowatts, of which thermal power generation accounts for 58%. Because China’s primary energy structure determines that coal-fired power generation will continue to occupy a dominant position in the China’s power structure for a long time in the future [1]. Unfortunately, China’s electricity and water relationship management has a profound challenge. This is due to the mismatch between coal reserves and water resources, as well as the spatial distribution of China’s power demand and supply center [2]. To face this challenge, countries have successively introduced stricter water-saving legislation. For example, in April 2015, the State Council launched Water Pollution Prevention Action Plan [3]. In November 2015, the US Environmental Protection Agency issued emission limited guidelines for the steam power generation industry to strictly control water resource emissions from coal-fired power plants [4]. At present, wet limestone-gypsum flue gas desulfurization (FGD) technology is the most commonly used technology in coal-fired power plants in China [5,6]. In this technology, heavy metals, Cl− and SO42− in coal are constantly enriched in the desulfurization slurry, leading to the decrease of desulfurization efficiency and serious corrosion of equipment, so it is necessary to discharge this part of FGD wastewater regularly [7]. Therefore, in the face of more stringent wastewater discharge standards, zero liquid discharge (ZLD) of FGD wastewater in China is essential.
At present, most power plants in our country use triplet tank to treat FGD wastewater, that is, neutralization, precipitation, and flocculation. Most metal ions are precipitated as hydroxides by increasing pH, while heavy metal ions like Hg2+ and Pb2+ were precipitated by organic/inorganic sulfides addition [8]. However, it is difficult to remove Cl− and SO42− from the wastewater. Moreover, due to the submicron or nano size of metal precipitates, the traditional coagulation method has a lower separation speed [9]. At the same time, the water quality of FGD wastewater is greatly affected by coal quality, limestone composition, the operation mode of desulfurization device. Therefore, the FGD wastewater of different coal-fired power plants is very different. In conclusion, it is necessary to select a suitable ZLD process according to the water quality. A series of zero liquid discharge demonstration projects with a variety of technologies have sprung up over the past few years. Jia et al. [10] adopted the integrated technology of pretreatment, nanofiltration, and membrane distillation to achieve a desalination rate of more than 99% and wastewater recovery rate of more than 92%. China Changxing power plants adopted forward osmosis and evaporative crystallization technology, which can obtain 40%–60% wastewater recovery rate and remove Ca2+, Mg2+, Hg2+ and SO42- from wastewater [11]. Conidi et al. [12] achieved a total recovery of 94% on a laboratory scale using the integrated technology of chemical softening, ultrafiltration pretreatment, reverse osmosis, and membrane distillation.
Compared with industrial wastewater with high salinity and high pollution, the FGD wastewater not only has high salt content [13], but also the more prominent problem is that suspended solids (SS) and turbidity in wastewater seriously exceed the standard [14]. High turbidity and high SS have seriously limited the selection of FGD wastewater ZLD process routes. High SS and turbidity will not only cause negative problems such as color and smell, but also raise the risk of adsorbing inorganic ions and organic pollutants. These problems will enhance the instability and complexity of FGD wastewater quality. In the process of ZLD of FGD wastewater, if the advanced treatment of SS and turbidity is not carried out, the problems of blockage, scaling and corrosion of subsequent process equipment will often be caused. Therefore, to ensure the long-term stable operation in the process of ZLD of FGD wastewater, it is necessary to give priority to the pretreatment of SS and turbidity in the wastewater.
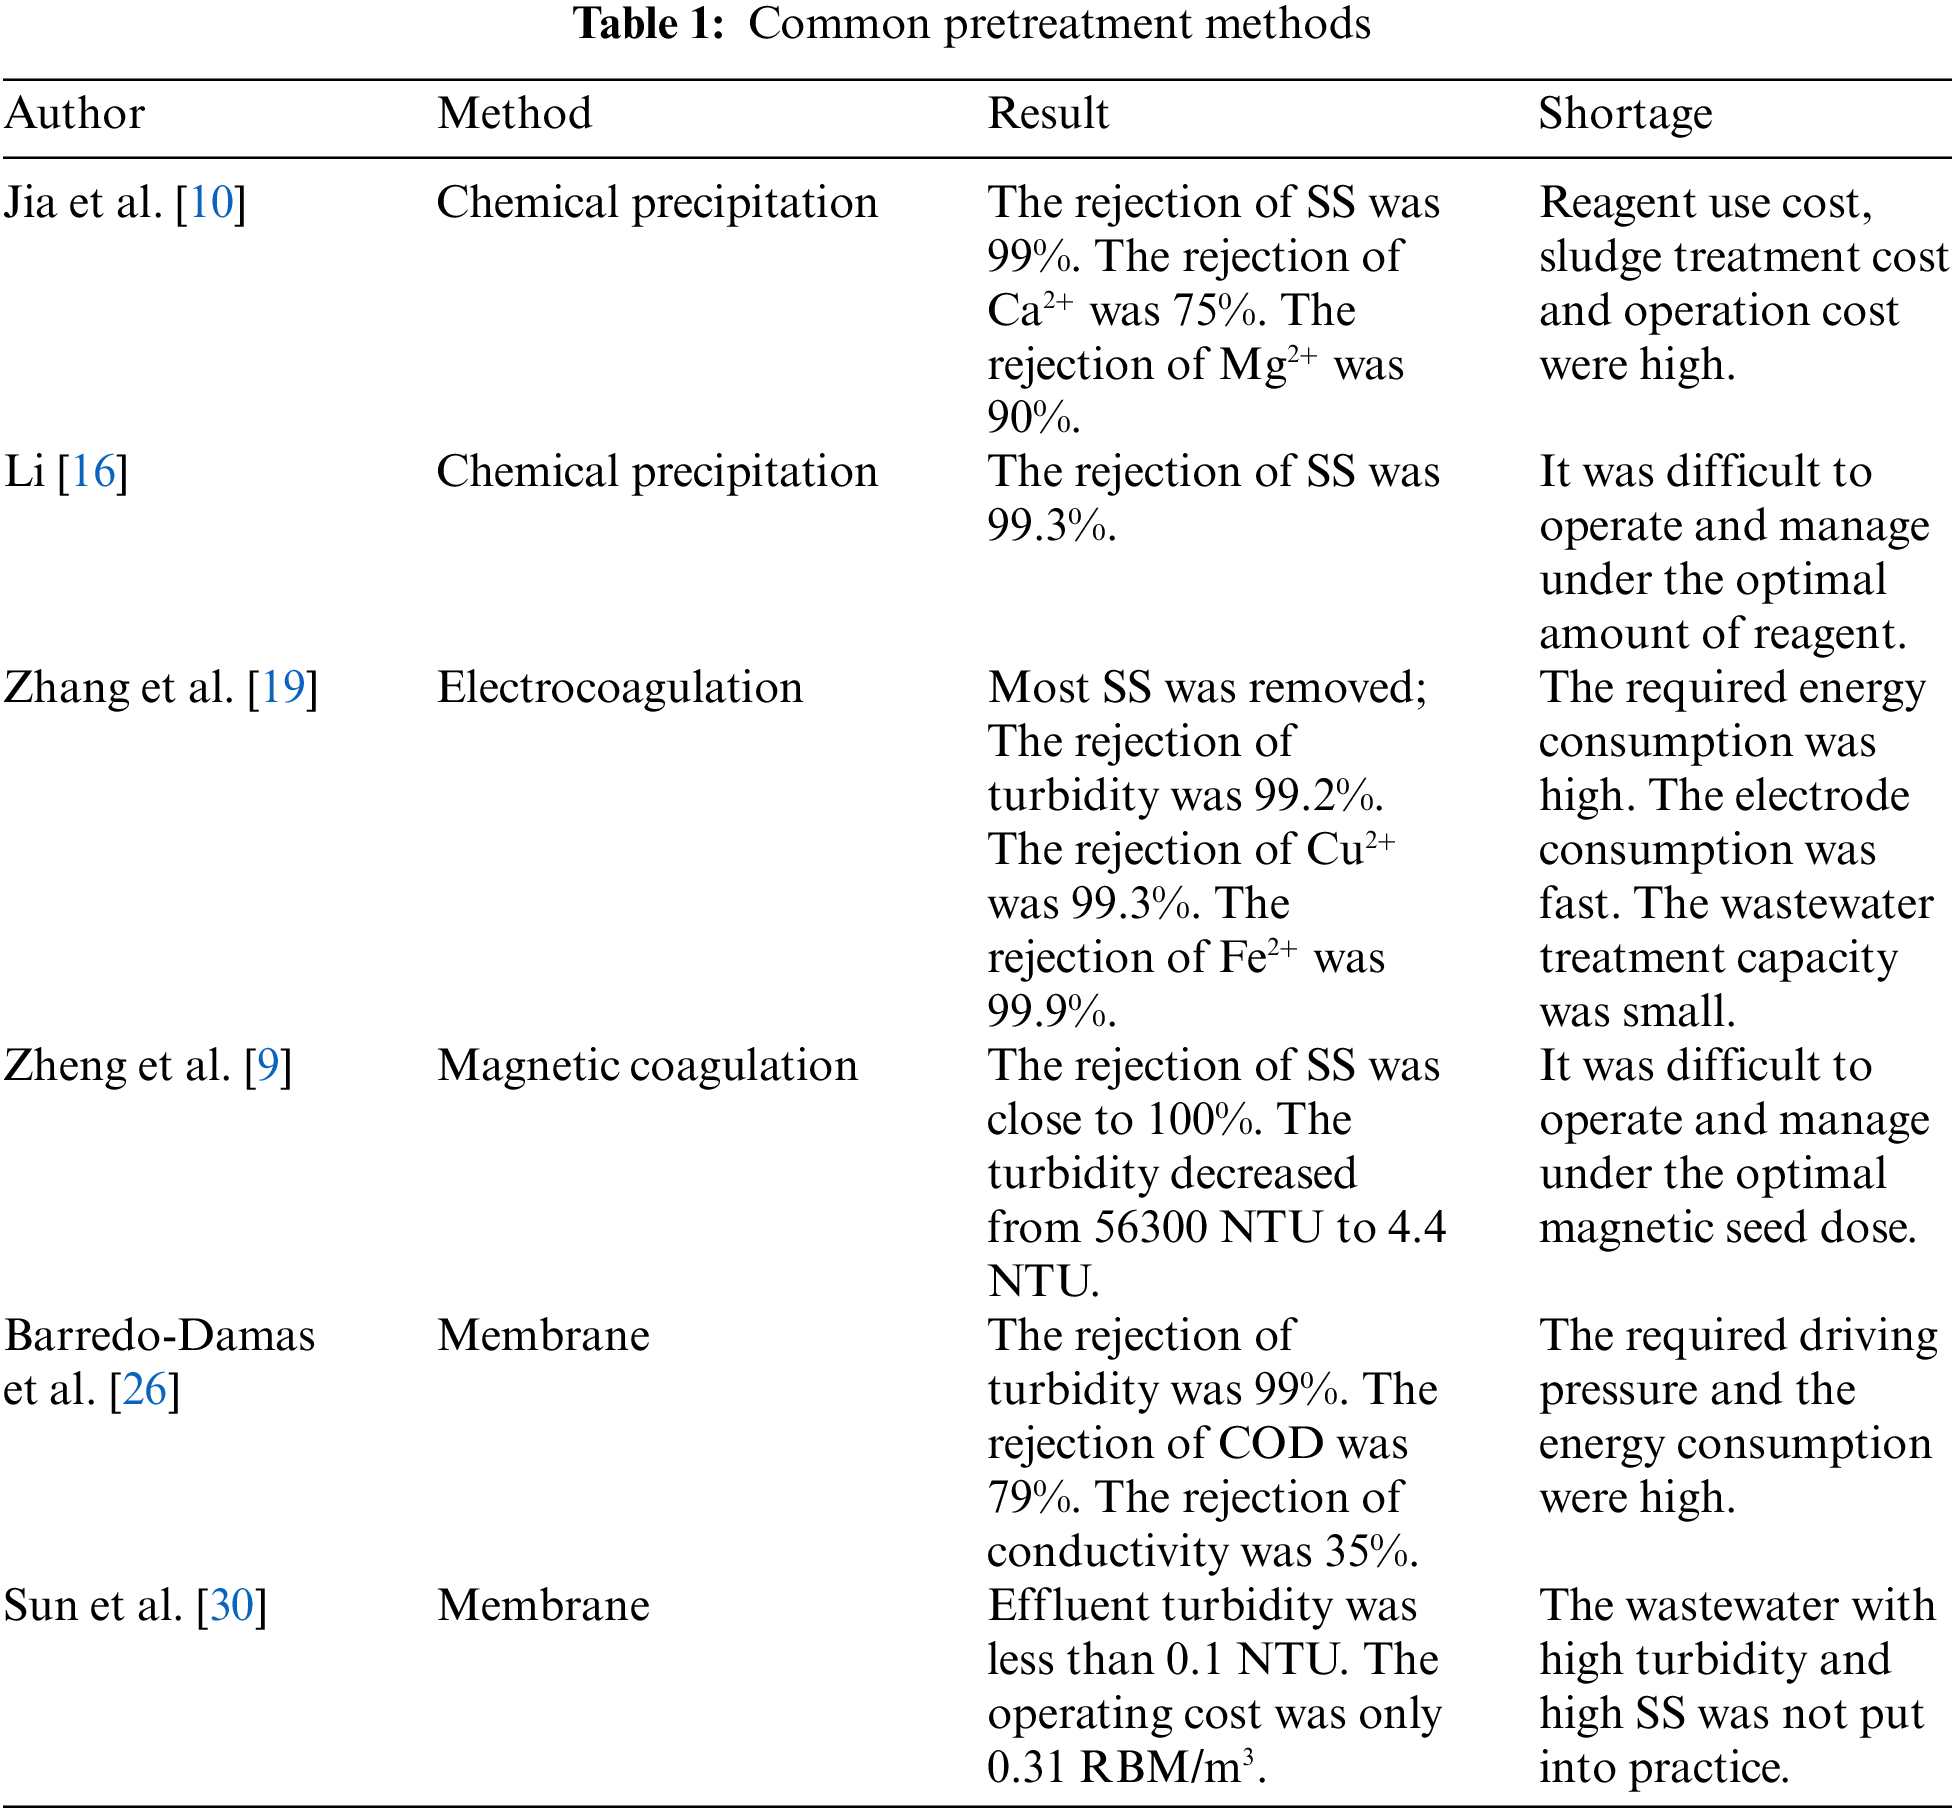
The pretreatment methods of FGD wastewater include chemical precipitation, electrocoagulation and magnetic coagulation [15]. At present, chemical precipitation is the most commonly used method in the pretreatment of industrial wastewater. By adding chemical reagents and coagulants to wastewater, metal ions and SS in wastewater can be removed. Jia et al. [10] added calcium hydroxide, sodium sulfate polyaluminium ferric sulfate, and polyaluminium chloride for chemical softening. After treatment, the SS and reaction precipitate in the wastewater form flocculating precipitation. At the same time, the removal rate of Ca2+ and Mg2+ were more than 75% and 90%. Li et al. [16] used polyaluminium ferric sulfate as coagulant and polyacrylamide as a coagulant aid to carry out chemical sedimentation test on SS in FGD wastewater. Under the condition of optimal dosage, the removal rate of SS in FGD wastewater can amount to 99%. Although chemical precipitation pretreatment is easy to reduce the SS in FGD wastewater, it is difficult to manage and operate on the optimal chemical dosage, especially in the face of large changes in the quality of FGD wastewater. And the operation cost is high due to the secondary pollution caused by the consumption of chemicals and a large amount of sludge [17]. Electrocoagulation has been extensively used in electroplating, chemical, pharmaceutical, and other industrial wastewater treatment. Because this method has fast reaction speed, simple operation, small amount of sludge, and no need to add additional chemical agents [18]. Zhang et al. [19] electrolyzed FGD wastewater by using the Fe electrode and optimized the electrolysis time and applied voltage. The experimental results showed that most SS and colloids can be removed, and some heavy metal ions can be precipitated or adsorbed by forming the hydroxide. However, the application of this method in FGD wastewater treatment is limited due to the high energy consumption, fast electrode consumption, high operation cost, less wastewater treatment and other problems [20]. Magnetic coagulation has been proved as an effective upgrade technology for traditional coagulation, which has been applied in wastewater treatment [21]. The magnetic seed promotes the formation of flocs, which has the following advantages: 1) high separation rate; 2) high SS remove efficiency and stability, promote the removal efficiency of dissolved matters; 3) more compacted flocs and chemical sludge reduction [22]. Zheng et al. [9] pretreated FGD wastewater with polyaluminium chloride, polyacrylamide and hydrated lime as coagulant, flocculant and coagulant aid respectively and Fe3O4 as magnetic seed. When 2 g/L magnetic seed was utilized, the turbidity of the supernatant was close to 4.4 g/L, and the SS removal rate was as high as 100%. The amount of chemical sludge was halved, and the settling time of flocs was reduced from 30 min to 3 min. At the same time, the researchers found that when the magnetic seed content continues to rise, the turbidity in the supernatant will increase. Because too much magnetic seed ion collision will lead to the breaking of the flocs during the mixing process [23]. Therefore, in the practical application of treating FGD wastewater with a large variety of water quality, it is difficult to manage and operate under the optimal magnetic seed content. At the same time, compared with other pretreatment methods, the cost increases due to the increase of magnetic seed feeding cost and magnetic seed reuse cost. Therefore, magnetic coagulation technology has not been widely used on a large scale. To sum up, the pretreatment method of FGD wastewater at this stage is difficult to meet higher and more stringent environmental standards, and it is also difficult to achieve economic feasibility.
In recent decades, membrane separation technology has become a promising pretreatment and separation technology because of its advantages of stable effluent, small floor area, and no need to add chemicals [24]. Membrane and other nanoporous materials are considered as the key technologies to solve the global water shortage problem [25]. In the past few decades, polymer-based membranes have played a leading role in wastewater treatment and desalination. However, with the development of technology, ceramic membranes have attracted worldwide attention due to their advantages of high flux, high thermal stability, high mechanical stability, and narrow pore size distribution [26,27]. And ceramic membrane have been applied to wastewater treatment with excellent results. According to the different combinations of membrane modules and feed solutions to be separated, the filtration process can be divided into cross-flow filtration and submerged filtration. Barredo-Damas et al. [26] used the ultrafiltration ceramic membrane with the molecular weight cut of 30 kDa for cross-flow treatment of textile wastewater. The rejection of COD, conductivity and turbidity reached 79%, 35% and 99% respectively. However, because the circulating pump provides a higher feed liquid flow rate, the energy consumption of the circulating pump is higher [28]. And the high shear force of the circulating pump with high-speed rotation will make the particle size smaller, which is not conducive to the control of membrane pollution. Therefore, in recent years, people have gradually turned their attention to the submerged filtration. Because the submerged filtration does not need to set up a circulating pump and has low driving pressure, this process is gradually applied to the water treatment industry [29]. Sun et al. [30] treated the Yangtze River water on a pilot scale and optimized the operation conditions (aeration rate and backwashing). Under the optimum operating parameters, the turbidity of the effluent was lower than 0.1 NTU, and no bacteria and Escherichia coli were detected in the permeate. In addition, the average operating cost of submerged ultrafiltration was only 0.31 RMB/m3.
To show the commonly used pretreatment methods more conveniently, this paper summarizes the above research status in Table 1. Through this table, we can find that the existing pretreatment technologies generally have the problems of high operation cost, small processing capacity, and poor flexibility. Therefore, membrane pretreatment provides a new idea for the treatment of FGD wastewater. However, cross-flow filtration still has the problem of high energy consumption. On the contrary, the submerged membrane method has low energy consumption, low operation cost, and high flexibility. Therefore, through this table, we can more clearly highlight the advantages of submerged membrane pretreatment.
At present, ceramic membranes have been successfully used in the desalination process, chemical, metal, textile, food, and beverage industries. In the present work, an experimental platform for the treatment of FGD wastewater by submerged ultrafiltration was built. The effects of membrane permeate flux, filtration/backwashing time combination and aeration rate on membrane performance were analyzed to improve the effluent quality, meet the water quality requirements of subsequent processes, reduce membrane pollution, and ensure long-term continuous operation. The research results can provide an insight into the application of ceramic membrane in the pretreatment of FGD wastewater.
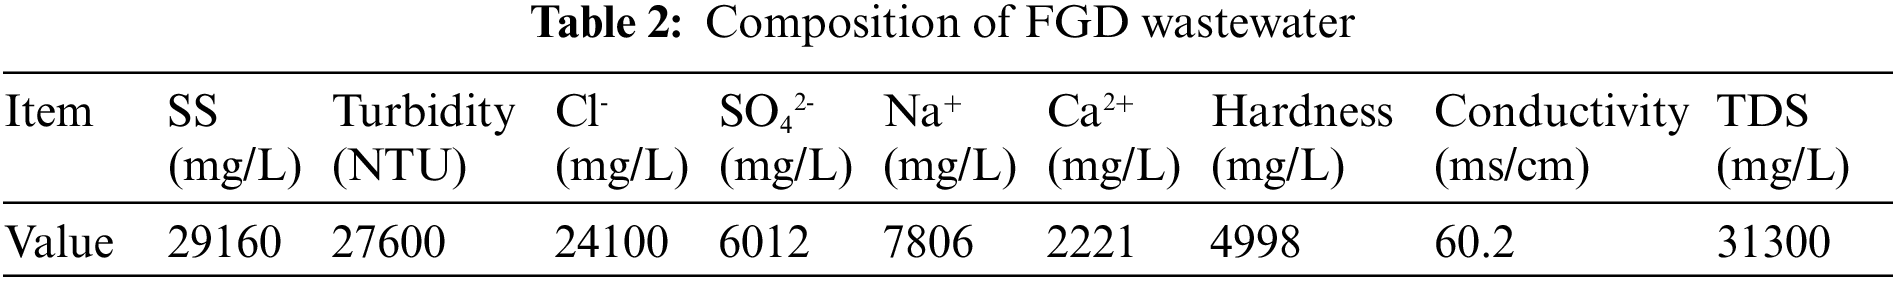
The FGD wastewater of a 330 MW thermal power plant in Hebei was collected. The power plant adopts the wet limestone-gypsum desulfurization process to purify the flue gas. The power plant adopts the traditional chemical precipitation, coagulation, precipitation integrated technology to treat FGD wastewater. However, because the SS and conductivity of the power plant are very high and vary greatly, the process performs poorly. The FGD wastewater treatment system of the power plant is facing great challenges, such as poor performance, high dosage of chemicals, frequent blockage and so on. Therefore, with the increasingly strict sewage discharge standards, the power plant must adopt an advanced FGD wastewater treatment process. The water quality parameters are shown in Table 2.
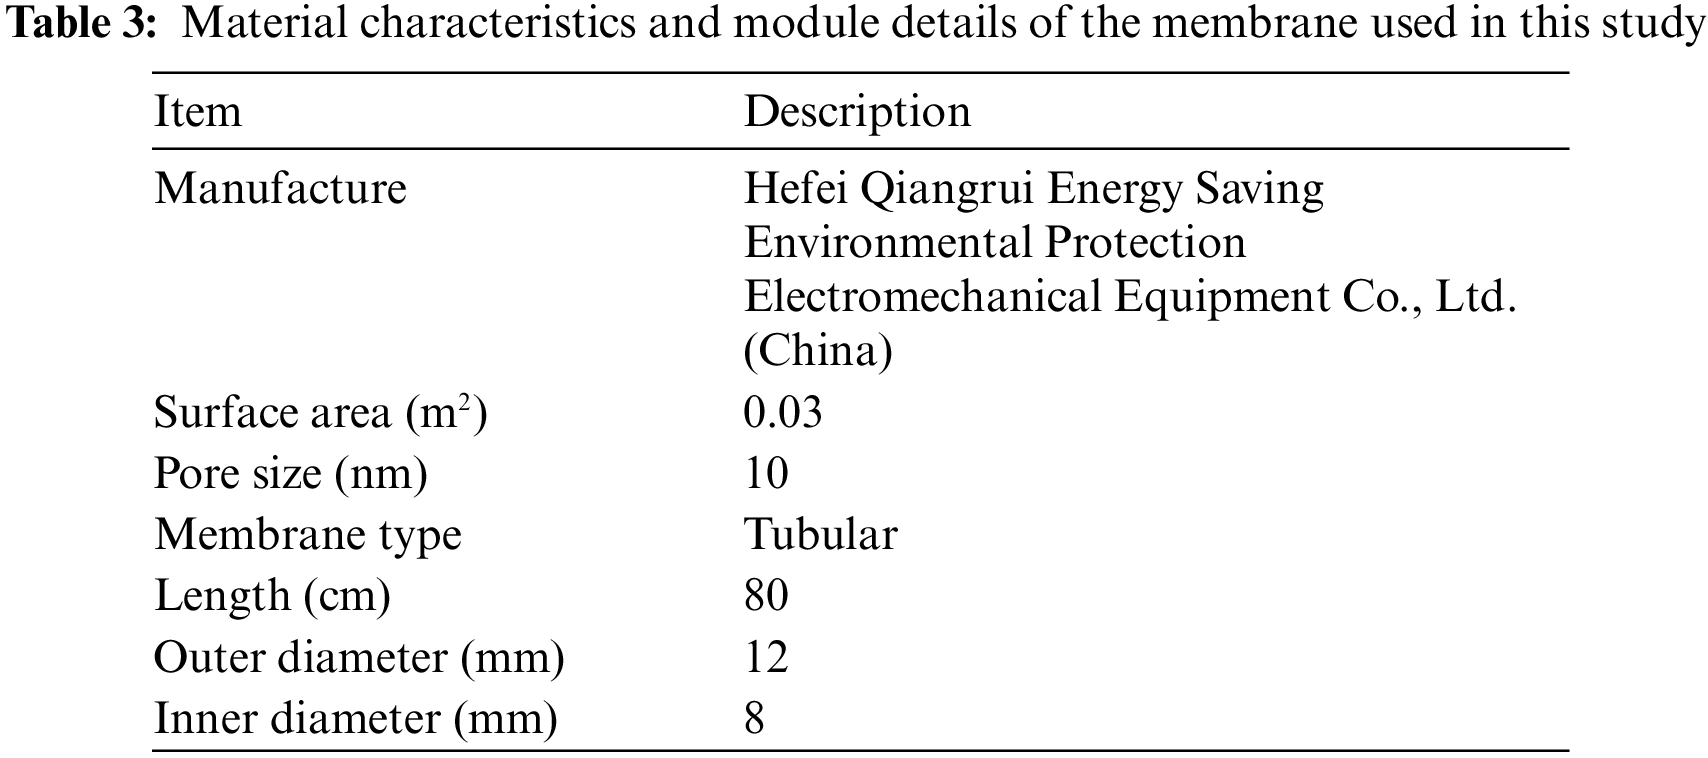
The membrane module was composed of five commercial ceramic membrane tubes. The specifications of this ceramic membrane are given in Table 3. The main reasons for choosing this ceramic membrane are as follows: 1) Compared with fiber membrane, the ceramic membrane has high mechanical strength and good chemical stability. As we all know, FGD wastewater is weakly acidic and has high solid content, which is easy to cause corrosion and wear to fiber membrane. However, the ceramic membrane can avoid these problems. 2) Compared with other brands of ceramic membrane. This ceramic membrane has higher mechanical strength. At the same time, compared with the ceramic membrane with the same pore size, this model has a lower price and higher cost performance.
2.3 Experimental System of Submerged Filtration Device
Figs. 1 and 2 respectively show the schematic diagram and actual experimental setup of the submerged ultrafiltration experimental device. The device was mainly composed of the ceramic ultrafiltration membrane module, blower, diaphragm pump, pressure vacuum gauge, electric valve, raw material tank, permeate water tank, etc. The whole system operation was controlled by PLC. The FGD wastewater was injected into the raw material tank which working volume was 100 L in advance. The membrane module was submerged in the raw material tank, and the negative pressure was generated in the ceramic membrane tube under the action of the diaphragm pump. At the bottom of the membrane module, a distribution pipe for aeration was presented to remove the contaminants deposited on the membrane surface. After each filtration cycle, the permeate was extracted for backwashing. The permeate was sampled after six hours, and the rest of the permeate was returned to the raw material tank to ensure the approximately constant liquid level and feeding conditions. In Fig. 1, the red line represented the pipeline flowing through in the filtration process, the green line represented the pipeline flowing through the gas provided by the air pump, and the black line represented the pipeline flowing through in the backwashing process.
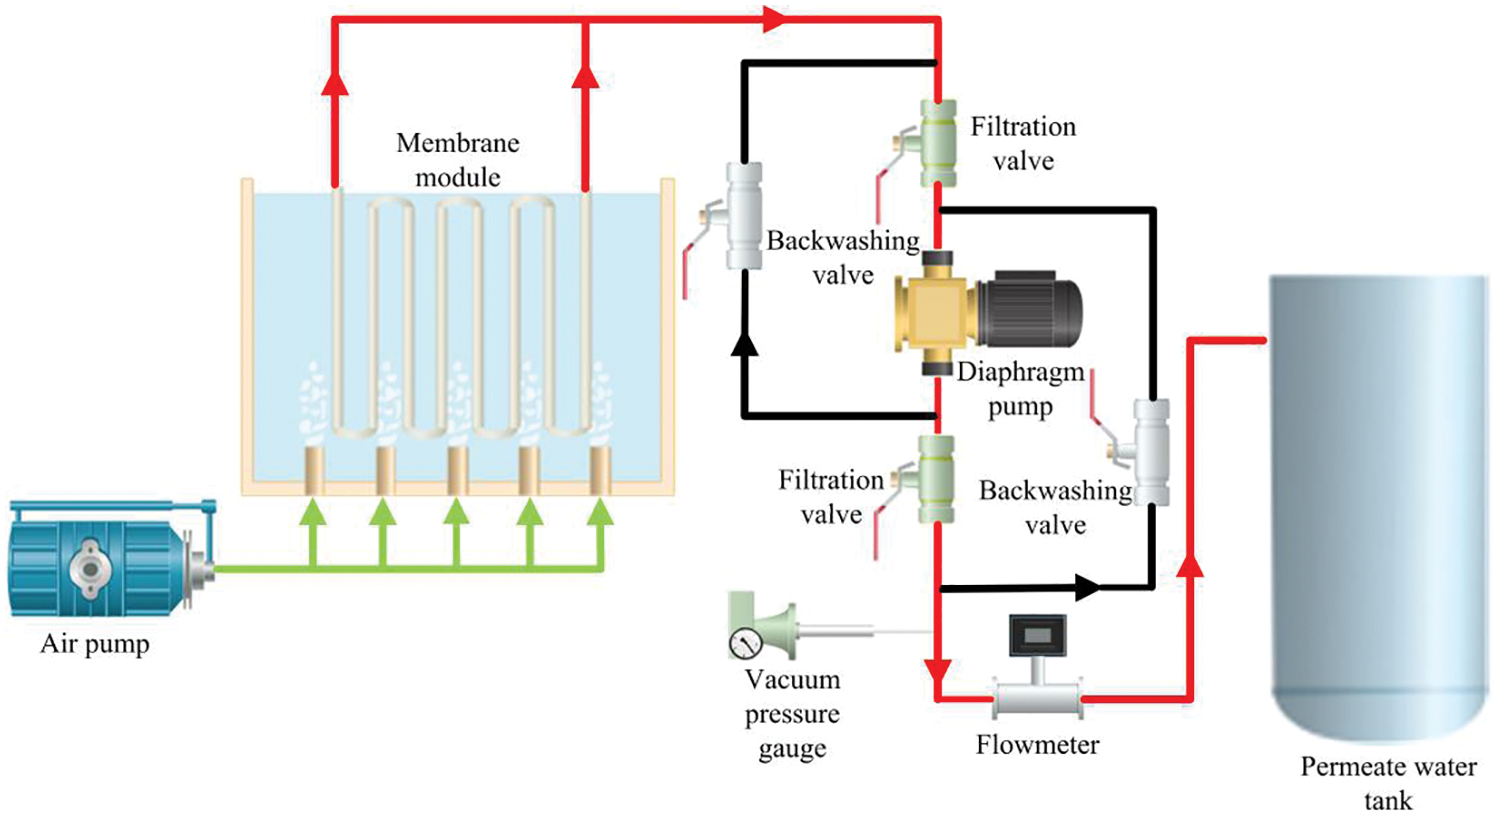
Figure 1: Schematic diagram of submerged ultrafiltration device
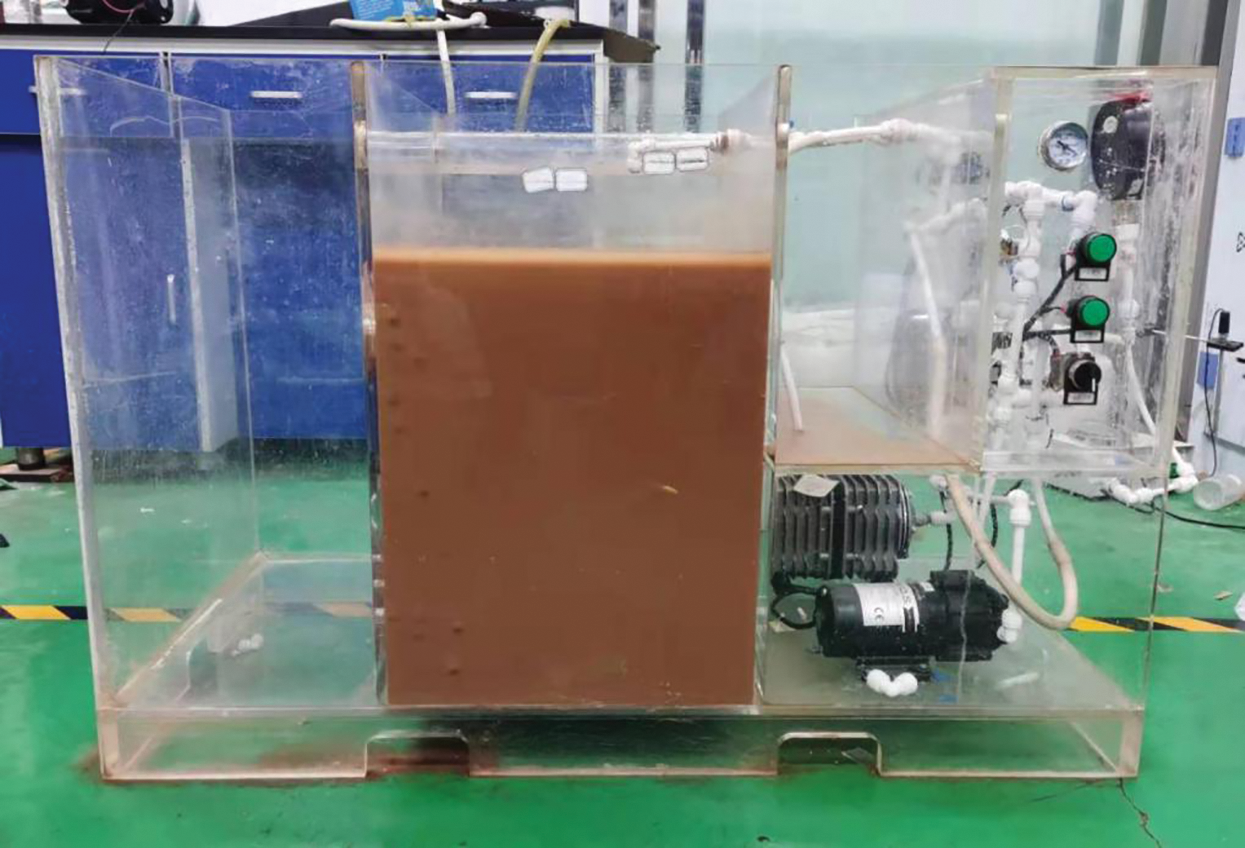
Figure 2: Actual experimental setup of submerged ultrafiltration device
Combined with the actual application of ultrafiltration in China and the previous research status, the effect of different membrane permeate fluxes (55, 70, 85, 100 L/(m2·h)) and filtration/backwashing time combinations (10 min/10 s, 15 min/20 s, 15 min/30 s) on membrane pollution and effluent quality were evaluated under the conditions of constant aeration rate of 20 m3/(m2·h) (based on the bottom area of the raw material tank) and the constant backwashing flux of 125 L/(m2·h). After that, the effects of aeration rates (10, 20, 30 m3/(m2·h)) on membrane performance were studied under the conditions of membrane permeate flux of 70 L/(m2·h), backwashing flux of 125 L/(m2·h), and filtration/backwashing time combination of 15 min/30 s. The permeate flux and TMP were continuously recorded by a flowmeter and pressure vacuum gauge every 30 min to describe the growing trend of membrane fouling.
SS, turbidity and SO42− concentration were measured by multi-parameter water quality detector (HT-400, Haiteer, China). Hardness and Cl− concentration were measured by multi parameter water quality analyzer (HT-300, Haiteer, China). Na+ concentration was measured by a microcomputer type sodium ion meter (PXS-Na, Haiteer, China). Ca2+ concentration was measured by micro-calcium meter (PXS-Ca, Haiteer, China). Conductivity and TDS were measured by conductivity meter (DDSJ-318, Haiteer, China).
The filtration performance was evaluated using the parameters of membrane permeate flux (
where
where
where
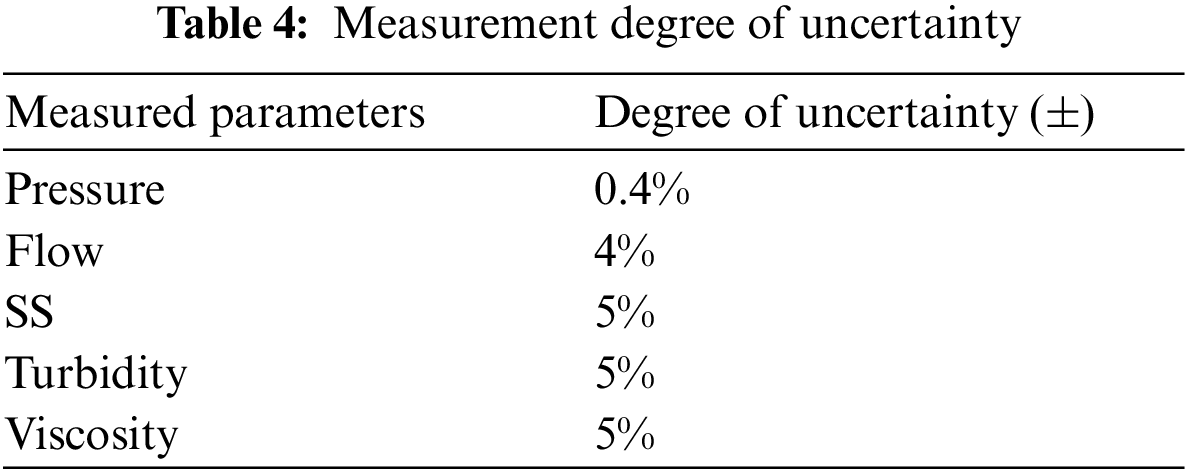
Although we had conducted repeated experiments under the same working conditions, there were still uncertainties caused by some inevitable factors, such as some instrument errors and measurement accuracy problems. Table 4 listed some possible uncertainties. These uncertainties accounted for a small proportion compared with the whole experiment, so these uncertainties could be ignored in the case of our accurate measurement and careful experiment.
The permeability of the membrane is affected by the resistance of water flow, which is opposite to mass transfer. The resistance reflects the blocking state of the membrane. It can be measured by the permeate flux of the membrane and the viscosity of the wastewater, and calculated according to Darcy's law [31].
Resistance-in-series models [32] of membrane fouling often subdivide the total membrane resistance (
The protocol to measure resistance analysis data were as follows:
1. The pure water was filtered using a clean ceramic membrane and the stable TMP (
2. Under the same conditions, the FGD wastewater was filtered using a clean ceramic membrane, and the stable TMP (
3. The ceramic membrane after filtering the FGD wastewater was directly put into the pure water, then the stable TMP (
4. After backwashing the used ceramic membrane, rinse the residual impurities on the membrane surface with pure water. Finally, under the same conditions, the pure water was filtered by the ceramic membrane and the stable TMP (
The relation of various resistance components were illustrated in Eqs. (4)–(8).
where
After each test, the ceramic membrane used in the test was cleaned to remove irreversible fouling and restore membrane permeability. Membrane cleaning procedures include tap water washing and ultrasonic cleaning. Tap water was used to wash for 5 min to remove the cake layer on the membrane surface, and then the membrane module was submerged in the ultrasonic bath of the high-power generator of 15 min to remove the irreversible dirt in the pores. Before each ultrafiltration experiment, a pure water experiment was carried out to evaluate the membrane permeability. The experimental results showed that the above cleaning can restore the membrane permeate flux well.
3.1 Effect of Membrane Permeate Flux
Fig. 3 shows the effects of different membrane permeate fluxes (55, 70, 85, 100 L/(m2·h)) and different filtration/backwashing time combinations (10 min/10 s, 15 min/20 s, 15 min/30 s) on filtration performance, under the condition of constant aeration rate of 20 m3/(m2·h) and constant backwashing flux of 125 L/(m2·h).
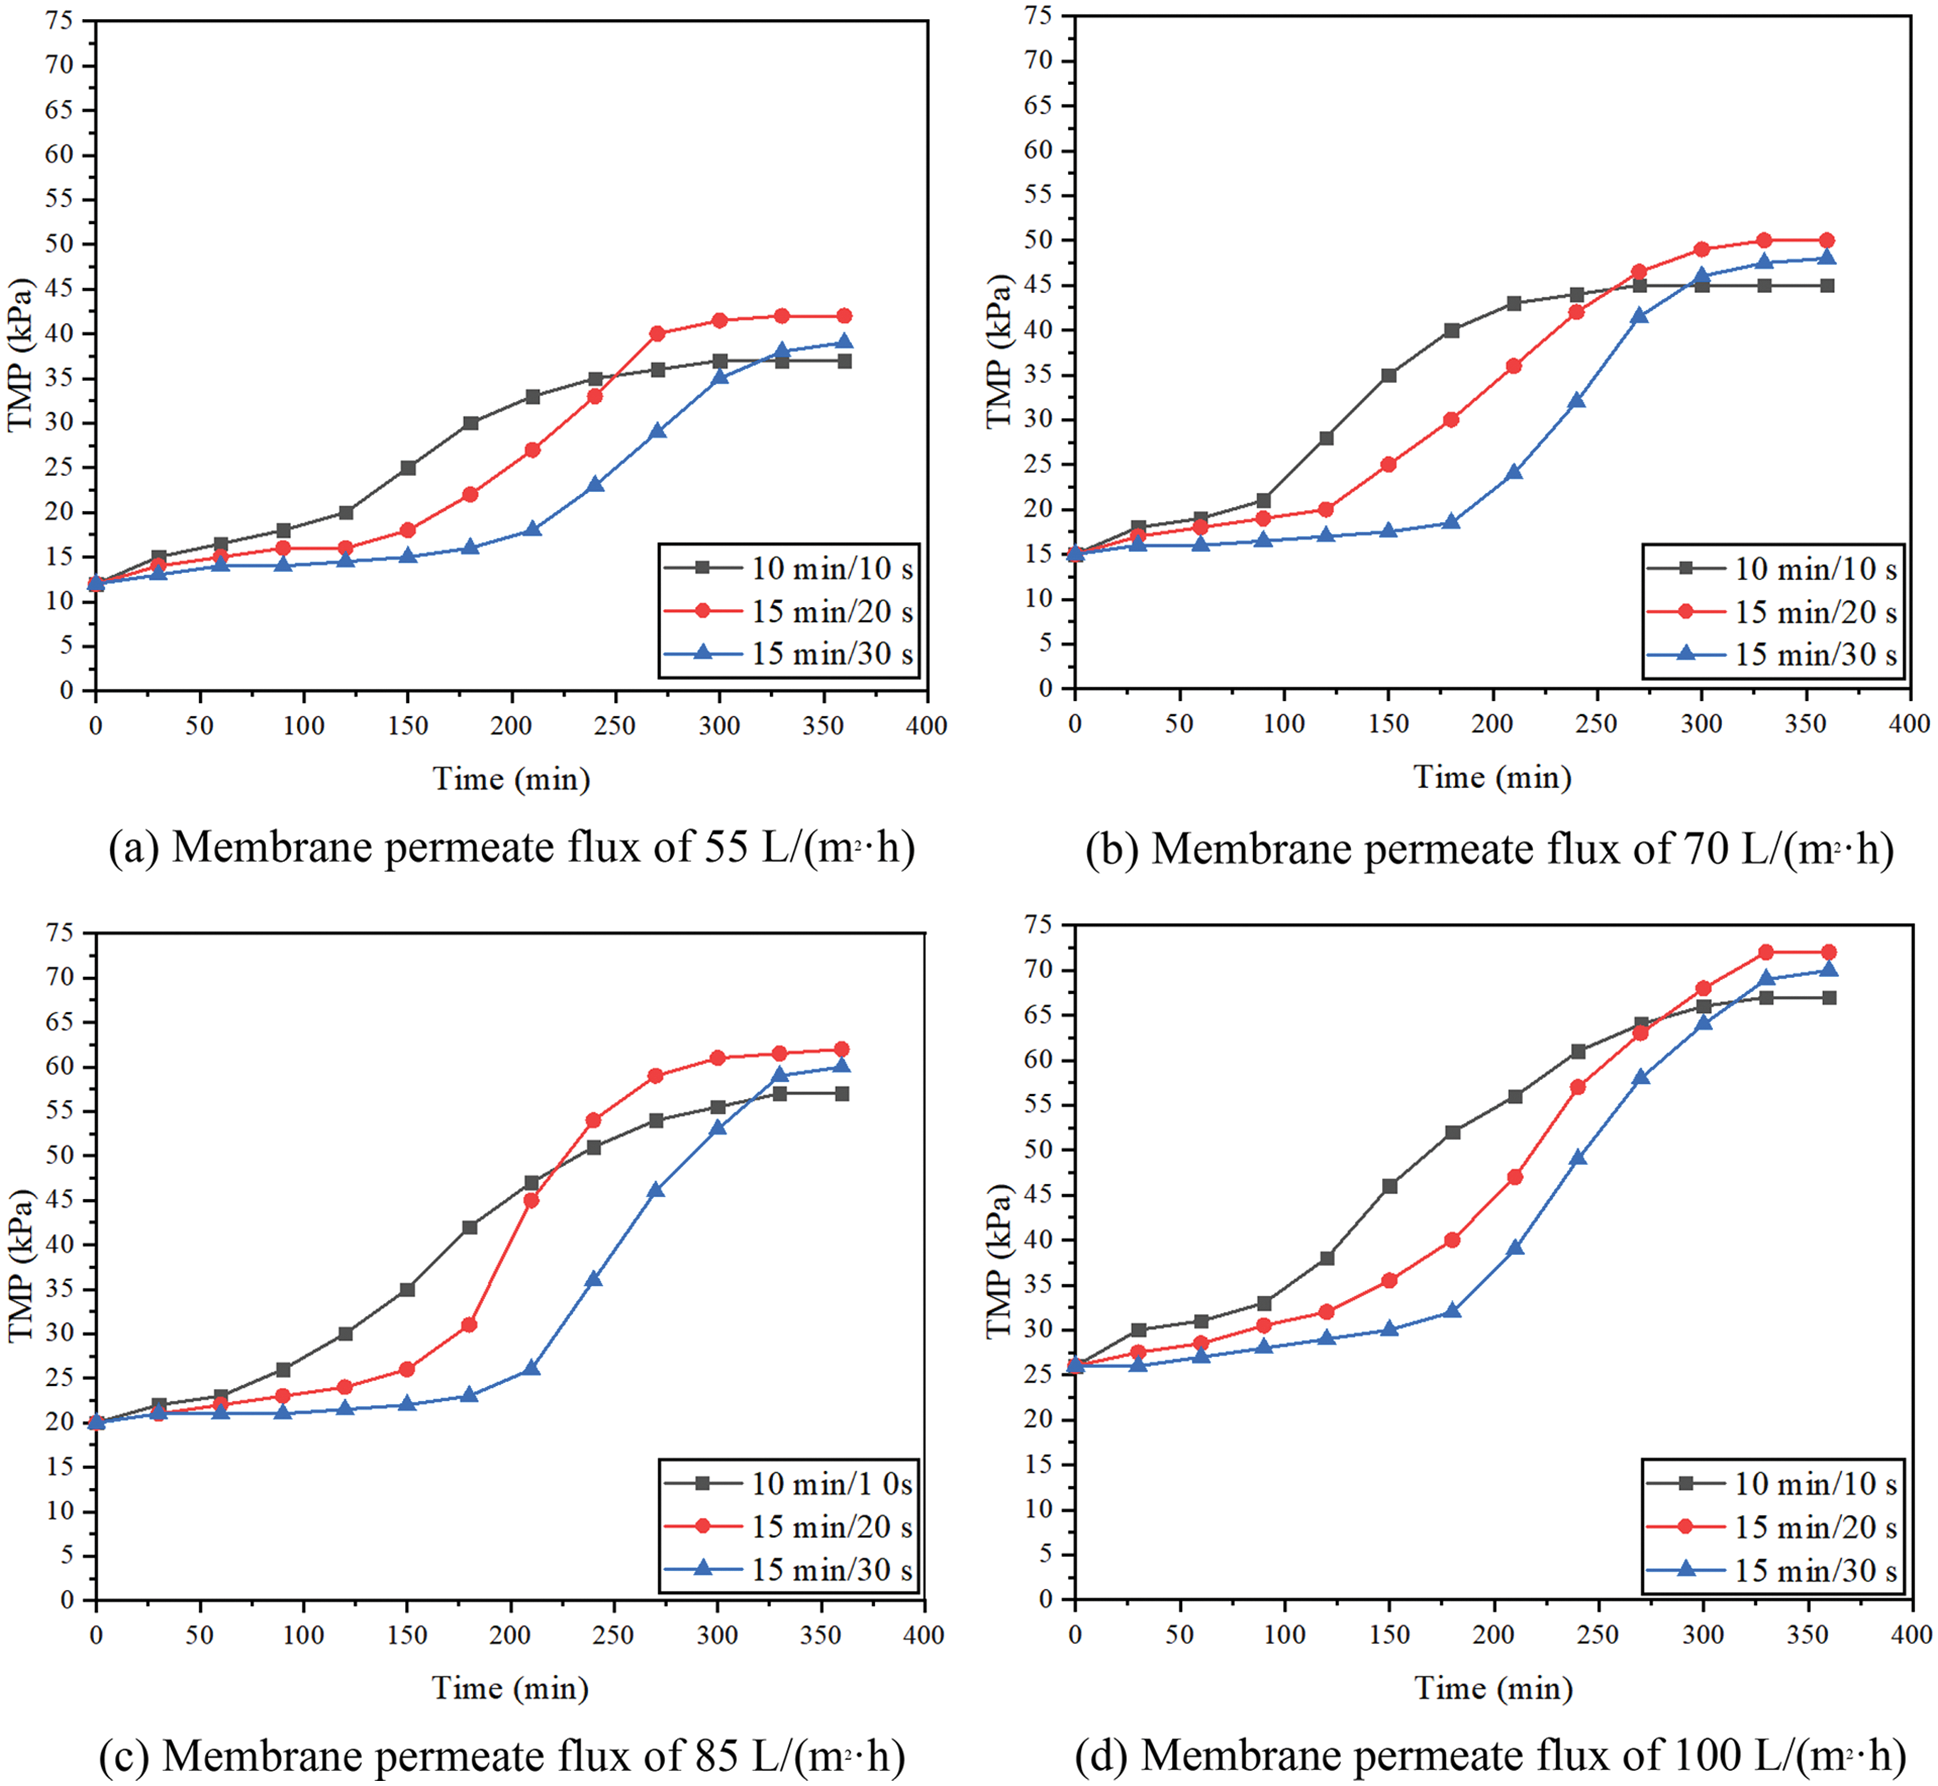
Figure 3: TMP varies with time (filtration/backwashing time combinations are 10 min/10 s, 15 min/20 s and 15 min/30 s, aeration rate is 20 m3/(m2·h), and backwashing flux is 125 L/(m2·h))
For different membrane permeate fluxes, the change of TMP has the same trend, that is, TMP increases slowly at first, then increases sharply, and finally, the growth rate slows down and tends to be stable. At the initial stage of filtration, macromolecular organic matter is deposited on the surface of the membrane to form a uniform gel layer. A part of the membrane hole is covered by the gel layer, showing a slight increase in TMP at the macro level. With the filtration process, large particles of pollutants in FGD wastewater, such as SS, are easily accumulated on the outer surface of the gel layer. The aggregated contaminants form the cake layer, which shows a substantial increase in TMP at the macro level. However, with the extension of the operation time, the system enters the sub-stable period. Due to the effect of aeration and backwashing, the convection and reverse transport of particles of the membrane surface reach a balance. Therefore the accumulation of pollutants on the membrane surface gradually tends to dynamic balance, which shows that the growth rate of TMP slows down. Similar trends were reported elsewhere in the treatment of domestic wastewater by submerged microfiltration [33]. Scanning electron microscopy (SEM) revealed that two layers of sediment were found on the surface of the membrane. The outer surface of the membrane was a uniform gel layer, and a thick layer of cake layer was uniformly wrapped outside the gel layer.
For the same permeate flux, different filtration/backwashing time combinations have an obvious effect on the change of TMP. For example, according to Fig. 3b, when the time combination changed from 10 min/10 s to 15 min/20 s, then to 15 min/30 s, the initial duration of low TMP changed from 1 h to 2 h, then to 3 h. This indicates that at the initial stage of filtration, membrane fouling is less compressible, resulting in a loose cake layer. Therefore, increasing the backwashing time can effectively remove the cake layer on the surface of the membrane and alleviate membrane fouling. However, with the progress of filtration, the pollutants are gradually compacted, and the backwashing effect becomes worse.
By comparing Figs. 3a–3d, it can be found that with the increase of permeate flux, the stable TMP increases. For example, when the filtration/backwashing time combination was 15 min/30 s, the permeate flux changed from 55 L/(m2·h) to 100 L/(m2·h), and the stable TMP changed from 39 kPa to 70 kPa. This is because in the case of lower permeate flux, the cake layer produced by the system is thinner and the degree of compression is smaller, so the membrane fouling is lighter. With the increase in membrane permeate flux, the migration and deposition speed of particulate matter and organic matter to the membrane surface is higher. In addition, the concentration polarization becomes larger, which promotes the rapid formation and accumulation of membrane fouling. Therefore, it is necessary to select a suitable permeate flux. This not only helps to reduce the difficulty of removing the compacted cake layer by hydraulic cleaning, but also helps to reduce the energy consumption of the diaphragm pump.
3.1.1 Evaluation of the Fouling Rate
Fig. 4 shows the effect of membrane permeate fluxes on membrane fouling under constant permeate flux operation. In the submerged filtration mode, the deposition rate of particles and organic matter on the membrane surface will increase with the increase of membrane permeate flux. For example, when the permeate flux changed from 55 L/(m2·h) to 100 L/(m2·h) and the filtration/backwashing time combination was 15 min/30 s, the fouling rate changed from 4.5 kPa/h to 7.3 kPa/h. The result shows that the fouling rate of particles of the membrane surface may depend on the permeate flux used in the filtration process. The change of fouling rate of different membrane permeate fluxes may be due to the formation of the different cake layer structures. When the membrane permeate flux is low, the required TMP is small, which has a great influence on the thickness of the cake layer. Resulting in the formation of a thicker cake layer, but has little influence on the increase of the cake layer density. But under the condition of higher membrane permeate flux, the required TMP is larger, so not only a thicker cake layer will be formed, but also a dense cake layer will be formed [34]. The trends of fouling rate are similar with Sergio et al. [35]. In the study of this article, the fouling rate was directly proportional to the permeate flux applied in the filtration process. And this ratio was related to the compression degree of the cake sediment at high permeate flux. The higher the permeate flux was, the smaller the porosity of the cake layer was, which led to a higher fouling rate.
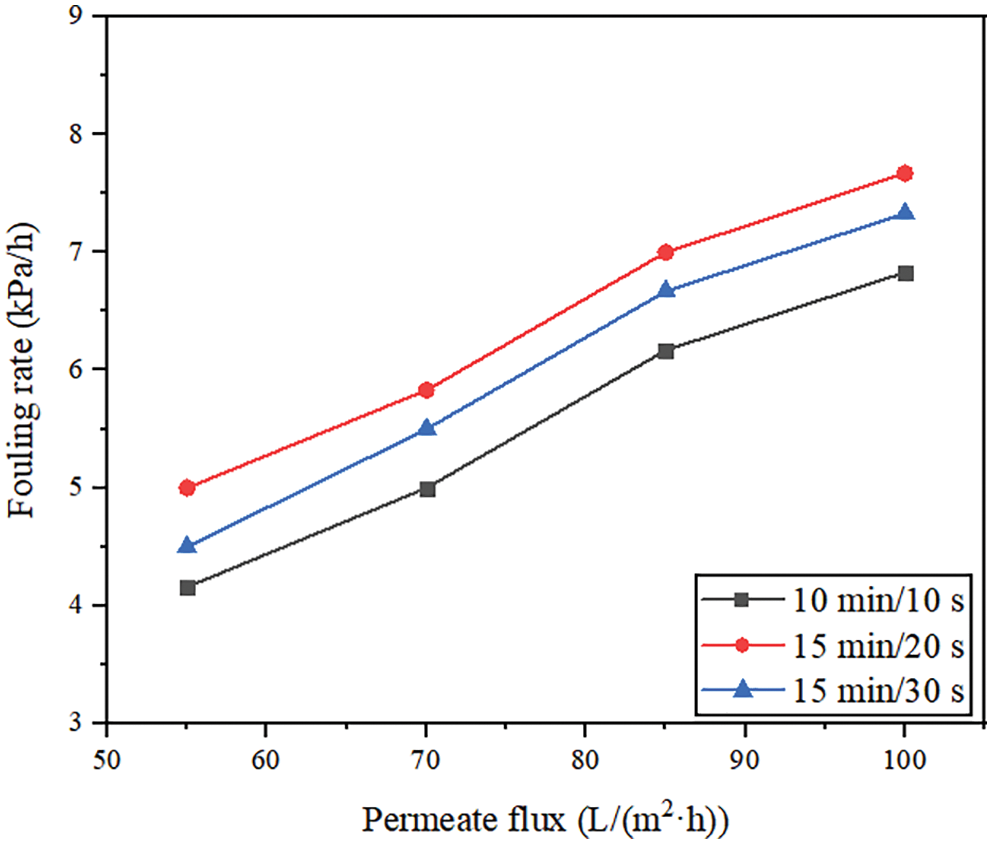
Figure 4: Effect of membrane permeate flux on fouling rate
Fig. 4 also shows that different filtration/backwashing time combinations can affect the degree of membrane fouling. For the same membrane permeate flux, such as 70 L/(m2·h), the fouling rates corresponding to different time combinations (10 min/10 s, 15 min/20 s, 15 min/30 s) were 5, 5.8, 5.5 kPa/h, respectively. Although the backwashing time of 15 min/20 s was longer than that of 10 min/10 s, the final fouling rate was faster. It may be due to the formation of a more dense cake layer on the membrane surface with the increase of filtration time. However, the reversibility of the pollution of the dense cake layer is poor, and it is not easy to remove it by hydraulic cleaning. Therefore, although the backwashing time is increased, the final fouling rate increases.
The effects of aeration rates (10, 20, 30 m3/(m2·h)) on membrane performance were studied under the conditions of membrane permeate flux of 70 L/(m2·h), backwashing flux of 125 L/(m2·h), and filtration/backwashing time combination of 15 min/30 s.
The Fig. 5 shows that the stable TMP is 58 kPa at the minimum aeration rate, which is increased by 13 kPa compared with the stable TMP of 45 kPa at the maximum aeration rate. It can be seen that a larger aeration rate can produce more bubbles with a higher flow rate, enhance the scouring ability of the cake layer, and effectively reduce membrane pollution. However, for the experiments with aeration rates of 20 m3/(m2·h) and 30 m3/(m2·h), the effect on the stable TMP was small, and the difference between them was only 3 kPa. This shows that in a certain range of aeration, increasing the aeration rate can enhance the ability to wash away the pollutants on the membrane surface and wash away the looser pollutants on the outermost layer of the cake layer. This slows down the pollution to a certain extent. However, if the aeration rate continues to increase, it is difficult to wash away the denser cake layer after washing away the outermost layer of the cake layer. Therefore, although the aeration rate is increased, there is no significant difference in the stable TMP. In conclusion, in a certain range, increasing the aeration rate can effectively alleviate membrane pollution. However, excessive aeration can not further alleviate membrane pollution, but also increase the energy consumption of the blower. Therefore, considering the effectiveness of aeration rate in membrane pollution control, 20 m3/(m2·h) is the best aeration rate of the system.
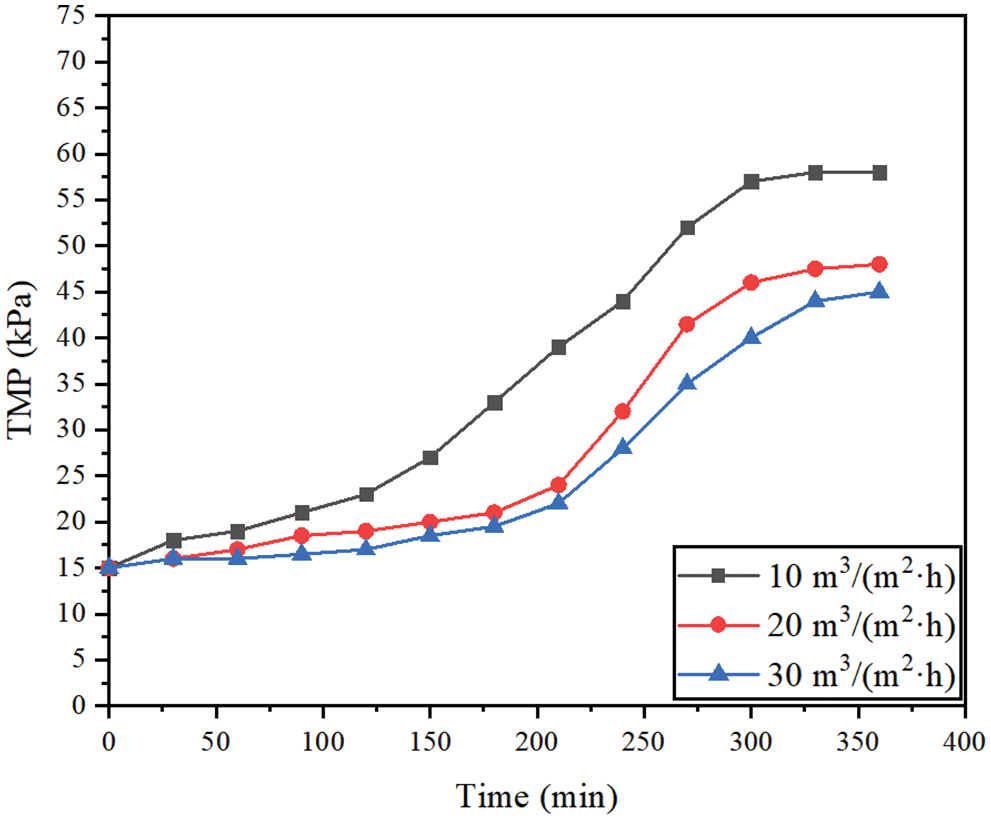
Figure 5: Changes of TMP under different aeration rates
Due to the entrainment of limestone, gypsum and part of silica from the desulfurization tower, the concentration of SS and turbidity in FGD wastewater are very high. After ultrafiltration membrane treatment, no matter what working conditions were adopted, the rejection of SS and turbidity can reach more than 99%.
Fig. 6 shows the effects of different membrane permeate fluxes (55, 70, 85, 100 L/(m2·h)) and different filtration/backwashing time combinations (10 min/10 s, 15 min/20 s, 15 min/30 s) on the concentration change of SS in the permeate under the condition of constant aeration rate of 20 m3/(m2·h) and constant backwashing flux of 125 L/(m2·h).
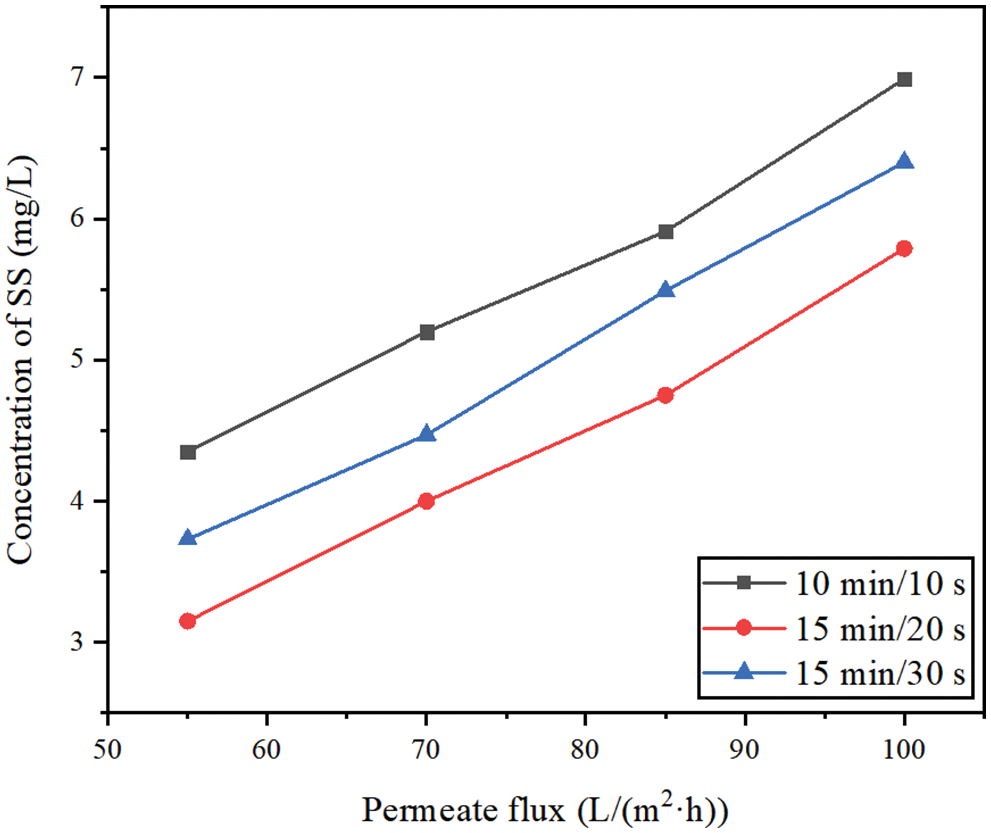
Figure 6: The concentration change of SS in permeate
It can be seen from Fig. 6 that different filtration/backwashing time combinations have a certain impact on the concentration of SS in the permeate. For example, under the working condition of 70 L/(m2·h), the concentration of SS in the permeate changed from 4.00 mg/L to 5.20 mg/L with different filtration/backwashing time combinations. This phenomenon can be explained by the formation of the cake layers with different thicknesses under different filtration/backwashing time combinations. The cake layer acts as a dynamic membrane and barrier, which has the effect of secondary filtration. Therefore, after filtration for 6 h, the larger the stable TMP of the system is, indicating that the cake layer formed on the membrane surface is thicker, which leads to less SS in the permeate.
Fig. 7 shows the effects of different membrane permeate fluxes (55, 70, 85, 100 L/(m2·h)) and different filtration/backwashing time combinations (10 min/10 s, 15 min/20 s, 15 min/30 s) on the concentration change of turbidity in the permeate under the condition of constant aeration rate of 20 m3/(m2·h) and constant backwashing flux of 125 L/(m2·h). It can be seen that the effect of different permeate fluxes on turbidity, that is, increasing the permeate flux will lead to a small decrease in the rejection. For example, for the filtration/backwashing time combination of 15 min/30 s, when the permeate flux increased from 55 L/(m2·h) to 100 L/(m2·h), the turbidity in the permeate increased from 3.7 NTU to 6.0 NTU. This is due to the increase in permeate flux and TMP required for operation, which leads to the increase of convective transport of solute to the membrane surface. Therefore, the number of particles near the membrane surface increases. The concentration polarization is serious and the membrane pollution is intensified. Due to the increase in the number of particles attached to the membrane surface, a higher concentration gradient is generated. The significant increase in the surface concentration can further provide the driving force for the particles to pass through the membrane pore. The driving force will lead to more particles impurities passing through the membrane pore and entering into the permeate, resulting in more turbidity in the permeate.
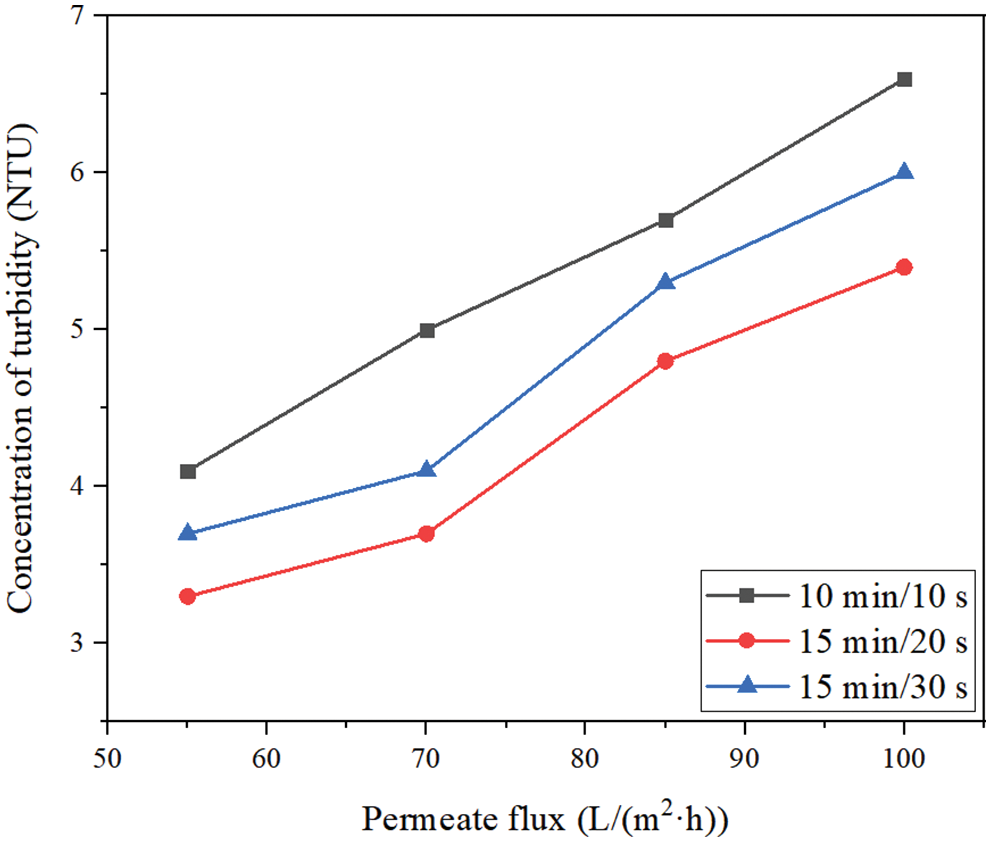
Figure 7: The concentration change of turbidity in permeate
The ion concentration and conductivity of the permeate after 6 h under different permeate fluxes and different filtration/backwashing time combinations are listed in Table 5.
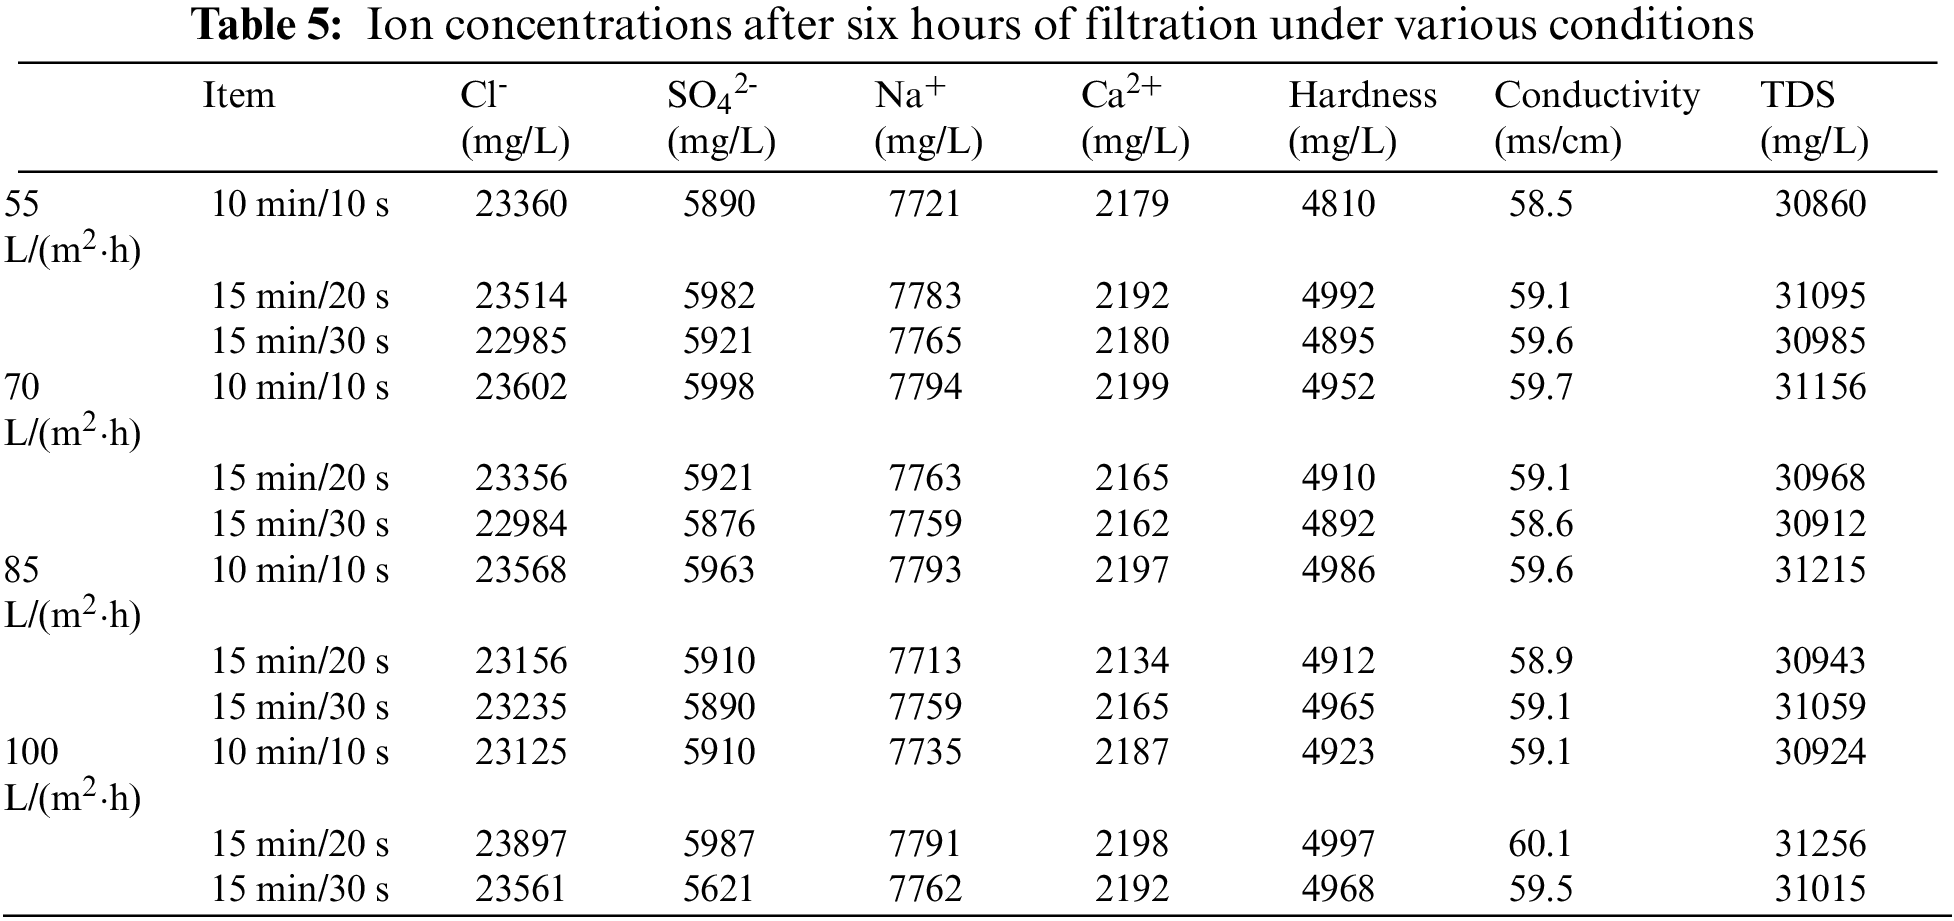
Combined with these data, as expected, the rejection of the system for various ions and conductivity was less than 5% and did not change significantly with time. This is because the membrane pore diameter is larger than the ion radius, and the ion rejection is not controlled by the mechanical rejection effect, so there is no significant change in the ion rejection rate. However, it can be observed that the concentration of ions in the permeate decreases slightly, which may be caused by the weak Donnan Effect between ions and the ceramic membrane surface. The electrostatic repulsive force generated in this way can realize slightly ion rejection [36].
3.4 Resistance Analysis of Membrane Fouling
Table 6 shows the composition of membrane resistance under different permeate fluxes and different filtration/backwashing time combinations.
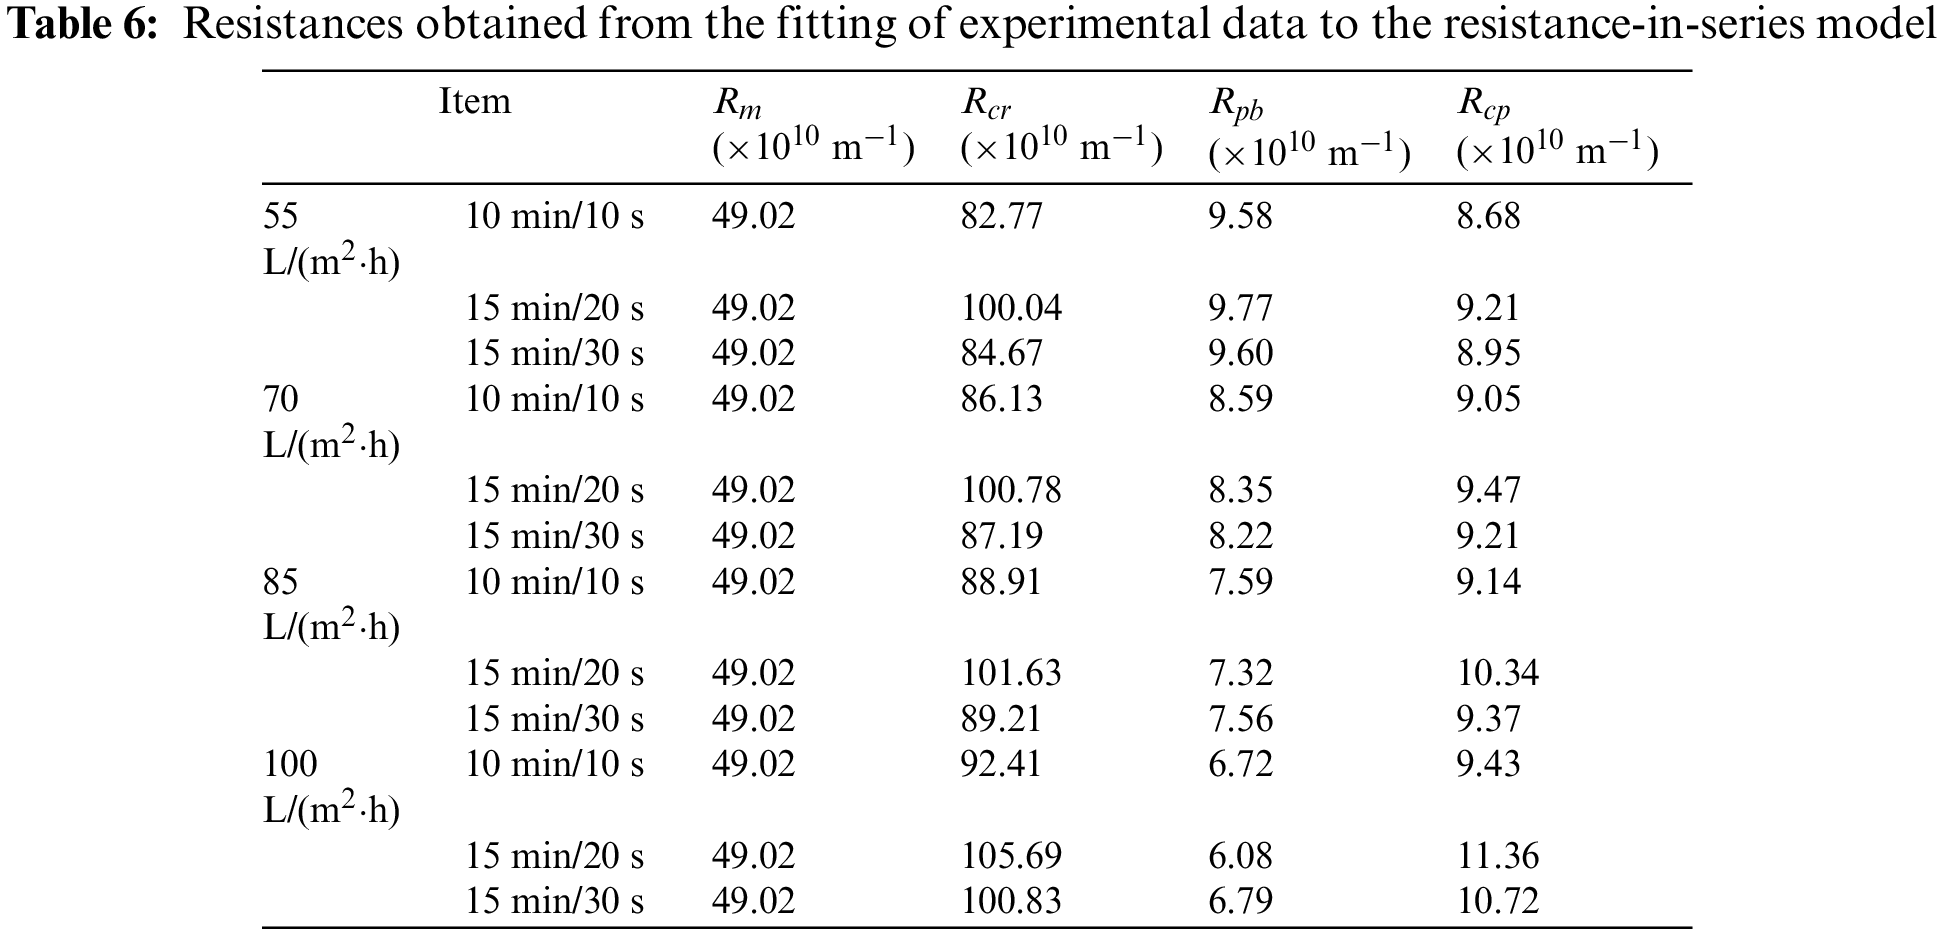
Table 6 shows that
As expected,
It can be found from Table 6 that
3.5 Membrane Cleaning Efficiency
An important problem of membrane application is pollution, so membrane cleaning is an important operation of membrane filtration systems in wastewater treatment. Therefore, we conducted a systematic filtration experiment to study the cleaning efficiency of the selected ceramic membrane. Fig. 8 shows the pure water permeate flux of ceramic membrane measured before and after the filtration experiment. Generally speaking, the pure water permeate flux of the unused membrane was measured first. Then cleaned the used membrane, measured the permeate flux of pure water, and compared the difference between the two. If the permeate flux of pure water of the used membrane can reach more than 90% of that of the unused membrane, it indicates that the membrane cleaning meets the requirements. Fig. 8 shows that the cleaned membrane module can restore its permeability and meet the requirements of reuse.
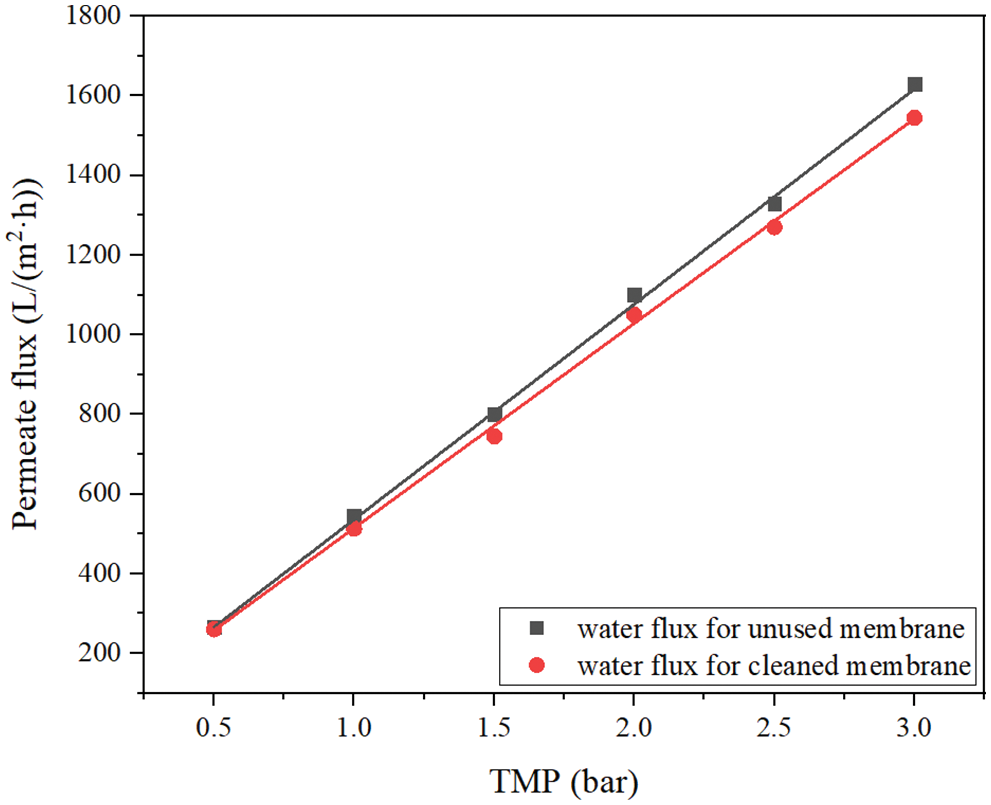
Figure 8: The pure water fluxes of unused and cleaned membrane at different TMP
Membrane technology can solve the problems of high operation cost, small processing capacity and poor flexibility in traditional pretreatment technology. Especially the submerged ultrafiltration technology can further reduce the cost. In the current research, it has not been found that someone directly uses submerged ultrafiltration to pretreat FGD wastewater. Therefore, this paper innovatively put forward the scheme of directly pretreating FGD wastewater with ceramic membrane, so as to reduce the operation cost of traditional pretreatment methods and improve the flexibility of the pretreatment system. Meanwhile, an experimental platform for pretreatment of FGD wastewater by submerged ultrafiltration was built. The experimental study was carried out to improve effluent quality and reduce membrane pollution. The effects of membrane permeate flux, filtration/backwashing time combination and aeration rate on membrane performance were analyzed. The following conclusions were drawn:
1. Membrane permeate flux had a significant effect on membrane fouling. For the same filtration/backwashing time combination, such as 15 min/30 s, when the membrane permeate flux increased from 55 L/(m2·h) to 100 L/(m2·h), the fouling rate increased from 4.5 kPa/h to 7.3 kPa/h. Selecting the appropriate membrane permeation flux can not only keep the filtration process running for a long time, but also reduce the extra power consumption of the pump.
2. Backwashing can effectively remove the cake layer on the membrane. As the backwashing time was changed from 10 s to 30 s, the initial low-pressure operation increased from 1 h to 3 h.
3. When the aeration rate increased from 10 m3/(m2·h) to 30 m3/(m2·h), membrane pollution can be effectively alleviated. However, excessive aeration rate can not further alleviate membrane pollution, but will increase the energy consumption of blower.
4. The ceramic membrane had good separation performance for SS and turbidity, which can reach more than 99% under various working conditions, and the permeate basically met the requirements for turbidity and SS content in the follow-up process.
5. A new experimental procedure was conducted to realize the performance further of the ceramic UF membrane and its fouling mechanisms. The present results showed that
This paper provides a new method for the efficient and low-cost pretreatment of FGD wastewater. In the future, we will continue to study the permeate produced by ceramic membrane ultrafiltration through nanofiltration membrane to remove divalent ions and organics in wastewater, reduce the scaling in the follow-up process of zero liquid discharge of FGD wastewater, and provide guidance for the engineering application of ceramic membrane in pretreatment of FGD wastewater.
Acknowledgement: This work was financially supported by National Key R&D Program of China (2018YFB0604300) and Key Research and Development Program of Hebei Province (19273606D).
Funding Statement: This work was supported by National Key R&D Program of China(2018YFB0604300) and Key Research and Development Program of Hebei Province (19273606D).
Conflicts of Interest: The authors declare that they have no conflicts of interest to report regarding the present study.
References
1. He, G., Avrin, A. P., Nelson, J. H., Johnston, J., Mileva, A. et al. (2016). SWITCH-China: A systems approach to decarbonizing China’s power system. Environmental Science & Technology, 50(11), 5467–5473. DOI 10.1021/acs.est.6b01345. [Google Scholar] [CrossRef]
2. Zhang, C., Zhong, L. J., Wang, J. (2018). Decoupling between water use and thermoelectric power generation growth in China. Nature Energy, 3(9), 792–799. DOI 10.1038/s41560-018-0236-7. [Google Scholar] [CrossRef]
3. Ma, S. C., Chai, J., Cheng, J. N., Wu, K., Wan, Z. C. et al. (2020). Numerical simulation of bypass evaporation system treating FGD wastewater using high temperature flue gas. Environmental Technology, 41(6), 751–763. DOI 10.1080/09593330.2018.1509892. [Google Scholar] [CrossRef]
4. Gingerich, D. B., Grol, E., Mauter, S. M. (2018). Fundamental challenges and engineering opportunities in flue gas desulfurization wastewater treatment at coal fired power plants. Environmental Science: Water Research & Technology, 4(7), 909–925. DOI 10.1039/C8EW00264A. [Google Scholar] [CrossRef]
5. Ma, S. C., Chai, J., Chen, G. D., Yu, W. J., Zhu, S. J. (2016). Research on desulfurization wastewater evaporation: Present and future perspectives. Renewable and Sustainable Energy Reviews, 58(11), 1143–1151. DOI 10.1016/j.rser.2015.12.252. [Google Scholar] [CrossRef]
6. Cheng, C., Liang, D. H., Zhang, Y. T., Zhang, H., Chen, H. P. et al. (2021). Pilot-scale study on flue gas moisture recovery in a coal-fired power plant. Separation and Purification Technology, 254, 117254. DOI 10.1016/j.seppur.2020.117254. [Google Scholar] [CrossRef]
7. Tian, X. C., Zhen, Z., Xin, Y., Jiang, L. M., Zhao, X. D. et al. (2019). A novel sulfate removal process by ettringite precipitation with aluminum recovery: Kinetics and a pilot-scale study. Journal of Hazardous Materials, 365, 572–580. DOI 10.1016/j.jhazmat.2018.11.032. [Google Scholar] [CrossRef]
8. Lefers, J. B., van Den Broeke, W. F., Venderbosch, H. W., Niet, J., Kettelarij, A. (1987). Heavy metal removal from waste water from wet lime(stone)—Gypsum flue gas desulfurization plants. Water Research, 21(11), 1345–1354. DOI 10.1016/0043-1354(87)90008-X. [Google Scholar] [CrossRef]
9. Zheng, L. B., Jiao, Y. Y., Zhong, H., Zhang, C., Wang, J. et al. (2020). Insight into the magnetic lime coagulation-membrane distillation process for desulfurization wastewater treatment: From pollutant removal feature to membrane fouling. Journal of Hazardous Materials, 391(1), 122202. DOI 10.1016/j.jhazmat.2020.122202. [Google Scholar] [CrossRef]
10. Jia, F., Wang, J. L. (2018). Treatment of flue gas desulfurization wastewater with near-zero liquid discharge by nanofiltration-membrane distillation process. Separation Science and Technology, 53(1), 146–153. DOI 10.1080/01496395.2017.1379539. [Google Scholar] [CrossRef]
11. Fu, J. T., Hu, N., Yang, Z. Q., Wang, L. (2018). Experimental study on zero liquid discharge (ZLD) of FGD wastewater from a coal-fired power plant by flue gas exhausted heat. Journal of Water Process Engineering, 26(3), 100–107. DOI 10.1016/j.jwpe.2018.10.005. [Google Scholar] [CrossRef]
12. Conidi, C., Macedonio, F., Ali, A., Cassano, A., Criscuoli, A. et al. (2018). Treatment of flue gas desulfurization wastewater by an integrated membrane-based process for approaching zero liquid discharge. Membranes, 8(4), 117. DOI 10.3390/membranes8040117. [Google Scholar] [CrossRef]
13. Zhang, X. M., Zhang, C. L., Meng, F., Wang, C. H., Ren, P. F. et al. (2021). Near-zero liquid discharge of desulfurization wastewater by electrodialysis-reverse osmosis hybrid system. Journal of Water Process Engineering, 40, 101962. DOI 10.1016/j.jwpe.2021.101962. [Google Scholar] [CrossRef]
14. Yin, N., Wang, K., Zhong, Z. X., Low, Z. X., Xing, W. H. (2016). Ceramic micro/ultra-filtration of low-concentration ultrafine sulfur in desulfurization wastewater. Journal of Chemical Technology & Biotechnology, 91(12), 3088–3095. DOI 10.1002/jctb.5053. [Google Scholar] [CrossRef]
15. Semblante, G. U., Lee, J. Z., Lee, L. Y., Ong, S. L., Ng, H. Y. (2018). Brine pre-treatment technologies for zero liquid discharge systems. Desalination, 441, 96–111. DOI 10.1016/j.desal.2018.04.006. [Google Scholar] [CrossRef]
16. Li, W. N. (2011). Research on the water conservation and wastewater treatment technology of flue gas wet desulfurization in the coal-fired power plant (Master Thesis). North China Electric Power University, China. [Google Scholar]
17. Gabelich, C. J., Rahardianto, A., Northrup, C. R., Yun, T. I., Cohen, Y. (2011). Process evaluation of intermediate chemical demineralization for water recovery enhancement in production-scale brackish water desalting. Desalination, 272(1–3), 36–45. DOI 10.1016/j.desal.2010.12.050. [Google Scholar] [CrossRef]
18. Martínez-Huitle, C. A., Brillas, E. (2009). Decontamination of wastewaters containing synthetic organic dyes by electrochemical methods: A general review. Applied Catalysis B: Environmental, 87(3–4), 105–145. DOI 10.1016/j.apcatb.2008.09.017. [Google Scholar] [CrossRef]
19. Zhang, H. Y., Shang, Z. T., Zhou, C., Xue, Y. B., Liu, T. F. et al. (2019). Electrocoagulation treatment of wet flue gas desulfurization wastewater using iron-based electrodes: Influence of operating parameters and optimization. International Journal of Electrochemical Science, 14, 3114–3125. DOI 10.20964/2019.03.03. [Google Scholar] [CrossRef]
20. Hakizimana, J. N., Gourich, B., Chafi, M., Stiriba, Y., Vial, C. et al. (2017). Electrocoagulation process in water treatment: A review of electrocoagulation modeling approaches. Desalination, 404(5), 1–21. DOI 10.1016/j.desal.2016.10.011. [Google Scholar] [CrossRef]
21. Lan, S. H., Liang, X. Q., Liu, Z. C., Wang, C. L., Li, H. J. et al. (2014). Magnetic flocculation for advanced treatment of Vitamin E production wastewater. Advanced Materials Research, 1065--1069, 3168–3171. DOI 10.4028/www.scientific.net/AMR.1065-1069.3168. [Google Scholar] [CrossRef]
22. Luo, L., Nguyen, A. V. (2017). A review of principles and applications of magnetic flocculation to separate ultrafine magnetic particles. Separation and Purification Technology, 172, 85–99. DOI 10.1016/j.seppur.2016.07.021. [Google Scholar] [CrossRef]
23. Zhang, X. H., He, X. W., Wei, M., Li, F. Q., Hou, P. et al. (2019). Magnetic flocculation treatment of coal mine water and a comparison of water quality prediction algorithms. Mine Water and the Environment, 38(2), 391–401. DOI 10.1007/s10230-019-00590-9. [Google Scholar] [CrossRef]
24. Hua, F. L., Tsang, Y. F., Wang, Y. J., Chan, S. Y., Chua, H. et al. (2007). Performance study of ceramic microfiltration membrane for oily wastewater treatment. Chemical Engineering Journal, 128(2–3), 169–175. DOI 10.1016/j.cej.2006.10.017. [Google Scholar] [CrossRef]
25. Qdais, H. A., Moussa, H. (2004). Removal of heavy metals from wastewater by membrane processes: A comparative study. Desalination, 164(2), 105–110. DOI 10.1016/S0011-9164(04)00169-9. [Google Scholar] [CrossRef]
26. Barredo-Damas, S., Alcaina-Miranda, M. I., Bes-Piá, A., Iborra-Clar, M. I., Iborra-Clar, A. et al. (2010). Ceramic membrane behavior in textile wastewater ultrafiltration. Desalination, 250(2), 623–628. DOI 10.1016/j.desal.2009.09.037. [Google Scholar] [CrossRef]
27. Wadekar, S. S., Vidic, R. D. (2018). Comparison of ceramic and polymeric nanofiltration membranes for treatment of abandoned coal mine drainage. Desalination, 440, 135–145. DOI 10.1016/j.desal.2018.01.008. [Google Scholar] [CrossRef]
28. Bilad, M. R., Mat Nawi, N. I., Subramaniam, D. D., Shamsuddin, N., Khan, A. L. et al. (2020). Low-pressure submerged membrane filtration for potential reuse of detergent and water from laundry wastewater. Journal of Water Process Engineering, 36, 101264. DOI 10.1016/j.jwpe.2020.101264. [Google Scholar] [CrossRef]
29. Gao, G. W., He, W. J., Li, C., Hu, J. K. (2011). Study on the reuse of production wastewater with submerged ultrafiltration membrane. Advanced Materials Research, 213, 73–77. DOI 10.4028/www.scientific.net/AMR.213.73. [Google Scholar] [CrossRef]
30. Sun, L. H., Li, X., Zhang, G. Y., Chen, J., Xu, Z. et al. (2009). The substitution of sand filtration by immersed-UF for surface water treatment: Pilot-scale studies. Water Science and Technology, 60(9), 2337–2343. DOI 10.2166/wst.2009.684. [Google Scholar] [CrossRef]
31. Agana, B. A., Reeve, D., Orbell, J. D. (2011). Optimization of the operational parameters for a 50 nm ZrO2 ceramic membrane as applied to the ultrafiltration of post-electrodeposition rinse wastewater. Desalination, 278(1–3), 325–332. DOI 10.1016/j.desal.2011.05.043. [Google Scholar] [CrossRef]
32. Xu, J., Chang, C. Y., Gao, C. (2010). Performance of a ceramic ultrafiltration membrane system in pretreatment to seawater desalination. Separation and Purification Technology, 75(2), 165–173. DOI 10.1016/j.seppur.2010.07.020. [Google Scholar] [CrossRef]
33. Huang, X., Wei, C. H., Yu, K. C. (2008). Mechanism of membrane fouling control by suspended carriers in a submerged membrane bioreactor. Journal of Membrane Science, 309(1–2), 7–16. DOI 10.1016/j.memsci.2007.09.069. [Google Scholar] [CrossRef]
34. Akhondi, E., Wicaksana, F., Fane, A. G. (2014). Evaluation of fouling deposition, fouling reversibility and energy consumption of submerged hollow fiber membrane systems with periodic backwash. Journal of Membrane Science, 452, 319–331. DOI 10.1016/j.memsci.2013.10.031. [Google Scholar] [CrossRef]
35. Sergio, G. S. R., Maria, D. K., Gary, L. A., Jan, C. S. (2012). Flux dependency of particulate/colloidal fouling in seawater reverse osmosis systems. Desalination and Water Treatment, 42(1--3), 155--162. DOI 10.1080/19443994.2012.683104. [Google Scholar] [CrossRef]
36. Saffaj, N., Persin, M., Alani Younssi, S., Albizane, A., Bouhria, A. et al. (2005). Removal of salts and dyes by low ZnAl2O4-TiO2 ultrafiltration membrane deposited on support made from raw clay. Separation and Purification Technology, 47(1–2), 36–42. DOI 10.1016/j.seppur.2005.05.012. [Google Scholar] [CrossRef]
37. Khan, I. A., Lee, Y., Kim, J. (2020). A comparison of variations in blocking mechanisms of membrane-fouling models for estimating flux during water treatment. Chemosphere, 259, 127328. DOI 10.1016/j.chemosphere.2020.127328. [Google Scholar] [CrossRef]
38. Aani, S. A., Wright, C. J., Hilal, N. (2018). Investigation of UF membranes fouling and potentials as pre-treatment step in desalination and surface water applications. Desalination, 432, 115–127. DOI 10.1016/j.desal.2018.01.017. [Google Scholar] [CrossRef]
Cite This Article
 Copyright © 2022 The Author(s). Published by Tech Science Press.
This work is licensed under a Creative Commons Attribution 4.0 International License , which permits unrestricted use, distribution, and reproduction in any medium, provided the original work is properly cited.
 Downloads
 Citation Tools