
 Submit a Paper
 Propose a Special lssue
 Open Access
ARTICLE
Wind Energy Data Analysis and Resource Mapping of Dangla, Gojjam, Ethiopia
1 Department of Automotive Engineering, Arba Minch University, Arba Minch, 21, Ethiopia
2 School of Mechanical and Industrial Engineering, Addis Ababa University, Addis Ababa, 1176, Ethiopia
* Corresponding Author: Belayneh Yitayew. Email:
(This article belongs to the Special Issue: Wind Energy Development and Utilization)
Energy Engineering 2022, 119(6), 2513-2532. https://doi.org/10.32604/ee.2022.018961
Received 09 September 2021; Accepted 24 March 2022; Issue published 14 September 2022
 View Full Text
 Download PDF
Abstract
Energy is one of the most important factors in socio-economic development. The rapid increase in energy demand and air pollution has increased the number of ways to generate energy in the power sector. Currently, wind energy capacity in Ethiopia is estimated at 10,000 MW. Of these, however, only eight percent of its capacity has been used in recent years. One of the reasons for the low use of wind energy is the lack of accurate wind atlases in the country. Therefore, the purpose of this study is to develop an accurate wind atlas and review the wind resources using Wind Atlas Analysis and Application Program in Dangla so that the best sites used for the installation of wind farms can be easily identified. Wind climatology data, vector maps, and wind turbine data were used to model the Wind Atlas Analysis and Application Program. The wind data collected from National Meteorology Survey Agency over three years were used for the analysis. Besides, vector data for the survey area was prepared using Global Mapper V20.1. In this study, the Wind Atlas Analysis and Application Program tool was used to estimate wind resources. The wind resource map was developed at an altitude of 80 m above ground level, and a horizontal axis type wind generator called (i.e., GridStreamer Vestas V100 1.8 MW) was selected from the Wind Atlas Analysis and Application Program catalog to mimic the wind farm. The results obtained from the analysis of actual wind data showed that the minimum wind speed was 0.12083 m/s while the maximum wind speed was 9.96389 m/s. At a height of 10 m a.g.l., the mean wind speed and wind power density were 1.8 m/s and 9 w/m2, respectively. The most common wind direction was also discovered to be 210 degrees. The maximum wind speed and capacity factor were available around hills, according to the wind resource map, and the net annual energy output of the Dangla wind farm at a turbine height of 80 m a.g.l. was found to be 282.726 GWh (or, 32.27 MW). The farm’s capacity factor was also discovered to be 9.54 percent, indicating that the site is rated as low potential.Keywords
Nomenclature
| MW | Mega Watt |
| kWh | Kilo Watt Hour |
| AEP | Annual Energy Production (kWh) |
| D | Diameter of Rotor (m) |
| CF | Capacity Factor |
| Mean, Cutin, Cutout, and Rated Wind Speed (m/s) | |
| Probability Density Function | |
| CDF | Cumulative Density Function |
| K | Weibull Shape Factor |
| A | Weibull Scale Factor (m/s) |
| R | Roughness Class |
| Roughness Length (m) | |
| Thrust Coefficient | |
| P | Power (W) |
| DR | Data Recovery |
| Number of Valid Records | |
| N | Total Number of Possible Records |
| α | Wind Shear Exponent |
| TI | Turbulence Intensity |
| kg | kilogram |
| Number of Wind Speed Bins | |
| Frequency of Occurrence | |
| P | Energy Production (kWh) |
| L | Loss |
| PD | Power Density (w/m2) |
| GWh | Giga Watt Hour |
| MWh | Mega Watt Hour |
Energy is one of the most crucial inputs for socio-economic development. It plays a significant role in human existence [1]. A rapid growth in energy demand and air pollution has increased the available options of energy-producing methods in the electric industry [2,3]. Due to the increase in the cost of fossil fuels and air pollution, researchers tried to get and develop alternative green energy sources that are environmentally friendly and cheaper to produce. One of the significant alternative sources of green energy is wind [4].
The wind is atmospheric air in motion. It is the natural movement of air across the earth’s surface. Due to differences in pressure, temperature solar radiation, and rotation of the earth, warmer air rises upward leaving space, and this space is replaced by cooler air, resulting in the local wind. Generating energy from wind is not a new technology. Wind turbines have been used for thousands of years for generating electricity, water pumping, oil extraction, milling, and other mechanical power applications [5].
Any power plant needs fuel to generate electricity. But in the case of a wind power plant, that fuel is the wind. As a result, determining the energy potential of these sites is necessary for wind power generation. Wind resource assessment is the process of deciding how much amount of wind will be available for a wind power plant throughout its useful life. It is used to determine the plant’s energy potential and its importance in developing the economy of the owners. Therefore, an accurate wind resource assessment is necessary for a wind project to be successful [6].
The renewable energy potential of the world, Africa, and Ethiopia by the end of 2019 was 2,536,853, 48,443, and 4,450 MW, respectively [7]. According to the African Development Bank report, at present, the world, Africa, and Ethiopia have 622,704, 5,765, and 324 MW installed wind farms, respectively. Currently, Ethiopia has three installed wind projects having a total capacity of 324 MW (Adama I (50 MW), Adama II (153 MW, and Ashegoda (120 MW)). In addition to these wind farms, Ayisha (300 MW), Messobo (42 MW), Assela (100 MW) and Debre Berhan (100 MW) wind projects are going to be installed in the coming few years [8].
Despite Ethiopia’s vast water, wind, solar, and geothermal energy resources, the country’s energy system is heavily reliant on conventional biomass and fossil fuels. Access to energy is among the key elements for a country’s economic and social development. More than 80% of the country’s population is engaged in the small-scale agricultural sector and lives in rural areas in Ethiopia. Biomass is the principal source of energy in Ethiopia. A study conducted by the central statistics agency at the country level in 2012 suggests that about 81.4% of the households use firewood, around 11.5% of them use leaves and dung cakes and only 2.4% of the households use kerosene for cooking [9].
Currently, the hydropower plant is the main electrical energy supply in Ethiopia. It covers 89 percent (3.743 GW) of the country’s installed capacity (4.206 GW). Eight percent of the country’s electric supply is from wind power plants (337 MW) and the rest three percent is from thermal power plants (126 MW) [10,11]. Ethiopia has been looking for more energy production options to meet the high electricity demand due to the country’s rapid economic growth in recent years. Wind energy is a good viable option due to its complementary nature with hydropower [12].
According to the Ethiopian minister of water and energy report, the wind energy potential of the country was estimated to be 10,000 MW. However, only eight percent of its total capacity has been used in the last years from these. One of the reasons for the low usage of wind energy in Ethiopia is the unavailability of a correct wind atlas in the country. Therefore, it is necessary to develop the correct wind atlas for the entire country so that better sites used for installing wind power plants can be easily identified. Besides, wind energy projects could be planned and implemented in a short time.
A lot of researchers have been studying wind energy data analysis and its potential as a wind power generation in many countries including Ethiopia. The wind resource estimation and mapping at the Ali Al-Gharby site were conducted by Resen [13]. Wind Atlas Analysis and Application Program (WAsP) was used to analyse the wind data and estimate the wind energy potential of the study area. The wind resource map was developed at 70 m a.g.l. The wind farm was modeled at the site by siting Vestas V82, 1.65 MW WTG. The result showed that the wind speed, power density, and annual energy production of the wind farm were found to be 7.11 m/s, 339
The main objective of this work is to carry out a wind energy data analysis and resource mapping of Dangla, Gojjam, Ethiopia using WAsP.
2.1 Description of the Study Area
Dangla is a small town in northwestern Ethiopia located in the Agew Awi Zone of the Amhara Region, it has a latitude and longitude of 11°16′N 36°50′E with an elevation of 2137 m above sea level [18]. Dangla town is located about 80 km southeast of Bahir Dar, the capital city of Amhara Regional State, and 485 km North West of Addis Ababa, the capital city of Ethiopia [19]. The area is 1518 square kilometers in size.
Polygons enclose Dangla with a width of 61.34 km and heights of 44.5 km. It is covered by an area between 4,058,883.3 m East to 4,120,220.8 m East longitude and 1,232,798.9 m North to 1,277,307.4 m North latitude (see Fig. 1). The site has different topographical features and altitudes ranging from 1,099.00 to 2,439.00 m above sea level. Most parts of the site are flat terrain with farmland, semi sand, trees, vegetation, hills, houses, and buildings.
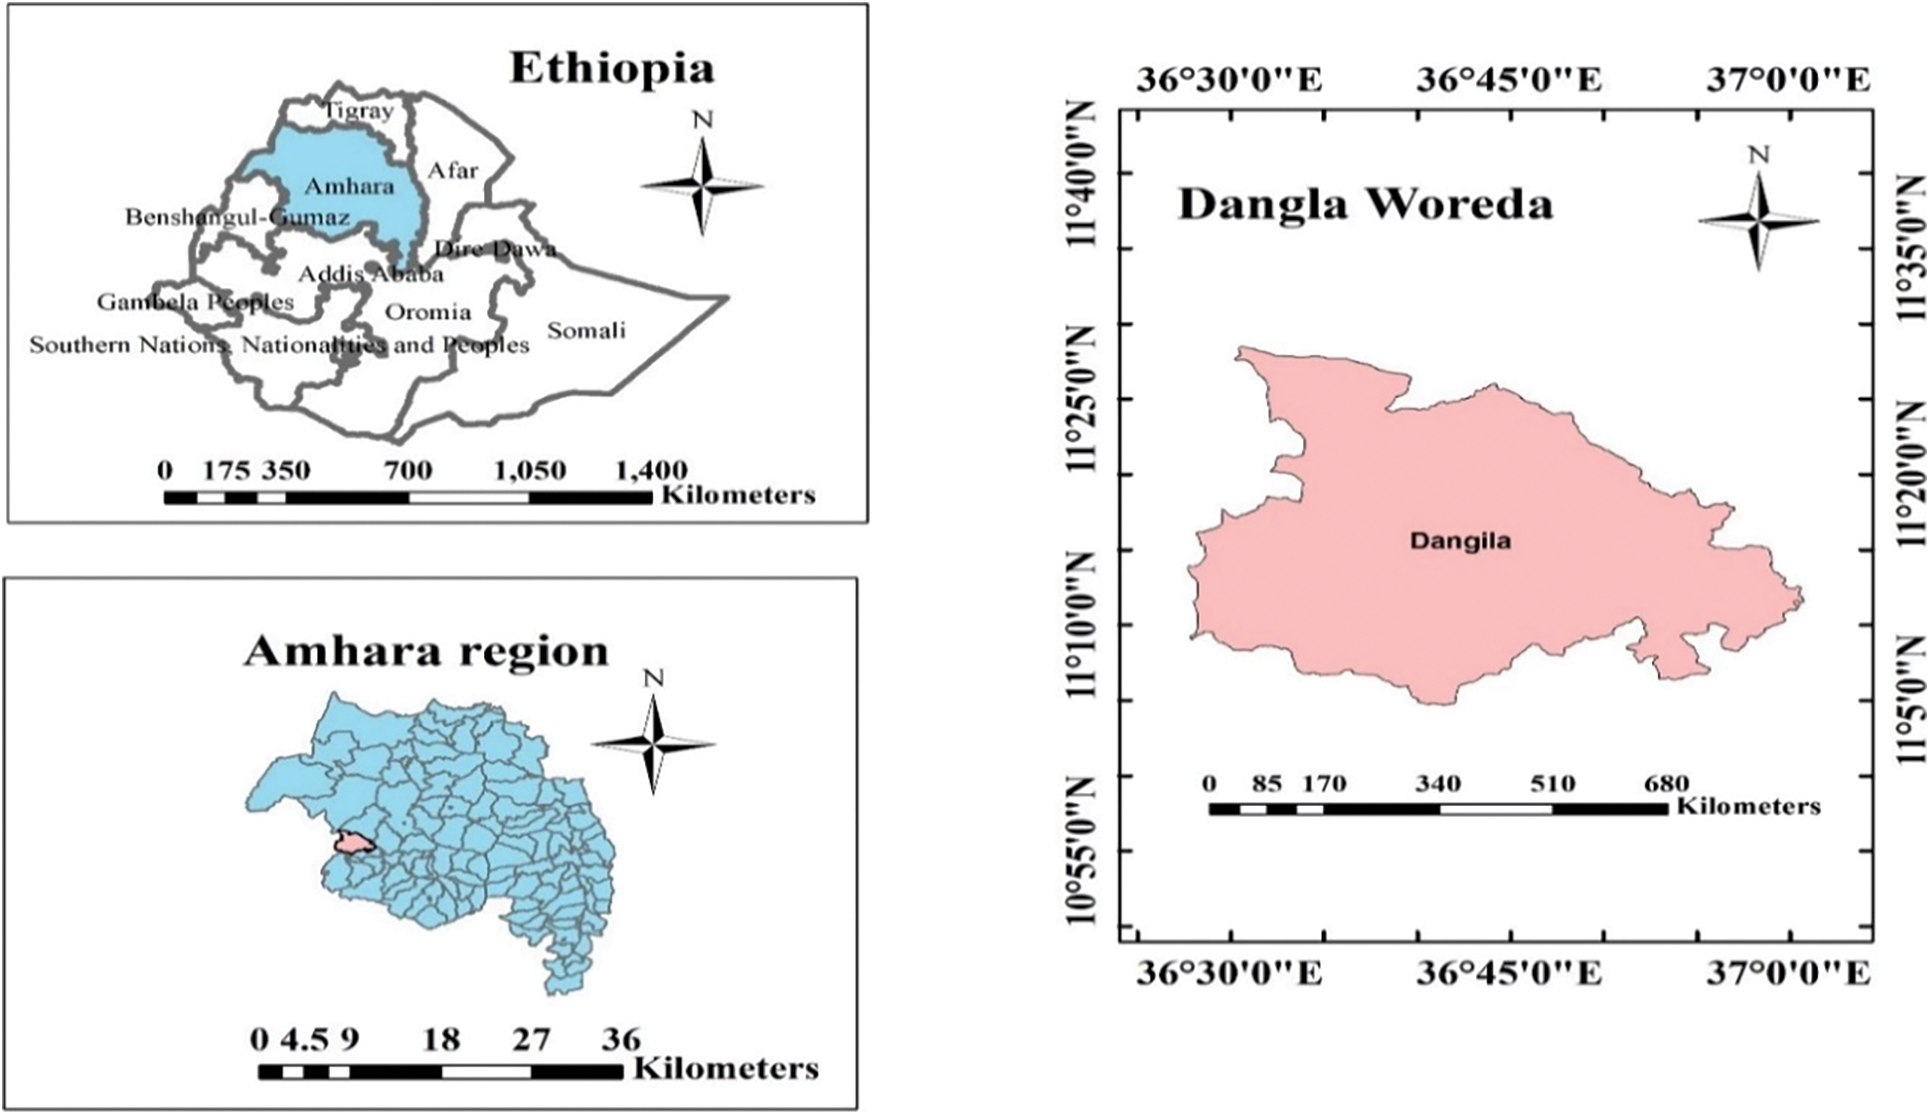
Figure 1: Location map of the study area
2.2 Data Collection, Screening, Conversion, and Validation
Data validation is the inspection of all collected data for their completeness and reasonableness and avoids error values [20]. The wind data (i.e., wind speed and wind direction) used to study Dangla Wind Farm’s wind resource potential is collected from the Ethiopian National Meteorology Survey Agency (NAMSA) recorded from the Dangla meteorology mast located at 10 m a.g.l. in 15 min interval. The collected data information is presented in Table 1. The data was recorded by the data logger in raw binary format (.raw), and these data were converted into a text file format (.text), database format (.DAT), and excel format (excel workbook). After the conversion of data was completed, the completeness of all data was inspected and checked. The wind speed and wind direction vs. time are plotted using MS-Excel to screen the data, check the missing data, and to observe the quality of data, as shown in Figs. 2 and 3 below. The validation process was carried out by checking the missing data, inspecting the average wind speed of each 15 min recorded data, and inspecting unrealistic high wind speed, and negative value of wind speed and direction.
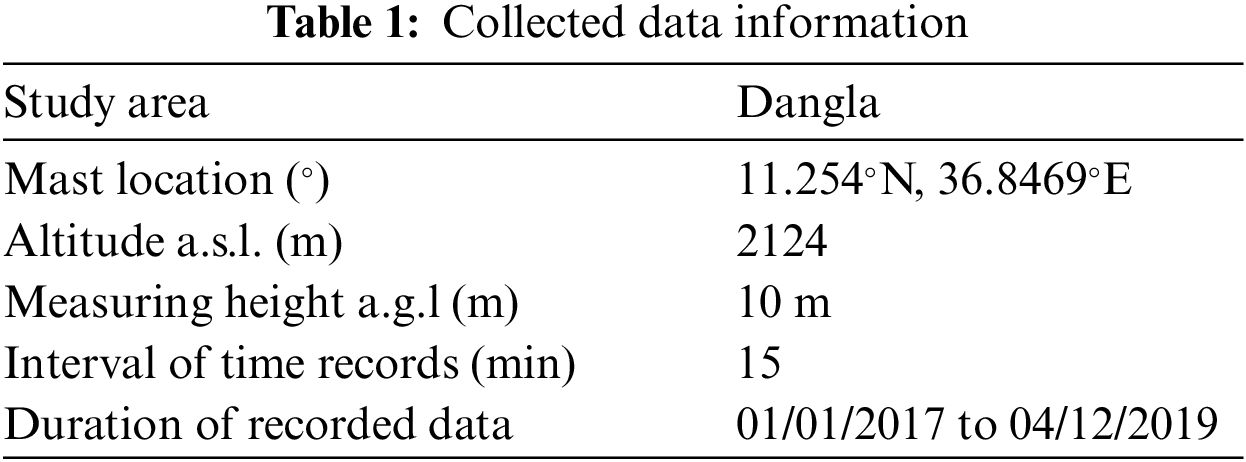
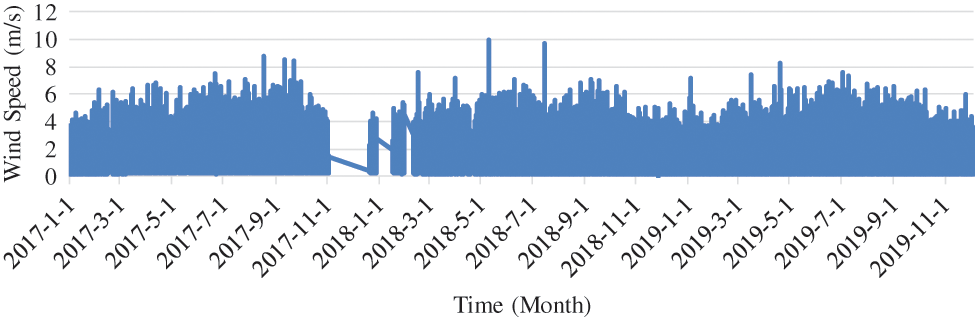
Figure 2: Time vs. wind speed graph
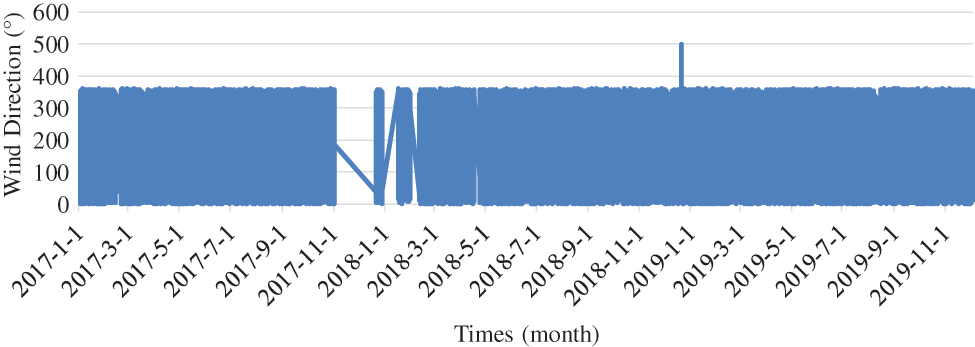
Figure 3: Time vs. wind direction graph
2.3 Characterizing the Wind Resource
After the wind resource data validation process is completed, they are analyzed to generate various statistics of measurement that help to characterize the wind resource. The most common statistical analysis are data recovery, mean speed, speed and direction frequency distribution, wind shear, and wind power density.
Data recovery is defined as the ratio of valid data records to the total number of expected records. It is usually expressed by percentage. Mathematically,
where, DR is data recovery,
The mean wind speed is defined as the average of the total valid data records in the entire period.
where,
Wind shear is defined as the rate of change in horizontal wind speed with height. It is expressed by a dimensionless power-law exponent known as alpha (
The power law is used to relate the wind speeds at two different heights as follows:
where,
This equation can be inverted to define the wind shear
The wind shear of the Dangla meteorology mast was calculated based on the mean wind speeds recorded at 2 m (i.e.,
2.4 Wind Atlas Analysis and Application Program (WAsP) Modeling
WAsP is a program that allows you to extrapolate wind climate statistics vertically and horizontally. It includes multiple models for representing wind movement over various terrains (e.g., different terrain heights and roughness) and near sheltering obstacles [21]. The WAsP technique is made up of five key calculation blocks. These are Analysis of raw wind data, Generation of wind atlas data, Wind climate estimation, Estimation of wind power potential, and Calculation of wind farm production. The general methodology of WAsP is described in Fig. 4 below.
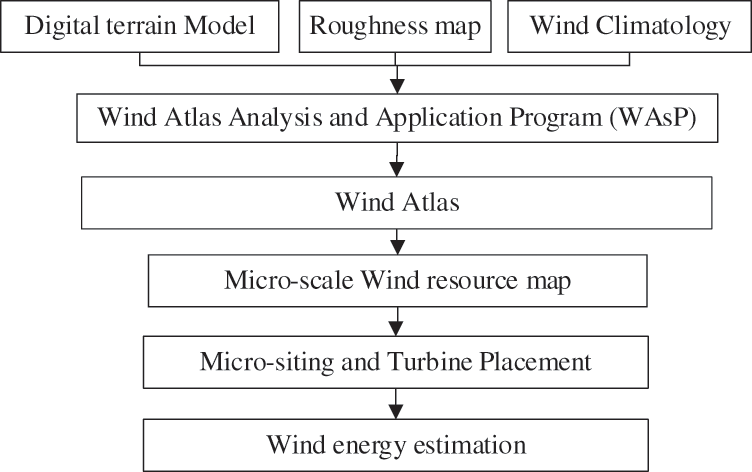
Figure 4: General methodology used to estimate the wind energy potential of a site using WAsP
Both the digital terrain model (contour map) and roughness map are generated using a GIS tool known as Global mapper from terrain data of ASTER GDEM worldwide elevation data (1 arc resolution) and land cover data of ESA CCI (climate change initiative) 2010 (Global land cover-500 m resolution), respectively. Then a WAsP map editor used a contour map and roughness map of a site to generate the vector map. WAsP hierarchy files are then added to the workspace and arranged in a hierarchy to work with WAsP. The hierarchy contains the WAsP workspace, projects, terrain data, wind climate data, site data, wind turbine generators, and resource grids.
2.4.2 Observed Wind Climate (OWC)
OWC is a summary of the wind data recorded at a meteorology station. The summary consists of a wind rose (wind direction frequency distribution) and wind speed frequency distributions−one for each sector. The observed wind climate data was generated from raw wind data containing the wind speed, wind direction, and location of a meteorology station using a WAsP tool known as the WAsP climate analyst tool. The WAsP Climate Analyst tool requires raw wind data (recording time or timestamp, wind speed in m/s, and wind direction in degree) in DAT file format and meteorology station data. In this study area, three years of wind data and meteorology station data are imported to a WAsP climate analyst v12.3 to generate the observed wind climate data. The data is measured from the Dangla meteorology station at 10 m a.g.l. in which whose meteorology mast is located at 264,939.30 m E longitude and 1,244,926.81 m N latitude. In this analysis, the discretization width of mean wind speed and direction was taken as 0.0000001 and 0.0001, respectively. Whereas, the calm threshold value was set to be 0.55 m/s.
2.4.3 Generalized Wind Climate (Wind Atlas)
Wind atlas contains data describing a site-independent characterization of the wind climate for an area. The WAsP models are used to analyze the wind data collected from meteorological stations to produce wind atlases and apply the atlas to estimate the wind climate (and power production) at turbine sites. The wind atlas or regional wind climate is generated from observed wind climate and terrain data of Dangla using WAsP 12.3. The wind atlas contains the wind rose and the wind speed frequency distribution in the same sectors. The wind climates were specified in five roughness classes (R = 0, 0.03, 0.1, 0.4, and 1.5 m) and five reference heights (H = 10, 25, 50, 100, and 200 m). Unlike the observed wind climate, in the wind atlas, there are no local terrain effects in the wind atlas. WAsP needs observed wind climate data, meteorology station data, and terrain data to calculate the wind atlas of a turbine site at different heights and roughness classes. This is presented schematically in the wind atlas (generalized wind climate) methodology of the Wind Atlas Analysis and Application Program (WAsP) as shown in Fig. 5 below.
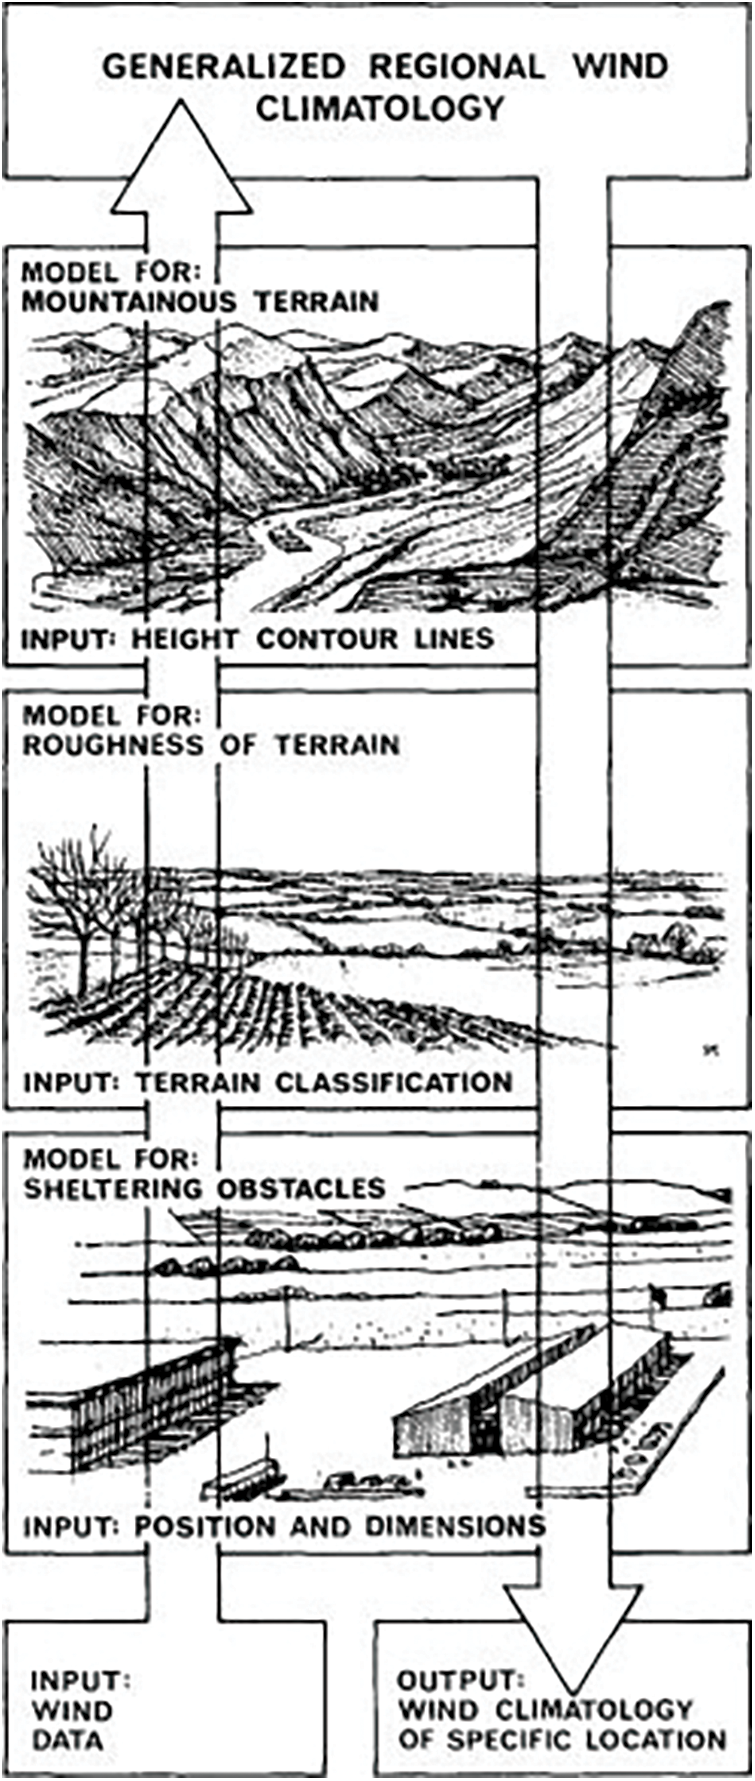
Figure 5: Wind atlas methodology of WAsP [22]
In WAsP, the energy potential of wind is determined using Weibull distributions. With WAsP 12, the total power production is calculated as the sum of the sector-wise power production. Once the power curve and the probability density function at hub height is determined, the mean wind power generated by a turbine is given by
WAsP needs the generalized wind climate, site description (vector map), and a power curve describing the generating characteristics of the turbine to determine the wind energy potential of the turbine site. The annual energy production of the typical wind farm mainly depends on the wind resource characteristics and type of wind turbine selected. So, an appropriate wind turbine generator was selected by considering its suitability for the site, price, warranty, cut-in speed, cutout speed, capacity, and accessibility. The suitability of the turbine for the site was done according to the IEC classification of turbines [23] as shown in Table 2.
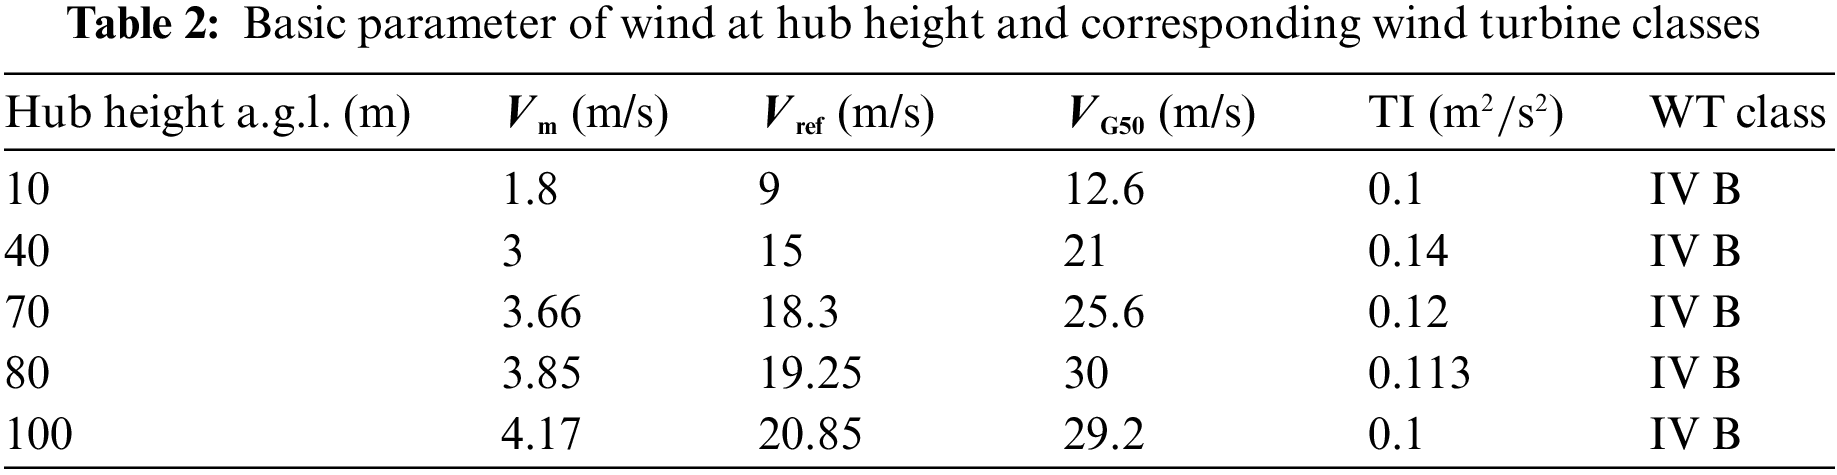
To check the suitability of the site, therefore, the wind characteristics at different hub heights were calculated using power-law (Eq. (3)) by taking the wind shear exponent as 0.36521.
It is known that the wind speed distribution and cost of the turbine increase with hub height, but as it is shown in Table 2 above, the increase in hub height has no significant effect on mean wind speed. So, by considering the cost, power production capacity, availability, and suitability of the turbine, the Vestas V100-1.8 MW GridStreamer wind turbine generator was selected from the WAsP catalog. The selected wind turbine generator’s cut-in wind speed and cut-out wind speed are 3 and 20 m/s, respectively, whereas its rated wind speed is 12 m/s.
The wind resource map contains resource grids. A wind resource grid is a data structure that describes how the wind resource varies across the site. For these resource grids, WAsP is used to calculate and show Weibull shape and scale factor values, mean wind speed, power density, elevation, ruggedness index RIX, performance indicator DRIX, and annual energy production of each point in a grid which leads to estimate the wind energy production of the wind farm [24].
WAsP desires the generalized wind climate, site description (vector map), a power curve describing the generating characteristics of the turbine, and the resource grid, to determine the wind energy potential of the turbine site. The wind resource grid was developed at a hub height of ten, fourty, seventy, eighty, and one hundred meters a.g.l. with 100-m resolution using WAsP 12. It covers an area of 31.9 km × 22.4 km area. The grid was spaced from 50–200 m to determine the effect of grid resolution on the output and it was found that the results were not affected by the grid resolution below 100 m. Thus, the resource grids were spaced to 100 m to reduce the computation time and 72,000 nodes were obtained in 320 rows and 225 columns.
2.4.6 Estimating Wind Farm Production
A wind farm is a collection of wind turbines located on the same site to produce electricity. They may vary in size according to the number of wind turbines covering an area. Wind farms can be either onshore or offshore. In this case, an onshore wind farm is modeled using WAsP 12.
The wind energy industry requires a correct estimation of how much amount of energy can be produced from a wind farm in a lifetime of normally 20 years [25]. The wind farm production rate can be measured by calculating either the gross annual energy production (GAEP) or net annual energy production (NAEP) of the wind farm. Gross energy production is the total power output of a wind plant without a wake or other losses in one year. It can be calculated for each turbine on a farm using the following equation:
where,
Net annual energy production is the gross annual energy production minus the production losses. There are six categories of production losses expressed as a percentage of gross annual energy production. These are wake losses, availability uses, turbine performance losses, electrical losses, environmental losses, and losses due to curtailments. The total production losses can be calculated as:
where Li denotes the production loss i in percentage.
The wake behind a wind turbine generator has low velocity and high turbulence intensity, leading to the wind turbine’s diminished performance. WAsP uses a park model to predict the wake effect of each turbine and the power production of the wind farm.
WAsP needs predicted wind climate, the layout of the wind farm, and the wind turbine generator to estimate the wind farm production. To optimize the power production of the wind farm, turbine sites are located based on the rule of thumb of the Danish Wind Energy Association (i.e., turbines are spaced between 5D to 9D apart in the prevailing wind direction, and between 3D and 5D apart in the direction perpendicular to the prevailing winds, where D is the turbine diameter) [26]. Using Google Earth synchronization, the turbines are placed at places where there are relatively high wind speeds and low RIX values, and they are clear from obstacles, towns, homes, water bodies, and roads as shown in Fig. 6. They are spaced between 500 to 900 m apart in the prevailing wind direction, and between 300 and 500 m apart in the direction perpendicular to the prevailing winds.
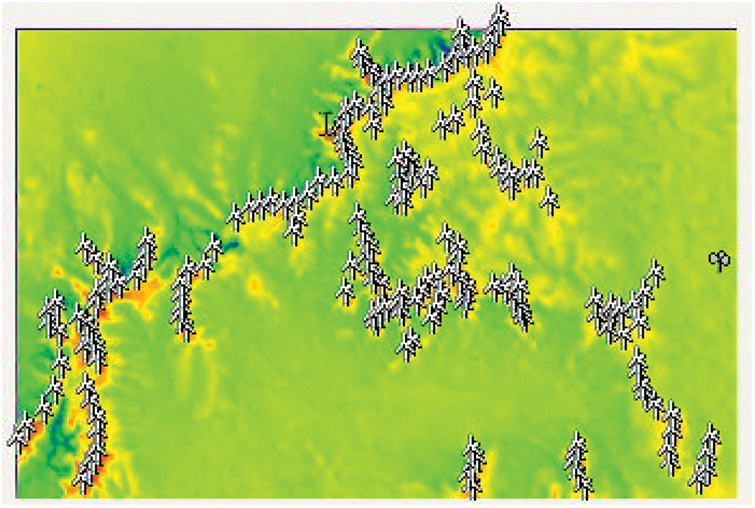
Figure 6: Windfarm layout of Dangla
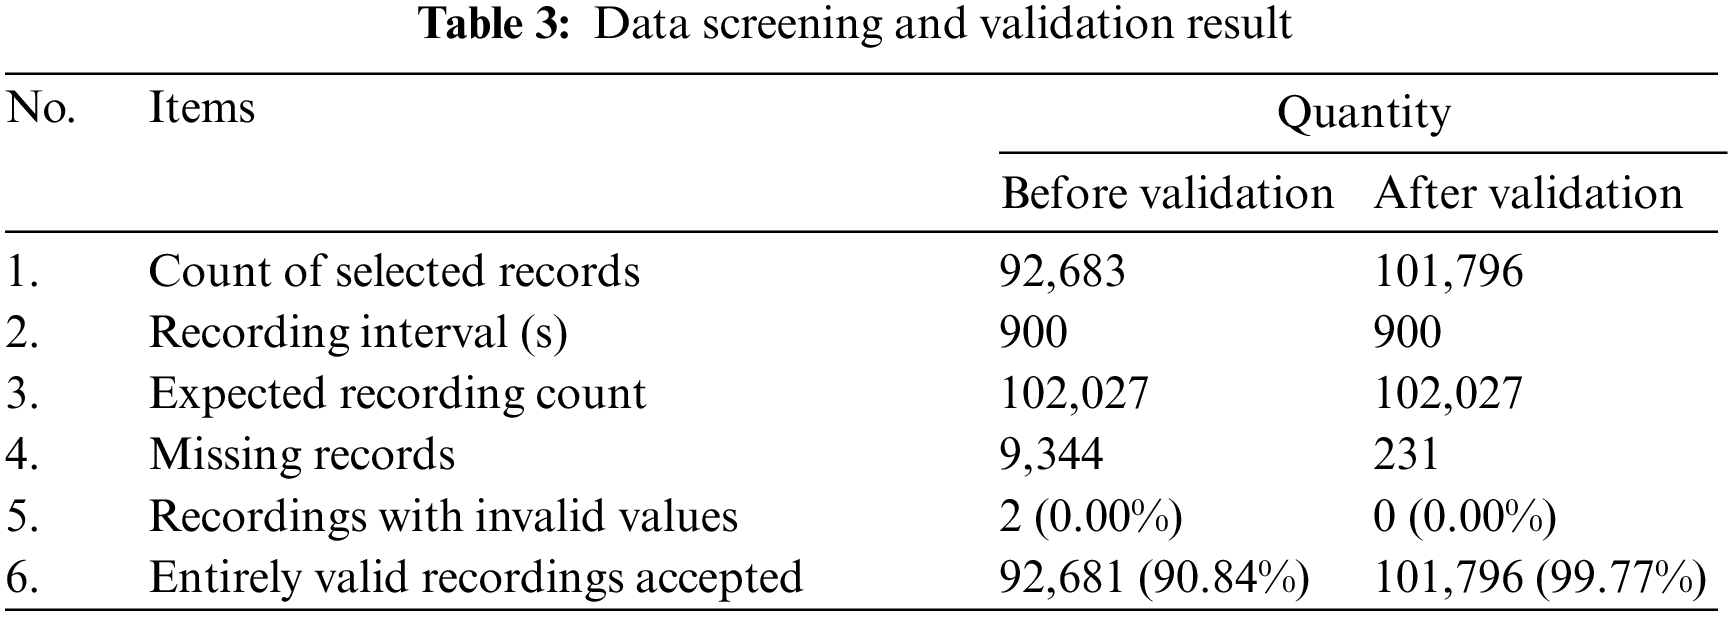
3.1 Data Screening and Validation
The data screening and validation process were conducted according to Section 2.2 and the result showed that the wind data used for this analysis were recorded from January 01, 2017, to December 04, 2019, in 15 min (900 s) intervals. In this time interval, a total of 92,683 data were recorded and 9,344 data were missed. Not only were missing records but also, there were two invalid records and 18 incorrect records of wind direction (records above 360 degrees). As a result, the filling of the missing data and replacement of the incorrect measures were done by taking the average value of the consecutive year’s data and the invalid records had been removed. The summary of data screening and validation results is described in Table 3 below.
3.2 Characterizing the Wind Resource
After the wind resource data validation process is completed, they are analyzed to generate various statistics of measurement that help to characterize the wind resource. Data recovery, mean speed, speed and direction frequency distribution, wind shear, turbulence intensity, and wind power density are the most common statistical analysis.
Data recovery is defined as the ratio of the number of valid data records to the total number of expected records. It is usually expressed by percentage.
The data recovery rate was calculated using Eq. (1) and it was found to be 90.84% before validating the raw data and 99.77% after the screening and validation process is carried out.
The wind speed of the Dangla meteorology station for the years from January 01, 2017, to January 04, 2019, was varied from 0.12083 to 9.96389 m/s. The average wind speed of the site was 1.8 m/s.
The wind shear of the Dangla meteorology mast was calculated based on the mean wind speeds recorded at 2 m (i.e.,
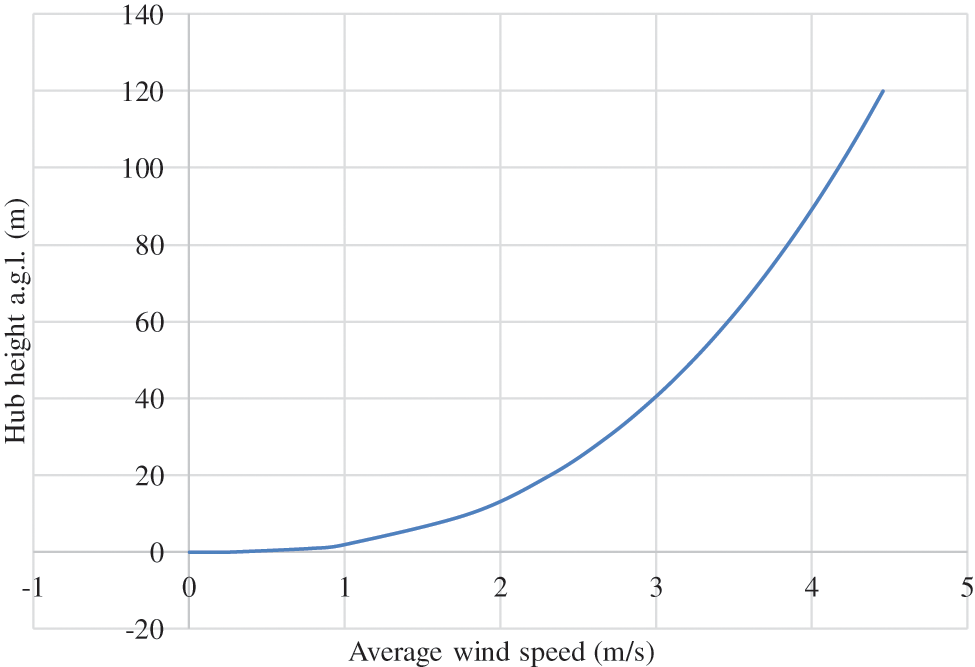
Figure 7: Wind shear profile of Dangla Met. Mast
3.3 Results of WAsP Modeling and Analysis
The average wind speed and direction measured from the Dangla meteorology station had been analyzed using the WAsP climate Analyst tool as shown in Fig. 8 below and the result showed that the most frequent wind direction falls between the angle 210° and 270° with frequencies of 12.8% and 12.0%, whereas, better wind speed is available from 5:00 AM to 12:00 PM throughout the day. In addition to this, the maximum wind speed was recorded in June and the minimum wind speed was obtained in November and December. The mean wind speed and power density of the site throughout the entire period were also found to be 1.8 m/s and 9 w/m2 respectively which are less than both Debre Markos and Mota meteorological stations. In Dangla’s observed wind climate, the fitted Weibull distribution is described in Fig. 8 below.
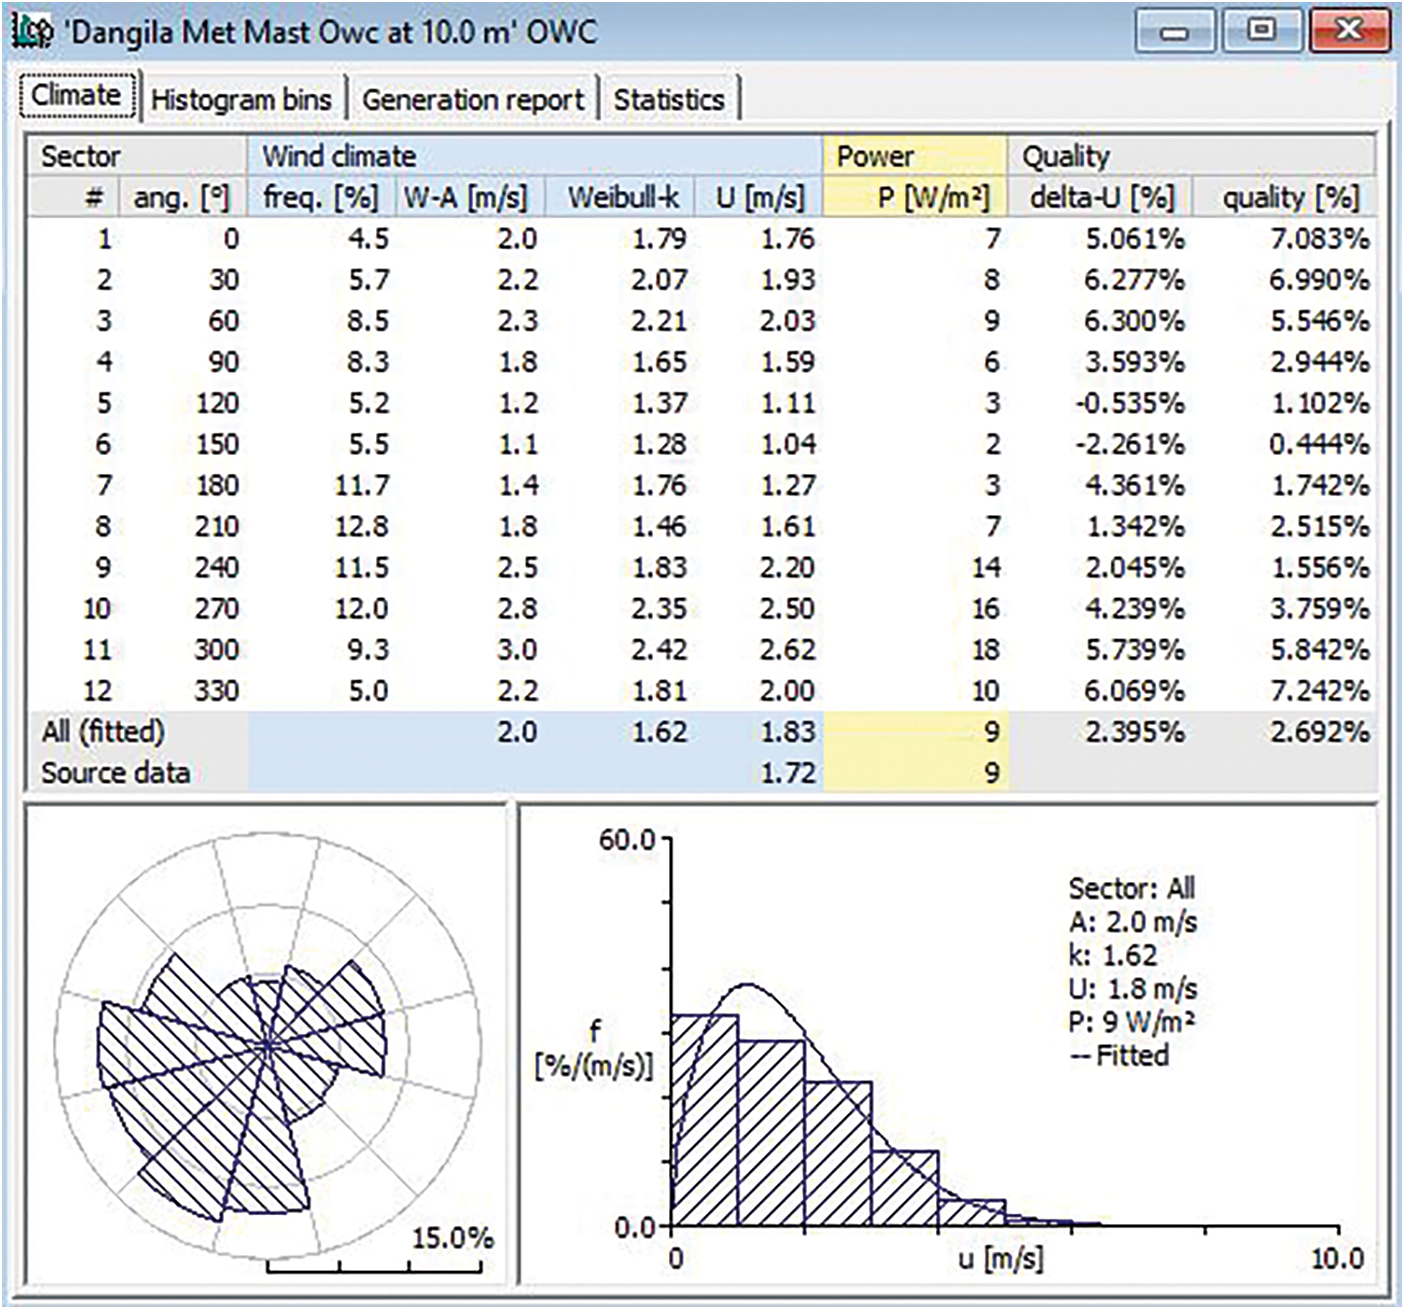
Figure 8: Observed wind climate data of Dangla Met. Mast at 10 m a.g.l
3.3.2 Wind Atlas (Generalized Wind Climate)
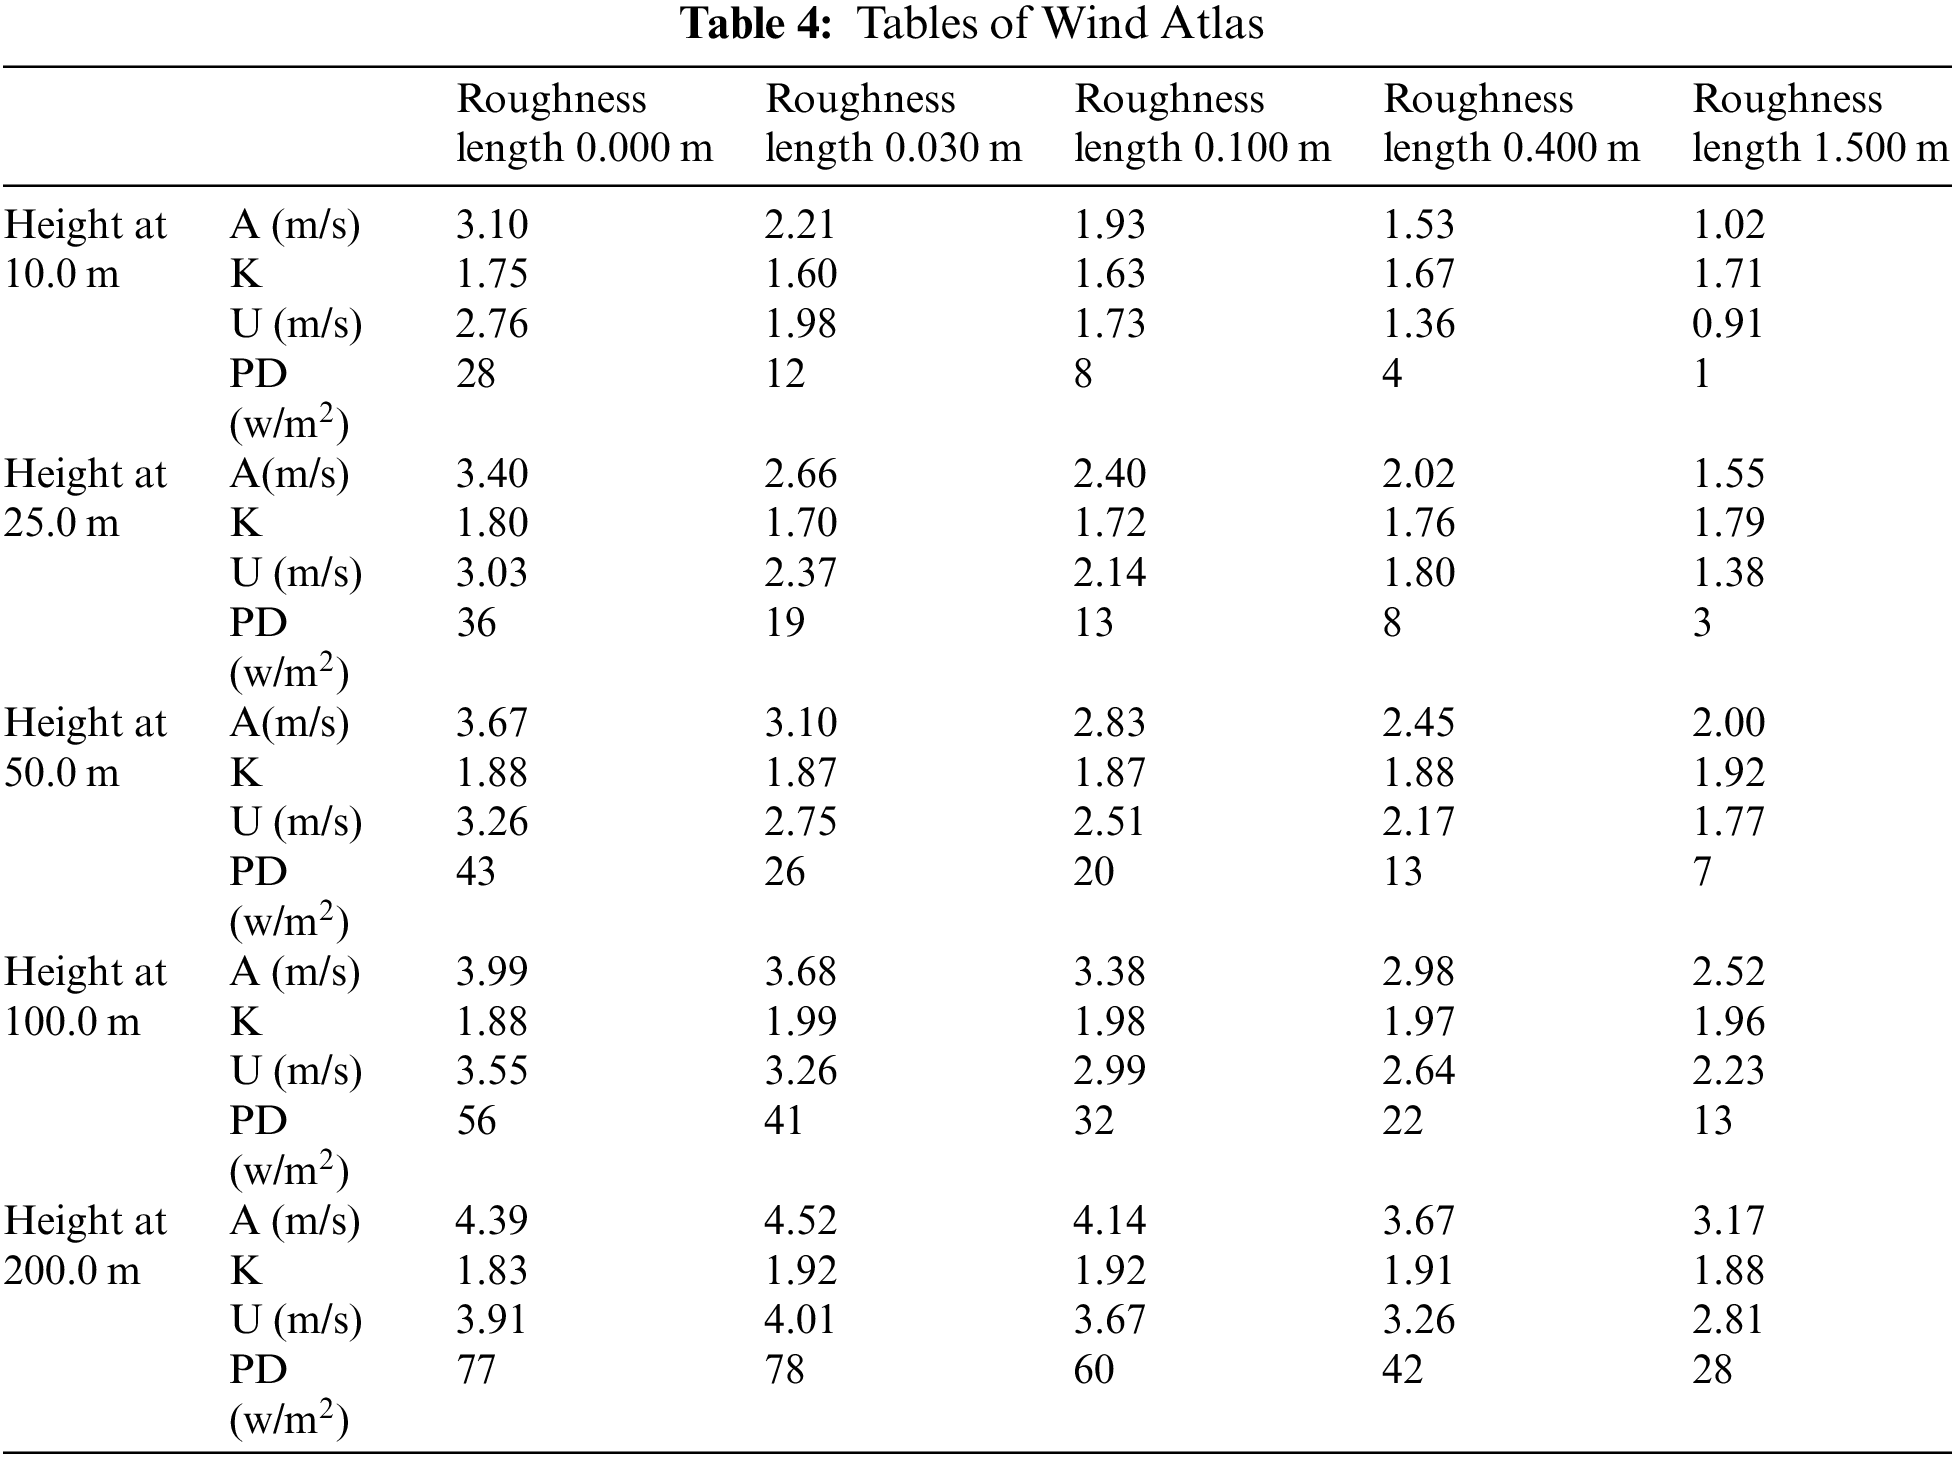
In the wind atlas, the emergent and combined Weibull distributions are shown in Fig. 9 below. As shown in Fig. 9 and Table 4 below, it is observed that the wind speed increases with height, but the effect of surface roughness decreases with an increase in height.
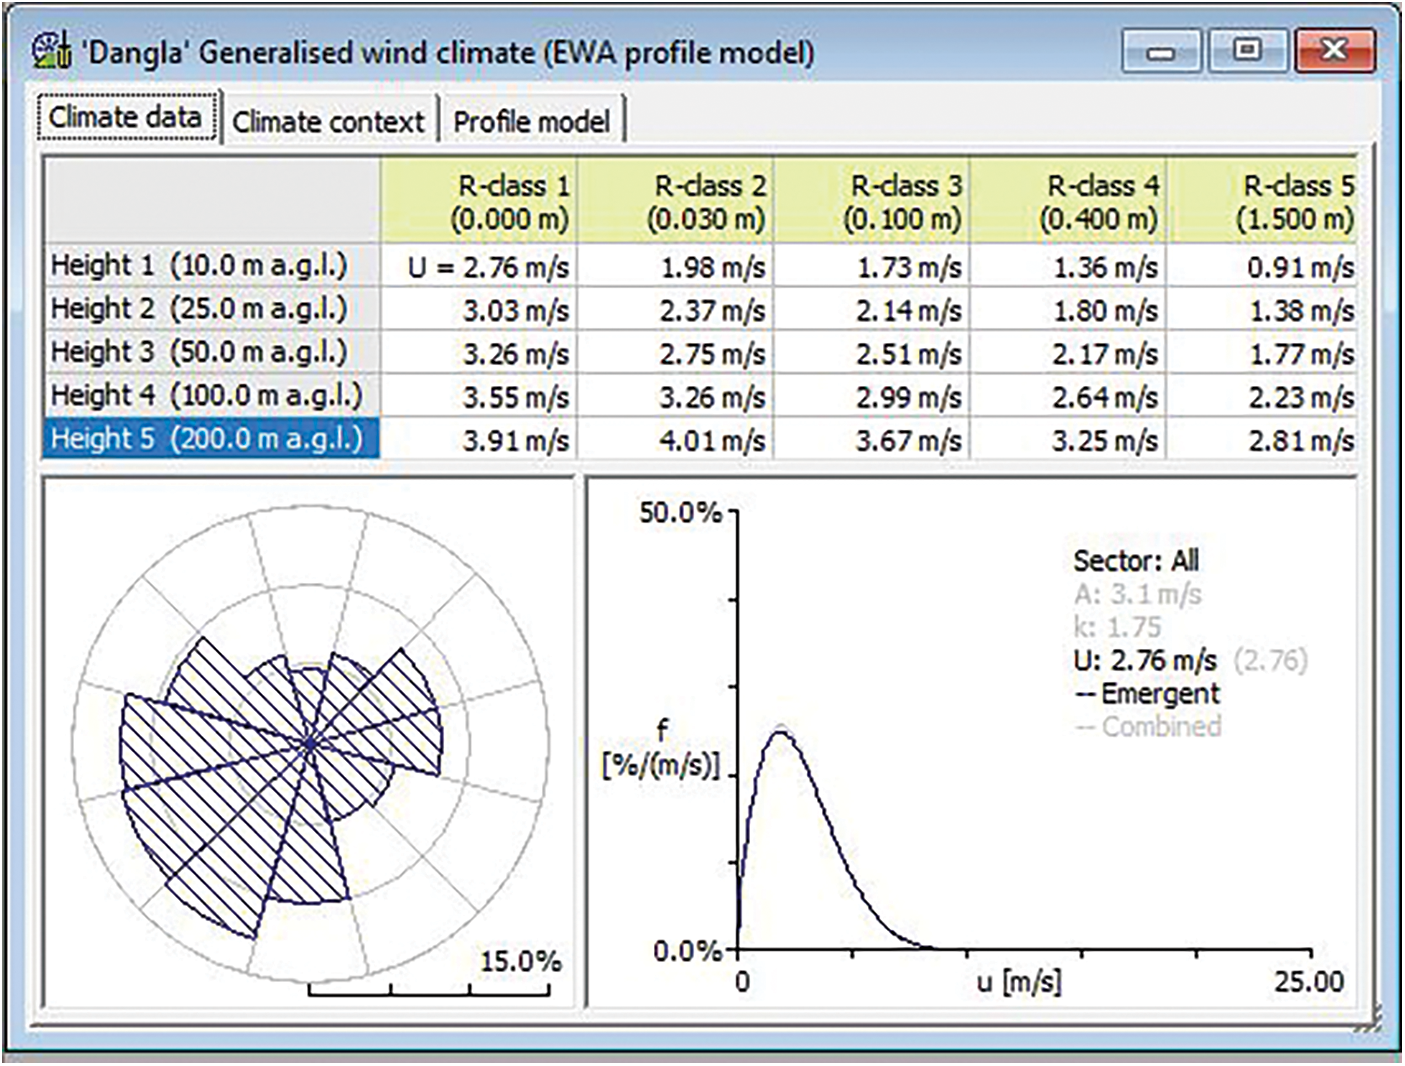
Figure 9: Wind atlas (GWC) of Dangla
The wind resource grid calculated by WAsP 12 showed that the mean speed, mean power density, mean AEP of the resource grid increases with height. The detailed resource grid results obtained from WAsP 12 (wind speed, power density, ruggedness index, and annual energy production, etc.) are described below.
Mean wind speed
The mean wind speed of Dangla Wind Farm at 10, 40, 80, and 100 m heights a.g.l. were calculated using WAsP and the following results were obtained.
As it is presented in Fig. 10, the results obtained showed that the mean wind speed was increased with an increase in hub height and maximum wind speed was available at hills. The wind resource potential of Dangla at 40-m height a.g.l. was minimum as compared to [14]. According to the IEC classification of wind Turbines, the site is categorized as class IV at both 10 and 80 m height a.g.l.
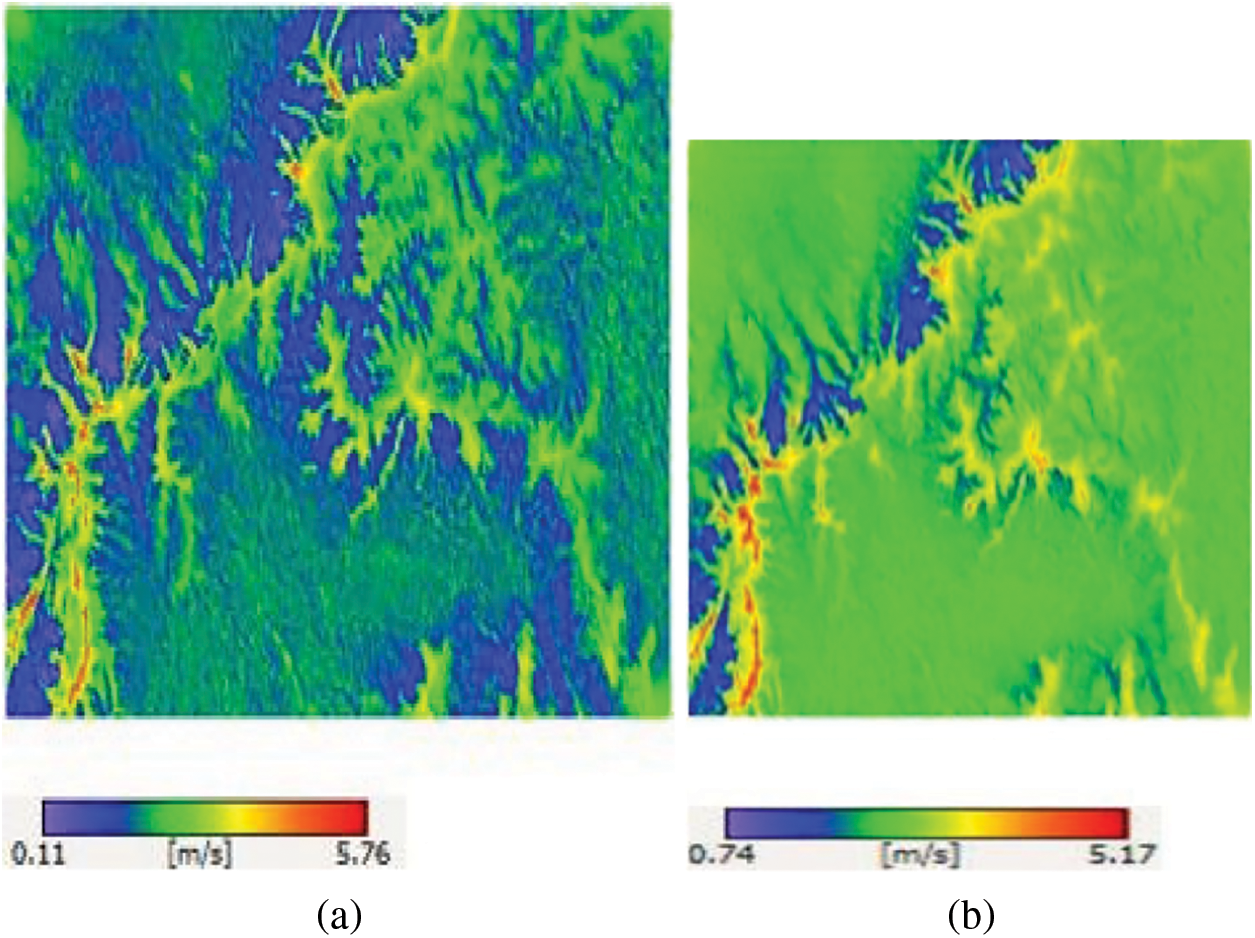
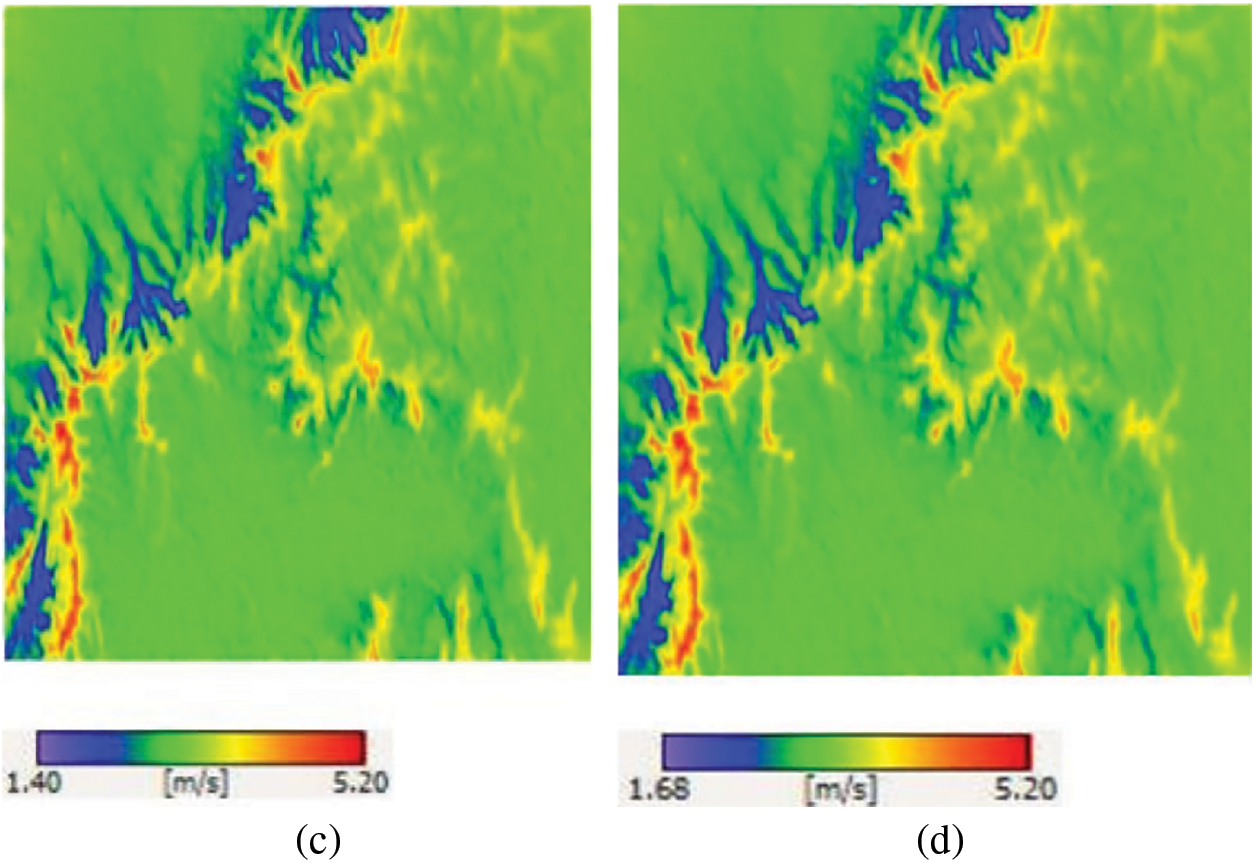
Figure 10: Resource grid map showing mean wind speed at (a), 10 m (b), 40 m (c), 80 m (d) 100 m height a.g.l. and 100 m resolution
Wind Power Density
The power density of Dangla Wind Farm at a hub height of 80 a.g.l. was calculated using WAsP and the result showed that the wind power density ranged from 4–130
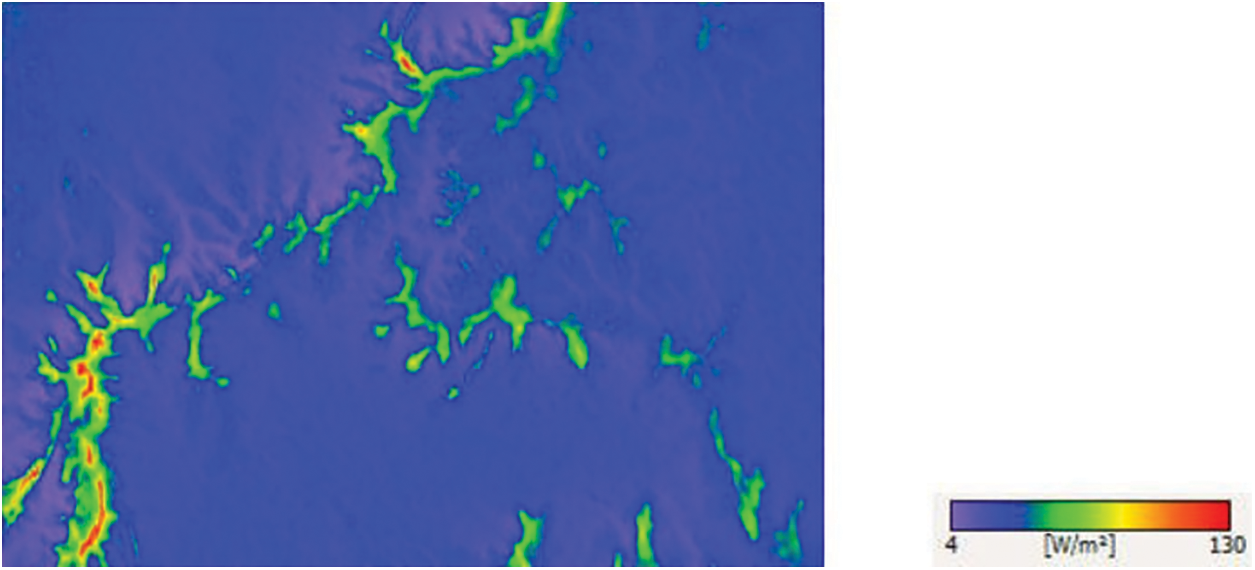
Figure 11: Wind resource grid showing the power density of Dangla Wind Farm at 80-m above ground level
Annual Energy Production
The annual energy production of the farm at a hub height of 80 a.g.l. was calculated by WAsP 12 using Vestas V100-1.8 MW GridStreamer wind turbine generator. The result showed that the annual energy production of the wind farm ranged from 0.027–3.359 GWh with a mean value of 0.657 GWh. The annual energy production graph of the farm is shown in Fig. 12 below.
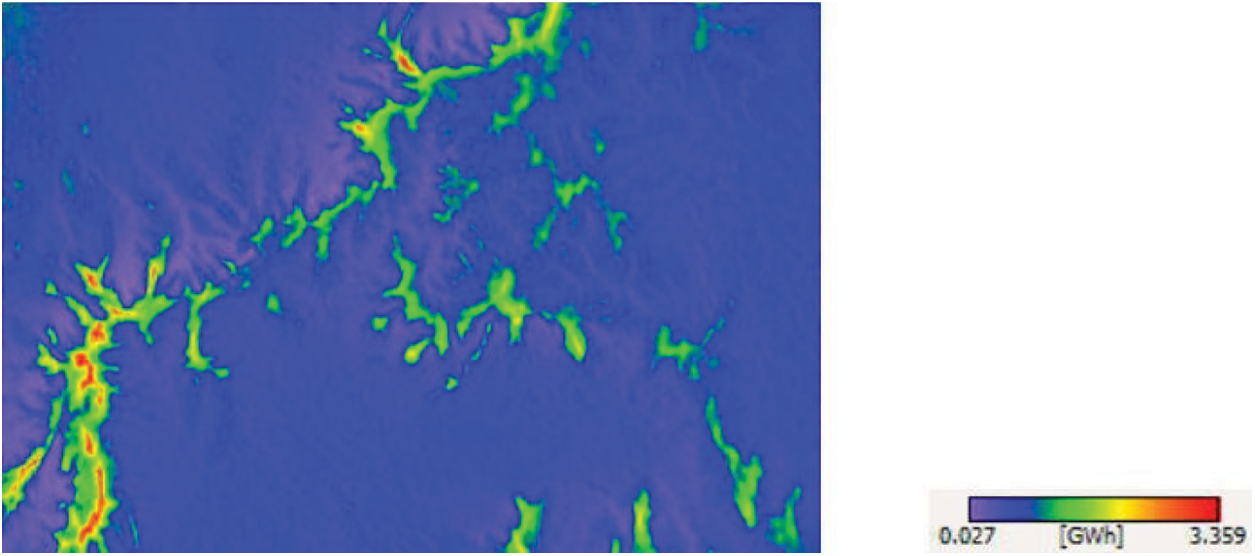
Figure 12: Wind resource map showing the Annual Energy Production of Dangla Wind Farm at 80 m above ground level
Ruggedness Index (RIX)
The ruggedness index (RIX) was calculated using WAsP and the result presented in Fig. 13 showed that the ruggedness index of the terrain varies from 0% to 35.7% with an average RIX value of 7.4%. The site could be classified as a flat site [27].
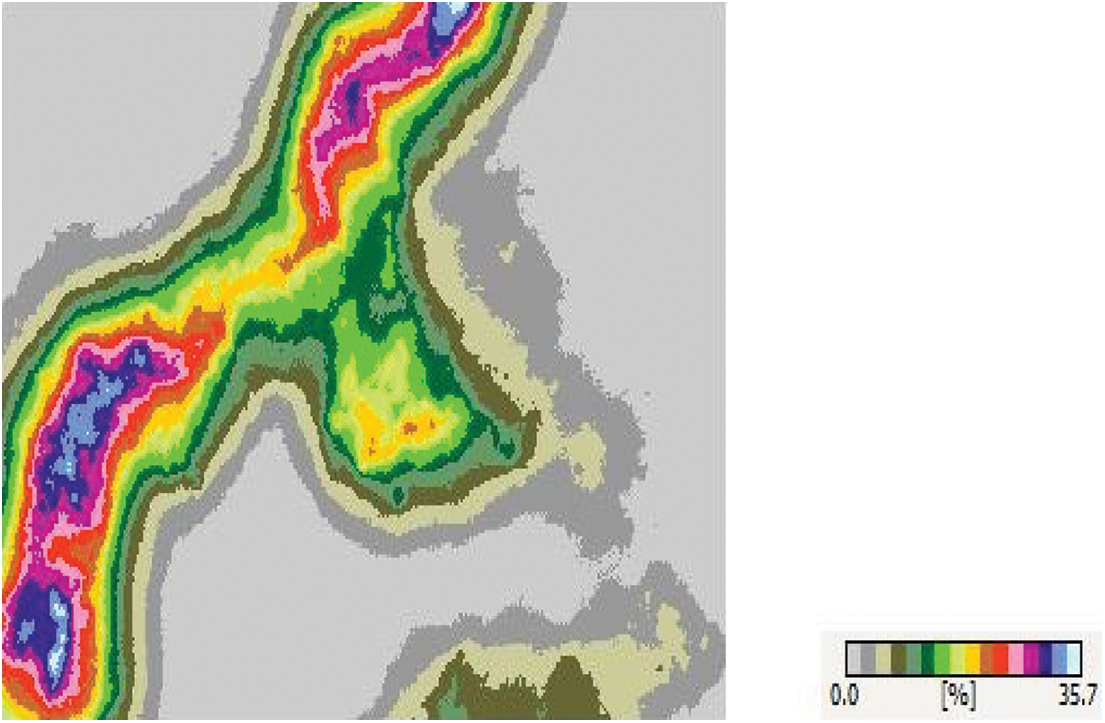
Figure 13: Resource grid map showing the ruggedness index of Dangla Wind Farm
The typical wind farm covers a 31.9 Km × 22.4 Km area. In this area, a total of 188 wind turbines of uniform hub height (80 m a.g.l.) and a rotor diameter of 100 m were installed according to the rule of thumb. The mean wind speed at turbine heights ranged from 3.39 to 5.2 m/s which indicates that the site is classified as lower potential [28]. The wind farm production calculated by WAsP 12 showed that a total of 307.111 GWh energy was produced annually with a wake loss of 7.94%. Its net AEP was determined to be 282.726 Giga Watt hour. The minimum, average, and maximum net energy production were 839, 1504, and 3078 MWh, respectively.
3.3.5 Capacity Factor of Wind Farm
The capacity factor is the ratio of the actual energy output of the turbine to the expected output energy. The expected (possible) output energy of the wind farm is the product of the total number of turbines installed on a wind farm and the rated capacity of the selected wind turbine generator.
Expected output energy = 188 × 1.8 Mw × 8760 hr. = 2,964,384 MWh = 2,964.384 GWh. Whereas, the net AEP was 282.726 GWh. Thus, the capacity factor of the wind farm is
The wind resource potential analysis for generating electricity in the Dangla area was carried out in this work. In this study, three years of wind data were recorded at the height of 10-m a.g.l. in 15 min intervals, a vector map of the site which WAsP map editor generated, and Vestas V100-1.8 MW grid streamer wind turbine generator were used. The minimum and maximum wind speeds of the study area were 0.12083 m/s and 9.96389 m/s, respectively. The mean wind speed and power density at the height of 10 m a.g.l. were 1.8 m/s and 9 w/m2. The most frequent wind direction was also found to be 210° (i.e., the most prevailing wind direction was the southwest direction).
The wind resource assessment was carried out using the Wind Atlas Analysis and Application Program (WAsP) and the results showed that the maximum wind speed was available around hills. The energy production of the wind farm varied with the wind speed, height, type of wind turbine selected, and wake losses. The wind resource map was plotted at 10, 40, 80, and 100 m height a.g.l. but the wind farm was modeled at 80 m in height. The net annual energy production of the study area at a turbine height of 80 m a.g.l. was found to be 282.726 GWh (or, 32.27 MW). The capacity factor of the farm was also found to be 9.54%. According to international standards of wind power generation classification, the site is classified as having poor potential. Nevertheless, small-scale wind turbines might be a good candidate for these locations.
Acknowledgement: We wish to acknowledge the help provided by the National Meteorology Survey Agency Staff who gave us the wind data. Besides, we would like to acknowledge the WAsP technical and support team of Risø National Laboratory for Sustainable Energy at the Technical University of Denmark (DTU), for giving us a free license file for six months and for their tireless support. Finally, we would like to acknowledge with gratitude, the support, encouragement, and love of our family.
Funding Statement: The authors received no specific funding for this study.
Conflicts of Interest: The authors declare that they have no conflicts of interest to report regarding the present study.
References
1. Mulugetta, Y., Ben Hagan, E., Kammen, D. (2019). Energy access for sustainable development. Environmental Research Letters, 14(2), 1–6. DOI 10.1088/1748-9326/aaf449. [Google Scholar] [CrossRef]
2. International Energy Agency (2022). Global Energy Review: CO2 Emissions in 2021. Global emissions rebound sharply to highest ever level. IEA. https://iea.blob.core.windows.net/assets/c3086240-732b-4f6a-89d7-db01be018f5e/GlobalEnergyReviewCO2Emissionsin2021.pdf. [Google Scholar]
3. Calautit, K., Aquino, A., Calautit, J., Nejat, P., Jomehzadeh, F. et al. (2018). A review of numerical modelling of multi-scale wind turbines and their environment. Computation, 6(1), 24. DOI 10.3390/computation6010024. [Google Scholar] [CrossRef]
4. Charles Rajesh Kumar, J., Majid, M. A. (2020). Renewable energy for sustainable development in India: Current status, future prospects, challenges, employment, and investment opportunities. Energy, Sustainability and Society, 10(1), 1–36. DOI 10.1186/s13705-019-0232-1. [Google Scholar] [CrossRef]
5. Wagner, H. J., Mathur, J. (2018). Introduction to wind energy systems: Basics, technology and operation. 3rd edition. Berlin, Heidelberg: Springer. [Google Scholar]
6. Brower, M. (2012). Wind resource assessment, a practical guide to developing a wind project. 1st edition. Hoboken: John Wiley & Sons, Inc. https://doi.org/10.1002/9781118249864. [Google Scholar]
7. IRENA (2020). Renewable capacity statistics 2020. International Renewable Energy Agency.https://irena.org/--/media/Files/IRENA/Agency/Publication/2020/Mar/IRENA_RE_Capacity_Statistics_2020.pdf. [Google Scholar]
8. Hailu, A. D., Kumsa, D. K. (2020). Ethiopia renewable energy potentials and current state. AIMS Energy, 9(1), 1–14. DOI 10.3934/energy.2021001. [Google Scholar] [CrossRef]
9. Ministry of Water and Energy (2012). Federal democratic republic of Ethiopia, ministry of water and energy: Scaling-up renewable energy program Ethiopia, investment plan (Draft Final). [Google Scholar]
10. EPCC (2015). First assessment report, -working group II water and energy. Ethiopian Academy of Sciences. http://197.156.72.153:8080/xmlui/handle/123456789/2424. [Google Scholar]
11. Khan, B., Singh, P. (2017). The current and future states of Ethiopi ’s energy sector and potential for the current and future states of Ethiopia ’s energy sector and potential for green energy: A comprehensive study. https://doi.org/10.4028/www.scientific.net/JERA.33.115. [Google Scholar]
12. Zegeye, A. D. (2020). Wind resource assessment and wind farm modeling in Mossobo-Harena. Wind Engineering, 45(3). https://doi.org/10.1177/0309524X20925409. [Google Scholar]
13. Resen, A. K. (2017). Wind resource estimation and mapping at Ali Al-Gharby Site (East-South of Iraq) using WAsP model. Iraqi Journal of Science, 56(2A), 1216–1223. DOI 10.13140/RG.2.2.34988.16007. [Google Scholar] [CrossRef]
14. Assowe, O., Osman, M., Kirk-davidoff, D., Olauson, J. (2019). Wind resource assessment and economic analysis for electricity generation in three locations of the Republic of Djibouti. Energy, 185, 884–894. DOI 10.1016/j.energy.2019.07.107. [Google Scholar] [CrossRef]
15. Gaddada, S., Kodicherla, S. P. K. (2016). Wind energy potential and cost estimation of wind energy conversion systems (WECSs) for electricity generation in the eight selected locations of Tigray Region (Ethiopia). Renewables: Wind, Water, and Solar, 3(10), 1–15. DOI 10.1186/s40807-016-0030-8. [Google Scholar] [CrossRef]
16. Dagne, A., Worku, A. (2019). Wind energy data analysis and resource mapping of East Gojjam Zone, Amhara Region, Ethiopia. International Journal of Scientific & Engineering Research, 10(3), 1523–1529. [Google Scholar]
17. Hydrochina Corporation (2012). Master plan report of wind and solar energy in the federal democratic republic of Ethiopia. Beijing, China: Beijing Engineering Corporation. [Google Scholar]
18. Admassu, B., Yeneneh, H., Shite, A., Haile, B., Mohammed, S. (2015). Prevalence and identification of major ixodid tick genera of cattle in Dangila District, Awi Zone, North West Ethiopia. Acta Parasitologica Globalis, 6(2), 129–135. DOI 10.5829/idosi.apg.2015.6.2.95108. [Google Scholar] [CrossRef]
19. Tessema, A. G., Gelaye, K. A., Chercos, D. H. (2014). Factors affecting food handling Practices among food handlers of Dangila town food and drink establishments, North West Ethiopia. BMC Public Health, 14(571), 1–5. [Google Scholar]
20. Bruce, H., Bailey, L., Scott, L., Daniel, W., Michael, J. et al. (1997). Wind resource assessment handbook: Fundamentals for conducting a successful monitoring program. National Renewable Energy Laboratory. [Google Scholar]
21. Lange, B., Højstrup, J. (2001). Evaluation of the wind-resource estimation program WAsP for offshore applications. Journal of Wind Engineering and Industrial Aerodynamics, 89(3–4), 271–291. DOI 10.1016/S0167-6105(00)00082-9. [Google Scholar] [CrossRef]
22. Petersen, E. L. (1998). Wind atlas analysis and application program (WASPGetting started, 2nd edition, vol. 1. Roskilde: Risø National Laboratory. [Google Scholar]
23. Roach, S., Park, S. M., Gaertner, E., Manwell, J. (2020). Application of the new IEC international design standard for offshore wind turbines to a reference site in the massachusetts offshore wind energy area. Journal of Physics: Conference Series, 1452(1), 12038. DOI 10.1088/1742-6596/1452/1/012038. [Google Scholar] [CrossRef]
24. Mortensen, N. G., Heathfield, D. N., Myllerup, L., Landberg, L., Rathmann, O. S. et al. (2005). Wind atlas analysis and application program: WAsP 8 help facility. Roskilde: Risø National Laboratory. [Google Scholar]
25. Zhang, M. H. (2015). Wind resource assessment and micro-siting: Science and Engineering. First edition. Singapore: John Wiley & Sons Singapore Pte., Ltd. [Google Scholar]
26. Samorani, M. (2013). The wind farm layout optimization problem, pp. 21–38. Berlin Heidelberg: Springer-Verlag. DOI 10.1007/978-3-642-41080-2. [Google Scholar] [CrossRef]
27. Gylling, N., Petersen, L. (1999). Wind atlas analysis and application program (WAsP), 4th edition, vol. 3. Denmark: Risø National Laboratory. [Google Scholar]
28. Katsigiannis, Y. A., Stavrakakis, G. S., Pharconides, C. (2013). Effect of wind turbine classes on the electricity production of wind farms in Cyprus Island. Conference Papers in Energy, 2013(5), 1–6. DOI 10.1155/2013/750958. [Google Scholar] [CrossRef]
Cite This Article
 Copyright © 2022 The Author(s). Published by Tech Science Press.
This work is licensed under a Creative Commons Attribution 4.0 International License , which permits unrestricted use, distribution, and reproduction in any medium, provided the original work is properly cited.
 Downloads
 Citation Tools