 | Energy Engineering |  |
DOI: 10.32604/ee.2022.019625
ARTICLE
Improving the Thermal Efficiency and Performance of Refrigeration Systems: Numerical-Experimental Analysis of Minimization of Frost Formation
1Federal University of Technology–Parana (UTFPR), Curitiba, Brazil
2Federal University of Technology–Parana (UTFPR), Guarapuava, Brazil
3University of Campinas (UNICAMP), Campinas, Brazil
4Federal University of Technology–Parana (UTFPR), Ponta Grossa, Brazil
*Corresponding Author: Thiago Antonini Alves. Email: antonini@utfpr.edu.br
Received: 02 October 2021; Accepted: 04 April 2022
Abstract: The frost growth on cold surfaces in evaporators is an undesirable phenomenon which becomes a problem for the thermal efficiency of the refrigeration systems because the ice layer acts as a thermal insulation, drastically reducing the rate of heat transfer in the system. Its accumulation implies an increase in energy demand and a decrease in the performance of various components involved in the refrigeration process, reducing its efficiency and making it necessary to periodically remove the frost, resulting in expenses for the defrost process. In the present work, a numerical-experimental analysis was performed in order to understand the formation process of porous ice in flat plates with different surface treatments and parameters. This understanding is of utmost importance to minimize the formation of porous ice on cold surfaces and improve equipment efficiency and performance. In this context, a low-cost experimental apparatus was developed, enabling an experimental analysis of the phenomenon under study. The environmental conditions evaluated are the temperature of the cold surface, room temperature, humidity, and air velocity. The material of the surfaces under study are aluminum, copper, and brass with different surface finishes, designated as smooth, grooved (hydrophilic), and varnished (hydrophobic). The numerical-experimental analysis demonstrates measurements and simulations of the thickness, surface temperature, and growth rate of the porous ice layer as a function of the elapsed time. The numerical results were in good agreement with the experimental results, indicating that the varnished surface, with hydrophobic characteristics, presents greater difficulty in providing the phenomenon. Therefore, the results showed that application of a coating allowed a significant reduction on the frost formation process contributing to the improvement of thermal efficiency and performance of refrigeration systems.
Keywords: Frost layer growth; frost thickness; minimization of frost; hydrophobic surface; refrigeration systems
Nomenclature
| Bi | Biot number |
| Bim | Biot number to mass transfer |
| cp | specific heat at constant pressure [J/(kg K)] |
| d | surface diameter of the porous ice layer |
| D | water vapor diffusion coefficient in the air |
| hc | convection heat transfer coefficient [W/(m2 K)] |
| hm | convection mass transfer coefficient [m/s] |
| hsg | sublimation enthalpy [kJ/mol] |
| Ja | Jakob number |
| K | thermal conductivity [W/(m K)] |
| water vapor phase change rate [kg/s] | |
| Nu | Nusselt number |
| P | pressure [Pa] |
| q | heat flux [W/m2] |
| t | time [s] |
| T | temperature [K] [°C] |
| u, v | air velocity [m/s] |
| w | absolute humidity of the air [kgwater/kgdry air] |
| Greek Symbols | |
| α | thermal diffusivity [m2/s] |
| σ | surface energy [J/m2] |
| δ | ice thickness [mm] |
| ε | porosity of volumetric fraction |
| θ | surface contact angle [°] |
| μ | dynamic viscosity [Pa s] |
| ρ | specific mass [kg/m3] |
| σ | interfacial energy [kJ/m2] |
| φ | source term [J] |
| ∂ | partial derivative |
| λ | factor referring to flow turbulence |
| τ | tortuosity |
| υ | kinematic viscosity [m2/s] |
| Ф | relative humidity of the air [%] |
| Subscripts | |
| air | air |
| β | solid phase |
| c | cold |
| conv | convection |
| eff | effective |
| dz | differential of the coordinate on the normal shaft the flat plate |
| γ | gas phase |
| f | frost |
| sat | saturated |
| tr | transition |
| Superscripts | |
| * | dimensional |
The formation of porous ice is a physical phenomenon that occurs when the flow of the mixture formed by air and water vapor comes into contact with surfaces that have temperatures below 0°C. Examples of applications where this phenomenon occurs are aircraft wings, refrigeration system evaporators, compressor rotors, cryogenic liquid transfer and storage, and many others [1]. The equipment used in the most diverse types of refrigeration segments, whether commercial or industrial, works with evaporation temperatures close to −10°C, favoring the generation and accumulation of porous ice (frost) on the surface of the devices used in the process of cooling [2].
When the formation of the frost layer occurs on a heat exchanger this phenomenon becomes a problem for the thermal efficiency of the system because the ice layer acts as a thermal insulation, drastically reducing the rate of heat transfer in the cooling system. This fact is aggravated over time, as the thickness of the ice layer increases and thus the airflow decreases, according to Liu et al. [3] in some exceptional cases the layer increases to the point of completely blocking the airflow in the heat exchanger. Avoiding ice accumulation in heat exchangers is essential for the proper functioning of the system. According to Wu et al. [4], the frost layer in heat exchangers not only increases thermal resistance, but also reduces airflow causing a drop in performance in heat exchangers.
Every refrigeration system is impaired if the heat exchanger does not work properly; preventing the formation of ice buildup in the heat exchanger is essential for the proper functioning of any refrigeration system. New energy efficiency programs are increasingly tight on the efficient use of energy sources, with actions requiring manufacturers to develop new products with high performance and low energy demand [5].
Kinsara et al. [6] investigated the possible reduction in the formation of porous ice in evaporators, dehumidifying the air through a dehumidification system using a hygroscopic substance capable of absorbing water. They concluded that the system under investigation was somewhat unviable, as it has a high cost for smaller applications.
Cai et al. [7] analyzed the effects of surface energy on the phase change of water vapor in the first stage of the growth of porous ice, carrying out tests on two surfaces, coated with copper and wax, respectively, to find an effective method of restricting the growth of frosts. The results indicate that the wax coating restricts the growth of the porous ice layer, presenting a lower height and density when compared to the surface coated with copper.
Other studies have investigated the application of coatings made of hydrophobic substances (which do not dissolve in water or repel it) and hydrophilic substances (which have an affinity for and are soluble in water), as methods to prevent the formation of porous ice.
Liu et al. [3] investigated experimentally the anti-frosting performance of a paint made up of hydrophilic and polymeric substances. The growth of the porous ice layer was monitored, with a metallic plate as a cold surface, half of which was covered by the paint. The results showed that the start of the nucleation phase was delayed by 15 min with a reduction of at least 40% in the thickness of the porous ice layer, proving the effectiveness of the proposed coating.
Liu et al. [8] concluded in their studies that changes in the surface energy of the cooling plate are a viable way to alter the properties of porous ice and modify the formation of crystals, which can originate weaker or looser ice sheets, easily removed.
Kim et al. [9] investigated the characteristics of porous ice formation by comparing surfaces with hydrophilic (polyacrylate resin), hydrophobic (fluorinated resin), and uncoated (neutral) coatings. The authors concluded that the coatings provided a delay in the formation of porous ice on both surfaces, however, in the case of the hydrophobic surface, the effect was negligible, while for the hydrophilic one, a thinner and denser ice layer was obtained.
Hermes et al. [10] proposed the model along with experimental data obtained in-house to validate a semiempirical modeling approach for predicting frost accretion on hydrophilic and hydrophobic substrates. An algebraic expression for the frost thickness as a function of the time, the modified Jakob number, the Sherwood number, the humidity gradient, and the surface contact angle was devised from the frost formation theory. When compared to the experimental data for the frost thickness, the proposed semiempirical model showed errors within ±15% bounds and an average predictive error of 11.7%. Since the model carries the contact angle as an independent parameter, a sensitivity analysis of the frost growth rate about it is also reported.
Amini et al. [11] investigate the frost formation and flow over a fin and tube heat exchanger due to natural convection for various conditions of relative humidity, air ambient temperature, and mean refrigerant temperature. The results include frost deposition, steps of frost formation, and its effect on heat transfer rate for different conditions. The results show that frost is formed only on the tip of the fins with higher thickness from top to bottom due to the small distance between the fins. Frost causes air trapping which increases the thermal resistance and reduces heat transfer in the system.
Niroomand et al. [12] investigated an experimental study on the formation of ice on a plate under natural convection. Frost thickness, mass, density, and surface roughness were measured during each test. The effect of operating conditions (plate temperature, room temperature, and relative humidity) on the properties of the ice was investigated. In this work, it was shown that the surface roughness of the ice is related to the shape of the ice layer, porosity, and density. It has also been found that the temperature of the plate significantly affects the roughness of the frozen surface; as the temperature of the plate decreases, the ice layer has a high average roughness and negative asymmetry, which corresponds to a low density and highly porous ice layer. The increase in humidity and air temperature slightly affects the average surface roughness, but not the distortion of the frozen surface.
Amer et al. [13] studied the influence of contact angle on the freezing process of water droplets on cold surfaces under natural convection. It was found that it effectively affects the way ice crystals grew as well as the freezing time, being directly proportional. The contact angle is a macroscopic parameter that determines the microstructure that the ice will assume in the porous layer [14].
Wang et al. [15] investigated an experimental study that examines the effect of ultrasonic vibration on ice formation under a convective environment. It was found that the increase in relative humidity increased the thickness of the ice and influenced the property of the ice. The test results indicated that non-contact vibration does not affect ice formation.
A large number of studies have been carried out in recent years, to characterize the phenomenon of formation and accumulation of porous ice (frost). However, it appears that the minimization mechanisms are not yet fully known and that new attempts and assumptions must be made, to assess the real effectiveness of the use of coatings or minimization methods. The general objective of this study is to perform a numerical-experimental analysis of the use of coatings on flat surfaces to ascertain the minimization of the formation of the porous ice layer. This understanding is of utmost importance to improve refrigeration equipment efficiency and performance.
The mathematical formulation of the porous ice formation in flat plates, based on the models developed by Sedano [16] and Tao et al. [17], present in Biglia [5]. The formation of pore ice can be divided into three stages:
i) period of crystal growth;
ii) period of pore ice layer growth;
iii) period of intense growth of the porous ice layer.
Tao et al. [17] subdivide the formation process based on the last two stages as:
i) one-dimensional crystal growth;
ii) crystal branching and formation of the porous layer.
The parameter called transition time (ttr), which establishes the beginning and the end of each stage and indicates the transition between them, is used to perform the mathematical formulation of this phenomenon. It can be subdivided into two stages:
i) formation of ice cores;
ii) one-dimensional growth.
Each stage has a specific mathematical modeling. In the second stage, where crystal branching occurs, the ice is considered to be porous, increasing the complexity of the modeling. To solve the equations governing this stage, the volumetric averaging technique developed by Whitaker [18] for modeling the drying process in porous media was used.
2.1.1 Modeling the First Stage of the Frost Formation Process
In the first stage of pore ice formation, nuclei are formed, with one-dimensional growth in the direction perpendicular to the surface. The short duration of this stage does not diminish its importance in the mathematical modeling of the formation process, being a requirement that must be met to reach the second stage, whose influence will be noticeable only in the second stage.
In the formation process of this phenomenon, heat and mass transfer happen simultaneously; consequently, the governing equations for this stage are obtained from heat and mass balances. Eqs. (1) and (2) represent the mathematical modeling of the first stage of the pore ice formation process, which is considered to be one-dimensional.
i) Energy Equation:
ii) Diffusion Equation:
2.1.2 Modeling the Second Stage of the Frost Formation Process
In modeling this stage, the model developed by Whitaker [18] for porous media is used, based on local volumetric averaging. The mathematical formulation of the phenomenon of porous ice formation in the second stage is developed from the basic equations governing the heat and mass transport phenomenon. Eqs. (3) and (4) correspond to the model of the second stage of the porous ice formation process.
i) Ice Phase Continuity Equation (β):
ii) Gas Phase Diffusion Equation (γ):
The program was implemented in Python using the Jupyter Notebook Environment, which consists of an open-source application (BSD license) that allows the creation and resolution of routines that contain iterative codes and equations, as well as obtaining graphics (Matplotlib). The equations that model the first stage of the pore ice layer growth are solved using finite differences. To develop the discretization, the Finite Difference Method is used centered on the derivative in space and intermediate points, and implicit formulation for the transition time. Applying a fixed mesh, the values of the properties are interpolated to each new position of the boundary, through the Spline Method, which is an approximation technique, by means of polynomial interpolation, where the interval of interest is divided into several subintervals, which are interpolated with polynomials of smaller degrees.
i) Discretization of the Energy Equation:
ii) Discretization of the Diffusion Equation:
The differential equations that model the second stage are again solved using the Finite Difference Method. Centered finite differences are used for the derivatives in space and, for the intermediate points, the Upwind Technique is used for the time derivative. A fixed mesh is used, as before, and the values of the variables and properties under study are interpolated to each of the new boundary positions, the differential equations are solved by iterations, until a difference equal to or less than 10−5 is obtained between the values of the variables in two successive iterations.
i) Discretization of the Energy Equation:
ii) Discretization of the Gas Phase (Vapor) Diffusion Equation:
iii) Discretization of the β-Phase Continuity Equation:
The flowcharts of the solution algorithms for the first and second stage of porous ice formation are illustrated in simplified form in Figs. 1a and 1b, respectively.
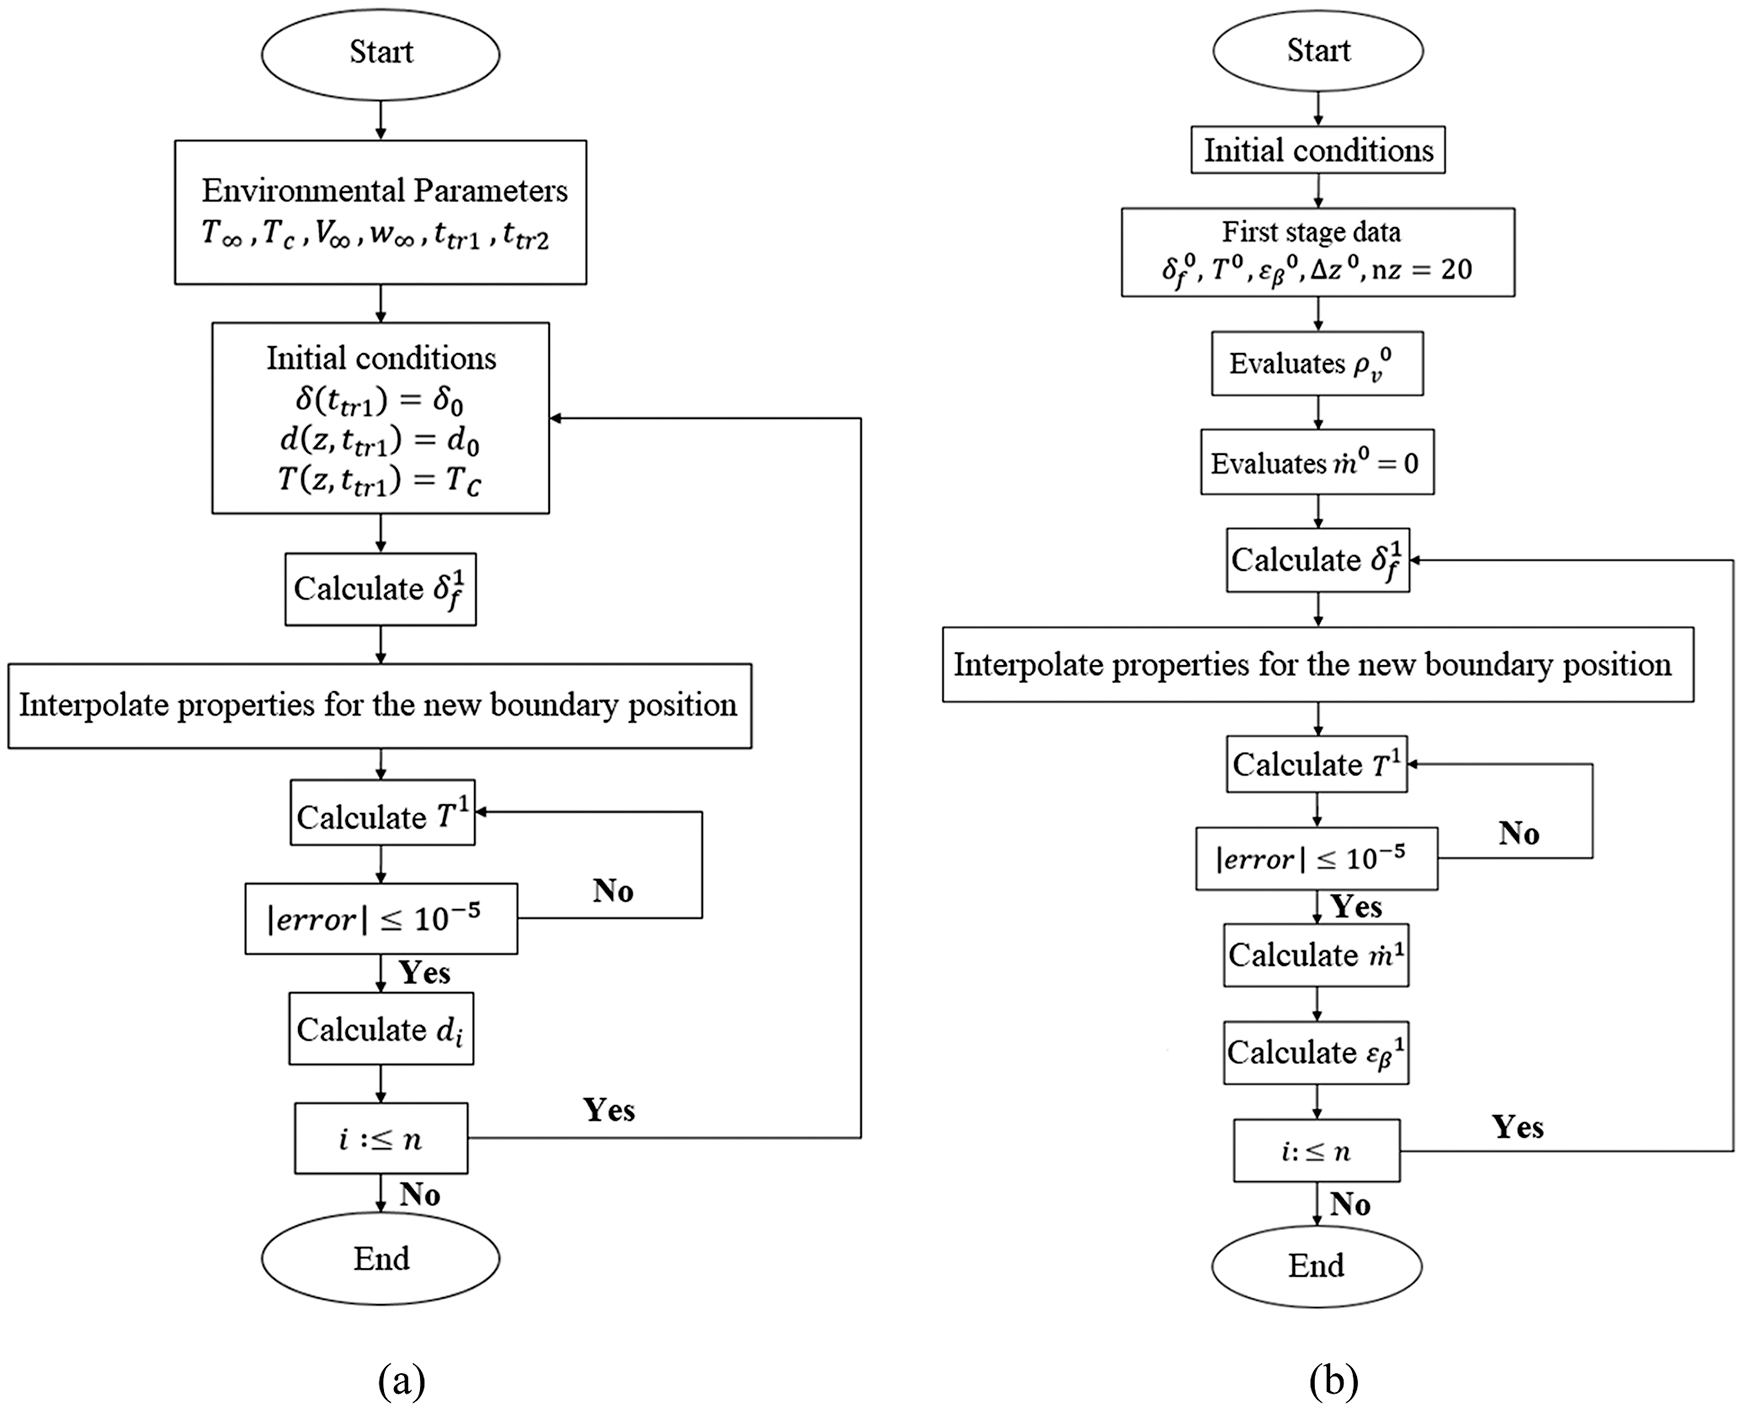
Figure 1: Flowchart of the solution algorithm of porous ice formation: (a) 1st stage and (b) 2nd stage
The experimental apparatus according to Fig. 2, consists of a test section, which contains a Peltier TEC1-12706 thermoelectric chip, a finned heat sink with Cooler MasterTM Hyper T4 heat pipes, a KeysightTM 34970A data acquisition system with a KeysightTM 34901A multiplexer with 18 channels, a KeysightTM U8002A power supply, a SonyTM Cyber-Shot DSC-W530 Digital Camera with 14.1 MP and 90 DPI, a PolaroidTM tripod, a DellTM notebook and an NHSTM UPS. The test section consists of an acrylic box (casing), an aluminum support base and a MultilaserTM axial fan. A schematic of the experimental apparatus is shown in Fig. 3.
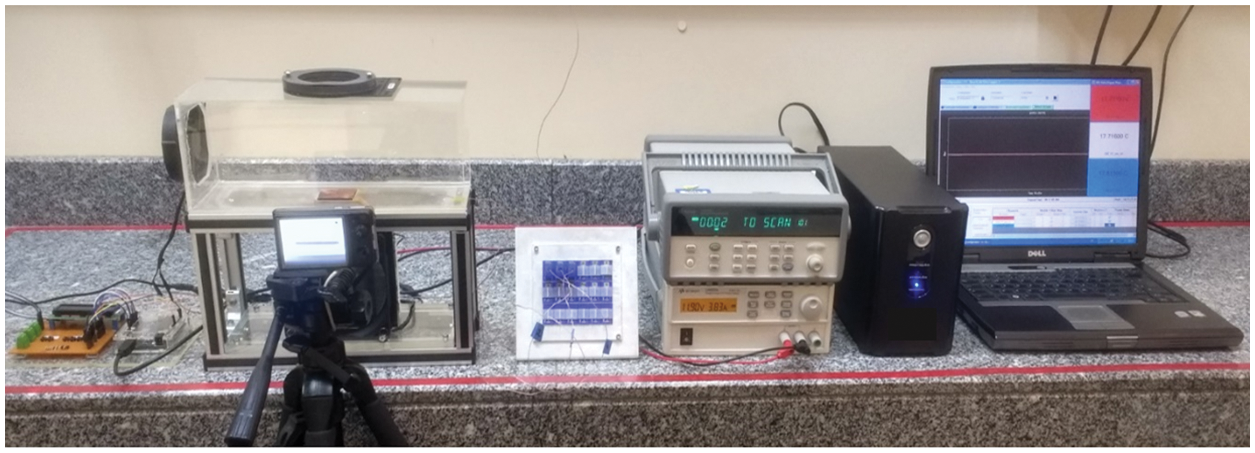
Figure 2: Experimental apparatus
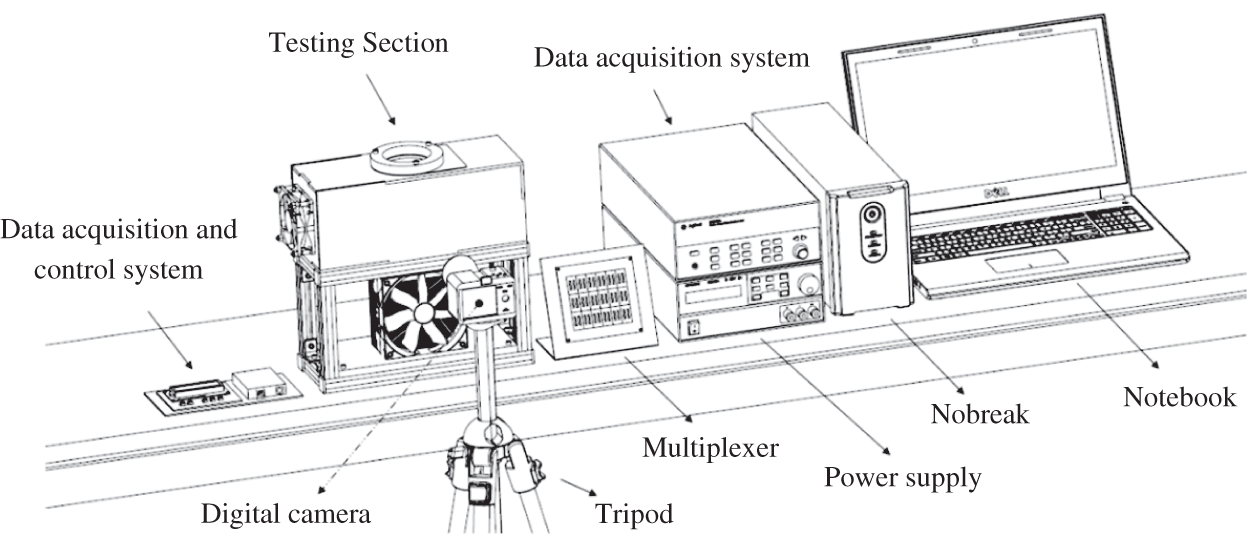
Figure 3: Experimental apparatus scheme
The methodology used in the experimental procedures can be divided in 10 steps, which are the following:
#1) isolating the testing environment;
#2) turning on the cooling, control and data acquisition systems;
#3) waiting the required interval of time for the environmental parameters to be in the steady conditions;
#4) fixating the sample plate to be tested through the use of thermal paste;
#5) turning on the electrical components of the experimental apparatus, fixating the inner air velocity in 0.5 m/s through the control and data acquisition systems;
#6) preparing and checking the measurement systems, such as the digital camera, infrared thermometer, the thermocouples and other sensors;
#7) performing the first measurement, time 0;
#8) activating the cold surface through the power source in the voltage of 11.9 V;
#9) performing the measurements in each interval of time of 10 min during the total time of 90 min, collecting all data in a digital spreadsheet;
#10) saving the obtained data for analysis with the specifics of the sample plate being tested.
The flat surfaces used in the experiments consist of square plates of aluminum, copper, and brass, with a 40 mm edge and 2 mm thick. Having different surface finishes: smooth (Sample I), grooved (Sample II, hydrophilic), and varnished (Sample III, hydrophobic), as shown in Table 1 and Fig. 4. The objective of this experimental study is to analyze the formation and growth of porous ice on cold surfaces by comparing different surface and material treatments.

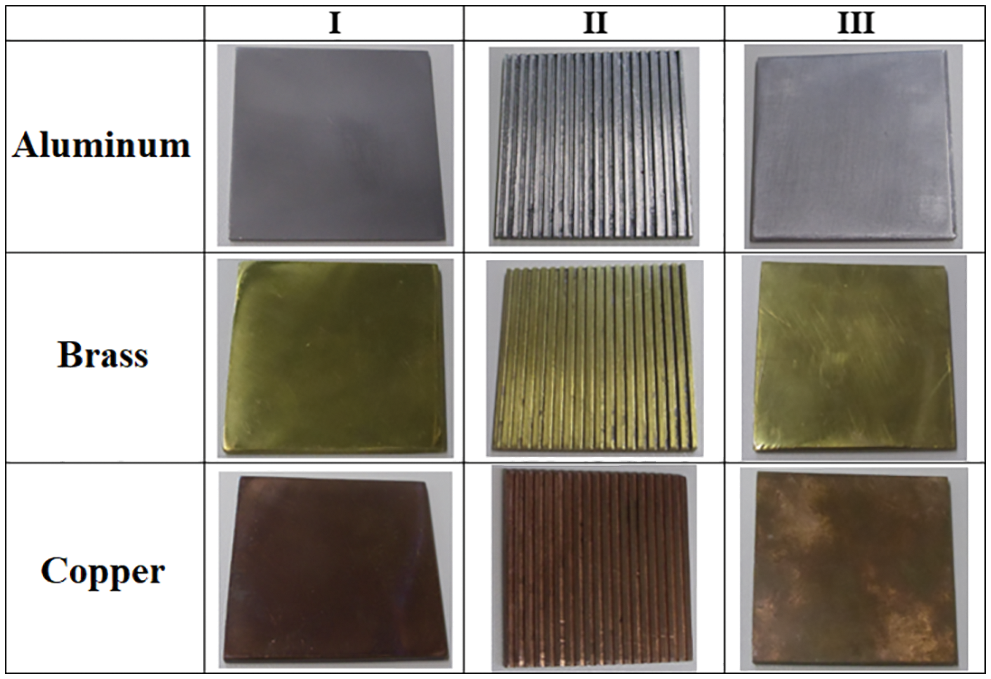
Figure 4: Flat plates used
In order to prepare the square samples, they were initially cut 40 mm wide. Then, they were grinded with silicon carbide sandpaper with a successively smaller grain size, rotating them in 90° in each subsequent sandpaper. The adopted sequence was 180, 220, 320, 400, and #600 mesh, using the maximum rotation available in the equipment, aiming to eliminate risks and marks existent in the samples surfaces. After the grinding process, the samples were cleaned with water and then ethylic alcohol, in order to made the surface free of dust and abrasive traits.
At this point, the stages concerning the surface treatment given to the smooth defined surface (Sample I) were finished. The grooved plates (Sample II) were obtained by the milling process containing grooves with 1 × 1 mm along the plate. Finally, the Sample III received a varnish layer generating the hydrophobic surface.
The experimental uncertainties analysis was associated with the uncertainties of the frost thickness, temperatures, humidity, air velocity and time. The data collected in the experimental tests have the uncertainties shown in Table 2.

The experimental results presented refer to the thickness, the surface temperature, and the growth rate of the ice layer on aluminum, copper, and brass flat plates, with different surface treatments (smooth plate, hydrophilic surface, and hydrophobic surface), in the time interval of 10 min during 90 min.
For the analysis of the frost thickness, the software ImageJ© was used in the treatment of the images, setting the same measurement scale according to the specifications of the digital camera used, such as resolution and DPI (dots per inch), which provides the width and height of the image file, in order to enable the conversion of length, in this case the height, in pixels into millimeters, and subsequently allowing the superimposition of all images, having as reference the initial time, as exemplified by Fig. 5.

Figure 5: Formation of the porous ice layer in time
Fig. 6 shows the experimental results obtained comparing the aluminum, brass, and copper samples, without specific surface treatment, with the environmental parameters presented in Table 3.
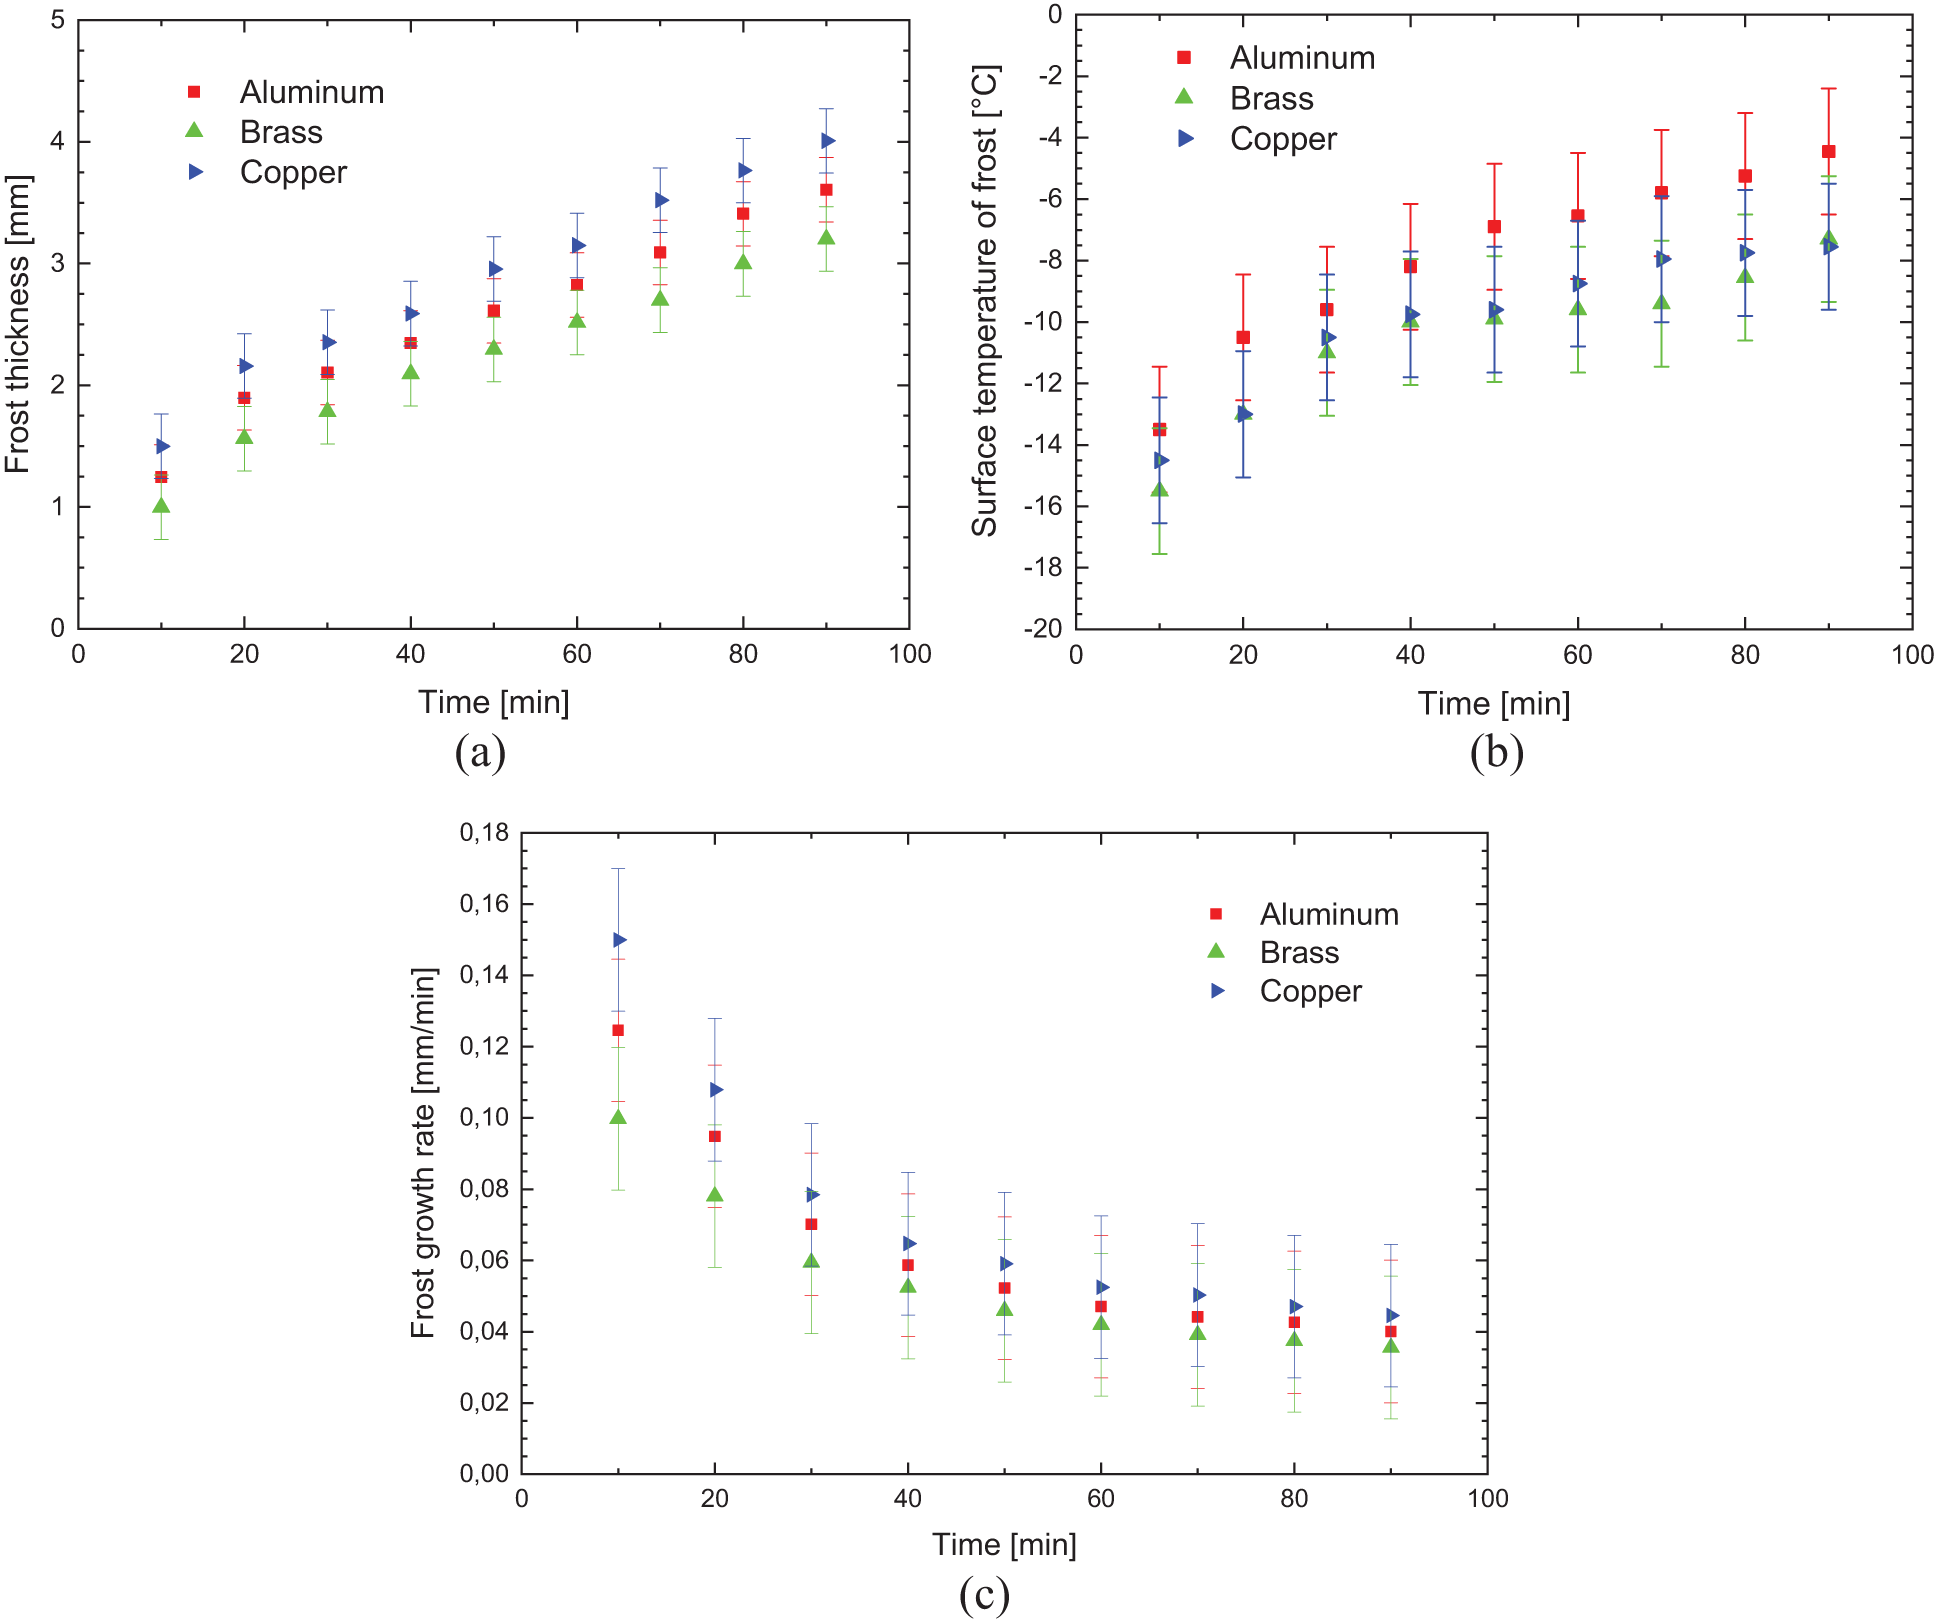
Figure 6: Experimental variation of: (a) frost thickness, (b) surface temperature, and (c) frost growth rate-without specific surface treatment

The results presented in Fig. 6 show good agreement regarding the behavior of the increase in the thickness of the porous ice layer due to time, with the results published in literature by Liu et al. [19] and Sommers et al. [20].
Fig. 7 shows the experimental results obtained comparing the aluminum, brass, and copper in the grooved sample (hydrophilic surface), with the environmental parameters presented in Table 4.
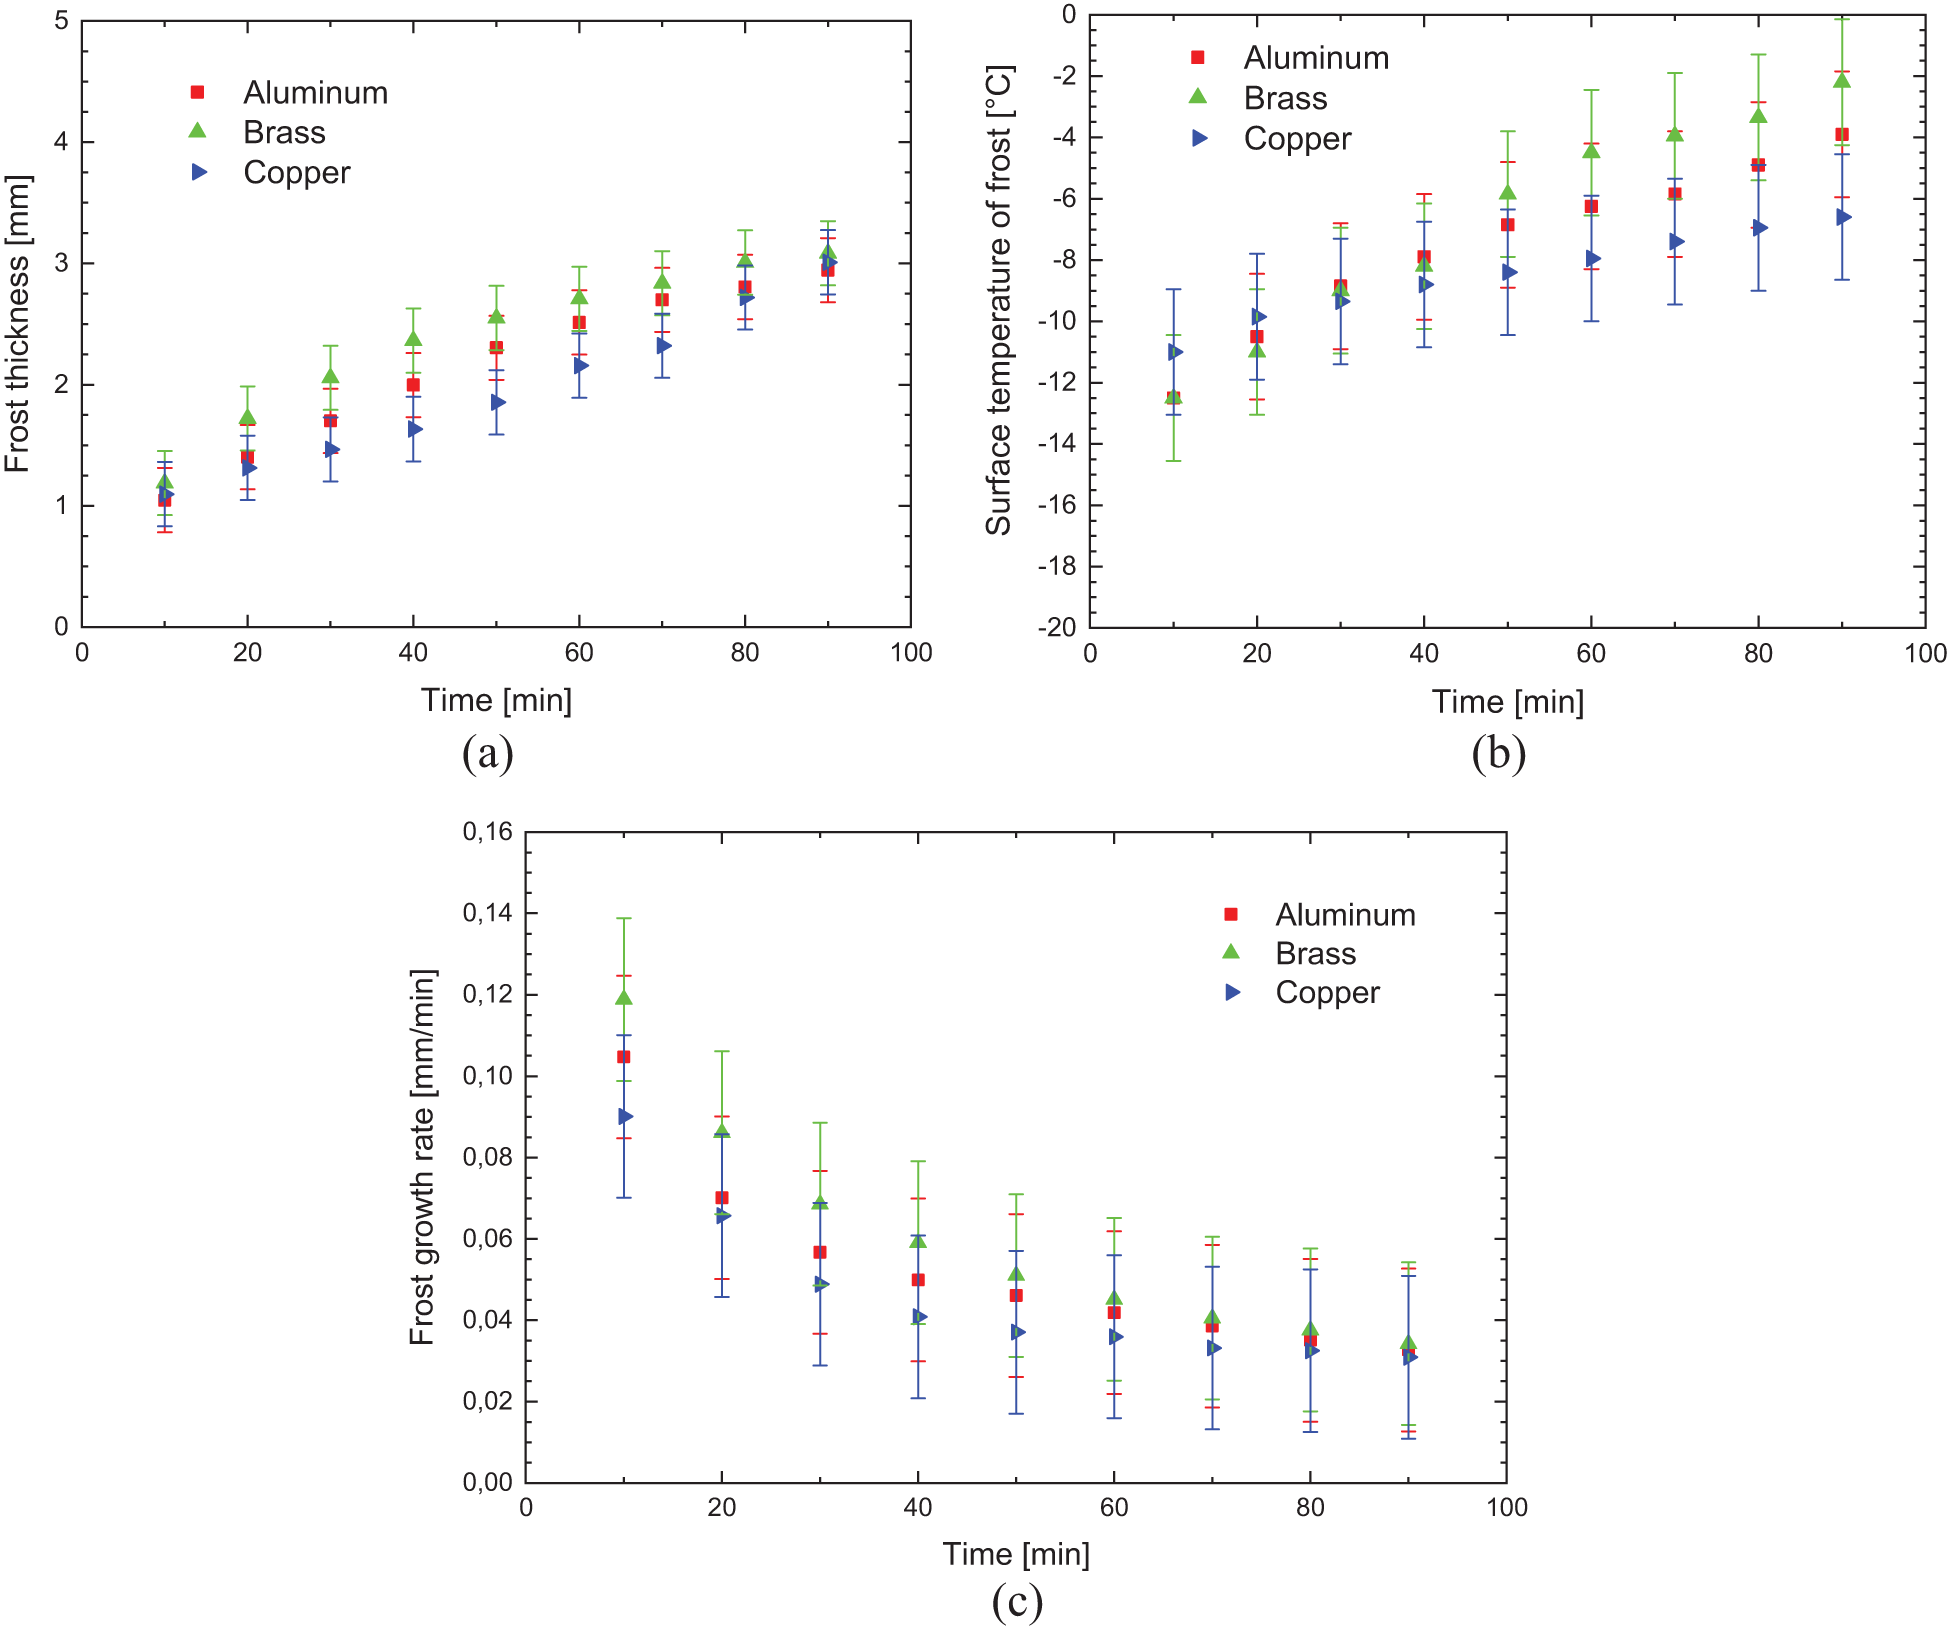
Figure 7: Experimental variation of: (a) frost thickness, (b) surface temperature, and (c) frost growth rate-hydrophilic surface

During the formation and increase of the thickness of the porous ice layer, the thermal conductivity of the flat surface material has a great influence on the convection heat transfer process that occurs between the cold surface and the fluid flow, intensifying the exchange by increasing the thermal conductance and decreasing the thermal resistance.
Fig. 8 shows the experimental results of the hydrophobic surface for flat plates of different materials, with the environmental parameters presented in Table 5.
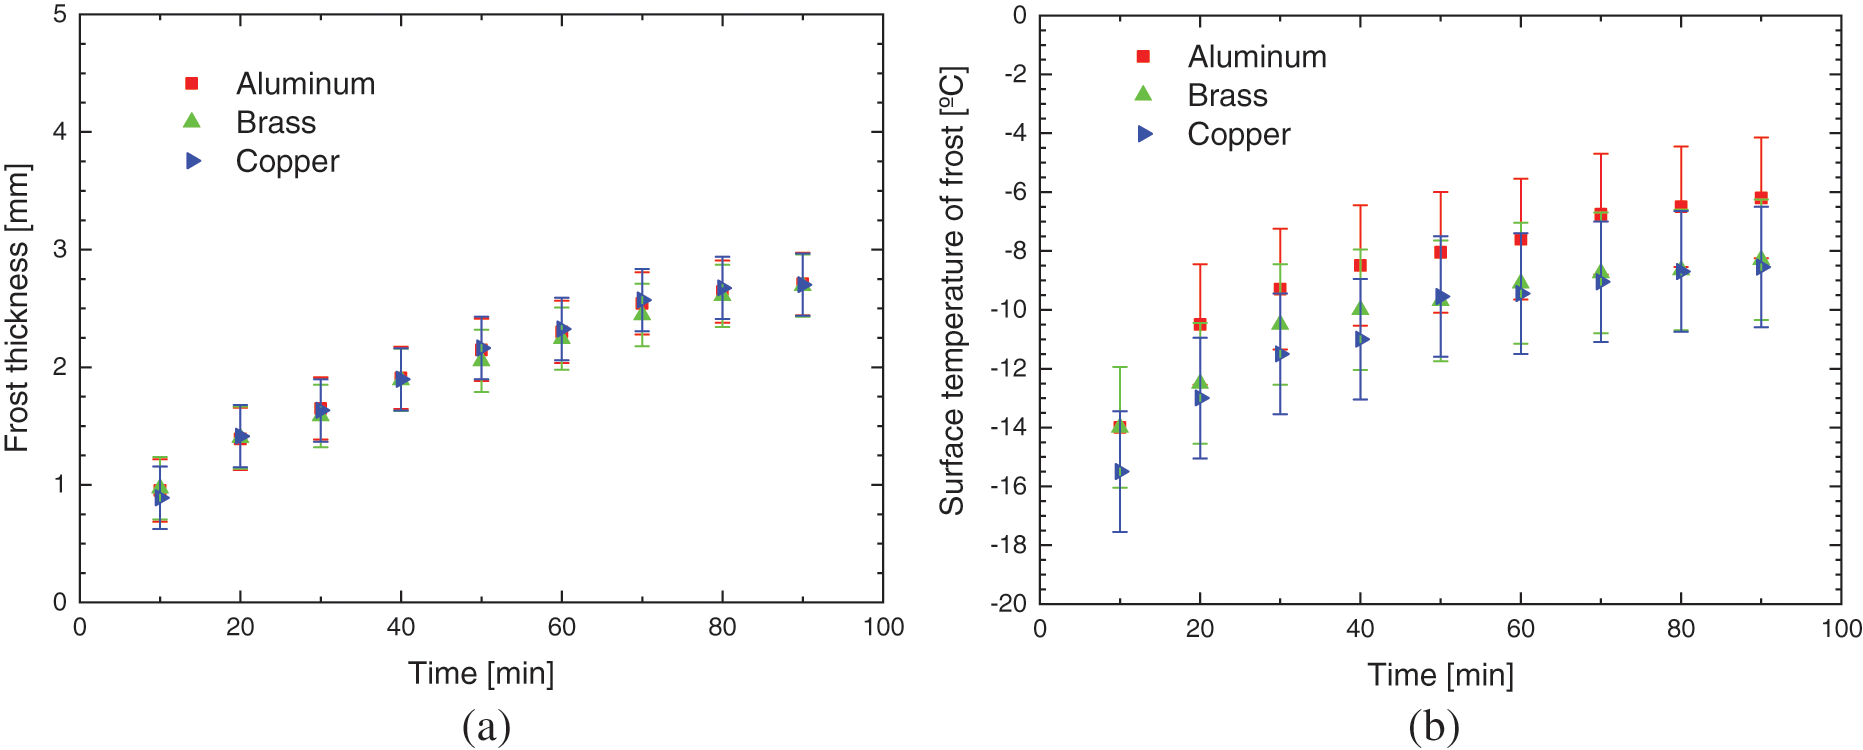
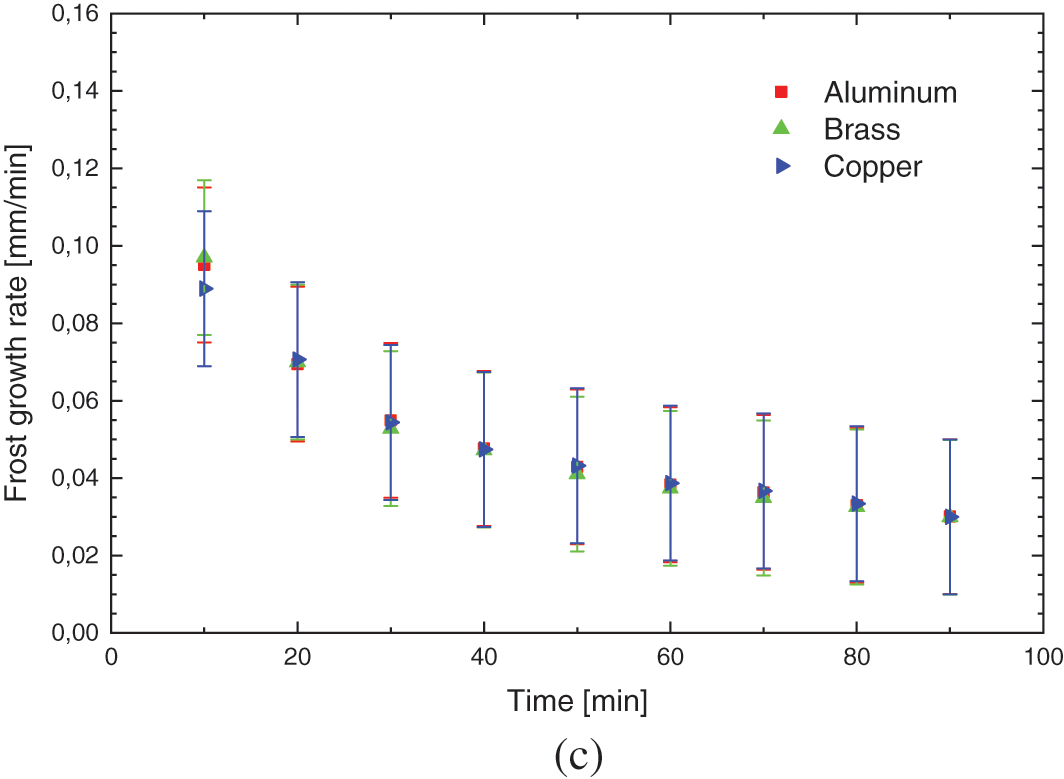
Figure 8: Experimental variation of: (a) frost thickness, (b) surface temperature, and (c) frost growth rate-hydrophobic surface

The increase in the thickness of the porous ice layer on all surfaces occurs in the same way, with small deviations, indicating that varnishing, hydrophobic surfaces, can provide its characteristic behavior to the phenomenon, regardless of the base material used, transferring its thermal characteristics.
Fig. 9 illustrates the comparison between the three surface treatments with porous ice thickness, for aluminum, copper, and brass based materials, respectively. It shows that regardless of the base material, the smooth and varnished samples present similar behaviors; in the case of smooth, keeping close values, then in the case of varnished ones, having both coherence and repeatability. In the case of grooved samples, it can be seen that in the behaviors presented there is no rationality or logic regarding possible influences caused by basic materials or environmental parameters used, with no possibility for predictions, as seen on the brass base material, in which the thickness of the porous ice layer is shown greater up to 80 min when compared to the smooth and varnished samples.
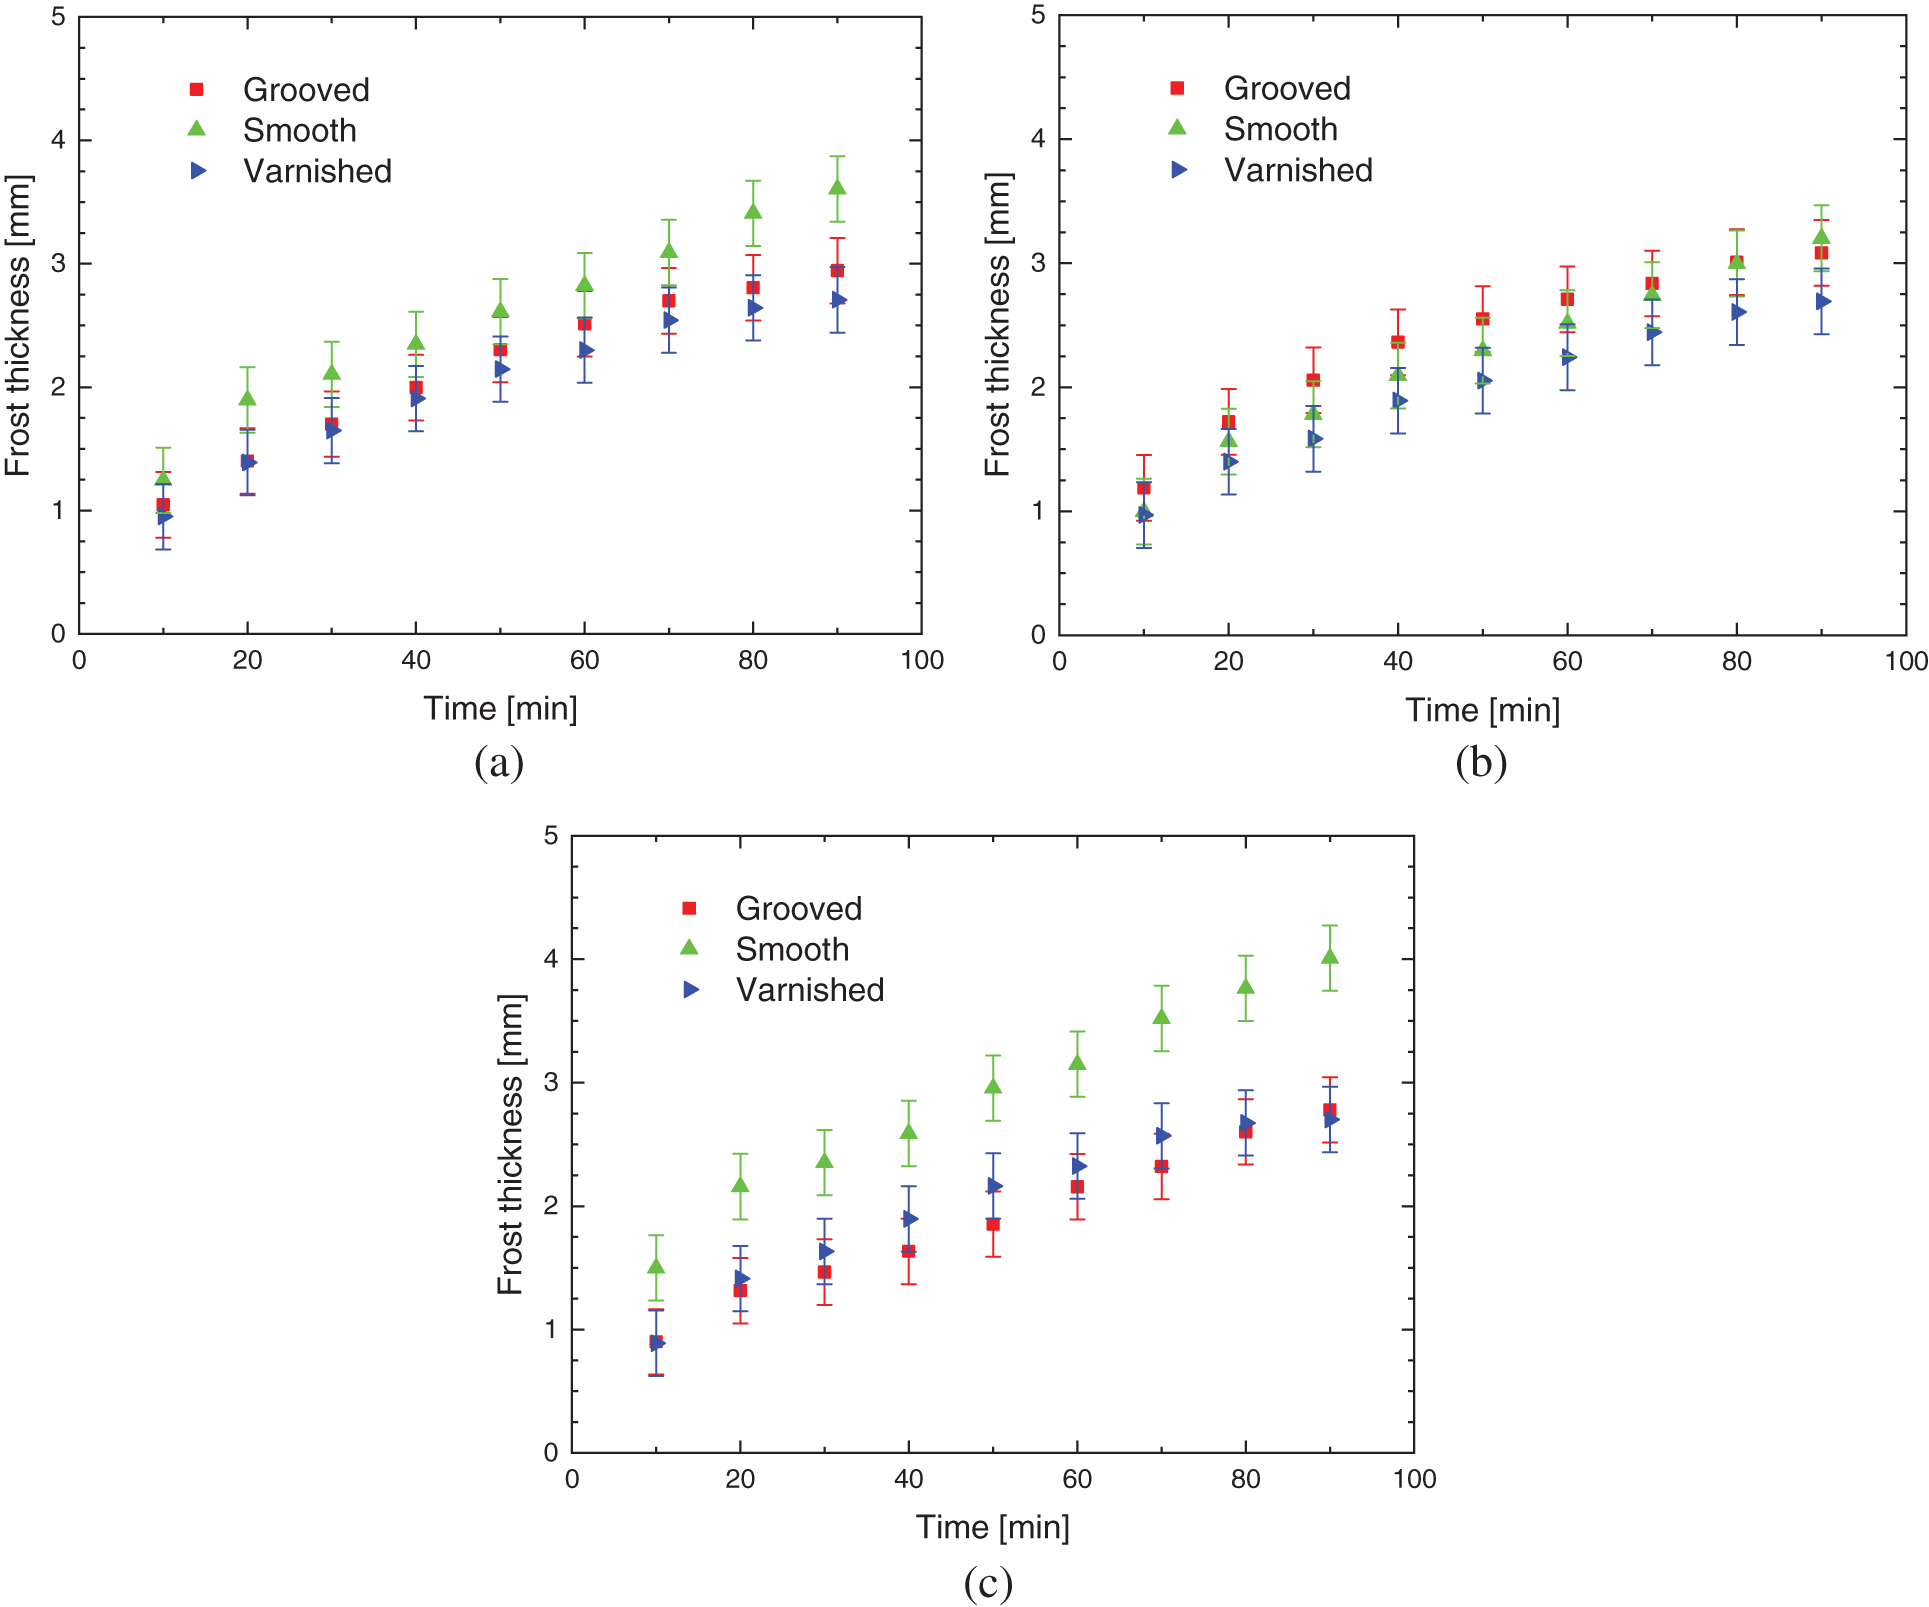
Figure 9: Porous ice thickness for: (a) aluminum, (b) brass, and (c) copper
The numerical data obtained in this study were validated, based on the numerical models proposed by Sedano [16] and Maldonado et al. [1], through the experimental data collected during the tests. Fig. 10 shows the thickness of the porous ice layer according to the base material of the surfaces of the flat plates, in which it is noticed that the behavior is similar to the one obtained experimentally.
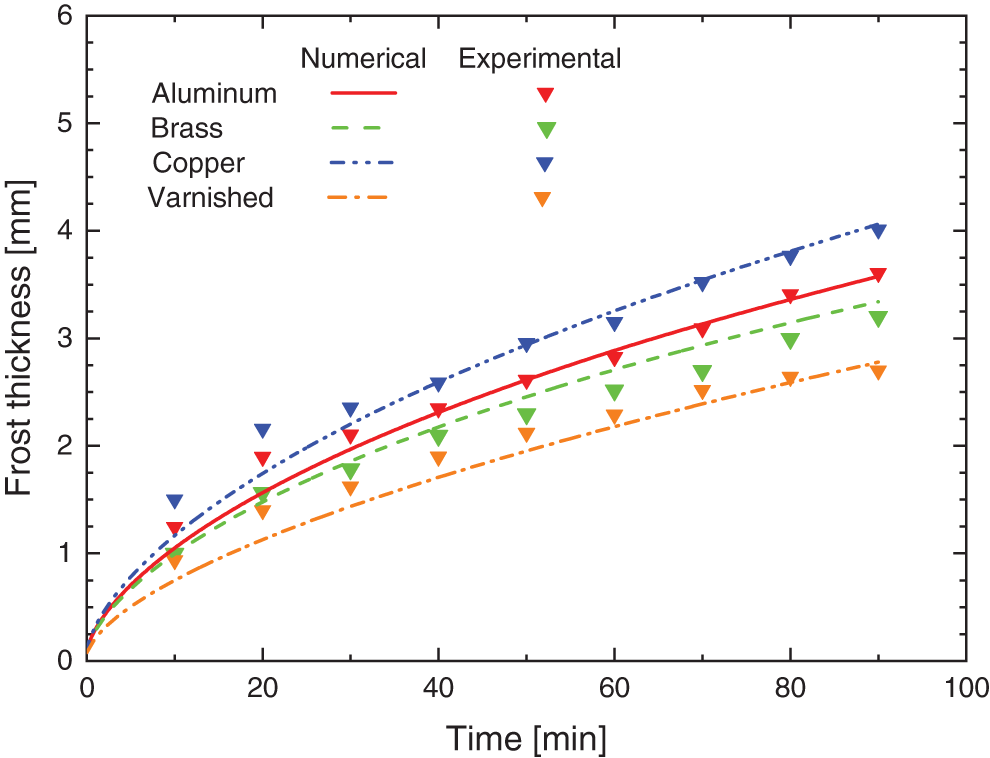
Figure 10: Numerical and experimental comparison for the frost formation
The graph compares the experimental results with those obtained numerically, on smooth surfaces with different materials and a hydrophobic varnished surface, having as the largest percentage difference between the numerical and experimental results ∼24% for the time of 20 min for Sample I of copper. Some differences are noted in the curves that predict the growth of the porous ice layer in the varnished and brass (smooth) samples, showing different behavior to the others. In the case of the brass surface, this is possibly due to the value of the k0,eff used, since there are several alloys, the same one adopted by Rohsenow et al. [21]. For the varnished surface, two possible factors justify the deviations: the value of k0,eff, similarly to the brass surface, but the same being extrapolated on this occasion and also the tendency of stability that is perceived after 70 min have elapsed, emphasizing that after 90 min (fixed time) no experimental tests were performed to validate the model.
Frost growth on the heat exchanger surface can significantly alter the system performance. An experimental and numerical analysis of the porous ice formation process is of utmost importance to avoid this physical problem and improve the thermal efficiency and performance of equipment that are subject to this problem. The present study was aimed at understanding the formation process of porous ice in flat plates with different surface treatments and parameters. This understanding is an important tool to minimize the formation of porous ice on cold surfaces and improve equipment efficiency and performance. A low-cost experimental apparatus was conceived and developed, showing itself capable of providing the phenomenon of porous ice formation on flat surfaces. The environmental conditions evaluated were the temperature of the cold surface, room temperature, humidity, and air velocity. The material of the surfaces under study were aluminum, copper, and brass with different surface finishes, designated as smooth, grooved (hydrophilic), and varnished (hydrophobic). Results showed that application of a coating allowed a significant reduction of formation process of porous ice. The results indicate a good agreement with the literature that describes the behavior of the formation of porous ice and the frost growth rate. Regarding the surface treatments used, the smooth and varnished samples showed coherent behaviors, allowing numerical predictions, a fact not seen in the grooved surfaces. The results indicate that the simple application of varnish, which provides a hydrophobic surface, results in an effective decrease in the layer of porous ice, especially in materials with high thermal conductivity, since it transmits its characteristics and properties to the surface in question. Finally, it is emphasized that this research brings a contribution to science as the numerical and experimental results are compatible with the existing ones in the literature, and can serve as a support for new investigations regarding minimization of frost formation. It is essential to offer contributions about frost formation reduction, since the phenomenon generates unnecessary energy demand, damages the refrigeration equipment and consequently brings financial loss because of maintenance.
Acknowledgement: The authors acknowledge the Federal University of Technology–Parana (UTFPR), Ponta Grossa/Brazil.
Funding Statement: The authors received no specific funding for this study.
Conflicts of Interest: The authors declare that they have no conflicts of interest to report regarding the present study.
References
1. Maldonado, P. A. D., Silva, R. C. R., Salinas, C. T., Biglia, F. M., Antonini Alves, T. (2022). Experimental and numerical study of frost formation with natural convection in a triangular arrangement of slender vertical tubes. Thermal Science and Engineering Progress, 27, 101138. DOI 10.1016/j.tsep.2021.101138. [Google Scholar] [CrossRef]
2. Ismail, K. A. R., Salinas, C., Gonçalves, M. M. (1997). Frost growth around a cylinder in a wet air stream. International Journal of Refrigeration, 20, 106–119. DOI 10.1016/S0140-7007(96)00065-5. [Google Scholar] [CrossRef]
3. Liu, Z., Wang, H., Zhang, X., Meng, S., Ma, C. (2006). An experimental study on minimizing frost deposition on a cold surface under natural convection conditions by use of a novel anti-frosting paint. Part I. Anti-frosting performance and comparison with the uncoated metallic surface. International Journal of Refrigeration, 29, 229–236. DOI 10.1016/j.ijrefrig.2005.05.018. [Google Scholar] [CrossRef]
4. Wu, X., Dai, W., Shan, X., Wang, W., Tang, L. (2007). Visual and theoretical analyses of the early stage of frost formation on cold surfaces. Journal of Enhanced Heat Transfer, 3, 257–268. DOI 10.1615/JEnhHeatTransf.v14.i3.70. [Google Scholar] [CrossRef]
5. Biglia, F. M. (2018). Numerical-experimental analysis of the minimization frost formation on flat plates (in Portuguese) (M.Sc. Dissertation). Department of Mechanical Engineering, Federal University of Technology-Parana, Ponta Grossa, Brazil. [Google Scholar]
6. Kinsara, A. A., Al-Rabghi, O. M., Elsayed, M. M. (1997). Parametric study of an energy efficient air conditioning system using liquid desiccant. Applied Thermal Engineering, 18, 327–335. DOI 10.1016/S1359-4311(97)00037-9. [Google Scholar] [CrossRef]
7. Cai, L., Hou, P. X., Wang, R. H., Zhang, X. S. (2010). Effects of different characteristic surfaces at initial stage of frost growth. Journal of Central South University of Technology, 17, 413–418. DOI 10.1007/s11771-010-0061-z. [Google Scholar] [CrossRef]
8. Liu, Z., Zhang, X., Wang, H., Meng, S., Cheng, S. (2007). Influences of surface hydrophilicity on frost formation on a vertical cold plate under natural convection conditions. Experimental Thermal and Fluid Science, 31, 789–794. DOI 10.1016/j.expthermflusci.2006.08.004. [Google Scholar] [CrossRef]
9. Kim, K., Lee, K. S. (2011). Frosting and defrosting characteristics of a fin according to surface contact angle. International Journal of Heat and Mass Transfer, 54, 2758–2764. DOI 10.1016/j.ijheatmasstransfer.2011.02.065. [Google Scholar] [CrossRef]
10. Hermes, C. J. L., Sommers, A. D., Gebhart, C. W., Nascimento Jr., V. S. (2018). A semi-empirical model for predicting frost accretion on hydrophilic and hydrophobic surfaces. International Journal of Refrigeration, 87, 164–171. DOI 10.1016/j.ijrefrig.2017.09.022. [Google Scholar] [CrossRef]
11. Amini, M., Yaghoubi, M., Pishevar, A. R. (2019). Analysis of frost visualization over a fin and tube heat exchanger by natural convection. Experimental Heat Transfer, 32, 36–50. DOI 10.1080/08916152.2018.1473528. [Google Scholar] [CrossRef]
12. Niroomand, S., Fauchoux, M. T., Simonson, C. J. (2019). Experimental characterization of frost growth on a horizontal plate under natural convection. Journal of Thermal Science and Engineering Applications, 11, 011020. DOI 10.1115/1.4040989. [Google Scholar] [CrossRef]
13. Amer, M., Wang, C. C. (2020). Experimental investigation on defrosting of a cold flat plate via ultrasonic vibration under natural convection. Applied Thermal Engineering, 179, 115729. DOI 10.1016/j.applthermaleng.2020.115729. [Google Scholar] [CrossRef]
14. Huang, L., Liu, Z., Liu, Y., Gou, Y., Wang, L. (2012). Effect of contact angle on water droplet freezing process on a cold flat surface. Experimental Thermal and Fluid Science, 40, 74–80. DOI 10.1016/j.expthermflusci.2012.02.002. [Google Scholar] [CrossRef]
15. Wang, F., Liang, C., Zhang, X. (2016). Visualization study of the effect of surface contact angle on frost melting process under different frosting conditions. International Journal of Refrigeration, 64, 143–151. DOI 10.1016/j.ijrefrig.2016.01.008. [Google Scholar] [CrossRef]
16. Sedano, C. T. S. (1996). Ice formation in flat plate (in Portuguese) (M.Sc. Dissertation). School of Mechanical Engineering, University of Campinas, Campinas/Brazil. [Google Scholar]
17. Tao, Y. X., Besant, R. W., Rezkallah, K. S. (1993). A mathematical model for predicting the densification and growth of frost on a flat plate. International Journal of Heat and Mass Transfer, 36, 353–363. DOI 10.1016/0017-9310(93)80011-I. [Google Scholar] [CrossRef]
18. Whitaker, S. (1977). Simultaneous heat, mass, and momentum transfer in porous media: A theory of drying. Advances in Heat Transfer, 13, 119–203. DOI 10.1016/S0065-2717(08)70223-5. [Google Scholar] [CrossRef]
19. Liu, Z., Gou, Y., Wang, J., Cheng, S. (2008). Frost formation on a super-hydrophobic surface under natural convection conditions. International Journal of Heat and Mass Transfer, 51, 5975–5982. DOI 10.1016/j.ijheatmasstransfer.2008.03.026. [Google Scholar] [CrossRef]
20. Sommers, A. D., Gebhart, C. W., Hermes, C. J. L. (2018). The role of surface wettability on natural convection frosting: Frost growth data and a new correlation for hydrophilic and hydrophobic surfaces. International Journal of Heat and Mass Transfer, 122, 78–88. DOI 10.1016/j.ijheatmasstransfer.2018.01.074. [Google Scholar] [CrossRef]
21. Rohsenow, W. M., Hartnett, J. P., Cho, Y. I. (1998). Handbook of heat transfer. New York: McGraw-Hill. [Google Scholar]
 | This work is licensed under a Creative Commons Attribution 4.0 International License, which permits unrestricted use, distribution, and reproduction in any medium, provided the original work is properly cited. |