| Energy Engineering |
DOI: 10.32604/ee.2022.018677
ARTICLE
A Preliminary Feasibility Study on Wind Resource and Assessment of a Novel Low Speed Wind Turbine for Application in Africa
1African Centre of Excellence, Energy for Sustainable Development, University of Rwanda, Kigali, Rwanda
2School of Engineering, University of KwaZulu Natal, Durban, South Africa
3George W. Woodruff School of Mechanical Engineering, Georgia Institute of Technology, Atlanta, USA
*Corresponding Author: Kehinde Adeyeye. Email: khennade@gmail.com
Received: 10 August 2021; Accepted: 29 October 2021
Abstract: This paper posits that a low-speed wind turbine design is suitable for harnessing wind energy in Africa. Conventional wind turbines consisting of propeller designs are commonly used across the world. A major hurdle to utilizing wind energy in Africa is that conventional commercial wind turbines are designed to operate at wind speeds greater than those prevalent in most of the continent, especially in sub-Sahara Africa (SSA). They are heavy and expensive to purchase, install, and maintain. As a result, only a few countries in Africa have been able to include wind energy in their energy mix. In this paper, the feasibility of a novel low-speed wind turbine based on a Ferris wheel is demonstrated for low wind speed applications in Africa. The performance of Ferris wheel wind turbines (FWT) with 61 m (200 ft), 73 m (240 ft) and 104 m (341 ft) diameter rims and an 800 kW generator are evaluated for selected African cities. The research also compares the Weibull wind distribution of the African cities of interest. A comparison between the FWT and the conventional commercial wind turbines in terms of efficiency, rated wind speed, cost, performance, and power to weight is included. Results show that the FWT has the potential for economic power generation at rated wind speeds of 6.74 m/s, which are lower than the average of 12 m/s for conventional wind turbines and have lower power to weight ratios of 5.2 kW/tonne as compared to 6.0–9.2 kW/tonne for conventional wind turbines.
Keywords: Wind energy; conventional wind turbines; ferris wheel wind turbine; energy access; sub-sahara africa; wind speed
Nomenclature
| A | Swept Area |
| AEP | Annual energy production |
| β | Blade pitch angle |
| CO2 | Carbon dioxide |
| Cp | Coefficient of performance |
| CWT | Conventional wind turbine |
| FWT | Ferris wheel wind turbine |
| GWh | Gigawatt hours |
| HAWT | Horizontal axis wind turbine |
| λ | Blade tip speed ratio |
| kW | Kilowatt |
| MW | Megawatt |
| m/s | Meter per second |
| P | Wind Power |
| Pavail | Power available |
| π | pi (3.141592653…) |
| R | Radius |
| RPM | Revolutions per minute |
| ρ | Air density |
| SSA | Sub Saharan Africa |
| VAWT | Vertical axis wind turbine |
| V | Wind speed |
In recent years, renewable energy has proven to be a sustainable way to generate electricity due to its numerous advantages-it is cheaper, safer, cleaner, healthier, and more sustainable than fossils fuels. Thus, it mitigates the consequences of fossil fuels-global warming, air pollution, acid emissions, and health risks [1,2]. Furthermore, the energy needs of developing nations such as those in Africa are increasing rapidly [3,4]. Modern wind farming does not cause the ecological degradation associated with fossil fuels [5]. The worldwide potential for wind–power generation is colossal. It is viewed by many researchers as the most encouraging renewable energy source for the future [6].
Wind power has seen increased development during the previous decade. It has become a favored energy choice for companies and national governments, which are looking to enhance energy assets, reduce CO2 discharges, and create new businesses and jobs [5,7]. Wind energy offsets the use of non-renewable energy sources, reducing gas emissions from 330 to 590 tons of CO2 for each GWh [8]. It is turning into the world's fastest developing renewable energy source because of the advancement of models of sustainable power sources, the security of energy supply, fuel variety concerns, environmental awareness, and monetary reasons. Its universal adoption as a clean energy source is demonstrated by an increase in total installed capacity [9]. It is a fuel-free energy source that produces power close to load centres thereby reducing losses in transmission lines [10].
Globally, sites with high wind speeds are fewer than sites with lower wind speeds [11], as is common in South Asia and sub-Saharan Africa. Low wind speeds regions are classified as areas with an average wind speeds below 6 m/s measured at 80 m above ground level or 120 m above sea level [12,13]. Most large commercial, conventional wind turbines have cut-in speeds between 3 and 5 m/s–the speed at which they start to generate electricity, cut-out speeds of 25 m/s, which are their maximum operating speeds, and rated output speeds of approximately 15 m/s [14]. Therefore, large wind turbines are installed in areas with high wind speeds while in low wind speed regions, small wind turbines are typical [15,16]. Rather than simply exclude wind power from the potential energy scenario for these regions, there has been emphasis on the design of small wind turbine especially for low wind speed regions [17].
Much of the previous research on harnessing wind energy at lower wind speeds has focused on improving the efficiency of wind turbines by optimizing blade geometry and aerodynamic characteristics [18]. Kidane et al. [19] designed and analysed a 5 kW wind turbine using aerodynamic variables. Murshed, Arafat, and Razzak focused on the analysis of air foils and design of the blades for a 250 W low-speed horizontal axis wind turbine in Bangladesh [20]. Chen et al. [21] optimized the design of low-speed wind turbine blades with a rated power of 600 kW and an average wind speed of 4.3 m/s using aerodynamic characteristics.
Other research works centred on optimizing starting characteristics to overcome inertia. Low wind speeds have high inflow turbulence; therefore, if energy from low-speed wind is to be captured, the system should have excellent starting performance [12]. Kekezoğlu, et al. [22] designed a prototype wind turbine with a cut-in speed of 4 m/s but a lower rated wind speed of 7 m/s. The wind turbine had a modular structure and can be optimized for different conditions and wind sites but was heavier than commercial wind turbines. Other researchers employed software to design small commercial wind turbines. For example, Khan et al. [15] simulated wind turbines of less than 5 m diameter at wind speed ranges of 2 to 5 m/s to optimize their starting behavior at high angles of attack and low Reynolds numbers. They modelled their wind turbines using Pro/E based on optimized designs generated by MATLAB codes. To improve their starting behaviour, they were simulated in ADAMS. Lower cut-in speed wind turbines enable sites with lower wind speeds areas to capture wind energy for power generation [14]. Suresh et al. [23] designed and analysed 2 kW small horizontal axis wind turbine for use in low Reynolds number applications. The aerodynamic analysis of the airfoils was performed using QBlade software.
Lower power commercial wind turbines are designed to operate at relatively high wind speeds, typically between 10 to 15 m/s. As a result, at lower wind speeds, these wind turbines produce insignificant power [24]. As an alternative to small wind turbines, recent research has focused on the design of commercial wind turbines (Fig. 1a) for low wind speeds. The National Renewable Energy Laboratory (NREL) performed a study on the GE 1.5 MW series and indicated significant power gain in the low wind speed regions of Minnesota, USA. These turbines were designed to have low cut-in, rated and cut-out wind speeds. The increase in power production was found to be more pronounced at larger rotor diameters [18]. One can see that there is a great potential for energy harvesting at low wind speeds with significant potential improvements in energy conversion efficiency, yet innovative and fundamental redesign of wind turbines is required in order to improve power extraction [17].
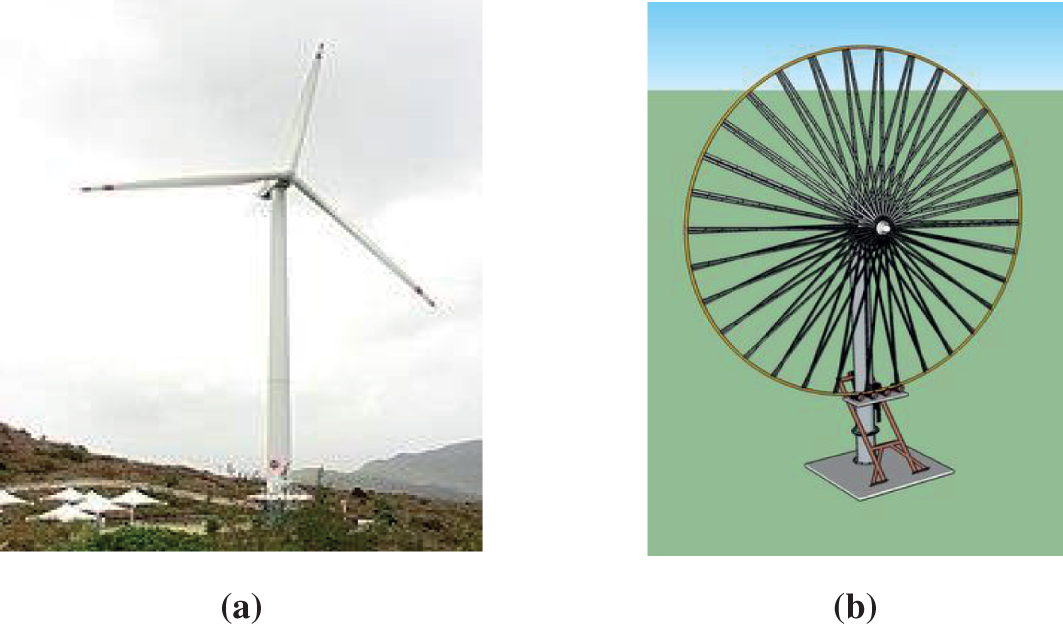
Figure 1: (a) Conventional three blade wind turbine [27] (b): Ferris wheel wind turbine [28]
One such innovative wind turbine–the Ferris wheel wind turbine (FWT)–is presented in this study. The Ferris wheel technology of new turbines (Fig. 1b), as commercialized by Barber Wind Turbines (BWT), addresses the challenges associated with conventional wind turbines and poses to be an improved technology for Africa especially because of its ability to generate power at lower-rated wind speeds. A Ferris wheel is an amusement ride comprising a rotating upright wheel with different traveller-conveying segments connected to the rim so that as the wheel turns, which are kept upright more often than not by gravity [25]. FWTs are a new technology for harnessing wind and hydroelectric power on an industrial scale but have the promise to be the future of wind energy [26]. FWTs are designed based on the principle of the Ferris wheel and are a type of HAWT. The FWT uses direct drive permanent magnet electrical generators.
The FWT functions just like a Ferris wheel, with the blades orbiting in an epicyclic path around the central shaft. There are many advantages to the BWT design; for example, its blades are self-pitching and self-twisting. As the wind passes over a BWT design, its novel air-foil blades are designed to automatically change pitch to maintain an optimal angle of attack to the wind [29]. In addition, it generates less sound, is safer for birds and bats, and can be constructed using locally available materials [28].
Feasibility studies have been carried out to evaluate wind turbines in potential sites and to examine their competitiveness against other existing commercial wind turbines. Al-Addous et al. [30] proposed a 100 MW wind farm in Jordan. They performed a feasibility assessment with Vestas V90 2.0 MW wind turbine. Chaurasiya et al. [31] studied the estimation of wind resource potential and wind turbine characteristics at higher hub height using wind distributions. Offshore wind feasibility study was done in India by Alluri et al. [32]. They studied wind resource to identify potential sites, selection of suitable wind turbines capacity, and arriving at feasible incentives to promote offshore wind Hulio et al. [33] studied the wind power potential of Nooriabad by using wind measurements over a period of one year. They assessed the wind power potential at the measurement site with four wind turbines and presented the most suitable wind turbine The wind resource of northern coastal region of Semarang-Indonesia was analyzed by Premono et al. [34]. They evaluated the performance of a selected commercial wind turbine for electricity generation.
Thus far, research on the feasibility of wind turbine sites has concentrated on horizontal axis wind turbines using Weibull, gamma and Rayleigh wind speed distributions. In this study, we demonstrate the appropriateness of a novel wind turbine based on the Ferris wheel wind turbine technology (FWT) for the conditions prevalent in many regions of Africa especially SSA. The appropriateness of the FWT is determined by assessing the wind resources of select countries and cities using their Weibull wind distribution. This paper proposes that FWT technology can help to harness the huge, untapped wind energy potentials in Africa efficiently and economically. In doing so, it may reduce existing energy difficulties in Africa and boost its economy by increasing electricity availability and accessibility.
The methodology overview (Fig. 2) is as follows:
i. Mathematical Modelling: The equations for the power output, maximum coefficient of performance and swept area of wind turbines are presented.
ii. Geometry: The geometry and the technical specifications of the FWT are discussed. Using the turbine geometry and equations, the rated wind speed of the FWT designs is calculated.
iii. Data Collection: The Weibull distribution wind data for the specific locations to evaluate the FWTs are collected and presented.
iv. Evaluation of the FWT designs: Using the mathematical model, wind turbine geometry and technical specifications, and the wind data, the FWT designs are evaluated in the selected African cities.
v. Comparison between FWT and Conventional Wind Turbines (CWT): FWT and conventional wind turbines are compared terms of performance, cost and power to weight ratio and their coupled effects.
vi. Conclusion: The research findings are presented.
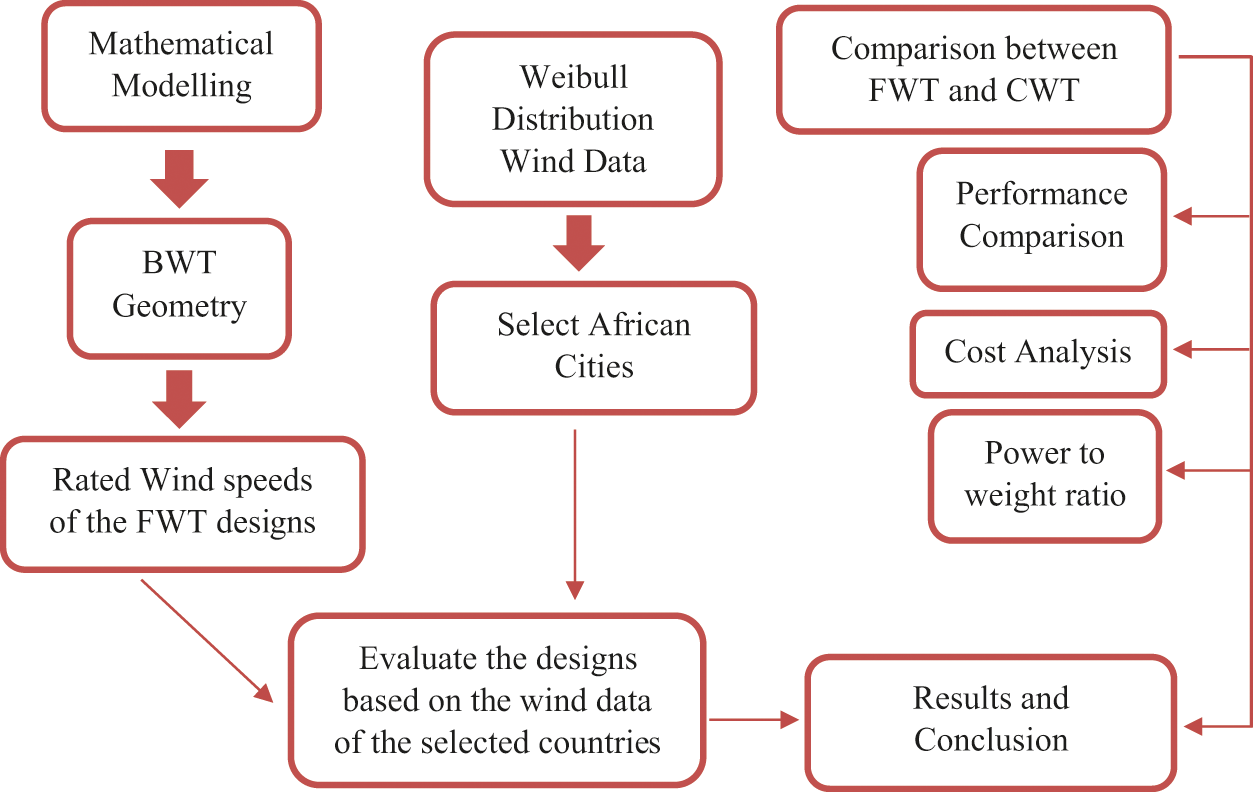
Figure 2: Research methodological framework
When designing a wind turbine, it is important to know the expected power output of the wind turbine so that one can determine its economic viability. The power contained in a wind flow [35] is shown in Eq. (1):
where ρ is the air density, which normally ranges from 1.22 to 1.3 kg/m3, A is the area swept by the turbine blades (m2), and V is the wind speed (m/s). The Betz limit given by Eq. (2), also known as the power coefficient, places a limit on the performance (efficiency) of a wind turbine [36,37]:
Recent research suggests that the Betz limit does not apply to VAWTs [38–40], but because the FWT is a HAWT, it does apply to the work reported in this paper. The Cp value is unique to each turbine type and is a function of wind speed. Once the various engineering requirements of a wind turbine, such as strength and durability, are incorporated, then the real-world limit is less the Betz Limit. Hence, the power coefficient needs to be factored into Eq. (1) resulting in the extractable power from the wind as given by Eq. (3) [41]:
The swept area of the turbine can be calculated from the length of the turbine blades by using Eq. (4) [41]:
where the radius (R) is equal to the blade length (l).
For conventional wind turbines, the power available is calculated by Eq. (5) [41]:
where Cp (λ, β) is the power coefficient which depends on two factors: β, the blade pitch angle and the tip speed ratio, λ. Cp (λ, β) takes into account additional factors in a conventional wind turbine system, e.g., the gearbox, bearings, generator, etc.; in reality, a maximum of 45% of the wind power is converted into usable electricity [42]. As the FWT has no gearbox, nacelle, pitch system, mechanical brakes, and shafts, these losses are greatly reduced. Also, its Cp is higher than those for conventional wind turbines. Third-party testing of the FWT 203 mm wide, 1.524 m long blade resulted in power coefficients (Cp) approaching 50%. This means that the power production performance using the FWT air-foil blade is greater than other blade designs [29].
To assess and compare the wind resource in the specific countries and cities of interest, this research adopts a two-parameter Weibull distribution function, as is typical in the field. The probability density function is given by Eq. (6) [34]:
where v is the wind speed, k is the shape parameter (dimensionless), and c is the scale parameter (m/s). The two parameters, k and c, can be obtained by Eqs. (7) and (8), respectively [34]:
where
This research uses the BWT as a basis for the design of a low-speed, Ferris wheel-based wind turbine. Table 1 presents the geometry of the FWT used to explore the wind turbine design space and the wind speeds required by the Barber Wind Turbines to generate their rated power calculated using Eq. (3). The service life of the FWT is 20 years.
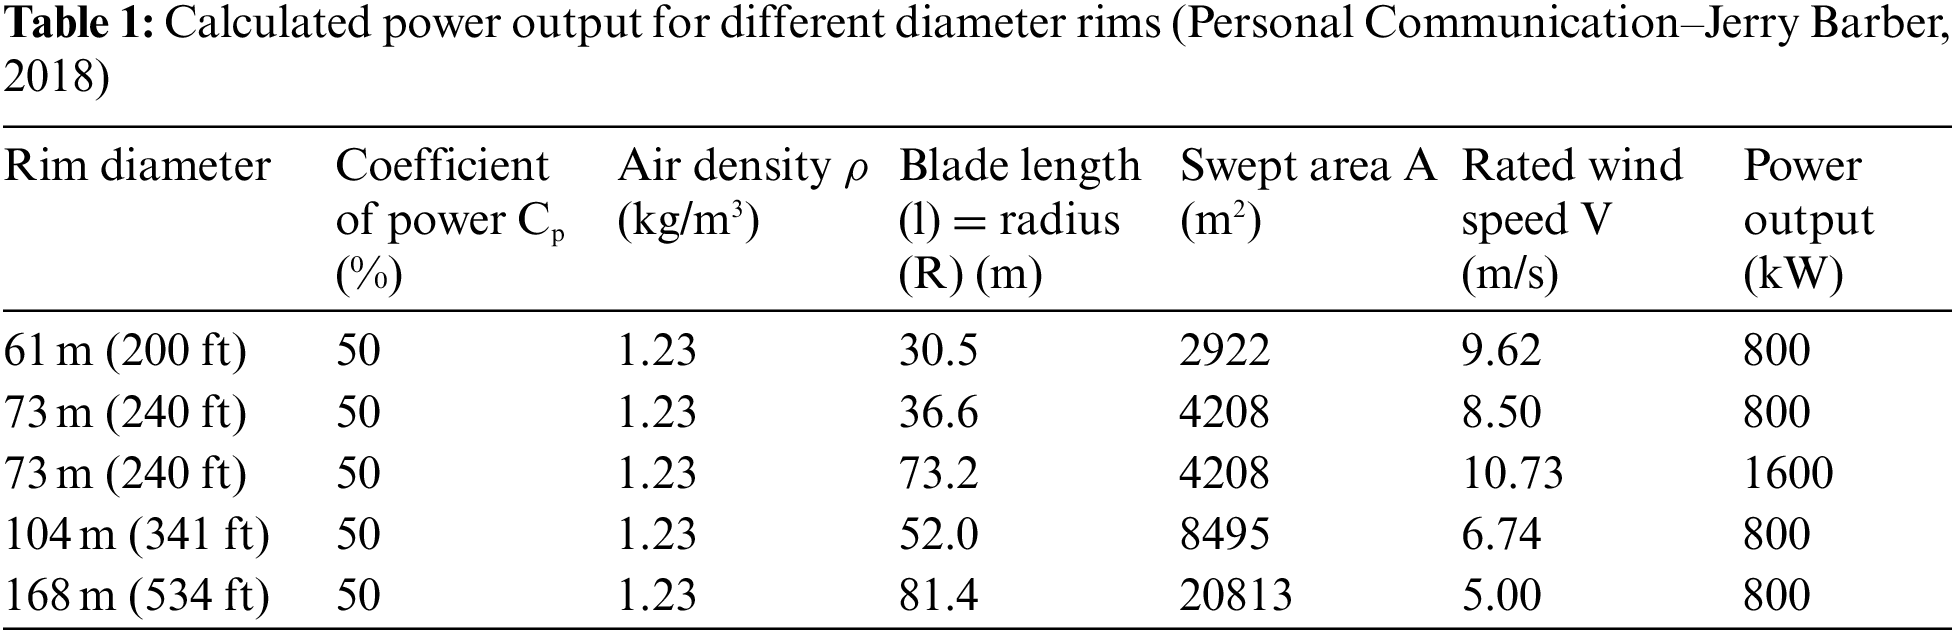
The 61 m (200 ft) rim diameter FWT represents the prototype manufactured by the Barber Wind Turbines. The predicted power curves for the three possible designs of the FWT studied here are shown in Fig. 3 [42]: the 800 kW wind turbine with a 61 m (200 ft) rim, the 800 kW wind turbine with a 73 m (240 ft) rim and the 800 kW wind turbine with a 104 (341 ft) rim along with their respective rated wind speeds at which power is generated.
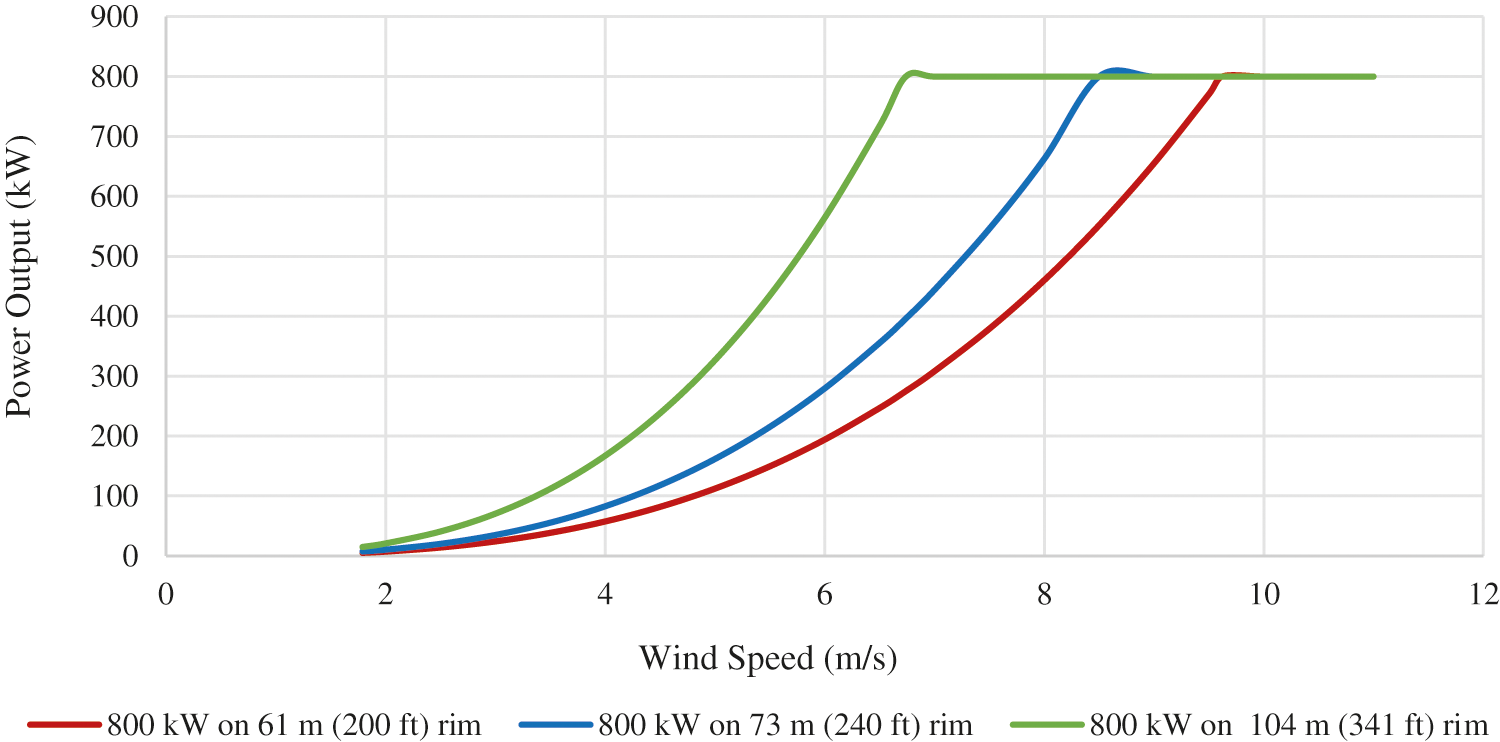
Figure 3: Predicted power curves for different diameter rims
From the preliminary wind tunnel test reported above, there is one performance data point. Currently, there are no data for additional wind speeds, turbine RPM, or Cp. This will become available in the future after the first full-scale turbine, which is under construction, is commissioned. As the FWT is a horizontal wind turbine, it is expected that it will have operational characteristics like those reported in the literature for HAWTs. Therefore, the predicted power curves of the BWT designs were modelled based on that similarity [42]. It is understood that the Cp will not be constant over the varying wind speeds in operation, but the Cp value of 50% is the only firm data point available. So, under that assumption and until data from actual BWTs operation are available, we will calculate the power curve and the other techno-economic results based upon that power point and a constant Cp of 50%.
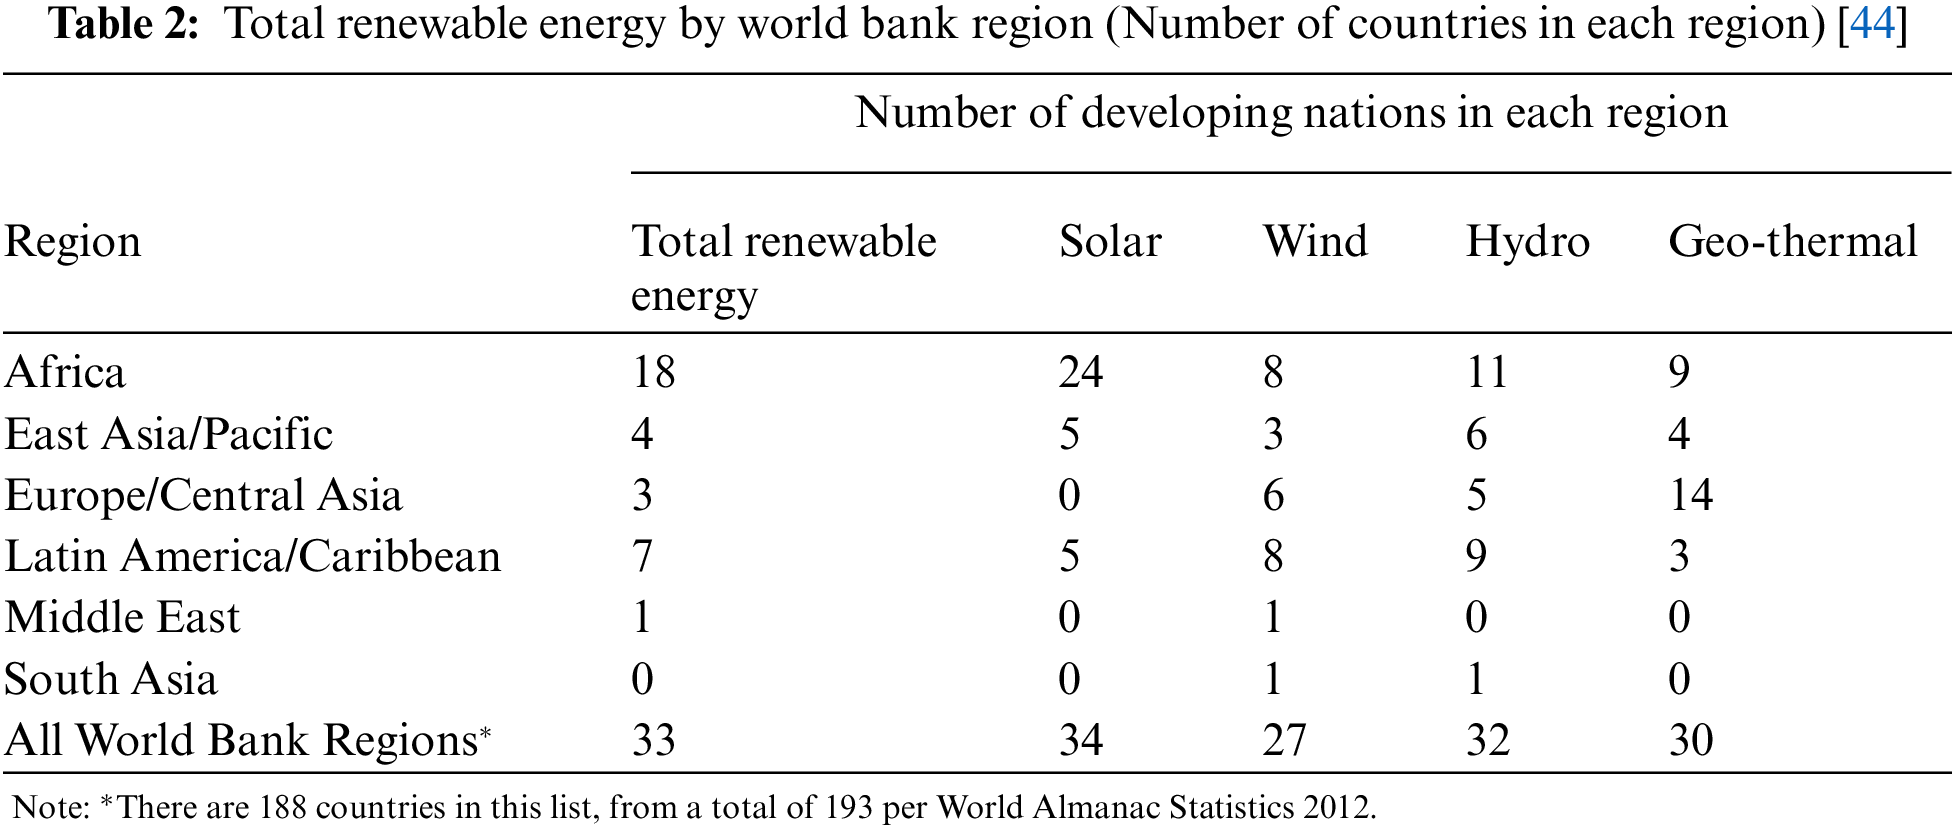
The African landmass is blessed with renewable energy resources that address existing energy deficiencies (Table 2). The largest number of the top 30 nations in terms of renewable energy potential are situated in Africa. The continent has enough renewable energy resource potential to meet its foreseeable energy needs. Eighteen of the top 35 developing nations classified as “most endowed in renewable energy resource (Solar, Wind, Hydro, Geothermal)” by World Bank region, as measured by years of domestic energy consumption, are also situated in Africa. Furthermore, no fewer than eight African nations are among the developing world's most endowed with wind energy potential [43].
Even though the African continent has huge wind energy resources, a large fraction is marginal, especially for countries between the tropics of Cancer and Capricorn. Wind resources vary across the African continent. Areas with higher wind speeds are fewer than areas with fair and marginal wind speeds [45]. Fig. 4 shows the wind speed distribution across the African continent. Dark red zones signify areas with the highest wind resource, followed by the red zones, the orange zones, the yellow zones, the green zones, the blue zones and zones with least wind resource are represented light blue color. Considering the wind resource across the continent, higher wind resources are available in Northern and Southern Africa, the horn of Africa and along the coastal areas. The smallest wind resources are seen in Central Africa.
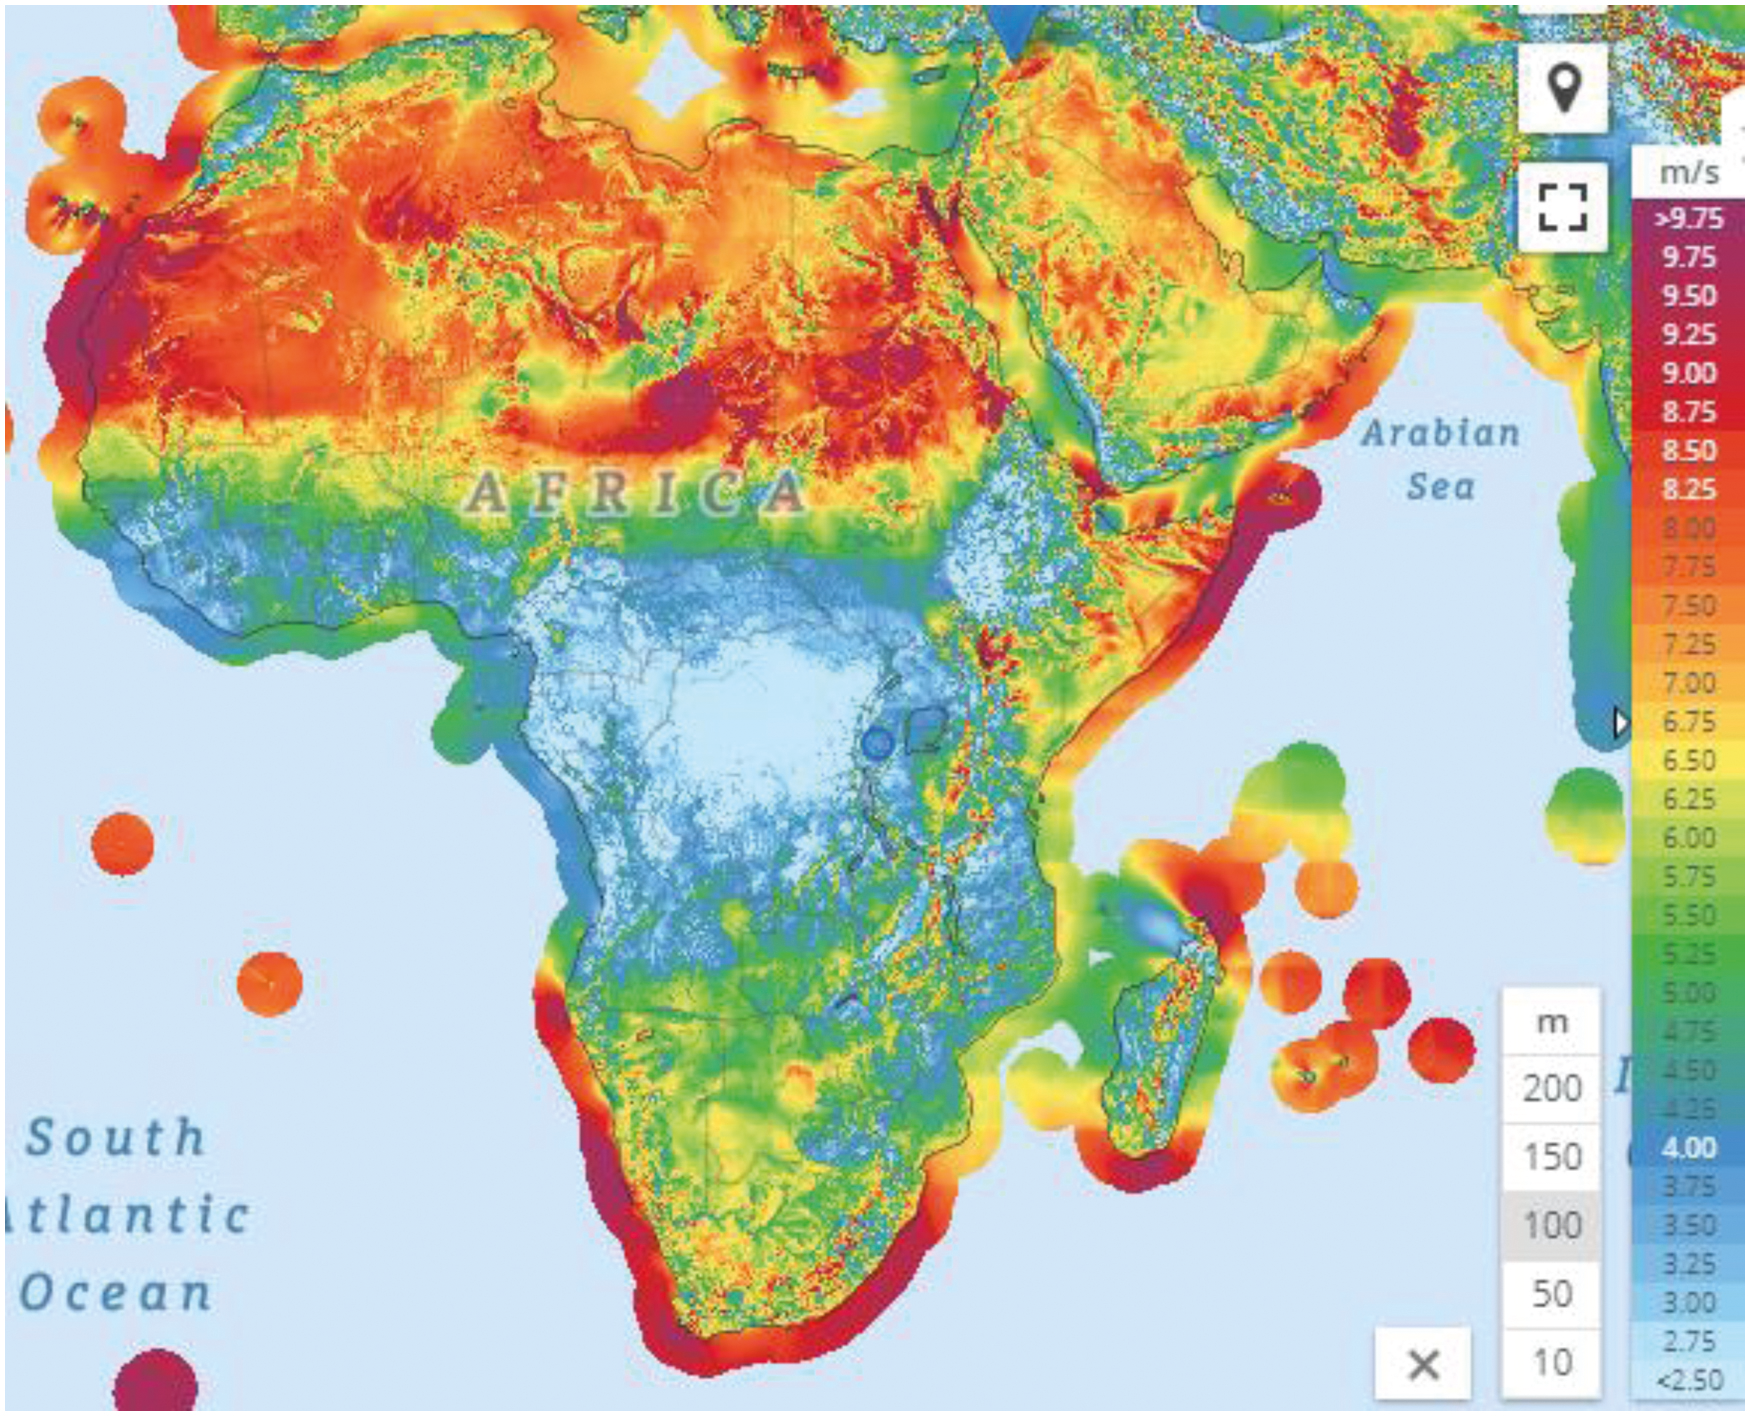
Figure 4: Wind speed distribution of the African Continent [46]
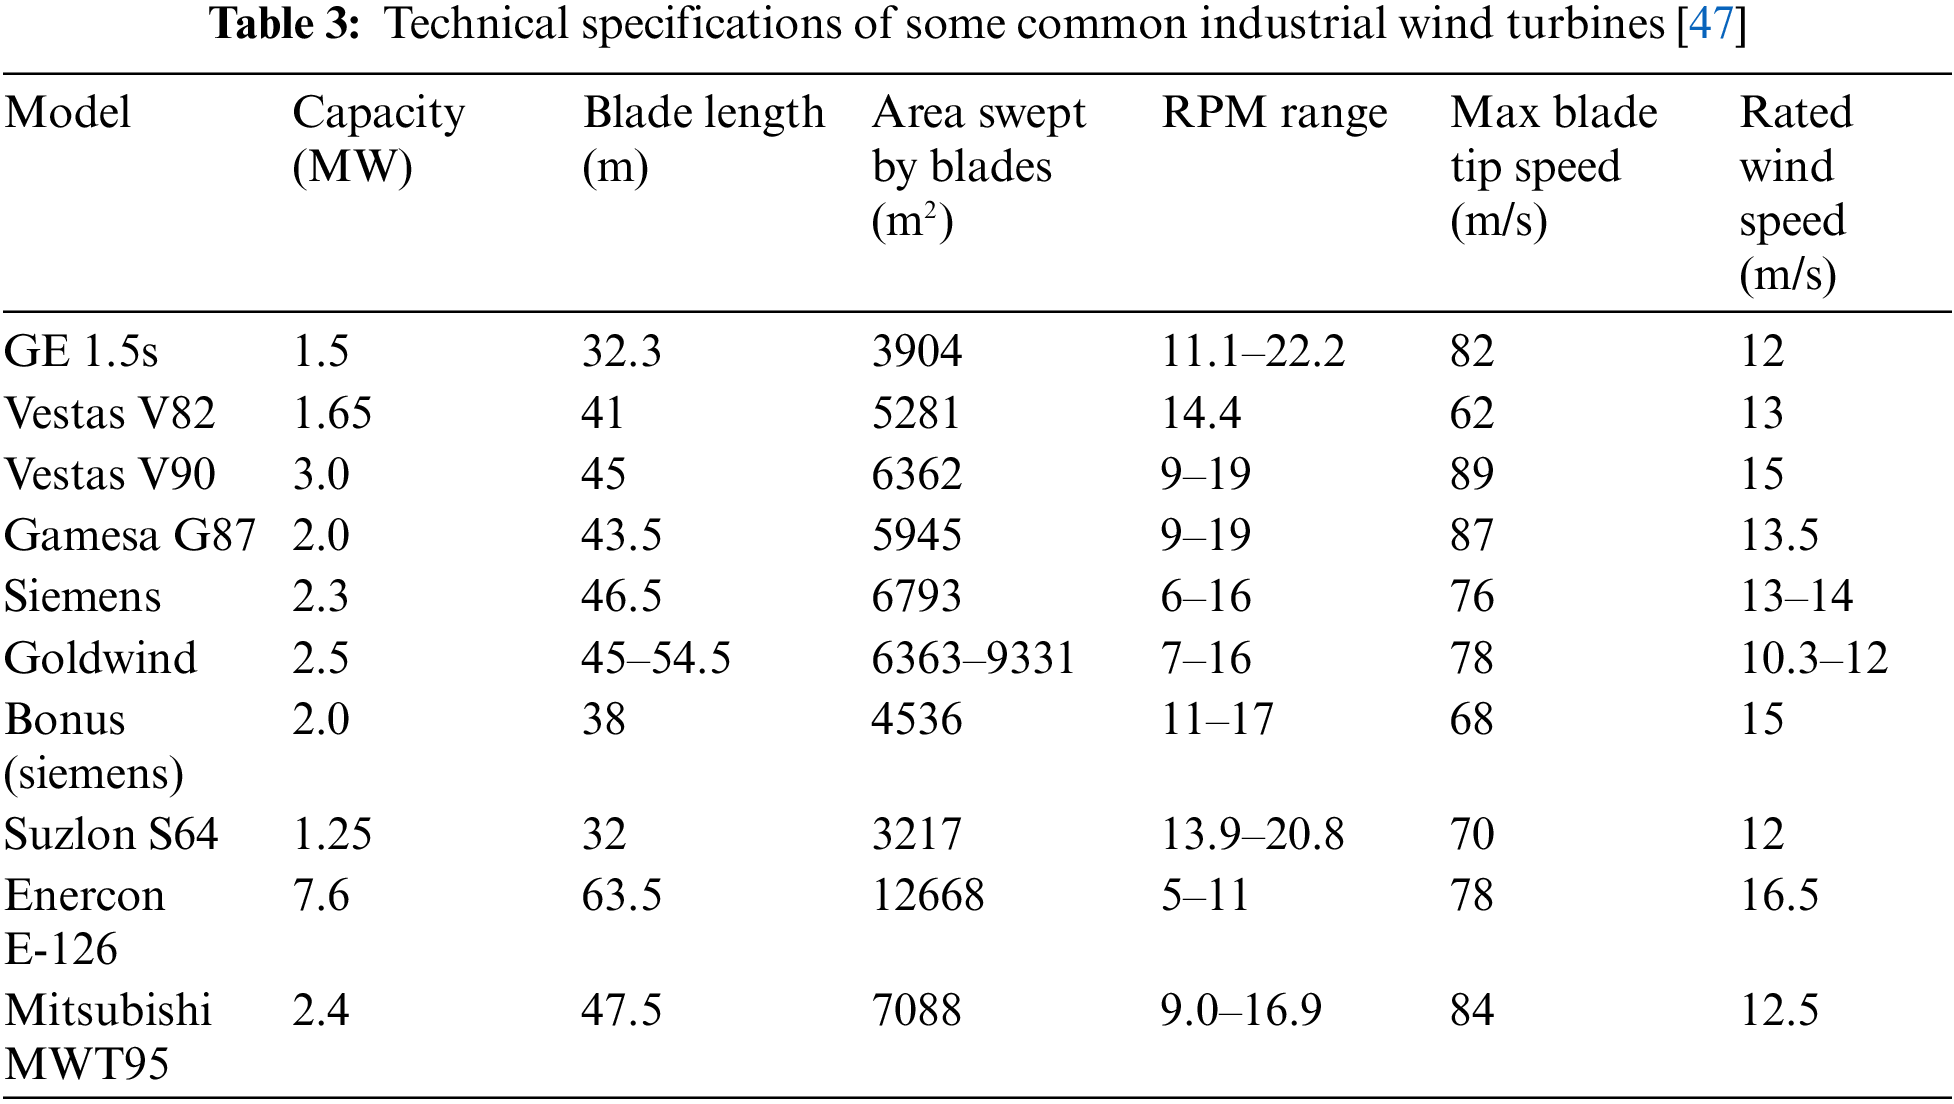
The major drawback to utilizing wind energy in Africa is that conventional wind turbines need higher wind speeds than are available in much of the continent to generate electricity, especially in sub-Sahara Africa. Most large commercial, conventional wind turbines have cut-in speeds between 3.5 and 5 m/s, the point that they start to generate electricity, cut-out speeds of 25 m/s, which are their maximum operating speeds, and rated output speeds of approximately 15 m/s as shown in Table 3. However, many African countries do not have annual mean wind speeds equal to the typical rated output speeds of these wind turbines. Most African countries, especially in SSA, have annual mean wind speeds of between 4 to 10 m/s. For example, Equatorial Guinea and Rwanda have annual mean wind speeds of 3.68 and 4.68 m/s, respectively, which are smaller than the cut-in speed of larger, conventional wind turbines. This restricts the development of wind power in Africa for electricity generation in such low wind-speed regions from using conventional wind turbines. Table 3 lists the technical specifications of some commonly used wind turbines.
Even though there is potential for harnessing wind energy at low wind speeds, innovative technology like the FWT that are designed to operate at low wind speeds would help to achieve this.
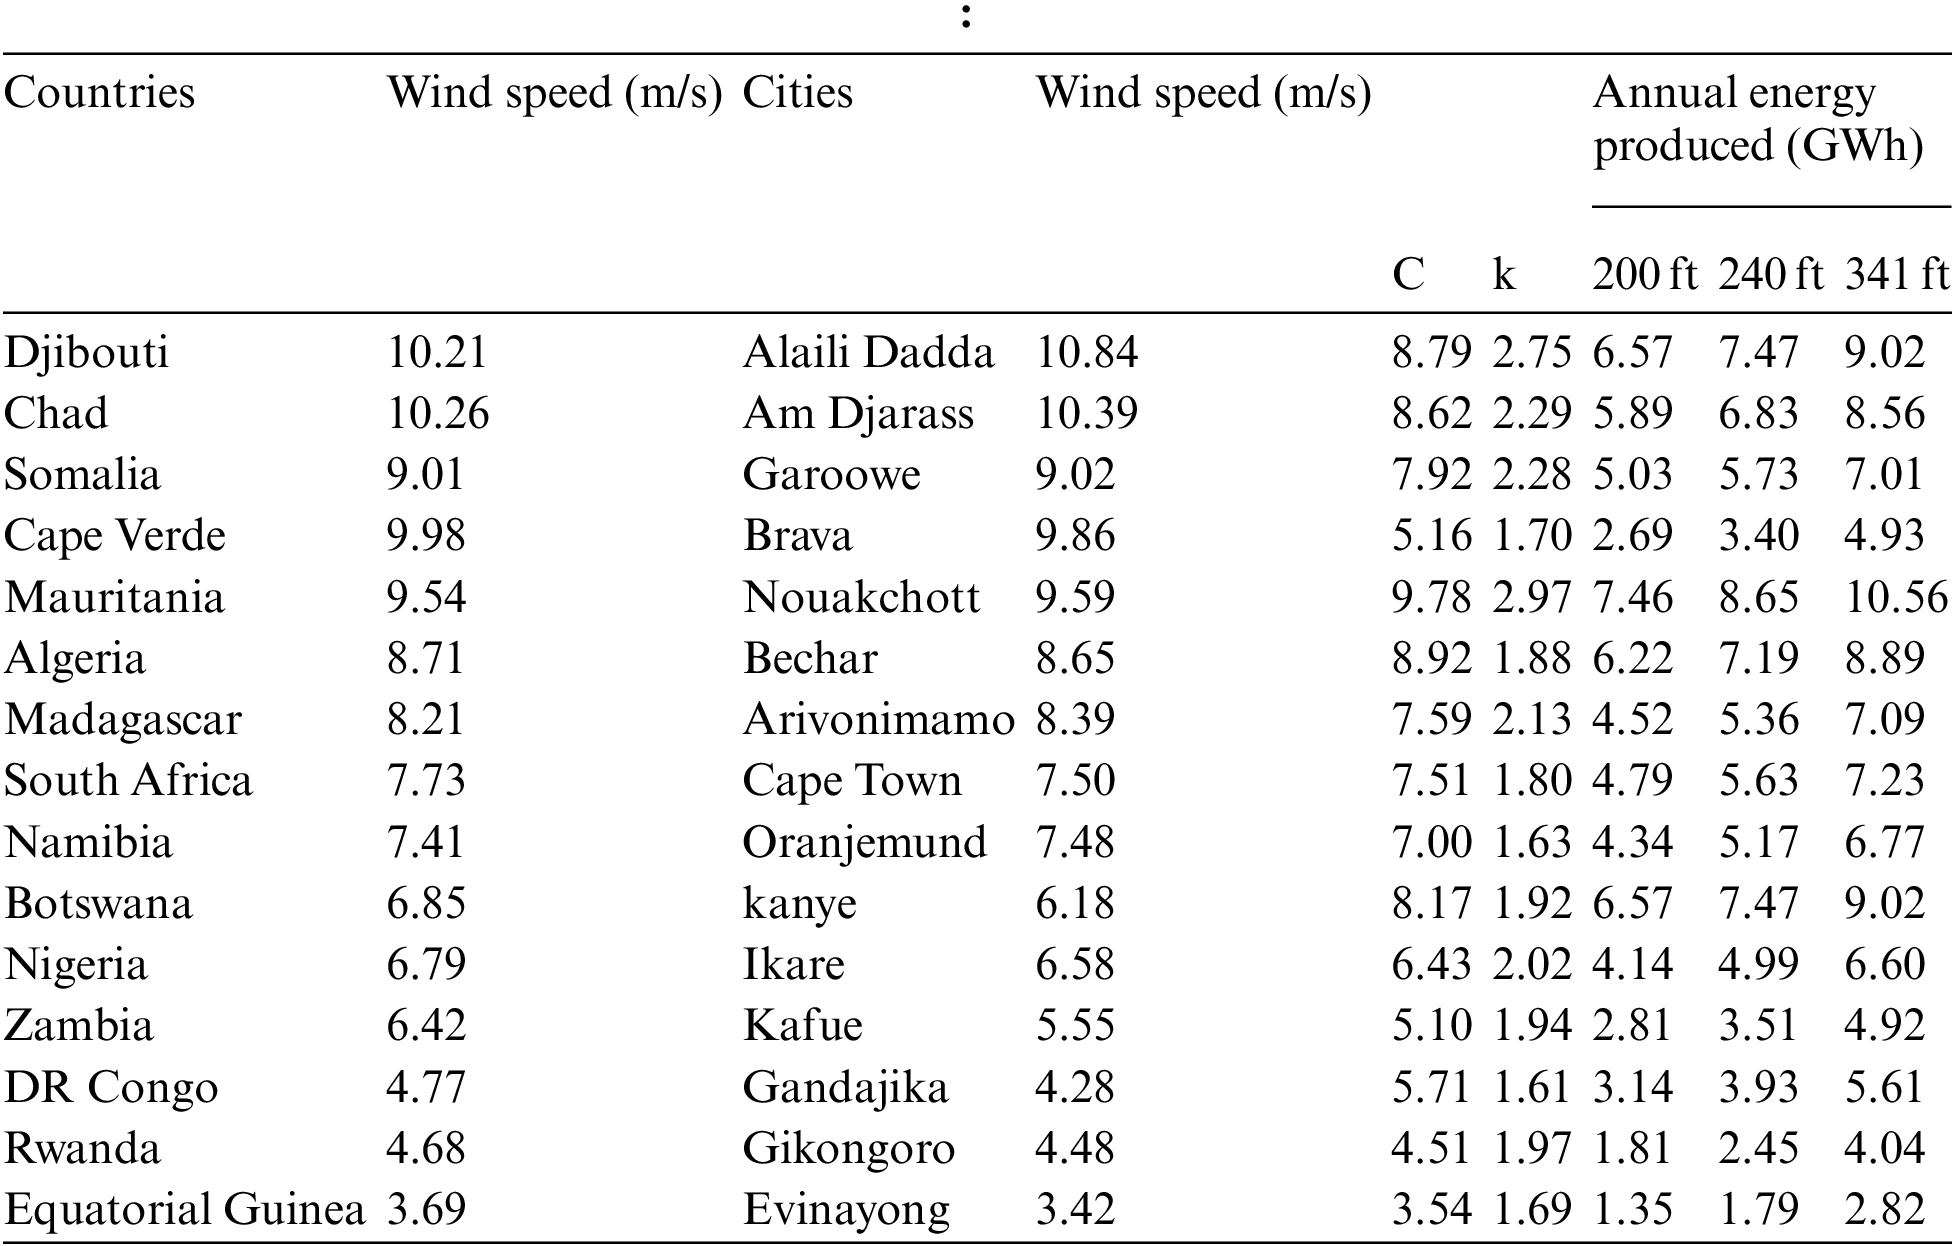
Several countries are chosen to assess the wind resource of the African continent based on their annual mean wind speeds, and their geographical location in Africa. In each country, a city with an annual mean wind speed close to the country's annual mean wind speed and a large population is chosen (appendix). The countries and cities chosen represent the wind speed dominance available across the continent. The Weibull wind distribution of the specific cities in 12 directions are obtained from the Global Wind Atlas [46] at a height of 100 m above the ground, which represents the hub height studied.
The obtained wind Weibull distribution of the selected African cities in the chosen countries are analysed using Eq. (6). Results are presented in Fig. 5 and the appendix. Fig. 5 allows one to compare the wind Weibull distribution of the selected cities. The results show that the average ‘c’ of all the cities varies from 3.54 m/s in Evinayong (Equatorial Guinea) to 9.78 m/s in Nouakchott (Mauritania). The dimensionless k–parameter varies from 2.97 in Nouakchott (Mauritania) to 1.61 in Gandajika (Democratic Republic of Congo). Most of the cities have most of their wind speed distributions less than 5 m/s, except for Nouakchott (Mauritania).
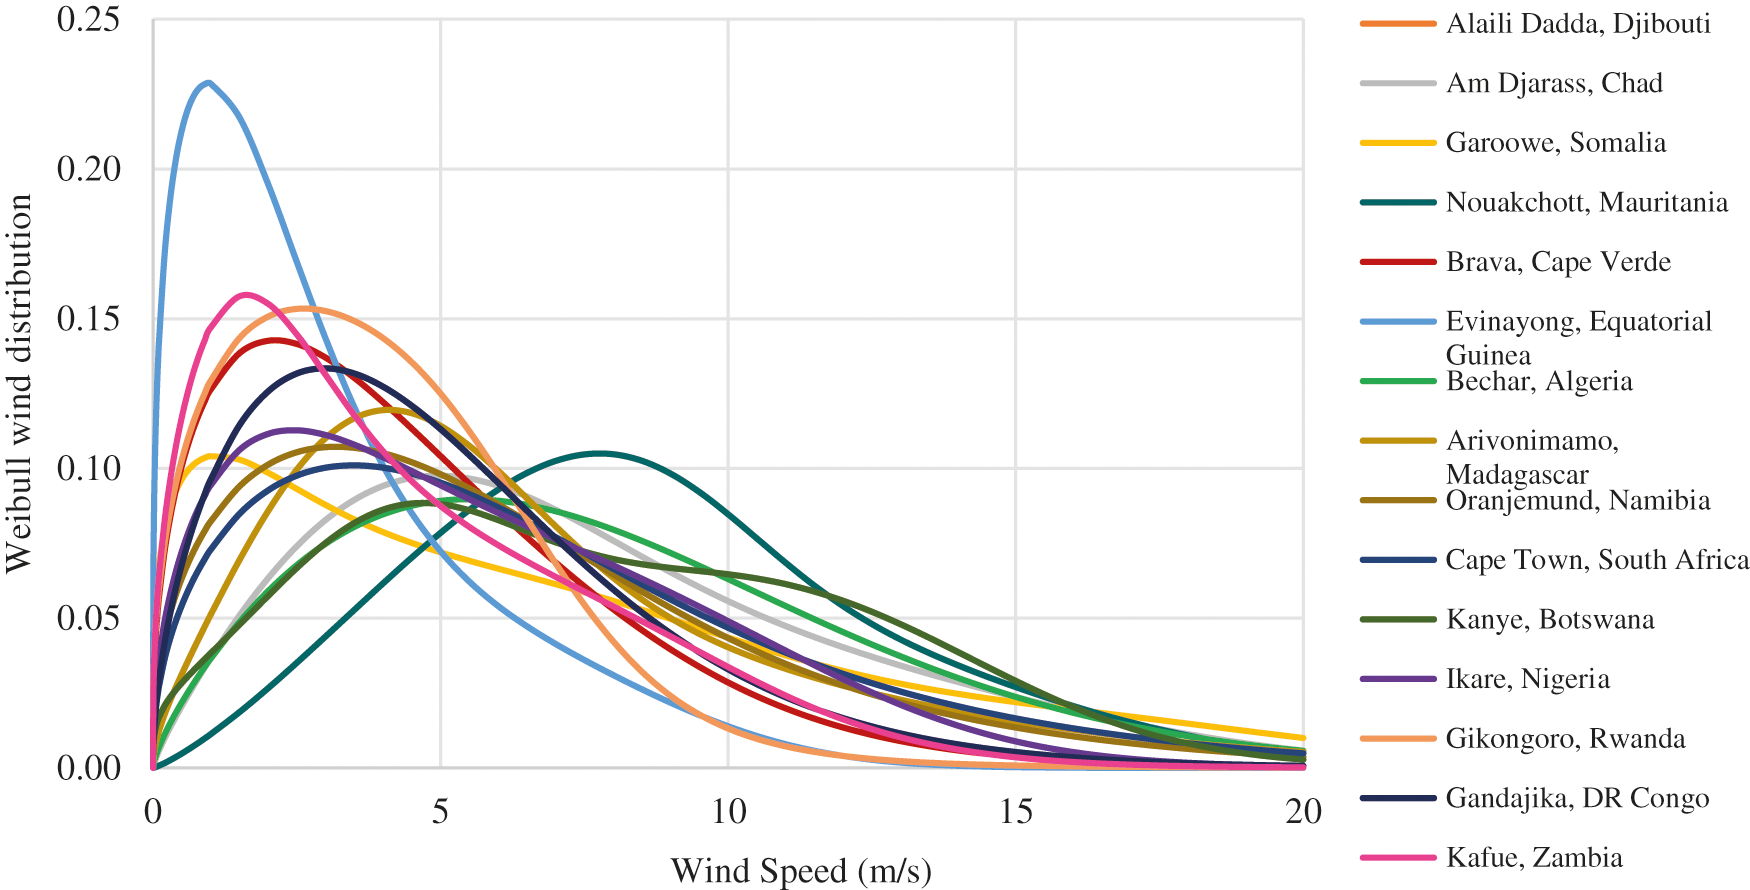
Figure 5: Weibull wind distribution of the African cities of interest
4.2 Evaluation of the Three FWT Designs
Considering the annual mean wind speed across the different cities in Africa shown in the appendix and the rated wind speed results shown in Table 1, the BWT 800 kW with a 61 m (200 ft) rim wind turbine may not be a suitable design for Africa because it requires a rated wind speed of 9.62 m/s to produce 800 kW. Only Alaili Dadda (Djibouti), Am Djarass (Chad) and Brava (Cape Verde), with an annual mean wind speeds of 10.8 m/s, 10.4 m/s and 9.86 m/s [45], can accommodate this design. The 800 kW with a 168 m (534 ft) would not be appropriate even though it has lower rated wind speed because increasing the length of the blades would increase the weight and the capital cost of the BWT, resulting in the need for greater structural support. Increased weight might pose a challenge for transportation to the site. The most appropriate would be the 800 kW wind turbine with a 104 m (341 ft) rim because these designs can produce the needed power output, 800 kW, at lower wind speeds of 6.74 m/s, respectively, which encompasses several annual mean wind speeds of the different countries in Africa. The annual mean wind speed data for the different cities of interest in Africa (3.69 m/s to 10.84 m/s) are presented on the predicted power curve for an 800 kW wind turbine with a 104 m (341 ft) rim (Fig. 6).
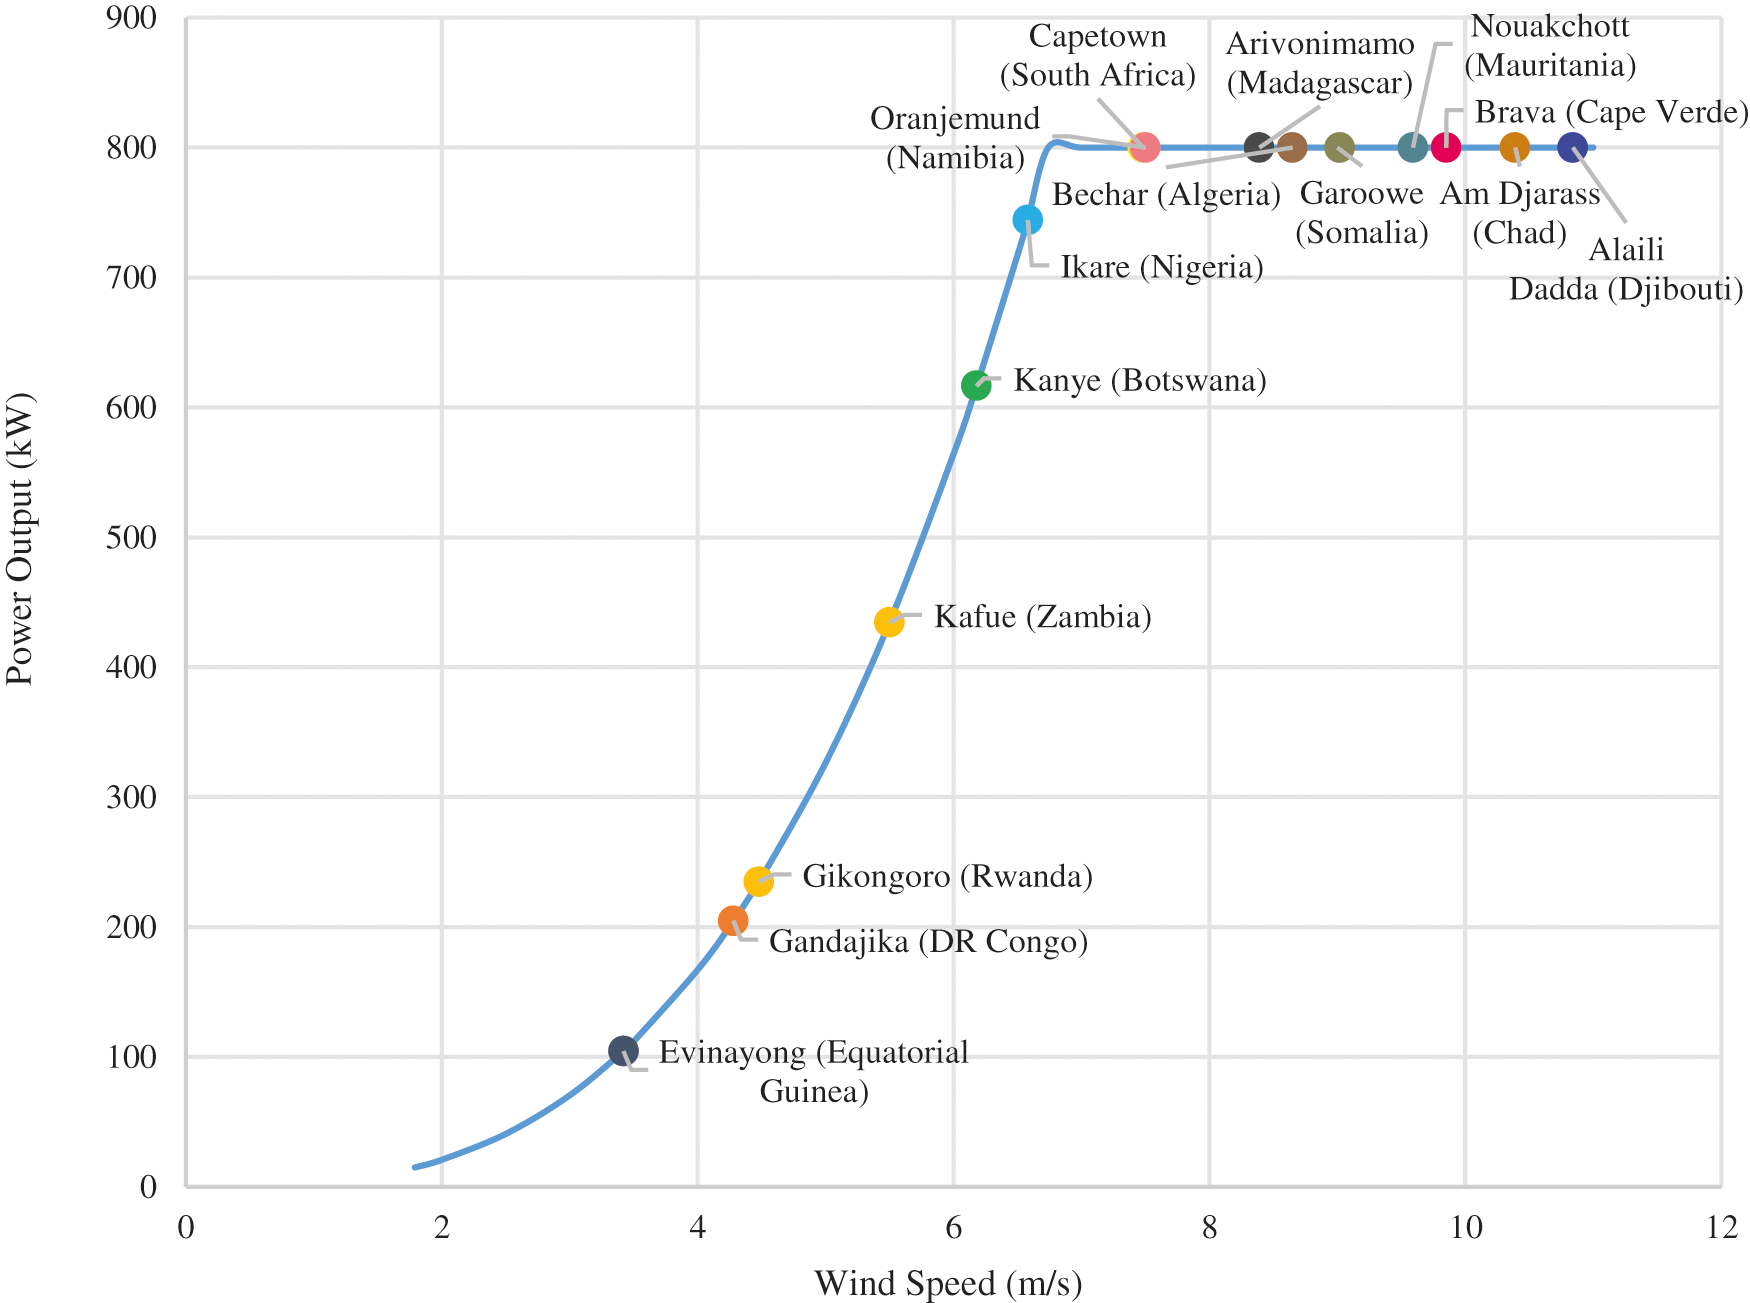
Figure 6: Predicted power curve for different African countries using their annual mean wind speeds with 800 kW with a 104 m (341 foot) rim [46]
Using the Weibull wind distribution of the cities of interest, and the power curves of three feasible BWT designs, namely the base model –61 m (200 ft) on 800 kW, 73 m (240 ft) on 800 kW and the 104 m (341 ft) on 800 kW, the annual energy production (AEP) of the cities of interest were estimated. Results are presented in the appendix. The highest AEP is seen on the 104 m (341 ft) on 800 kW, followed by the 73 m (240 ft) on 800 kW and the lowest is observed on the 61 m (200 ft) on 800 kW as shown in the appendix. The AEP ranges from 1.35 GWh on 61 m (200 ft) on 800 kW in Evinayong (Equatorial Guinea) to 10.56 GWh on 104 m (341 ft) on 800 kW in Nouakchott (Mauritania). Nouakchott (Mauritania) has the highest AEP while Evinayong (Equatorial Guinea) has the lowest AEP on all the BWT designs among all the sites of interest. The AEP of the four BWTs in the selected sites increases with the increased swept area of the wind turbines. The 800 kW wind turbine on a 104 m (341 ft) rim requires a rated wind speed of 6.74 m/s, larger swept area and has the highest annual energy production in all the cities studied. The 800 kW wind turbine on a 104 m (341 ft) is a more feasible and optimal design as it accommodates more countries than the other BWT designs.
4.3 Comparison between Conventional and Ferris-Wheel Wind Turbines
To assess the feasibility and the competitiveness of the BWT 800 kW with a 104 m (341 ft) rim in the African continent, especially SSA, a comparison is made with conventional horizontal axis wind turbines. The parameters considered in this comparison are performance, cost, and power to weight ratio.
The technical specifications of some common conventional industrial wind turbines from various manufacturers around the world including FWT, their rated wind speed, power output, model, manufacturer, cut-in speed, and cut-out speed are presented in Table 4. It is not possible to obtain their rated wind speeds in Africa, especially in SSA.
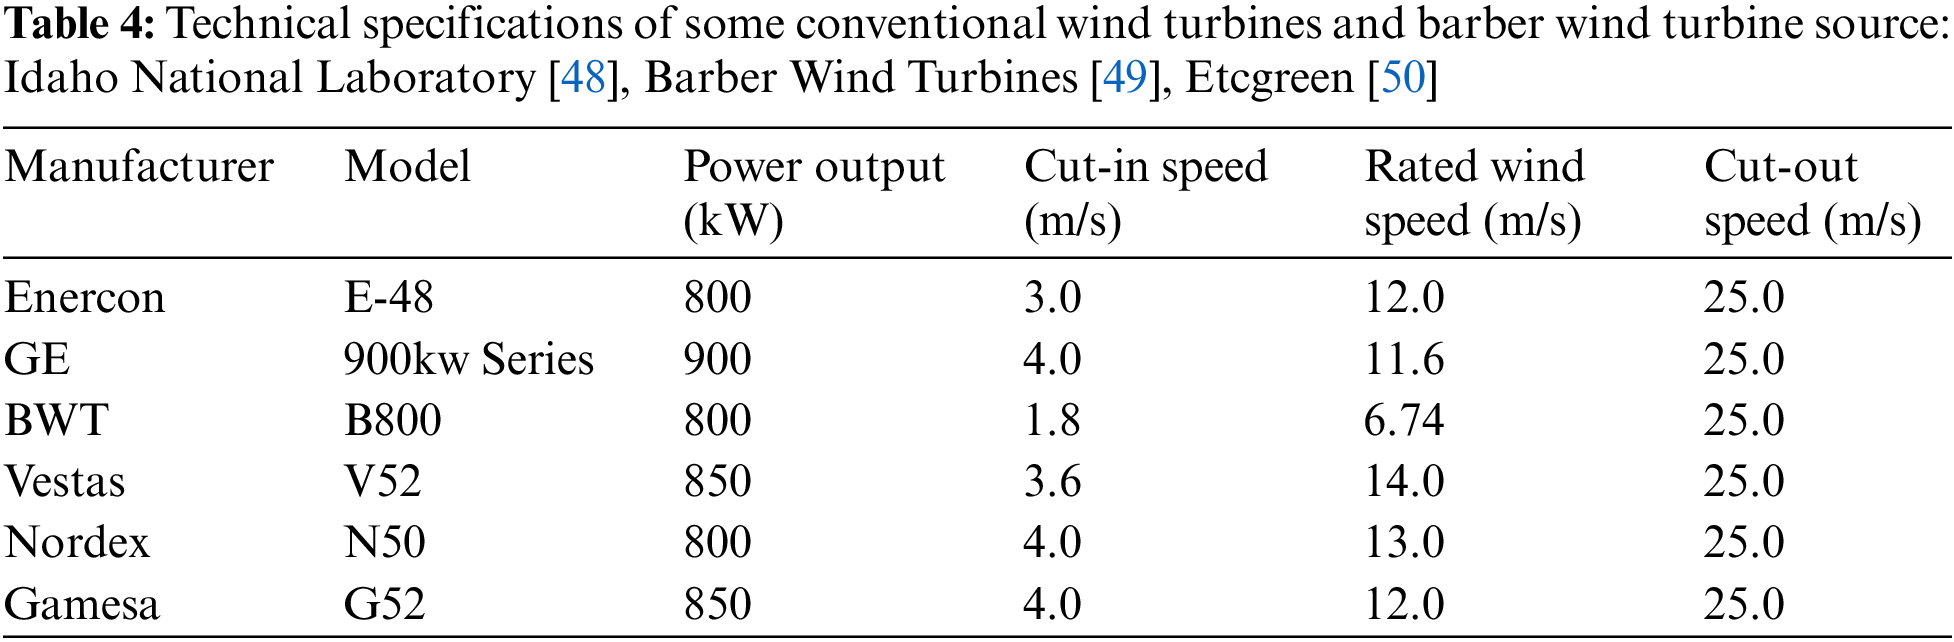
The predicted power curves for the selected wind turbines are plotted and contrasted to the FWT 800 kW in Fig. 7. The technical specifications are presented in Table 4. These wind turbines include Enercon E-48 800 kW, GE 900 kW, Vestas V52 850 kW, Nordex N50 800 kW, Gamesa G52 850 kW and BWT 800 kW.
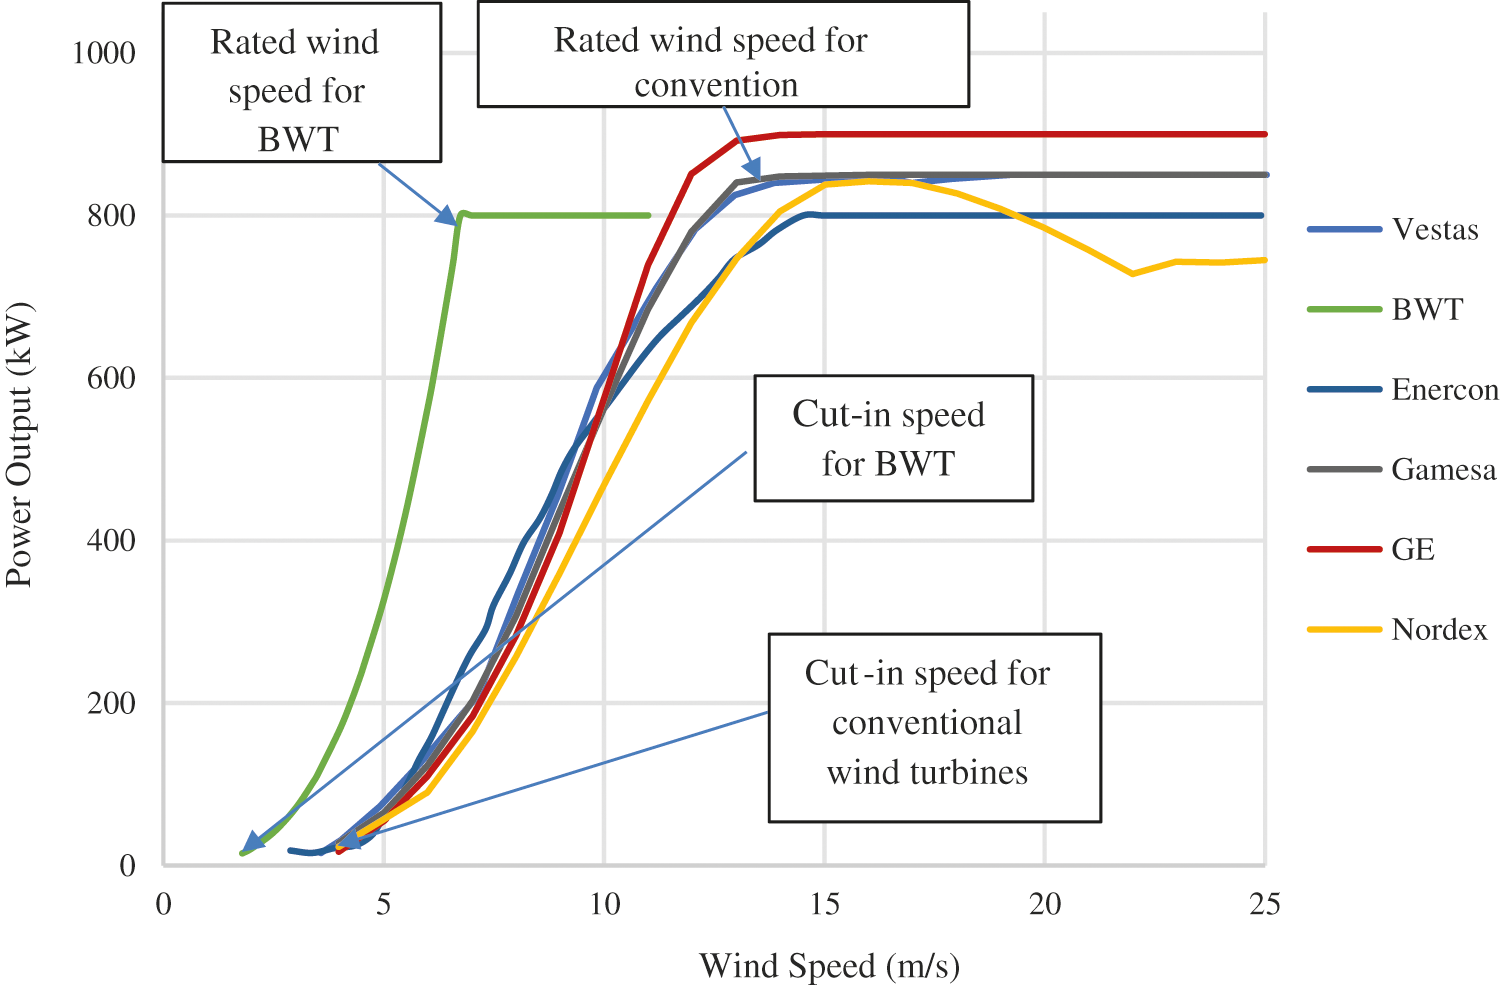
Figure 7: Predicted power curve for selected wind turbines [48,51–55]
Most conventional wind turbines require cut-in speeds of 3 m/s to 5 m/s to start producing electricity [14]; many countries in the African continent, for example, Rwanda, do not have annual mean wind speeds approaching 5 m/s. The FWT has a cut-in speed of 1.79 m/s (personal communication J. Barber, 2017), thereby making it suitable for low wind speed applications in Africa. Fig. 7 also shows the cut-in speeds for the selected conventional wind turbines and the FWT. The rated wind speeds at which they produce the rated power output are also shown; conventional wind turbines require higher wind speeds of 12 m/s and above to produce the rated power whereas the FWT requires a wind speed of 6.74 m/s to produce the rated power. Consequently, the FWT appears more suitable for Africa the current commercial machines because of the FWT's ability to operate at low wind speeds.
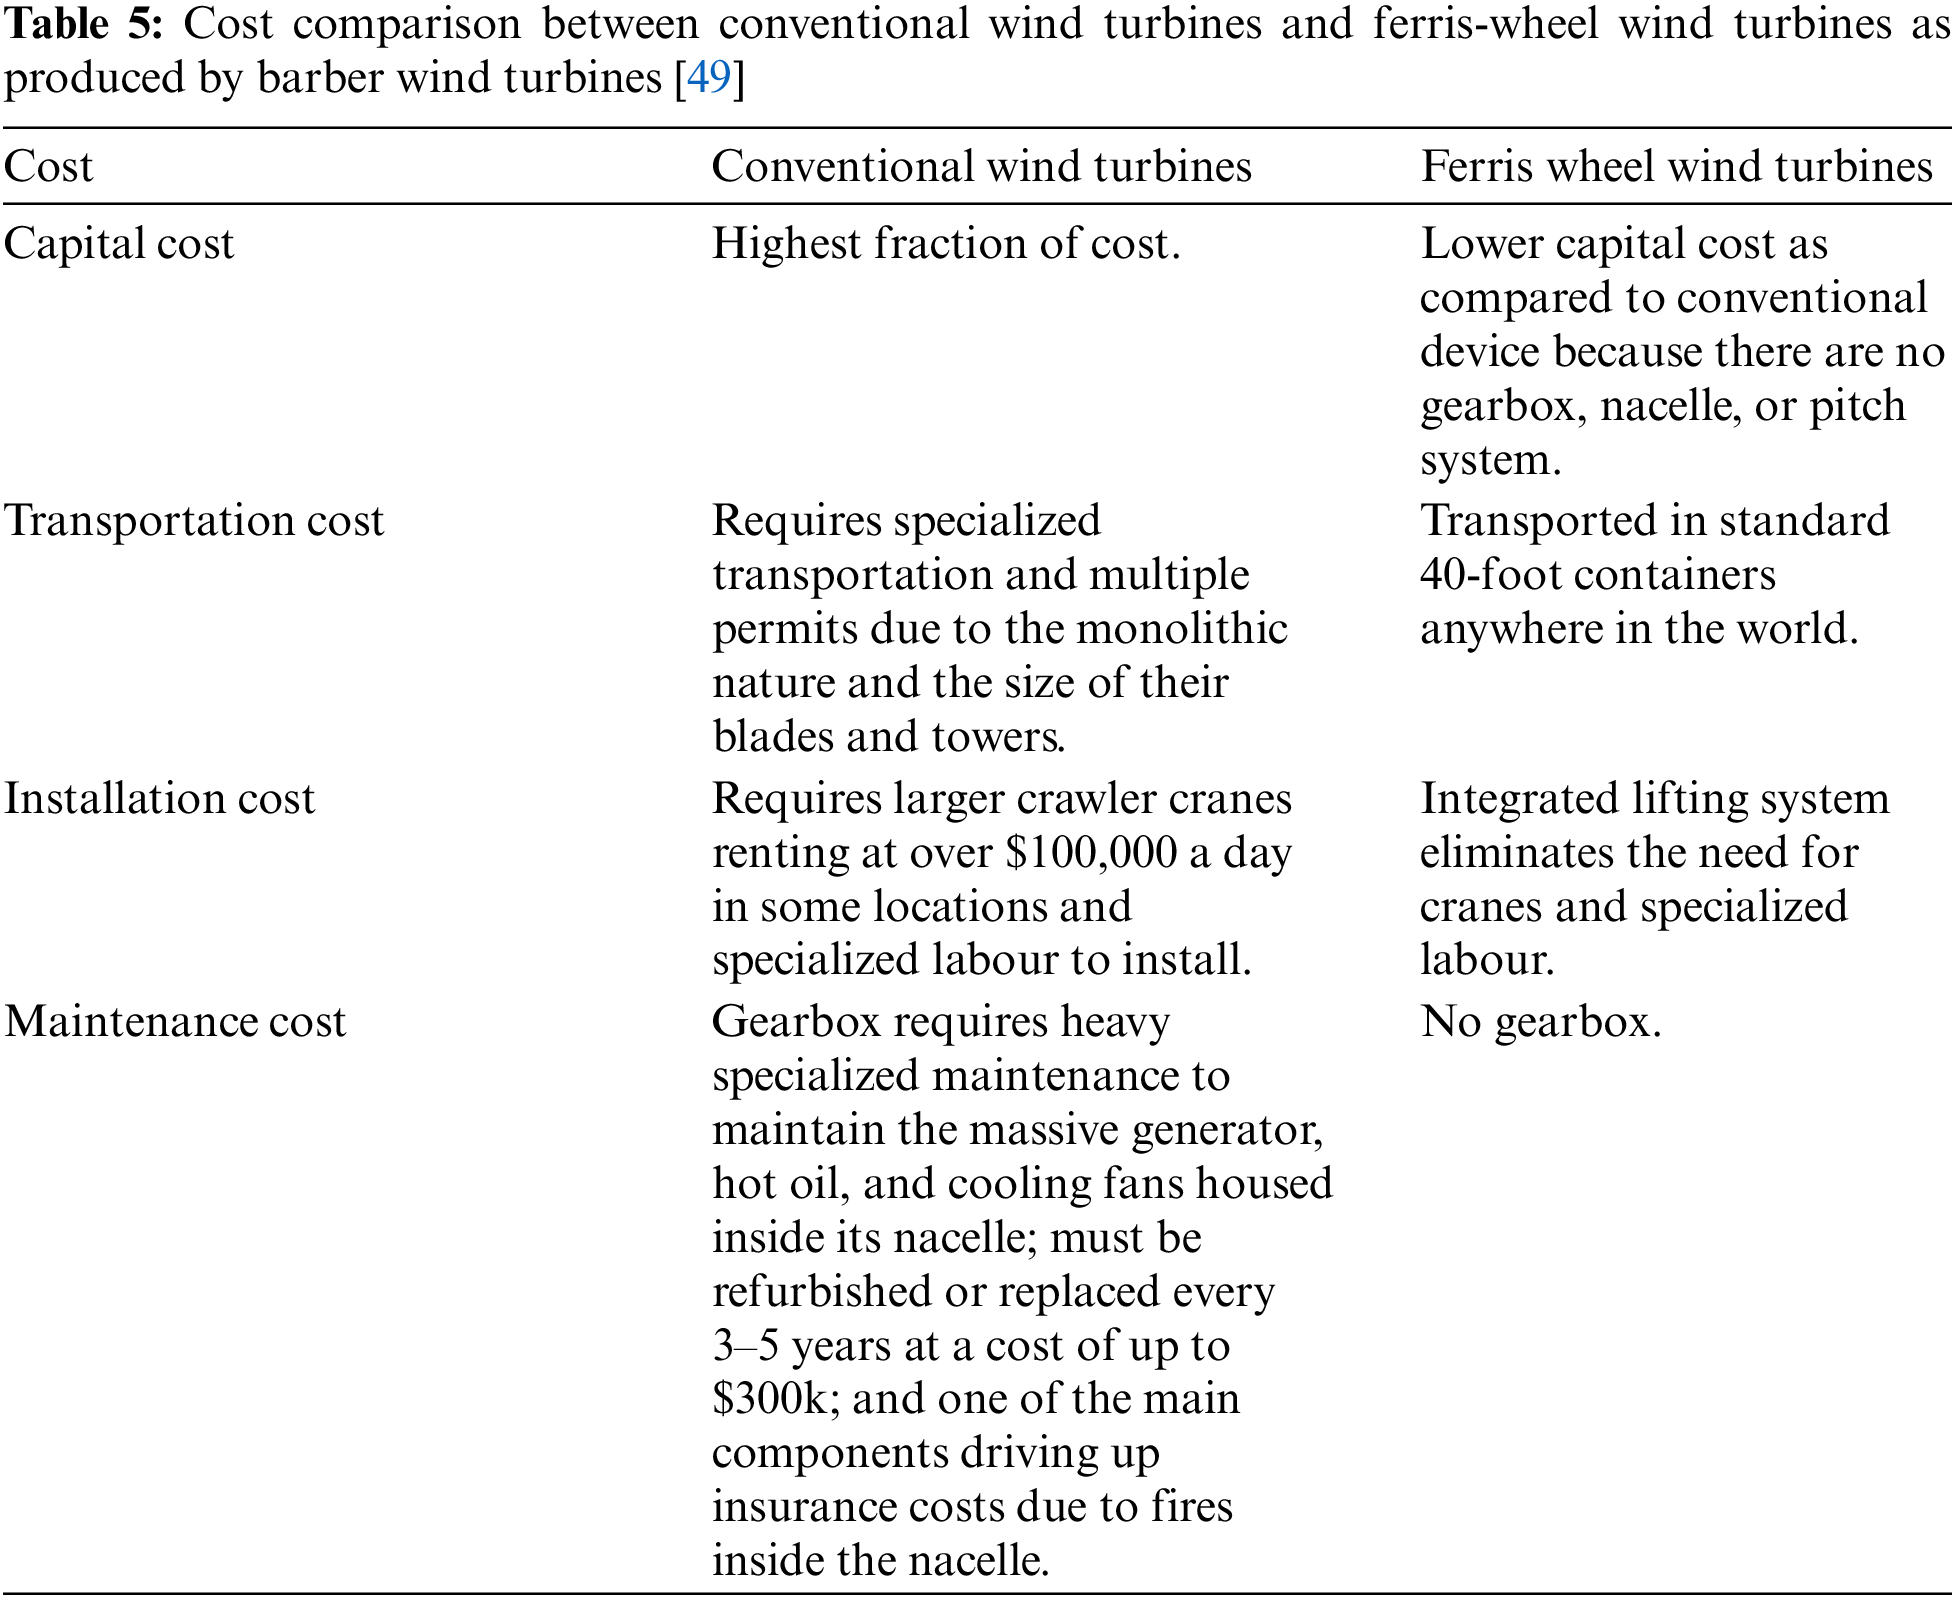
A comparison of the capital, transportation, installation, and maintenance costs of the conventional and FWT is presented in Table 5. As FWTs are designed based on Ferris wheel technology and have no gearbox or nacelle, which constitute the larger proportion of conventional wind turbine capital and maintenance costs, FWTs are cheaper than conventional wind turbines. The integrated lifting system of a FWT eliminates the need for cranes and specialized labour, which is a large part of the installation cost of conventional wind turbines. From Table 5, one can observe that the capital, transportation, installation, and maintenance costs for the conventional wind turbines are greater than for the FWT. For the African continent, conventional wind turbines may be too expensive to maintain; as a result, the FWT is likely to be suitable for the African continent because it more economically generates electricity.
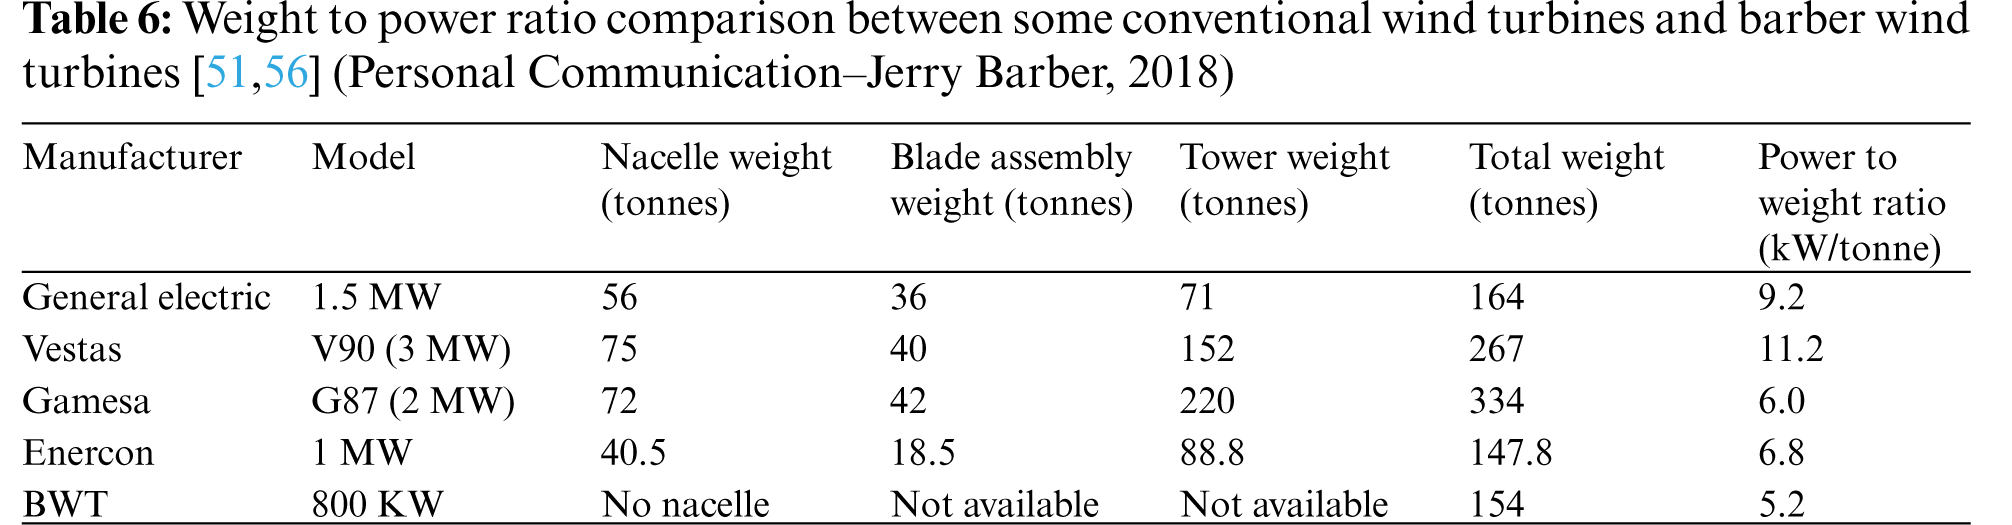
4.3.3 Power to Weight Ratio Comparison
The weights of the conventional and FWT wind turbines are presented in Table 6, which include the nacelle, blade assembly, and tower. The FWT is significantly lower in weight because it has no nacelle, gearbox, or shaft, which makes it easier to transport. The wind turbines’ power to weight ratios are also compared. FWT has the lowest kW/ton ratio, 5.19 kW/ton. As the power output of the wind turbine largely depends on the swept area of blades, the power output of the FWT can be increased or reduced by either increasing or reducing the swept area of the blades while keeping the other factors constant.
4.3.4 Coupled Effects of Performance, Cost, Power to Weight Ratio Comparison
Considering the lower cut-in speed of 1.79 m/s of the FWTs as compared to 3.5 to 4 m/s for the CWTs, and lower rated wind speed of 6.74 to 8.5 m/s of the FWTs as compared to 12 to 15 m/s of the CWTs, FWTs are more suitable for harnessing of wind energy in SSA because they generate more power at lower wind speeds. Also, since BWTs have no gearbox or nacelle, which constitutes the larger part of the conventional wind turbine capital and maintenance costs, and integrated lifting system which eliminates a major part of the installation cost of the conventional wind turbines, the BWT tends to be less expensive to maintain and acquire than the conventional wind turbines. As discussed in Section 4.3, a BWT is lighter than other conventional wind turbines, and could deliver energy at a lower weight. Furthermore, as the power coefficients (Cp) of the BWTs approach 50%, they can achieve a Cp close to the Betz limit. In conclusion, the BWT is more suitable for low-speed regions of wind energy potential such as SSA. Exploration and harnessing of wind energy in SSA could enhance the contribution of wind energy in the continent's energy mix.
A novel Ferris wheel type wind turbine (FWT), as commercialized by Barber Wind Turbine, has potential to generate power at lower wind speeds and cost than conventional wind turbines. Lower cut-in speed, lower rated wind speeds, lower cost, higher efficiency, better performance, lower power to weight ratio are a few of the advantages of the FWT. With this technology, it may be possible to harness wind energy economically in much of Africa, especially in SSA, which has lower wind speeds. Countries with lower wind speeds now have hope to harness wind energy economically. This may be a major step in solving Africa's energy challenge in both on-grid and off-grid applications, resulting in energy availability, accessibility, and affordability, especially in rural Africa, and providing solutions for the energy problems facing the continent.
Acknowledgement: The authors wish to thank the African Centre of Excellence, Energy for Sustainable Development, University of Rwanda, through the World Bank ACE II program for their support on this research. The authors also thank Jerry Barber and Barberwind turbines LLC for their partnership and support on this research. The views and opinions presented in this article are those of the authors and do not necessarily reflect the official policy or position of the World Bank or Barber Wind Turbines. All errors and omissions are the authors alone.
Author Contributions: Conceptualization, K.A. and J.C.; methodology, K.A., N.I., and J.C.; software, K.A. and J.C.; validation, K.A, N.I., and J.C.; formal analysis, K.A.; investigation, K.A. and J.C.; resources, K.A. and J.C.; data curation, K.A.; writing—original draft preparation, K.A.; writing—review and editing, K.A, N.I., and J.C.; supervision, J.C. and N.I.; project administration, J.C. and N.I.; All authors have read and agreed to the published version of the manuscript.
Funding Statement: This research is funded by the African Centre of Excellence, Energy for Sustainable Development, University of Rwanda, through the World Bank ACE II Program.
Conflicts of Interest: The authors declare that they have no conflicts of interest to report regarding the present study.
1. Owusu, P. A., Asumadu-Sarkodie, S. (2016). A review of renewable energy sources, sustainability issues and climate change mitigation. Cogent Engineering, 3(1), 1–14. DOI 10.1080/23311916.2016.1167990. [Google Scholar] [CrossRef]
2. Sun, H., Khan, A. R., Bashir, A., Alemzero, D. A., Abbas, Q. et al. (2020). Energy insecurity, pollution mitigation, and renewable energy integration: Prospective of wind energy in Ghana. Environmental Science Pollution Research, 27(30), 38259–38275. DOI 10.1007/s11356-020-09709-w. [Google Scholar] [CrossRef]
3. Ouedraogo, N. S. (2017). Africa energy future: Alternative scenarios and their implications for sustainable development strategies. Energy Policy, 106, 457–471. DOI 10.1016/j.enpol.2017.03.021. [Google Scholar] [CrossRef]
4. Arndt, C., Arent, D., Hartley, F., Merven, B., Mondal, A. H. (2019). Faster than you think: Renewable energy and developing countries. Annual Review of Resource Economics, 11, 149–168. DOI 10.1146/annurev-resource-100518-093759. [Google Scholar] [CrossRef]
5. Kumar, M. (2020). Social, economic, and environmental impacts of renewable energy resources. In: Wind solar hybrid renewable energy system, pp. 1–11. UK: IntechOpen. [Google Scholar]
6. Irfan, M., Zhao, Z. Y., Ahmad, M., Mukeshimana, M. C. (2019). Critical factors influencing wind power industry: A diamond model based study of India. Energy Reports, 5, 222–1235. DOI 10.1016/j.egyr.2019.08.068. [Google Scholar] [CrossRef]
7. Adeyeye, K., Ijumba, N., Colton, J. (2020). Exploring the environmental and economic impacts of wind energy: A cost-benefit perspective. International Journal of Sustainable Development and World Ecology, 27(8), 718–731. DOI 10.1080/13504509.2020.1768171. [Google Scholar] [CrossRef]
8. Wang, S., Wang, S. (2015). Impacts of wind energy on environment: A review. Renewable and Sustainable Energy Reviews, 49, 437–443. DOI 10.1016/j.rser.2015.04.137. [Google Scholar] [CrossRef]
9. Chipindula, J., Sai, V., Botlaguduru, V. (2018). Life cycle environmental impact of onshore and offshore wind farms in texas. Sustainability, 10(2022), 1–18. DOI 10.3390/su10062022. [Google Scholar] [CrossRef]
10. Ohunakin, O. S. (2011). Wind resource evaluation in six selected high altitude locations in Nigeria. Renewable Energy, 36(12), 3273–3281. DOI 10.1016/j.renene.2011.04.026. [Google Scholar] [CrossRef]
11. Mayeed, M. S., Khalid, A. (2014). Designing wind turbines for areas with low wind speeds. Proceedings of the ASME 2014 4th Joint US-European Fluids Engineering Division Summer Meeting (FEDSM2014), 1–7. Chicago, Illinois, USA. [Google Scholar]
12. Li, X., Zhang, L., Song, J., Bian, F., Yang, K. (2020). Airfoil design for large horizontal axis wind turbines in low wind speed regions. Renewable Energy, 145, 2345–2357. DOI 10.1016/j.renene.2019.07.163. [Google Scholar] [CrossRef]
13. Bieniek, A. (2017). Analysis of wind energy generation possibilities with various rotor types at disadvantageous wind condition zones. E3S Web Conferences, 19, 1–6. [Google Scholar]
14. Ajayi, O. O., Ojo, O., Vasel, A. (2019). On the need for the development of low wind speed turbine generator system. IOP Conference Series: Earth and Environmental Science, 331, 1–12. DOI 10.1088/1755-1315/331/1/012062. [Google Scholar] [CrossRef]
15. Khan, S., Shah, K., Izhar-Ul-Haq, Khan, H. Ali, S. et al. (2014). Observation of the starting and low speed behavior of small horizontal axis wind turbine. Journal Wind Energy, 2014, 1–8. DOI 10.1155/2014/527198. [Google Scholar] [CrossRef]
16. Nongdhar, D., Goswami, B. (2018). Design of micro wind turbine for low wind speed areas: A review. ADBU Journal Electrical Electronics Engineering, 2(1), 39–47. [Google Scholar]
17. Gitano-Briggs, H. (2012). Low speed wind turbine design. In: Advances in wind power. pp. 1–18. UK: IntechOpen. [Google Scholar]
18. Ragunath, V. S., Pandey, J. K., Mondal, A. K., Karn, A. (2019). Electricity generation from wind turbines at low wind velocities: A review. SSRN Electronic Journal, 1–33. DOI 10.2139/ssrn.3372736. [Google Scholar] [CrossRef]
19. Kidane, H., Tekle, G. (2020). Design and analysis of 5 kW wind turbine blade for rural and remote areas institutions in Ethiopia: Case of degua warren kebele. Journal of Applied Mechanical Engineering, 9(3), 1–11. DOI 10.35248/2168-9873.20.9.334. [Google Scholar] [CrossRef]
20. Murshed, M., Arafat, M. Y., Abdur Razzak, M. (2019). Analysis of air foils and design of blades for a low-speed 250w vertical axis wind turbine suitable for coastal areas of Bangladesh. 1st International Conference on Advances in Science, Engineering and Robotics Technology 2019, pp. 1–6. East West University (EWUDhaka, Bangladesh. [Google Scholar]
21. Chen, Y. H., Hu, D. M., Zhao, Z. J. (2021). Low-speed wind turbine design based on Wilson theory. IOP Conference Series: Earth and Environmental Science, 621, 1–7. DOI 10.1088/1755-1315/621/1/012175. [Google Scholar] [CrossRef]
22. Kekezoğlu, B., Tanrıöven, M., Erduman, A. (2015). A new wind turbine concept: Design and implementation. Acta Polytechnic Hungarica, 12(3), 199–211. DOI 10.12700/APH.12.3.2015.3.12. [Google Scholar] [CrossRef]
23. Suresh, A., Rajakumar, S. (2019). Design of small horizontal axis wind turbine for low wind speed rural applications. Materials Today: Proceedings, 23, 16–22. DOI 10.1016/j.matpr.2019.06.008. [Google Scholar] [CrossRef]
24. Sudhakar, C. J., Joshi, D. R., Chitragar, N. R. (2019). A review on design of low wind speed wind turbines. International Journal of Innovative Research in Electrical, Electronics, Instrumentation and Control Engineering, 7(12), 23–28. DOI 10.17148/IJIREEICE.2019.71203. [Google Scholar] [CrossRef]
25. Deem, W. C. (1971). Portable folding ferris wheel. US3552747. [Google Scholar]
26. Adeyeye, K. A., Ijumba, N., Colton, J. S. (2021). A Techno-economic model for wind energy cost analysis for low wind speed areas. Processes, 9(1463), 1–21. DOI 10.3390/pr9081463. [Google Scholar] [CrossRef]
27. Biadgo, A. M., Aynekulu, G. (2017). Aerodynamic design of horizontal axis wind turbine blades. FME Transactions, 45, 647–660. DOI 10.5937/fmet1704647M. [Google Scholar] [CrossRef]
28. Adeyeye, K. A., Ijumba, N., Colton, J. S. (2021). A Multi-parameter optimization of capital cost, efficiency and mass of ferris wheel turbine for low wind speed regions. Energies, 14(6217), 1–19. DOI 10.3390/en14196217. [Google Scholar] [CrossRef]
29. Barber Wind Turbines (2018). Features and benefits. http://www.barberwindturbines.com. [Google Scholar]
30. Al-Addous, M., Saidan, M., Bdour, M., Dalala, Z., Albatayneh, A. et al. (2019). Key aspects and feasibility assessment of a proposed wind farm in Jordan. Inernational. Journal Low-Carbon Technolnologies, 15(1), 97–105. DOI 10.1093/ijlct/ctz062. [Google Scholar] [CrossRef]
31. Chaurasiya, P. K., Kumar, V. K., Warudkar, V., Ahmed, S. (2019). Evaluation of wind energy potential and estimation of wind turbine characteristics for two different sites. International Journal Ambient Energy, 1–24. DOI 10.1080/01430750.2019.1611634. [Google Scholar] [CrossRef]
32. Alluri, S. K. R., Gujjula, D., Krishnaven, B., Ganapathi, D., Phanikumar, S. V. S. et al. (2018). Offshore wind feasibility study in India. Stability Control and Reliable Performance of Wind Turbines, pp. 147–167. UK: IntechOpen. DOI 10.5772/intechopen.72160. [Google Scholar] [CrossRef]
33. Hulio, Z. H., Jiang, W., Rehman, S. (2017). Technical and economic assessment of wind power potential of nooriabad, Pakistan. Energy, Sustainability and Society, 7(1), 1–14. DOI 10.1186/s13705-017-0137-9. [Google Scholar] [CrossRef]
34. Premono, B. S., Tjahjana, D. D. D. P., Hadi, S. (2017). Wind energy potential assessment to estimate performance of selected wind turbine in northern coastal region of Semarang-Indonesia. AIP Conference Proceedings, 1788, 1–10. DOI 10.1063/1.4968279. [Google Scholar] [CrossRef]
35. Tong, W. (2010). Fundamentals of wind energy. In: Wind power generation and wind turbine design, WIT transactions on state of the art in science and engineering, vol. 44, pp. 3–48. UK: WIT Press. [Google Scholar]
36. Ahmed, M. B., Boudhir, A. A. (2018). Innovations in smart cities and applications. Proceedings of the 2nd Mediterranean Symposium on Smart City Applications, pp. 1–1046. Tangier, Morocco. [Google Scholar]
37. Adeyeye, K. A., Ijumba, N., Colton, J. (2021). The effect of the number of blades on the efficiency of a wind turbine. IOP Conference Series: Earth and Environmental Science, pp. 1–8. Tokyo, Japan, 801. [Google Scholar]
38. Schovanec, C., Agarwal, R. K. (2019). CFD modeling of a vertical axis wind turbine using actuator cylinder theory (Bachelors Thesis). Washington University, USA. [Google Scholar]
39. Sunny, K. A., Kumar, N. M. (2016). Vertical axis wind turbine: Aerodynamic modelling and its testing in wind tunnel. Procedia Computer Science, 93, 1017–1023. DOI 10.1016/j.procs.2016.07.305. [Google Scholar] [CrossRef]
40. Thönnißen, F., Marnett, M., Roidl, B., Schröder, W. (2016). A numerical analysis to evaluate betz's Law for vertical axis wind turbines. Journal of Physics Conference Series, 753(2), 1–8. DOI 10.1088/1742-6596/753/2/022056. [Google Scholar] [CrossRef]
41. Khan, M., Alavi, M., Mohan, N., AbidAzeez, A., Javed, B. (2017). Wind Turbine design and fabrication to power street lights. MATEC Web of Conferences, Malacca, Malaysia, 1–7. DOI 10.1051/matecconf/201710808010. [Google Scholar] [CrossRef]
42. Ragheb, M., Ragheb, A. M. (2016). Wind turbines theory-the betz equation and optimal rotor tip speed ratio. In: Fundamental and Advanced Topics in Wind Power, pp. 19–38. UK: IntechOpen. [Google Scholar]
43. Mukasa, A., Mutambatsere, E., Arvanitis, Y., Triki, T. (2013). Development of wind energy in Africa. Working Paper Series, vol. 170, pp. 1–44. Ivory Coast: African Development Bank Group. [Google Scholar]
44. Mentis, D. (2014). Wind energy assessment in Africa. A GIS-based approach (Master thesis). KTH School of Industrial Engineering and Management Energy Technology, Stockholm, Sweden. [Google Scholar]
45. Technical University of Denmark (DTU) (2020). The global wind atlas. https://www.globalwindatlas.info. [Google Scholar]
46. AWEO (2018). Size specifications of common industrial wind turbines. In: Technical specifications of common large wind turbines. http://aweo.org/windmodels.html. [Google Scholar]
47. Manwell, J. F., McGowan, J. G., Rogers, A. L. (2009). Wind energy explained theory, design and application (2nd Edition). West Sussex, UK: John Wiley & Sons, Ltd. [Google Scholar]
48. Idaho National Laboratory (2007). Idaho national laboratory power curves. https://www.wind-works.org/cms/…/Idaho_National_Laboratory_Power_Curves_2007.xls. [Google Scholar]
49. Barber Wind Turbines (2017). Barber wind turbines, 1–24. LLC Company & Technology. [Google Scholar]
50. Etcgreen (2009). Horizontal Axis Wind Turbine–1 MW. http://etcgreen.com/horizontal-axis-wind-turbine-1MW/. [Google Scholar]
51. Enercon (2016). Enercon E-48 800KW. https://www.enercon.de/en/products/ep-1/e-48/. [Google Scholar]
52. Clifton, A., Kilcher, L., Lundquist, J. K., Fleming, P. (2013). Using machine learning to predict wind turbine power output. Environmental Research Letters, 8(2), 1–8. DOI 10.1088/1748-9326/8/2/024009. [Google Scholar] [CrossRef]
53. Nordex (2009). N80/2500 n90/2300. http://www.nordex-online.com/fileadmin/MEDIA/Produktinfos/EN/Nordex_N80_2500_GB.pdf. [Google Scholar]
54. Boudia, S. M., Guerri, O. (2015). Investigation of wind power potential at Oran, northwest of Algeria. Energy Conversion and Management, 105, 81–92. DOI 10.1016/j.enconman.2015.07.055. [Google Scholar] [CrossRef]
55. Teyabeen, A. A., Akkari, F. R., Jwaid, A. E. (2017). Power curve modelling for wind turbines. IEEE 19th International Conference on Computer Modelling & Simulation, pp. 179–184. Cambridge, UK. [Google Scholar]
56. National Wind Watch (2018). Size of Industrial Wind Turbines. https://www.wind-watch.org/faq-size.php. [Google Scholar]
Appendix: Wind resource assessment results
 | This work is licensed under a Creative Commons Attribution 4.0 International License, which permits unrestricted use, distribution, and reproduction in any medium, provided the original work is properly cited. |