| Energy Engineering |
DOI: 10.32604/ee.2022.018864
ARTICLE
Thermogravimetric and Synergy Analysis of the Co-Pyrolysis of Coconut Husk and Laminated Plastic Packaging for Biofuel Production
Mechanical Engineering Department, Camarines Norte State College, Daet Camarines Norte, 4600, Philippines
*Corresponding Author: Joselito Olalo. Email: joselito_olalo@yahoo.com
Received: 21 August 2021; Accepted: 01 November 2021
Abstract: Unlike plastic, biomass can also be converted and produce high quality of biofuel. Co-pyrolysis of coconut husk (CH) and laminated plastic packaging (LPP) were done in this study. Synergy between these two feedstock was calculated by using thermogravimetric (TGA) and derivative thermogravimetry (DTG) analysis. Different activation energies of the reactions in the co-pyrolysis of CH and LPP were evaluated using the Coats-Redfern method. Results showed an activation energy ranging from 8 to 37 kJ/mol in the different percentage composition of the co-pyrolysis. Also, thermal degradation happens in two-stages in the co-pyrolysis of CH and LPP, in which CH degrades at the temperature range of 210°C to 390°C while LPP degrades in temperatures 400°C–600°C. Co-pyrolysis of CH and LPP can be an alternative for biofuel production and can also reduce the waste problems in the community.
Keywords: Coconut husk; laminated plastic packaging; co-pyrolysis; synergy
Utilizing different sources of waste biomass for possible production of biofuel were studied by different researchers worldwide due to depletion of commonly used of petroleum fuels especially in the transportation sector which comprise the largest portion of the fuel consumption, but the produced fuel yield and its quality were generally low [1,2]. But bio-oil generated can be upgraded by pyrolysing in high heating rates in fast thermal degradation procedure [3]. Co-pyrolysis with plastics were used to enhance yield and quality of biomass in which temperature and percentage composition of feedstock can directly influence the outcome of the process [4]. Temperatures from 400–600°C in the co-pyrolysis process will produce high percentage and additional oil yields by giving details on the possible interactions via synergy in between the type of feedstock being used [5–7]. Co-pyrolysis between different waste biomass and waste plastics focused primarily with production of percentage oil yield, but not in terms of how the feedstock interact by way of synergy analysis. Some papers quantify how each synergy analysis affects the percentage oil yield in the co-pyrolysis using TGA [8]. Computation of synergy in determining the activation energy was assumed as a first order reaction by way of Arrhenius equation in the co-pyrolysis process [9,10]. Rate synergy was the difference between the observed mass decomposition rate from the co-pyrolysis of the mixture and the weighted sum of the observed mass decomposition rates from the individual pyrolysis of biomass and plastic components. The mass decomposition rate during pyrolysis resembles to the rate of generating bio-oil and syngas. The ratio between the co-pyrolysis of biomass and plastic was a significant factor which affects the output yield and the overall characteristics of the process [11].
This study focused primarily in the determination of the possible effects of the set temperatures to the percentage composition of the coconut husk and laminated plastic packaging in the output rate synergy by using Coats-Redfern method for which was used in the thermal degradation of biomass and some mixtures of coal [12].
2.1 Coconut Husk and Laminated Plastic Packaging Feedstock
Coconut husk (containing both the outer skin and fibers between the skin and coconut shell) and waste laminated plastic packaging (LPP) were obtained from Payatas dumpsite (14.70899, 121.09830) in Quezon City, Philippines. They were cleaned and dried (air-dried). For the thermogravimetric analysis (TGA), the feed materials were pulverized and sieved through a 1-mm sieve to prevent formation of temperature gradient during the process [13]. Weighed from range of 5 to 10 mg using analytical balance, CH-LPP blends of various proportions (0, 30, 65, 70, 80 and 100 mass %CH) were placed and mixed in vials and vortex mixer, respectively.
2.2 TGA of Different Mixtures of Coconut Husk and Laminated Plastic Packaging
The thermal decomposition of the feedstocks CH, LPP and their blends were analyzed using Q500 TA thermogravimetric analyzer at a constant heating rate of 20 °C/min from 30°C–800°C using N2 gas at 40 ml/min for purging. For each run, thermogravimetric analysis (TGA) and derivative thermogravimetric (DTG) analysis were generated. The DTG was calculated in Eq. (1). The thermal decomposition plots were prepared using TA Universal Analysis software.
2.3 Analysis of Response Variable
For this study, the rate synergy (Ψ) is defined as the difference between the weight loss rate (R) from the TGA of the CH and LPP (Rmixture) and the sum of the weight loss rates from the individual pyrolysis of the CH (RCH) and plastic (RLPP) each multiplied by their respective weight fractions (xCH and xLPP) in the mixture shown in Eq. (2) [14]. The values of the RCH, and RLPP were determined in the DTG plots. The Ψ values were calculated from the start temperature of 30°C and finishing temperature of 800°C in each TGA runs for the different percentage compositions. The Ψ-temperature plots for various CH-LPP blends were evaluated.
2.4 Using Values of Activation Energy
Another synergy analysis approach is through the evaluation of activation energy (E). In this study, it was determined for the various degradation process stages using first-order kinetic models, also known as chemical reaction order 1 [15], with model in Eq. (3), g(α) which presents the integral reaction model function.
Using integral method, the activation energy, kinetic parameters as well as pre-exponential factor on the co-pyrolysis of biomass with some polymers can be generated [15]. In previous studies, pyrolysis and co-pyrolysis were both assumed to involve first order reactions. The kinetic computation in Eq. (4) was all based on the equation of Arrhenius [16].
where A is a pre-exponential factor (min-1); E is activation energy (J/mol); R is the ideal gas constant (8.314 J mol−1K−1); T is the absolute temperature (K); t is time; and α is the weight loss fraction or pyrolysis or co-pyrolysis conversion. The latter is defined in Eq. (5), where m0 is the initial mass of the mixture, mt is the instantaneous mass (at any time t) and mf is the final mass, i.e., residual mass.
For a constant heating rate, β = dT/dt, rearranging Eq. (3) and integration gives as shown in Eq. (6):
The first term on the right side of Eq. (6), i.e., ln[AR/βE(1 – 2RT/E)] has been found to be approximately constant for most values of E and for the temperature range of co-pyrolysis [15]. Thus, plotting the left side of the equation ln[−ln (1 − α)/T2] against 1/T would show a straight line, whose slope is equal to −E/R. The slope can be derived by linear regression. The value of the activation energy, E, can be derived from the slope. The first term of the Eq. (6), can be derived from the y-intercept of the line or at the median mass (mo + mf)/2. From this value, the pre-exponential factor A can be derived.
Using the above method, for each TGA run, the value ln(−ln(1 − α)/T2) was plotted against 1/T and by linear regression the derived slope was used to calculate the activation energy value.
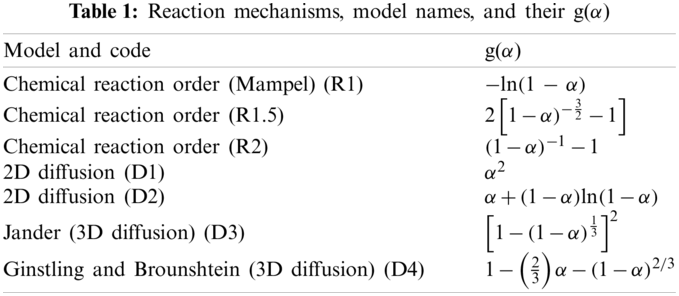
For the other kinetic models presented in Table 1, a similar technique was done, i.e., according to the Coats-Redfern curve-fitting model in Eq. (6), but this time, for the g(α) of the corresponding kinetic model was used and where the functions of the fractional conversion, α, was presented in the right side column of Table 1. By linear regression of the ln[g(α)/T2] vs. [1/T], the corresponding activation energy value, E, for the model was determined. The E value was obtained from the model, for which the linear regression R2 is closest to 1.
The ECH−LPP blend values for the CH-LPP blends were compared with those obtained from the sum of the E values of 100%CH and 100%LPP, weighted according to their corresponding mass fractions (x) as shown in Eq. (7):
Some of the kinetic models presented in Table 1, were curve-fitted to the fractional conversion, α, vs. temperature T data, using the Coats-Redfern integral method, which involved linear regression. The thermo-kinetic parameters, E and A were generated from the y-intercept and slope of the line. The fit of the models were evaluated through their R2 values.
In thermogravimetric analysis, at a constant heating rate, the percent mass loss vs. temperature is plotted (usually termed TG plot). From this data, the following are derived: (a) the fractional conversion (α) at any time t, and the rate of change in percent mass loss with temperature vs. temperature. The latter is commonly called the DTG plot, where the maximum rate of reaction and the various reaction stages can be seen.
With the value of activation energy determined using the above techniques, or any other curve-fitting model, the thermodynamic property changes of the process can be determined: the enthalpy change, ΔH (Eq. (8)); the Gibbs free energy change, ΔG (Eq. (9)); and the entropy change, ΔS (Eq. (10)).
where: KB = Boltzmann constant, 1.381 × 10⁻²³ m2 kg/s−2 K−1
Tm = maximum temperature at which maximum decomposition occur
h = Planks constant, 6.626 × 10⁻³⁴ m2 kg/s
R = universal gas constant, 0.008314 kJ/mol K
3.1 TGA of CH, LPP and Percentage Compositions
The thermogravimetric and derivative thermogravimetric analysis are presented in Fig. 1, for 100%CH and in Fig. 2, for the various CH-LPP blends. The mass loss at temperature below 150°C must be due to vaporization of moisture and other volatiles in the coconut husk (CH). This percentage increased with increasing %CH up to 100%CH.
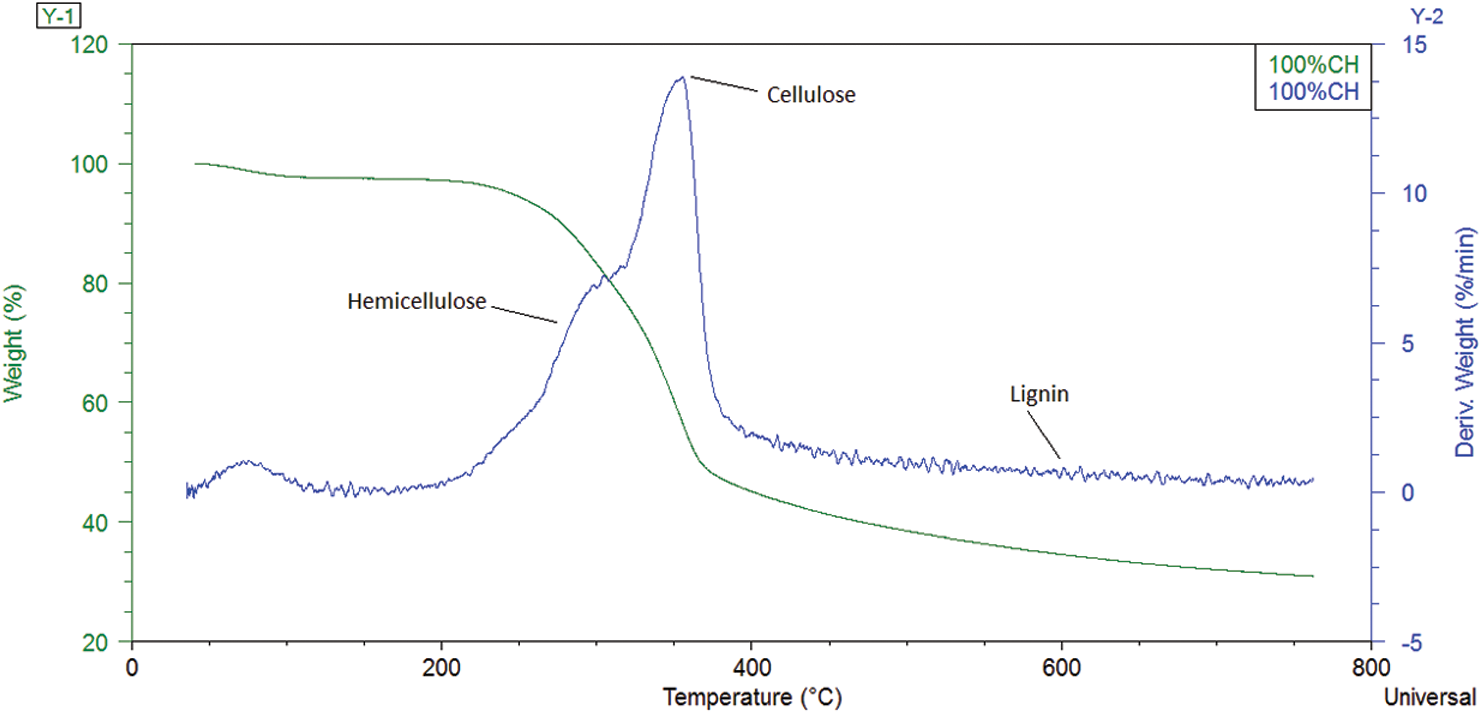
Figure 1: Combined TGA-DTG plots for 100%CH
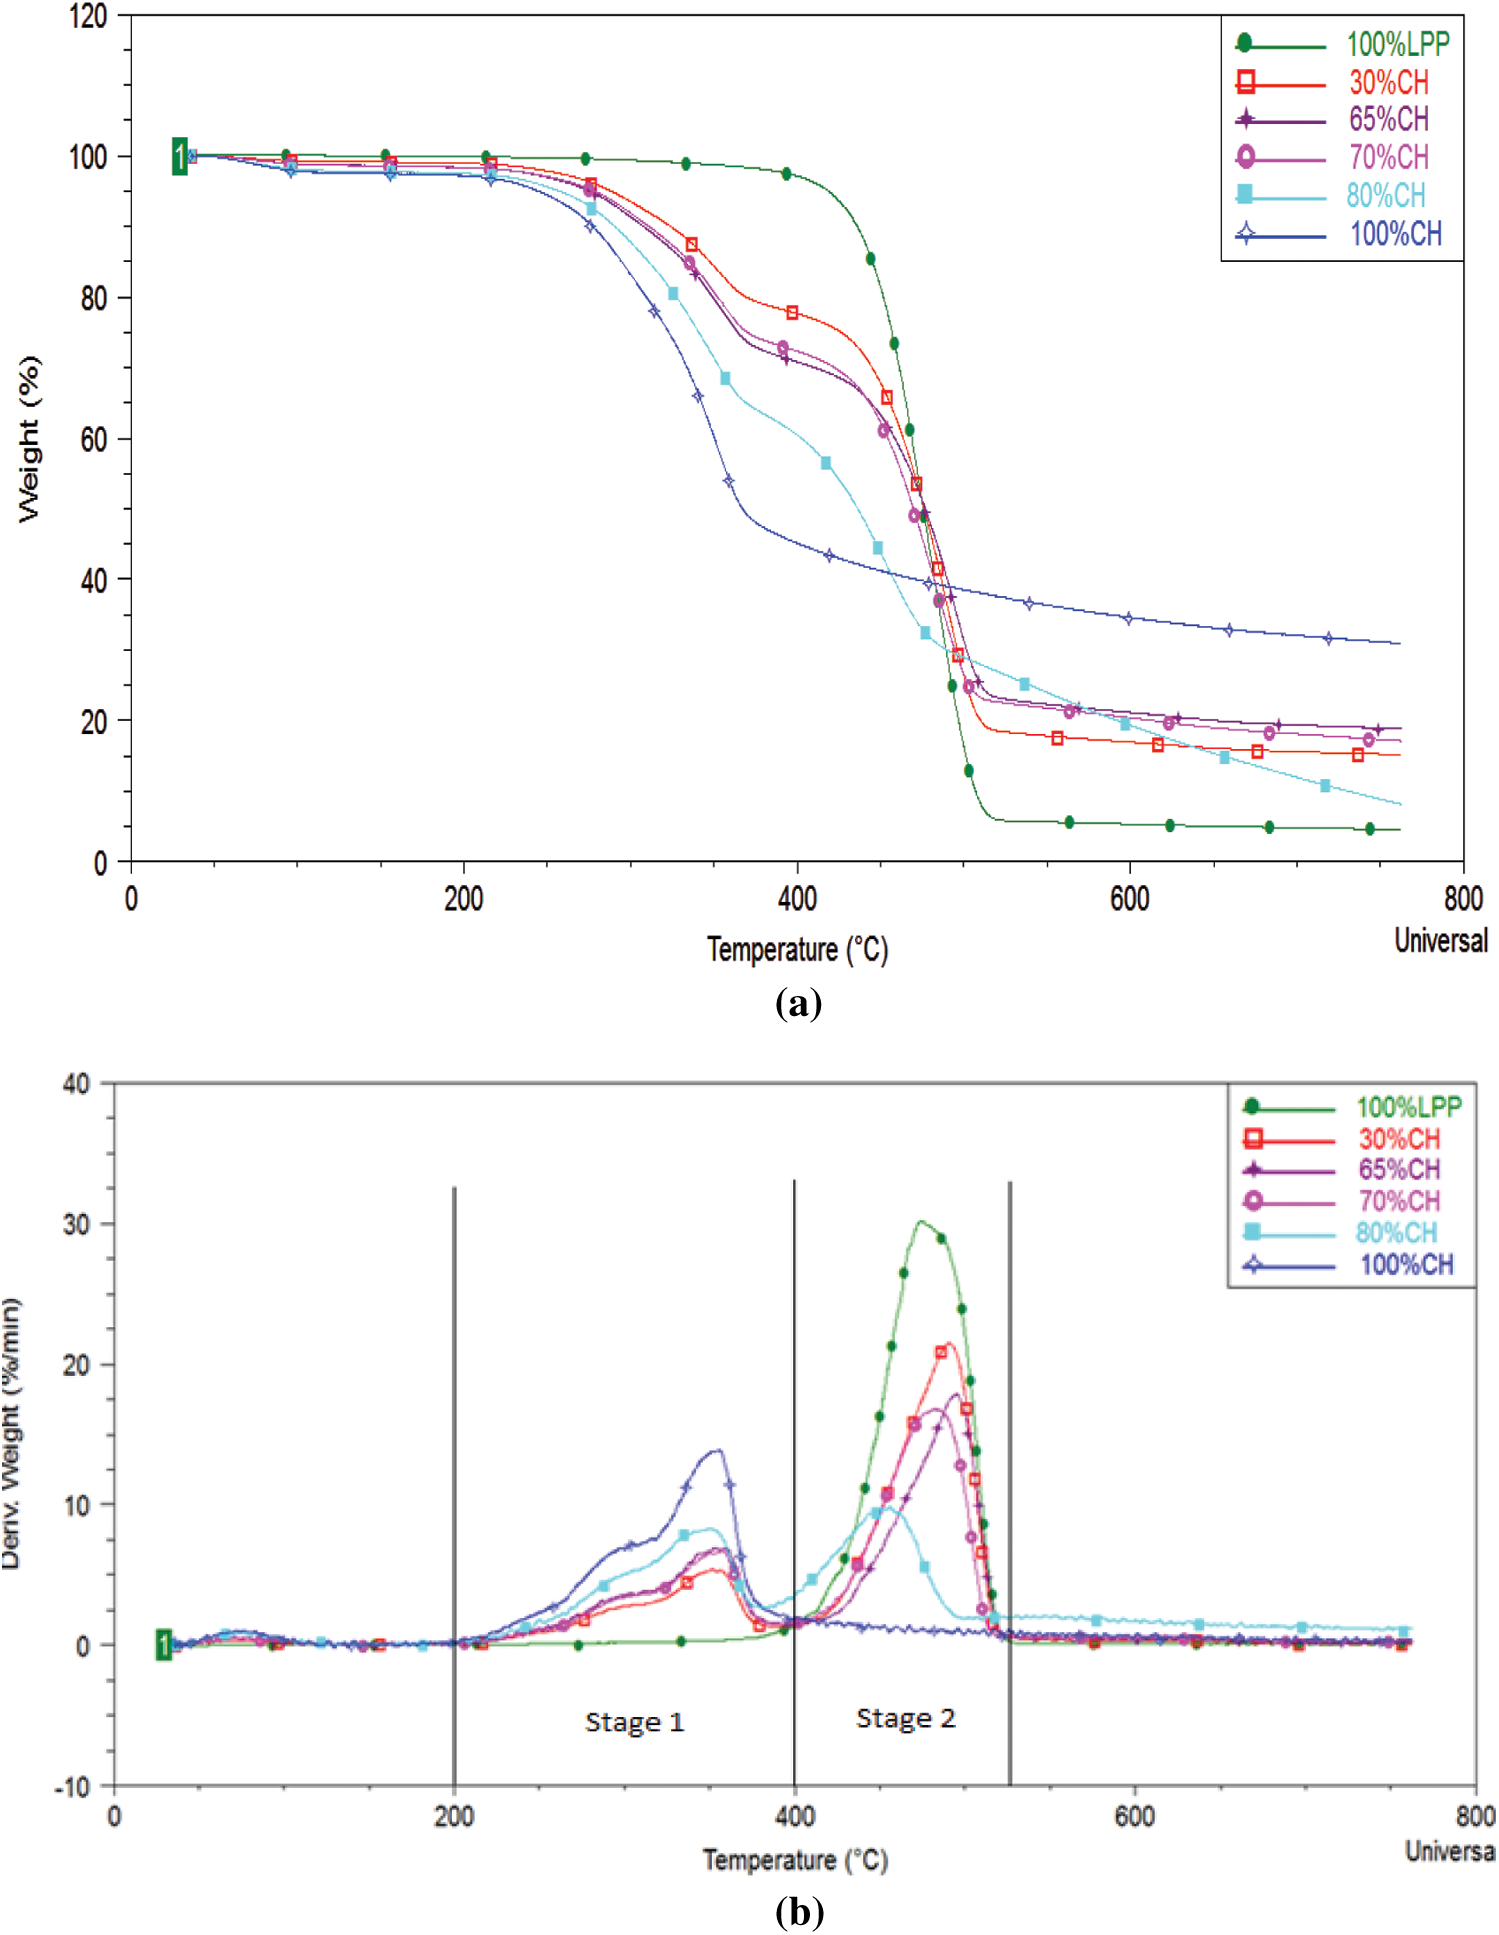
Figure 2: (a) The TGA curves for coconut husks (CH) and various CH-LPP blends (b) The DTG curves for laminated plastic packaging (LPP), and various CH-LPP blends
Thermal degradation of 100%CH occurred at 210°C–390°C. At the fast degradation of CH, i.e., 210°C–390°C, the DTG curves show two overlapping peaks, one between 210°C and 320°C, and the other between 320°C and 390°C. The initial peak was most likely due to hemicellulose, whose degradation usually occurs at 200°C–260°C [17] and 220°C–315°C [18]. The second DTG peak, between 320°C and 390°C represents thermal degradation of cellulose, which ordinarily takes place at 320°C–380°C [19] or 315°C–400°C [18].
The degradation temperature of cellulose is higher than that of hemicellulose because cellulose, compared to the hemicellulose, has a more rigid structure, owing to its highly crystalline polysaccharide configuration. The lower area below the first DTG peak (210°C–320°C) compared to the second peak (320°C–390°C) confirms that coconut husks contains smaller amount of hemicellulose (11%–17%) [20], 23% [21] than cellulose (18%–21%) [20], 33%–36% [21].
The thermal degradation of lignin, which is composed of complex structure of various functional groups, proceeds at wider temperature range, i.e., 160°C–900°C [18]. Coconut husk, contains 32%–53% lignin [21]. The TG plot of coconut husk shows that the 40% remaining mass at 500°C must be lignin. The latter slowly degrades further, up to a residual mass of 30%. The degradation of lignin is slow and spread widely, probably already beginning at 200°C and overlaps those of hemicellulose and cellulose. The slow weight loss from 44% at 400°C to 30% at above 750°C must be due to the thermal degradation of lignin.
The thermal degradation of 100% plastics occurred at 390°C–520°C. Unlike the TG curve for 100%CH, below 150°C, there was no weight loss in plastics, indicating that it does not contain water and compounds that will decompose or volatilize below 150°C. The TG curve shows a much faster weight loss with temperature. The DTG peak height is higher for plastics.
Unlike those of the individual 100%CH and 100% plastics, in the coconut husk–plastic laminate (CH-LPP) blends, there are two main stages of degradation processes: the one at 200°C–390°C and the one at 390°C–520°C. The first stage shows overlapping DTG peaks similar to those of 100%CH. This must represent the various decomposition temperature ranges of the various coconut husk components–hemicellulose, cellulose and lignin. In the second stage, DTG peak similar to that of 100%LPP (390°C–520°C) must be the decomposition of the plastics in the blends. As the proportion of CH in the blend increases, the first stage DTG peak height increases while that of the second stage decreases (decomposition of the plastics). The second peak, which represents the degradation of the plastics, is much higher than that of the first peak, which represents the degradation of CH which are further illustrated by the melting of plastics below 380°C, a process that hinders release of volatiles in covering the surfaces of CH [22].
An exception from the general TG and DTG trends is that of the 80%CH blend, the second peak is only a bit higher than that of the first peak. This small difference can be explained by the proportion of the plastics being only 25% compared with the initial mass of CH in the blend. Another quite unique characteristic of the TG and DTG plots at 80%CH is that the second peak rate occurred at a slightly lower temperature compared to the other blends. This peak rate temperature lowering phenomenon is seen in previous studies where catalysts were used. Probably, at 80%CH, there is a higher mass ratio of catalytic intermediates to LPP plastics, so that the LPP components decomposed at lower temperature. At lower CH to LPP proportions, the LPP that melts probably covered much of the coconut husks, thereby hindering the generation and release of intermediates which could catalyze the decomposition of the plastics.
Unlike in other studies that used pure plastic polymers and the DTG peak rate temperature slightly increases with increasing plastic polymer proportions, in this study the second peaks for CH-LPP blends of 30, 65 and 70%CH, were not consistently at the same temperature although heating rate was constant. This variation may be due to the heterogeneity of the LPP, which may contain varying amounts of PET, PP and PE [23]. The DTG peaks for these types of plastics are at the same heating rates of 20°C were 440°C, 450°C and 480°C, respectively.
The residual weight increases with increasing CH content in the CH-LPP blends in Fig. 2. Probably, the degradation of plastics produced substances that catalyzed the degradation of the remaining lignin from coconut husks. Another possible phenomena is that the degradation of the LPP produced substances that catalyzed the degradation of the lignin.
3.2 Rate Synergy at Various CH:LPP Proportions
The temperature plots for rate synergy at different percentage composition of CH-LPP are shown in Fig. 3. High positive Ψ values were found between 400°C–530°C for the 70% and 80%CH blends. At these CH to LPP proportions, the rate synergy values below 400°C were negative, indicating that the weight loss due to the decomposition of coconut husks was impeded by the melting plastics probably because the melting plastics covered the coconut husks, thereby hindering the release of volatile substances or the melted plastic covering the coconut husk slowed down the decomposition of coconut husk. At 70 and 80%CH blends and at temperatures between 400°C and 500°C, in which the plastics were degrading, synergy values were positive indicating a synergistic effect of co-pyrolysis on the reaction rates. At 30%CH, there was hardly any synergistic effects of co-pyrolysis on the process rate. The rate synergy value was mostly negative at temperatures where the plastics are already degrading.
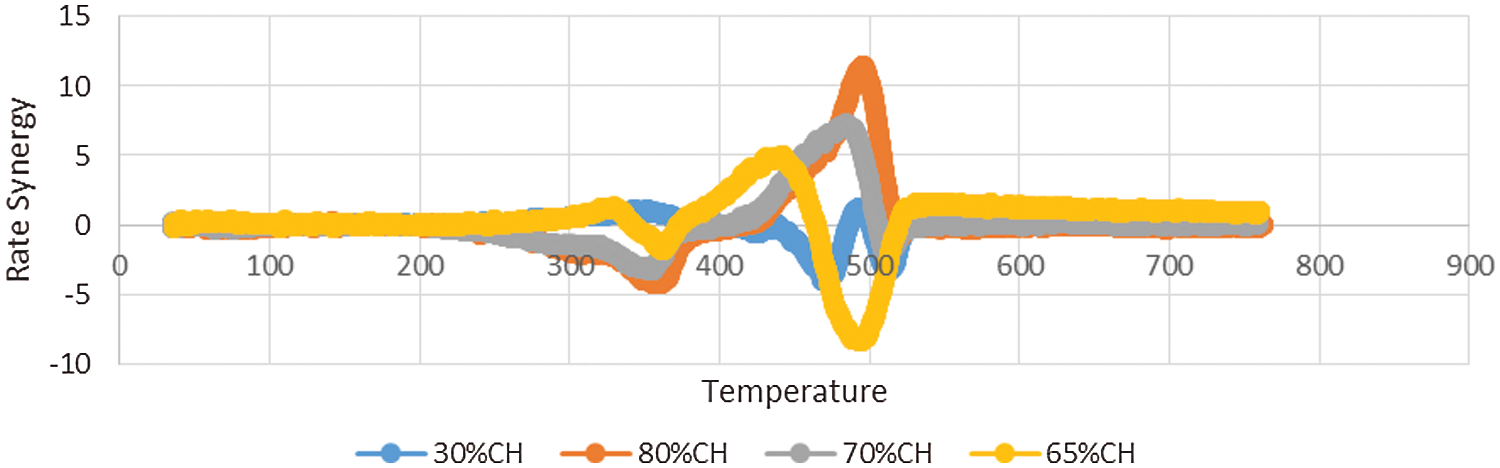
Figure 3: Rate synergy vs. temperature at various CH-LPP proportions
As earlier noted the residual mass decreased with increasing proportion of plastics. But the decrease was not proportional to the amount of coconut husk in the feedstock mixture. As earlier discussed, this indicates that the degradation of lignin, which usually occurs from 200°C–700°C, was enhanced in the co-pyrolysis of CH and LPP, probably because some substances produced by the degradation of the CH-LPP mixture reacted with lignin.
3.3 Activation Energy Analysis
Plots of ln(−ln(1 − x)/T2) vs. 1/T for the different CH-LPP blends are shown in Fig. 4. The line for 100%LPP has the highest slope, i.e., highest activation energy. The lines for the 100%CH and the blends have lower slopes, i.e., lower activation energy. The latter are linear but with a change in slope at 364°C to a lower one.
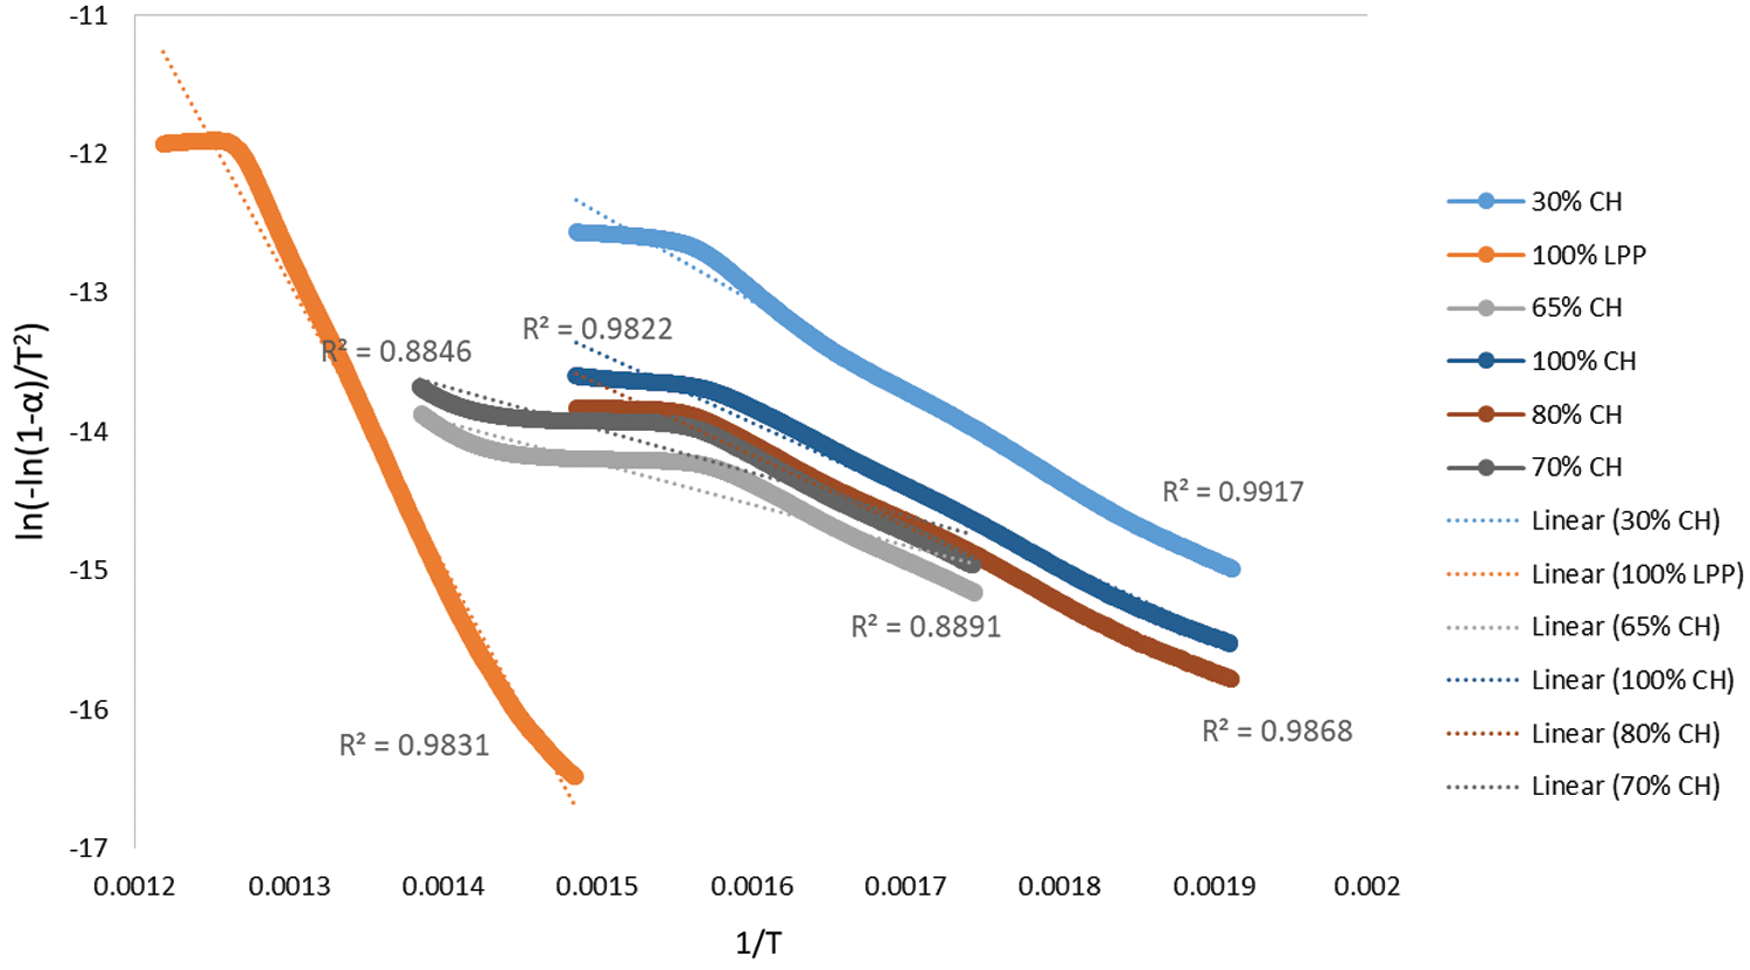
Figure 4: Plot of ln(−ln(1 − α)/T2) vs. 1/T for the different CH:LPP blends
The activation energy for the different feedstock CH-LPP blends are presented in Table 2, assuming that the overall decomposition of the blends are described by only one model. The activation energy of 100%LPP was 166.29 kJ/mol, while that of 100%CH was 31.99 kJ/mol. The activation energy values of the blends were much lower than that of the sum of the activation energy of the 100%LPP and 100%CH, weighted according to their mass percent (Fig. 5). This trend in the activation energy values confirms the occurrence of rate synergy in co-pyrolysis of CH and LPP. This findings is consistent in the co-pyrolysis of biomass, i.e., corn stover and wood, with plastics, i.e., LDPE and HDPE [14]. Other previous works found similar synergy in biomass-plastics co-pyrolysis [24]. The activation energy calculated, for the different feedstock CH-LPP blends are presented in Table 2.
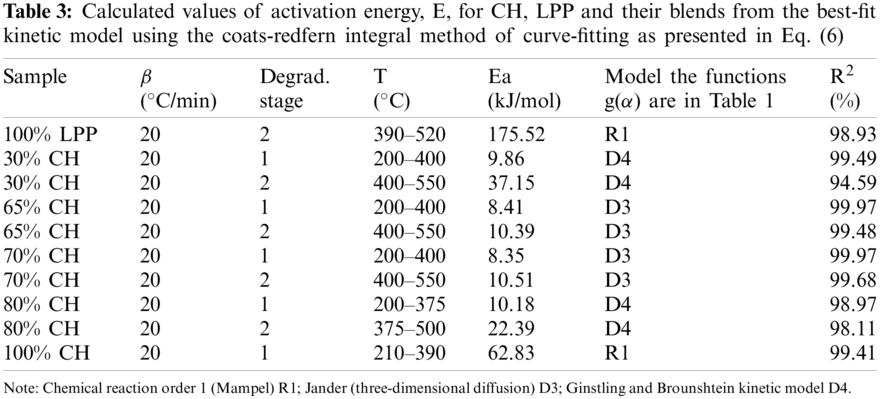
It is apparent that the plots of ln(−ln(1 − α)/T2) vs. 1/T for 100%CH and for the CH-LPP mixtures have two stages with different slopes: one was the CH pyrolysis at temperature 200°C–400°C, and the other was the LPP pyrolysis at 400°C–500°C. For these, two activation energy values were calculated from the slopes of the two stages using several models. For a particular CH-LPP mixture, the value of E was obtained from the best-fit kinetic model. These values are presented in Table 3 for the two stage.
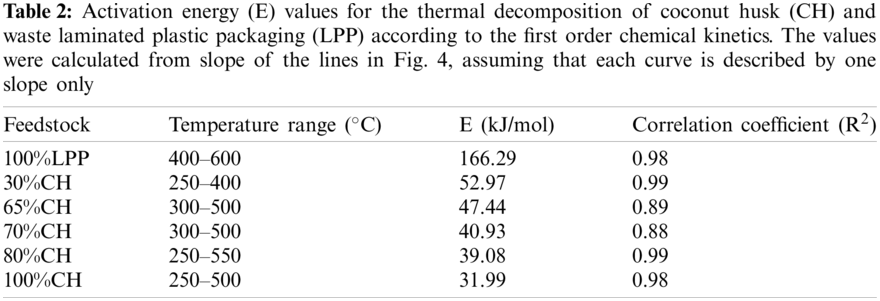
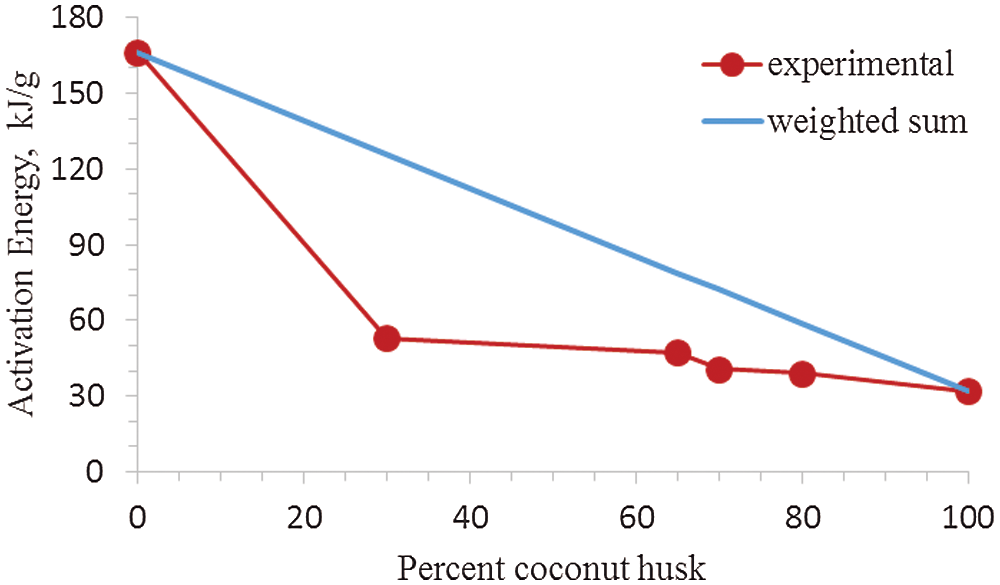
Figure 5: Activation energy of different CH-LPP blends vs. percent coconut husk: Experimental value vs. weighted sum of activation energy values of 100%CH and 100%LPP
The E values for the different CH-LPP blends are much lower than the sum of the activation energy of 100%CH and 100%LPP each weighted according to their mass percent in Fig. 6. This lowering in E as compared to the weighted sum of E for the two materials indicate that indeed there was synergy in the co-pyrolysis of CH and LPP when the activation energy values of the blends of CH and LPP were much lower than that of the sum of the activation energy of the 100%LPP and 100%CH.
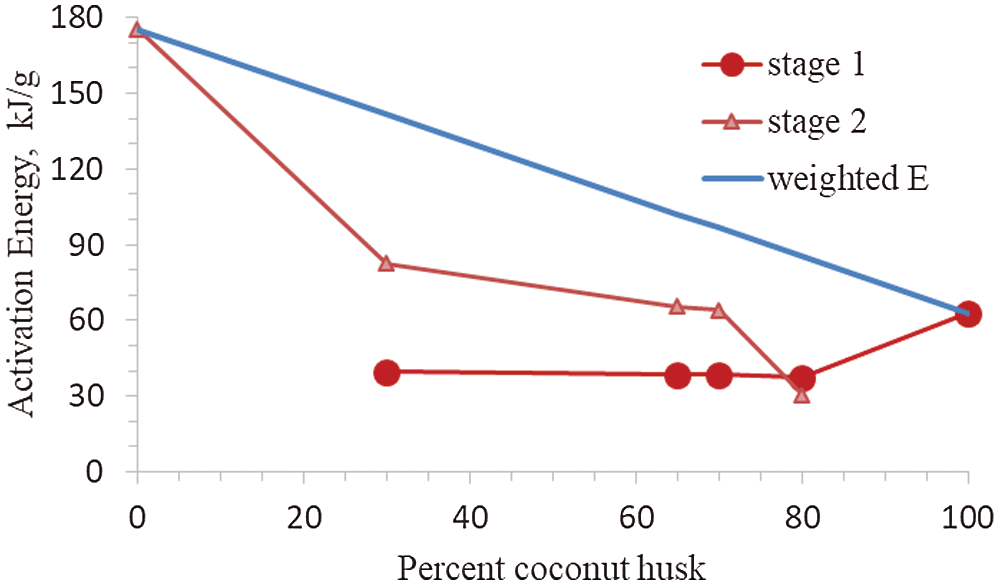
Figure 6: Activation energy calculated values of activation energy, E, for CH, LPP and their %CH composition from the best-fit kinetic model using the coats-redfern integral method of curve-fitting. The best-fit kinetic models used to calculate the E values are shown in Table 2
3.4 Kinetics of CH and LPP Co-Pyrolysis
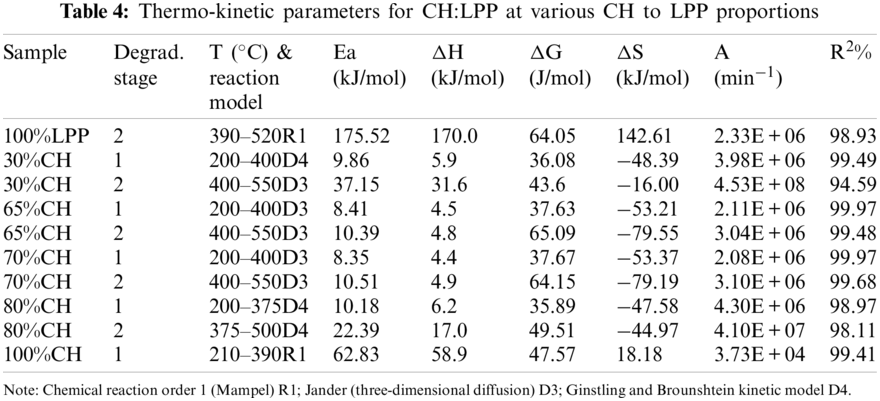
As shown in Table 4, the model of stage 1 from the pyrolysis of coconut husk is a first-order reaction (R1) with correlation coefficient of 99.41%. The top kinetic model in the pyrolysis of coconut husk are R1, R2, D2 and D1 with R2 values of 99.41%, 98.9%, 98.9% and 98.43%, respectively. Model R1 has also the highest correlation in 100%LPP with R2 value of 98.93%. At lowest and highest percentage of CH proportions, the reactions shifted to Ginstling and Brounshtein kinetic model D4. While for the middle proportions of CH (65%CH, 70%CH), the kinetic model was closed to Jander diffusion model with R2 ranging from 99.48% to 99.97%. For R2 values, R1 has highly correlation in the ordinary reaction orders and diffusion-type models. Finally, the whole pyrolysis process is not described by one kinetic model alone. The rate of the process as a function of the remaining mass of the materials behave differently at various stages and it is hard to assess which type of kinetic models that supports the thermal decomposition behavior in the co-pyrolysis of biomass with various types of plastics [14].
As shown in Fig. 6, the activation energy in Stage 2 increases with addition of LPP proportion. Pure LPP produced the highest activation energy at 175.52 kJ/mol in kinetic model R1. As the percentage of composition of CH goes up, the activation energy went down up to 22.39 kJ/mol at 80%. While for pure CH, the highest activation energy generated was 62.83 kJ/mol using kinetic model R1. This was similar to the co-pyrolysis of corn stover and plastic, that the decreasing of the activation energy with the increase of percentage composition of biomass, was deeply correlated with the synergistic aspects [14]. The rate-limiting step in the co-pyrolysis of CH and LPP is the decomposition of plastics, which required higher activation energy and higher temperatures. The mass proportions of the CH-LPP blends affects the overall rates of co-pyrolysis process. Increasing the %CH decreases the activation energy. The lower the activation energy the larger the rate of limiting step, which is the decomposition of LPP. The dependence of the rate of the process on mass or concentration varies at various stages of the process. The decomposition of plastics is the rate-limiting step. The lower the activation energy the larger the rate of limiting steps, while higher activation energy lowers the rate of limiting steps.
3.5 Thermodynamics of CH and LPP Co-Pyrolysis
From above discussions, different models describe the kinetics of the pyrolysis of the different blends. For each blend the pre-exponential (A) and activation energy (E) values were different for the two stages 200°C–400°C and 400°C–500°C. Generally, the second stage, which mainly represents the decomposition of LPP, has higher activation energy (E), higher magnitude of Gibbs free energy change (ΔG), and higher value of the pre-exponential factor A.
This study looked into the potential of co-pyrolysis as a means of converting waste single-use laminated plastic packaging and coconut husk for biofuel production. Overall, this study elucidated the factors influencing the process and how the co-pyrolysis process of these specific waste materials behave. The results lead to the following specific conclusions:
1. The thermal degradation (at constant heating rate of 20°Cmin−1) of the LPP occurs at 390°C–520°C. The degradation of CH occurs at lower temperatures 210°C–390°C and at two stages with peak rates for hemicellulose at 200°C–260°C, and 390°C–520°C for cellulose. The thermal decomposition of CH-LPP percentage composition occurs in two stages. The first stage was for the hemicellulose and cellulose parts of CH and the second stage for the LPP, remaining CH, including lignin.
2. Rate synergy occurs in the co-pyrolysis of coconut husk and waste single-use LPP, as evident in overall positive rate synergy factor value and a lowering of the activation energy of the process. This synergy has increased the extent of degradation of CH and decreased the residual solids.
This study contributes an important knowledge for the design of practical co-pyrolysis process and further development or improvement of the process.
Funding Statement: The author would like to acknowledge the big help of the Department of Science and Technology in funding this research.
Conflicts of Interest: The author declares that they have no conflicts of interest to report regarding the present study.
1. Behrooznia, L., Sharifi, M., Hosseinzadeh-Bandbafha, H. (2020). Comparative life cycle environmental impacts of two scenarios for managing an organic fraction of municipal solid waste in rasht-Iran. Journal of Cleaner Production, 268, 122217. DOI 10.1016/j.jclepro.2020.122217. [Google Scholar] [CrossRef]
2. Hawash, S. I., Farah, J. Y., El-Diwani, G. (2017). Pyrolysis of agriculture wastes for bio-oil and char production. Journal of Analytical and Applied Pyrolysis, 124, 369–72. DOI 10.1016/j.jaap.2016.12.021. [Google Scholar] [CrossRef]
3. Yin, C. (2012). Microwave-assisted pyrolysis of biomass for liquid biofuels production. Bioresource Technology, 120, 273–84. DOI 10.1016/j.biortech.2012.06.016. [Google Scholar] [CrossRef]
4. Safar, M., Lin, B. J., Chen, W. H., Langauer, D., Chang, J. S. et al. (2019). Catalytic effects of potassium on biomass pyrolysis, combustion and torrefaction. Applied Energy, 235, 346–55. DOI 10.1016/j.apenergy.2018.10.065. [Google Scholar] [CrossRef]
5. Olalo, J. (2021). Characterization of pyrolytic oil produced from waste plastic in quezon city, Philippines using non-catalytic Pyrolysis method. Chemical Engineering Transactions, 86, 1495–1500. DOI 10.3303/CET2186. [Google Scholar] [CrossRef]
6. Hassan, H., Lim, J. K., Hameed, B. H. (2016). Recent progress on biomass co-pyrolysis conversion into high-quality bio-oil. Bioresource Technology, 221, 645–55. DOI 10.1016/j.biortech.2016.09.026. [Google Scholar] [CrossRef]
7. Abnisa, F., Wan Daud, W. M. A. (2014). A review on co-pyrolysis of biomass: An optional technique to obtain a high-grade pyrolysis oil. Energy Conversion and Management, 87, 71–85. DOI 10.1016/j.enconman.2014.07.007. [Google Scholar] [CrossRef]
8. Han, B., Chen, Y., Wu, Y., Hua, D., Chen, Z. et al. (2014). Co-pyrolysis behaviors and kinetics of plastics-biomass blends through thermogravimetric analysis. Journal of Thermal Analysis and Calorimetry, 115, 227–35. DOI 10.1007/s10973-013-3228-7. [Google Scholar] [CrossRef]
9. Fekhar, B., Miskolczi, N., Bhaskar, T., Kumar, J., Dhyani, V. (2018). Co-pyrolysis of biomass and plastic wastes: Investigation of apparent kinetic parameters and stability of pyrolysis oils. Proceedings of the 7th International Conference on Clean and Green Energy in Paris, France, 154, 012022. DOI 10.1088/1755-1315/154/1/012022. [Google Scholar] [CrossRef]
10. Cepeliogullar, O., Putun, A. E. (2014). A pyrolysis study for the thermal and kinetic characteristics of an agricultural waste with two different plastic wastes. Waste Management & Research, 32, 971–979. DOI 10.1177/0734242X14542684. [Google Scholar] [CrossRef]
11. Tang, Z., Chen, W., Chen, Y., Yang, H., Chen, H. (2019). Co-pyrolysis of microalgae and plastic: Characteristics and interaction effects. Bioresource Technology, 274, 145–52. DOI 10.1016/j.biortech.2018.11.083. [Google Scholar] [CrossRef]
12. Cai, J., Bi, L. (2008). Precision of the coats and redfern method for the determination of the activation energy without neglecting the low-temperature end of the temperature integral. Energy & Fuels, 22, 2172–4. DOI 10.1021/ef8002125. [Google Scholar] [CrossRef]
13. Jerzak, W., Kuznia, M. (2020). Examination of inorganic gaseous species and condensed phases during coconut husk combustion based on thermodynamic equilibrium predictions. Renewable Energy, 167, 497–507. DOI 10.1016/j.renene.2020.11.105. [Google Scholar] [CrossRef]
14. Salvilla, J. N. V., Ofrasio, B. I. G., Rollon, A. P., Rollon, A. P., Manegdeg, F. G., Luna, M. (2020). Synergistic co-pyrolysis of polyolefin plastic with wood and agricultural wastes for biofuel production. Applied Energy, 279, 115668. DOI 10.1016/j.apenergy.2020.115668. [Google Scholar] [CrossRef]
15. Zhang, X., Lei, H., Zhu, L., Zhu, X., Qian, M. et al. (2016). Thermal behavior and kinetic study for catalytic co-pyrolysis of biomass with plastics. Bioresource Technology, 220, 233–8. DOI 10.1016/j.biortech.2016.08.068. [Google Scholar] [CrossRef]
16. Flynn, J., Wall, L. (1966). A quick, direct method for the determination of activation energy from thermogravimetric data. Polymer Letters, 4, 323–328. DOI 10.1002/pol.1966.110040504. [Google Scholar] [CrossRef]
17. Mamaeva, A., Tahmasebi, A., Tian, L., Yu, J. (2016). Microwave-assisted catalytic pyrolysis of lignocellulosic biomass for production of phenolic-rich bio-oil. Bioresource Technology, 211, 382–9. DOI 10.1016/j.biortech.2016.03.120. [Google Scholar] [CrossRef]
18. Yang, H., Yan, R., Chen, H., Lee, D. H., Zheng, C. (2007). Characteristics of hemicellulose, cellulose and lignin pyrolysis. Fuel, 86, 1781–1788. DOI 10.1016/j.fuel.2006.12.013. [Google Scholar] [CrossRef]
19. Song, F., Wang, X., Li, T., Zhang, J., Bai, Y. et al. (2019). Spectroscopic analyses combined with Gaussian and coats-redfern models to investigate the characteristics and pyrolysis kinetics of sugarcane residue-derived biochars. Journal of Cleaner Production, 237, 117855. DOI 10.1016/j.jclepro.2019.117855. [Google Scholar] [CrossRef]
20. Ding, T. Y., Hii, S. L., Ong, L. (2012). Comparison of pretreatment strategies for conversion of coconut husk fiber to fermentable sugars. BioResources, 7(2), 1540–1547. DOI 10.15376/biores.7.2.1540-1547. [Google Scholar] [CrossRef]
21. Aziz, N. A., Latip, A. F. A., Peng, L. C., Abd Latif, N. H., Brosse, N. et al. (2019). Reinforced lignin-phenolglyoxal (LPG) wood adhesives from coconut husk. International Journal of Biological Macromolecules, 141, 185–196. DOI 10.1016/j.ijbiomac.2019.08.255. [Google Scholar] [CrossRef]
22. Xiong, S., Zhuo, J., Zhou, H., Pang, R., Yao, Q. (2015). Study on the co-pyrolysis of high density polyethylene and potato blends using thermogravimetric analyzer and tubular furnace. Journal of Analytical and Applied Pyrolysis, 112, 66–73. DOI 10.1016/j.jaap.2015.02.020. [Google Scholar] [CrossRef]
23. Turku, I., Karki, T., Rinne, K., Puurtinen, A. (2017). Characterization of plastic blends made from mixed plastics waste of different sources. Waste Management & Research, 35(2), 200–206. DOI 10.1177/0734242X16678066. [Google Scholar] [CrossRef]
24. Chen, W., Shi, S., Zhang, J., Chen, M., Zhou, X. (2016). Co-pyrolysis of waste newspaper with high-density polyethylene: Synergistic effect and oil characterization. Energy Conversion and Management, 112, 41–48. DOI 10.1016/j.enconman.2016.01.005. [Google Scholar] [CrossRef]
 | This work is licensed under a Creative Commons Attribution 4.0 International License, which permits unrestricted use, distribution, and reproduction in any medium, provided the original work is properly cited. |