| Energy Engineering |
DOI: 10.32604/ee.2022.016344
ARTICLE
Energy and Life Cycle Assessment of Zinc/Water Nanofluid Based Photovoltaic Thermal System
SEARL Laboratory, Department of Mechancial Engineering, Aligarh Muslim University, Aligarh, 202002, India
*Corresponding Author: Syed Mohd Yahya. Email: smyahya@zhcet.ac.in
Received: 27 February 2021; Accepted: 10 May 2021
Abstract: Cooling the PV surface in a Photovoltaic Thermal system is a pivotal operational aspect to be taken into account to achieve optimized values of performance parameters in a Photovoltaic Thermal System. The experimental design used in this study facilitates the flow of varying concentrations of Zn-water nanofluid in serpentine copper tubing installed at the rear of the PV panel thereby preventing the PV surface temperature from increasing beyond the threshold value at which a decrease in electrical efficiency starts to occur. This fusion of solar thermal with PV devices leads to better electrical and thermal efficiency values resulting in decreased cell degradation over time and maximization of the lifespan of the PV module and the energy output from the PV system. Due to the superior thermal heat properties of nanofluids, their usage in such systems has become increasingly widespread. Life cycle metrics which include Energy Payback period, Energy Production Factor and life cycle conversion efficiency were evaluated for the PVT system by exhaustively chalking fundamental parameters such as embodied energy of the PVT setup and the total energy output from the PVT system. This research aims to be a major milestone in the evolutionary journey of Photovoltaic Thermal modules by guiding the engineers working on the theory, design and implementation of PVT systems towards its economic feasibility, environmental impact and energy sustainability.
Keywords: Photovoltaic thermal system; nanofluids; performance parameters; life cycle assessment
India has massive demands of energy being one of the fastest growing economies of the world and home to a population of more than 1.3 billion people. As of 30th November 2020, there is almost 37 GW of actual installed capacity in India [1]. This figure looks impressive considering there was only 120 MW of actual installed capacity as of 31st March 2010 but research indicates a potential to generate 50 MW/km2 from Solar PV systems in India which translates to a massive potential of nearly 750 GW [2]. Hence a significant effort is underway to realize the true potential of solar PV technology but various challenges that pose a hindrance to solar energy expansion need to be identified and effective research is needed to eliminate them to realize the prospects offered by Solar Energy expansion in nation-building goals. This paper addresses one of the major problem faced in the solar PV industry wherein whenever the PV surface temperature upon receiving the solar radiations increases beyond a certain threshold, the electrical efficiency starts to decrease Components used to fabricate the PV panels such as the semiconductor Silicon and other metals to support the frame of the PVT system get warmed up beyond the threshold value at which maximum efficiency is expected to be achieved resulting in decrement of the efficiency of the photovoltaic cells usually at an alarming rate of about 0.4% to 0.6% [3]. This necessitates the use of a cooling mechanism of PV panels to prevent such a situation. Photovoltaic Thermal (PVT) systems offer a solution to resolve this issue by installing a network of conduit at the rear of the PV panels and circulating various cooling fluids in them thereby facilitating heat extraction from the overheated panels and simultaneously utilizing the heated fluid for various applications [4]. Usually, nanofluids are selected to be circulated in these conduits since they exhibit enhanced thermal conductivity and the convective heat transfer coefficient compared to the base fluid that they are mixed with [5]. In this study, serpentine copper tubing is installed at the rear of the panel and Zn-water nanofluid was chosen to be circulated in this tubing. Three types of base fluid are used in this study: Water, Ethylene Glycol and Propylene glycol. Their availability, feasibility and enhanced thermal conductivity are the reasons for our choice [6]. The primary purpose of doing this experiment is to obtain enhanced conversion efficiency for better electrical output on account of decreased PV cell temperature and secondarily for obtaining a considerable thermal output when heated fluids exit the copper tubing from the rear of the panel. The thermal output of the PV/T panels obtained by the extracted heat from the panels can contribute towards many domestic applications like use in geysers for bathing and washing purposes, kitchen applications, etc. The experimentation involves arriving at an optimal value of the combination of nanofluid mixed with the appropriate base fluid which could enhance the heat transfer between the copper tubing and the PV panels [7]. The thermal conductivity and specific heat capacity of the resulting combination will be emphasized upon. A plethora of available literature was referred to before conducting this experimental study. A main cause of concern faced using while working with nanofluids is the agglomeration problem which often arises due to the instability of the nanofluids over a long period. This has also been addressed in this research work. Furthermore, the PVT setup was also evaluated from a techno-economic and environmental perspective and a through life cycle assessment of the PV/T module was done in this study.
A plethora of literature was referred before carrying out this experimental study Yahya et al. [8] performed simulations to alleviate the problem of decreasing PV panel efficiency at high temperatures by allowing forced convection of air at the rear of the PV panel in a simple channel configuration. Hussien et al. [9] investigated the impact of different Al2O3 Nano fluid concentration ratios on PV/T efficiency for different mass flow rates by using water as a base fluid. His findings revealed that when used at concentrations ranging from 0.1% to 0.5% at a mass flow rate of 0.2 l/s, the temperature decreases more substantially from 79.1°C to 42.2°C at the optimal concentration level of nanofluid (0.3 percent), leading to an improvement in solar panel electrical efficiency and thermal efficiency to 12.1% and 34.4%, respectively. Bahaidarah et al. [10] tested the performance of a PV (photovoltaic) module in hot environmental parameters by rear surface water cooling and determined that the efficiency of the PV panel is sensitive to the temperature of the panel and decreases as the panel temperature rises. The module operating temperature declined substantially to around 20 percent with an active cooling technique and an improvement in electrical efficiency of 9 percent was observed. In a comparable analysis to enhance the electrical efficiency of PV panels using the Water Hybrid Photovoltaic Thermal (PV/T) system, Hamid et al. [11] have identified that hybrid PV/T systems are one of the methods to enhance the electrical efficiency of the panels. In their analysis, due to water circulation through the collector at the back of the PV panel, the PV panel temperature declined substantially by 15–20 percent. As a result, the electrical power output of the PV/T system improved by 15 to 20 percent. Increasing solar absorption and reducing infrared emissions were the key aspects on which Cox et al. [12] focussed while conducting research on PV/T collectors. By the use of selective absorber and when PV cells cover more than around 65% of the total collector area, it reduces the thermal efficiency when used with a gridded-back cell. A PVT system was fabricated by Micheal and Inyan which involved glazing a copper sheet towards unto the PV surface while also using Copper oxide-water nanofluid to circulate in the conduits installed beneath the PV panels. A remarkable enhancement of thermal efficiency of 45.6% was noticed by them compared to the use of merely water as the circulating fluid [13]. Al-Waeli et al. [14] observed that by adding the 3 wt.% of SiC nanofluids with the water caused an increase in fluid density and viscosity by 0.0082% and 1.8%, respectively. The electrical efficiency was increased up to 24.1%. The overall efficiency of the PV/T system which was compared to the PV system was about 88.9% by using 3 wt.% of SiC as a nanofluid. Gangadevi et al. [15] investigated experimentally the effect of Al2O3/water nanofluid of 1 wt.% and 2 wt.% by circulating in a PV/T system on the thermal, electrical and overall efficiencies with the flow rate of 40L/H. The results showed that using 2 wt.% of Al2O3 with water caused an enhancement in the electrical efficiency and thermal efficiency by 13% and 45% and the overall efficiency was up to 58% as compared to water-based PV/T system. Otanicar et al. [16] investigated that a PV/thermal system using mild thermal connection could lead to an increase in efficiency. In this design, a fluid filter absorbed energy directly in the fluid below the bandgap. By using the above system, it was found that the combined efficiency had increased by up to 38%. The impact of nanofluid as a coolant on the PV thermal system and its effect on the thermal and electrical performance of the system were investigated by Sardarbadi et al. [17]. ZnO nanoparticles of 35–45 nm size were suspended in deionized water in their experiment and the concentration of nanofluid taken was 0.2 percent by weight. The results revealed a 13 percent and 5 percent increment in electrical and thermal efficiency respectively relative to the traditional PV module. Lari et al. [18] conducted experimentation using 0.5% Ag-water as the cooling fluid and concluded that the cost of electricity generation by PV/T panels proved to be 82.25% cheaper than the prices charged by electricity companies in Saudi Arabia. Moreover, upon investigating further into environmental aspects of the PVT module, it was observed that such systems could prevent emission of 16,700 tonnes of Carbon di Oxide in the atmosphere during their lifetime when compared to the environmental effects of producing similar amount of electricity by conventional sources such as burning of coal in thermal power plants and provide enhanced energy output by 13.2% as compared to conventional PV modules. Prabhakant et al. [19] presented an analysis of carbon credit earning by using a standalone PVT system by computing the credits earned as per the norms of the Kyoto Protocol. A comprehensive ROI assessment summarised that that the cost of power generated by such a system would be USD 0.14, USD 0.125 and USD 0.116 per unit respectively for life cycles of 30, 40 and 50 years and thus it will be cheaper than the cost of power generated by conventional systems.
Major gaps were identified in the archival literature and various choices regarding choice of materials and methods were taken to make this work as novel as possible. Zinc/water has been chosen in this study to ensure the novelty of the work as the authors have found no literature in the past in which Zn/water was chosen for rear panel cooling of PVT panels. Moreover, Zinc with thermal conductivity of 112.2 W/m.K when combined with water (thermal conductivity of 0.593 W/m.k) has the potentially to elevate the overall thermal conductivity of Zn/water mixture to an appreciable level. The authors wish to give an intuitive insight to the researchers in the field of solar PV research by suggesting a means to alleviate the issue of overheating of PV panels which usually decreases the efficiency of the conventional PV panels due to loss of useful electrical energy in the form of heat.
In this section, the experimental approach employed to conduct the performance analysis will be discussed. The total Energy output by the PVT system upon accounting for the different climatic conditions in a year will be chalked out. Furthermore, the calculations involved in performing the Techno-Economic and Environmental analysis will be elucidated in detail. The agglomeration issue concerning the nanofluids will be addressed by establishing a co-relation between the sonication time and stability period.
Firstly, the collection of data for simulating the steady state conditions in a Solar simulator was done with the help of a system consisting of 2 pyranometers, a shadow ring and a data logger box. The pyranometer with the ring measures the diffused radiations and the one without the ring measures the total solar radiation. These pyranometers consist of piles of thermocouples which produce an emf. The data logger records this emf and converts it into irradiance data which gets saved as a .csv file. In this manner the irradiance data is obtained at an interval of every 30 min between 9 am and 4 pm for 16th March 2019. Similarly the ambient temperature of the same day was calculated with the help of a dry bulb thermometer. The results obtained are shown in the Fig. 1.
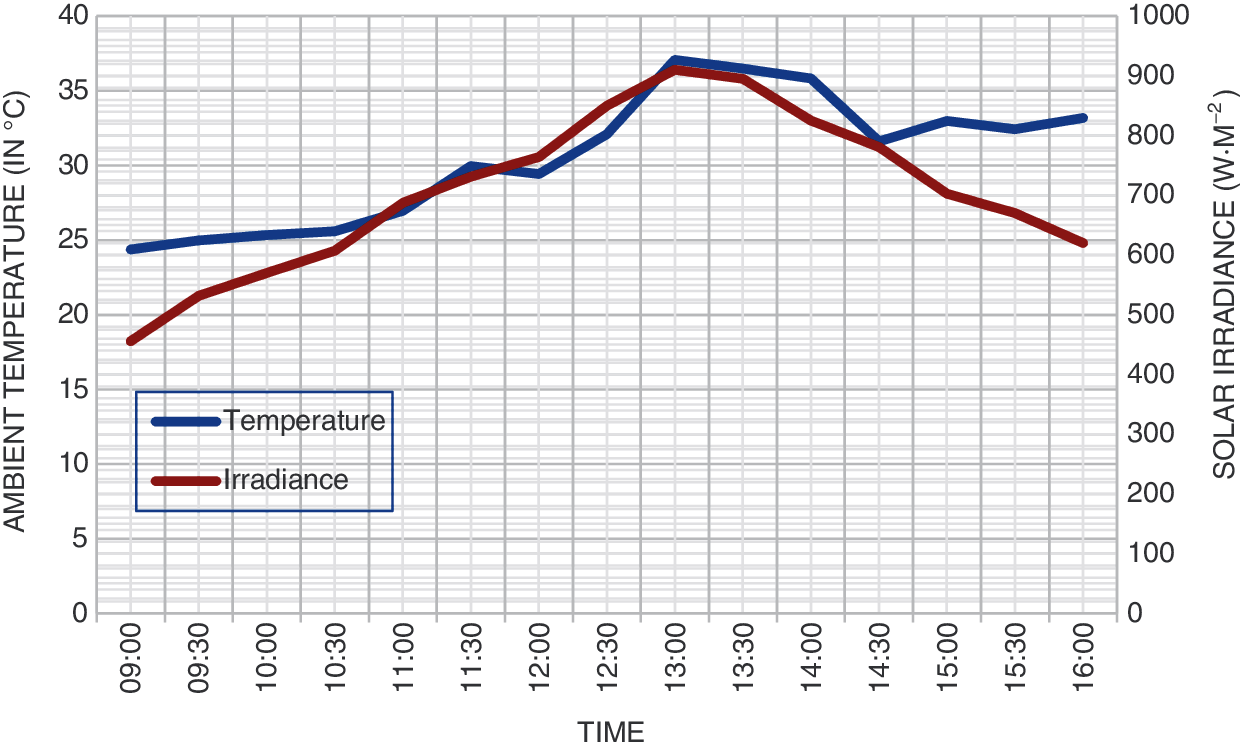
Figure 1: Ambient temperature and solar irradiance v/s time
The input to the PVT system is the sum of the solar radiations incident upon it. Similarly, the output is the summation of electrical and thermal energy that can be derived from the PVT system. Eq. (1) represents the energy balance for the PVT system assuming it to be a single control volume.
It is simplified, assuming a steady-state condition in Eq. (2).
which implies,
where E:in, E. el, E.th and E. loss are respectively the irradiance on the PV surface, the electrical and thermal energy yield and the energy lost during the operation.
Evaluating the total energy yield from the PVT system with respect to the input energy is useful for determining the overall efficiency of the PVT system as seen in Eq. (4).
where Ac and Apv are the areas of the collector and PV cells respectively, and r is the packing factor defined as Apv/Ac. E’’th is the rate of output thermal energy per unit area of the collector, E’’el the rate of output electrical energy per unit area of photovoltaic cells, & G’’eff the rate of the effective incident radiation per unit area of the collector.
From Eq. (3), E.th can be calculated by a simple energy analysis as:
where mf is the fluid mass flow rate through the collector, Cp,f is the fluid specific heat, & Tf,i and Tf,o represents the fluid inlet and outlet temperatures, respectively.
where mn and mf are the mass of the nanoparticles and fluid, respectively.
The electrical efficiency can be expressed as:
where Voc is the open-circuit voltage, Isc is the short circuit current and Ap is the area of the panel.
Filled factor (FF) is the ratio of actual rated maximum power with respect to the theoretical power, usually having a value greater than 0.7 for commercial solar PV modules.
Pm is the maximum output electrical power (i.e., the ideal output power) given as:
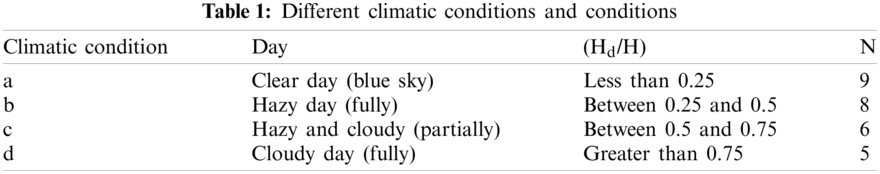
The total energy output from the PVT module is the summation of the electrical and thermal outputs from the PVT panel. The annual energy yield of a PVT module is reliant upon the solar irradiance which is dependent on the latitude of a place and number of days with clear sunlight throughout the year. For four climatic conditions namely a, b, c, and d have been assigned of the composite climate of Aligarh [20].
Here, Hd, H, and N are diffuse radiations, daily global radiations and sunshine hours respectively.
Hence, the net monthly electrical output can be determined by Eq. (10).
where G(t)avg. is the average total solar intensity on the PV module (W/m2), Ap is the area of the PV module (m2), ηe is the temperature-dependent solar cell efficiency, N is the number of sunshine hours per day & n is the total number of days in the month.
Annual thermal output (Pth) is calculated in Eq. (11) as the product of the average irradiance (Ga) and the average thermal efficiency of the PVT system ηth.
The net energy yield from the PVT system (Ptot) is calculated as the summation of the electrical and thermal output as shown in Eq. (12).
Nanoparticles have a tendency to agglomerate by adhering to each other and thus forming micron sized clumps, rendering the nanofluids to be unstable. Maintaining stability is essential for nanofluids to preserve their thermophysical properties over long duration of time [21]. The method chosen in this experimentation to ascertain the stability of a particular sample of nanofluid is the Zeta potential method. The voltage at the edge of a double layer in a colloidal solution is termed Zeta potential. The value of zeta potential determines the stability of a nanofluid by predicting the inclination of nanoparticles to agglomerate. A high magnitude of zeta potential value signifies stronger repulsive charge between the constituent particles rendering the colloid to be stable whereas a low magnitude is an indication of a colloidal solution that could congeal over time. It is commonly assumed that a zeta potential value of magnitude greater than 30 mV has adequate repulsive force to achieve enhanced colloidal stability. A zeta sizer (make: Malvern) as shown in Fig. 2 is used to carry out the Zeta potential test.
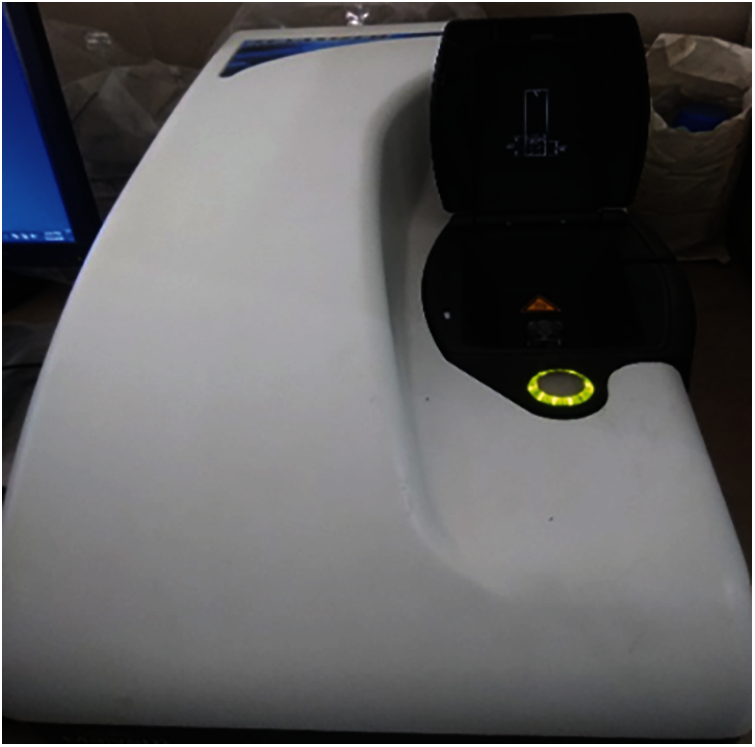
Figure 2: Zeta sizer
An Ultrasonic bath (Made: LABMAN) as shown in Fig. 3 was used for sonicating the different nanofluid samples for stability analysis. 6 samples of each nanofluid were prepared with the first sample being sonicated for one hour and every subsequent sample was sonicated for an additional hour. Likewise, the sixth sample was sonicated for six hours. The stability comparison of the 3 nanofluids can is illustrated in Fig. 4.
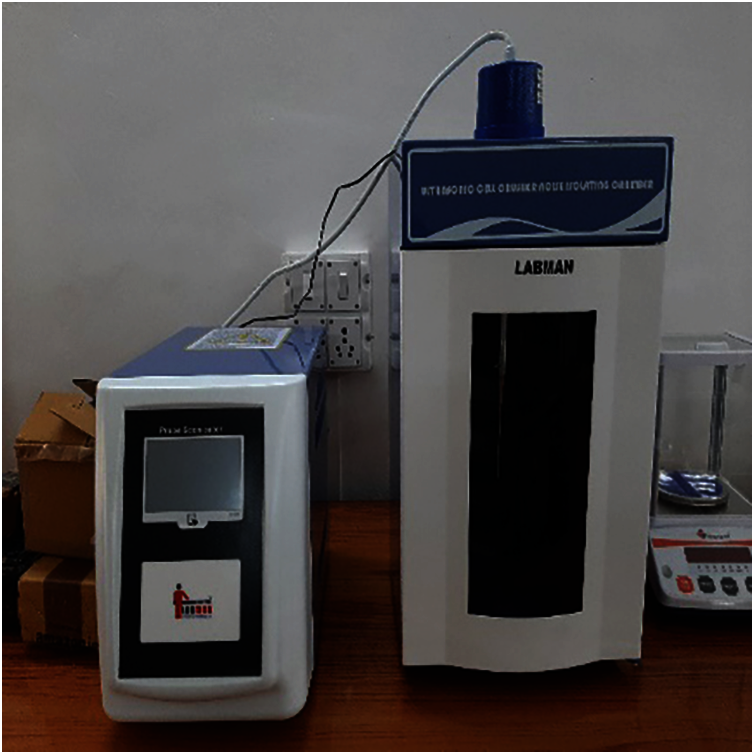
Figure 3: Ultrasonicator
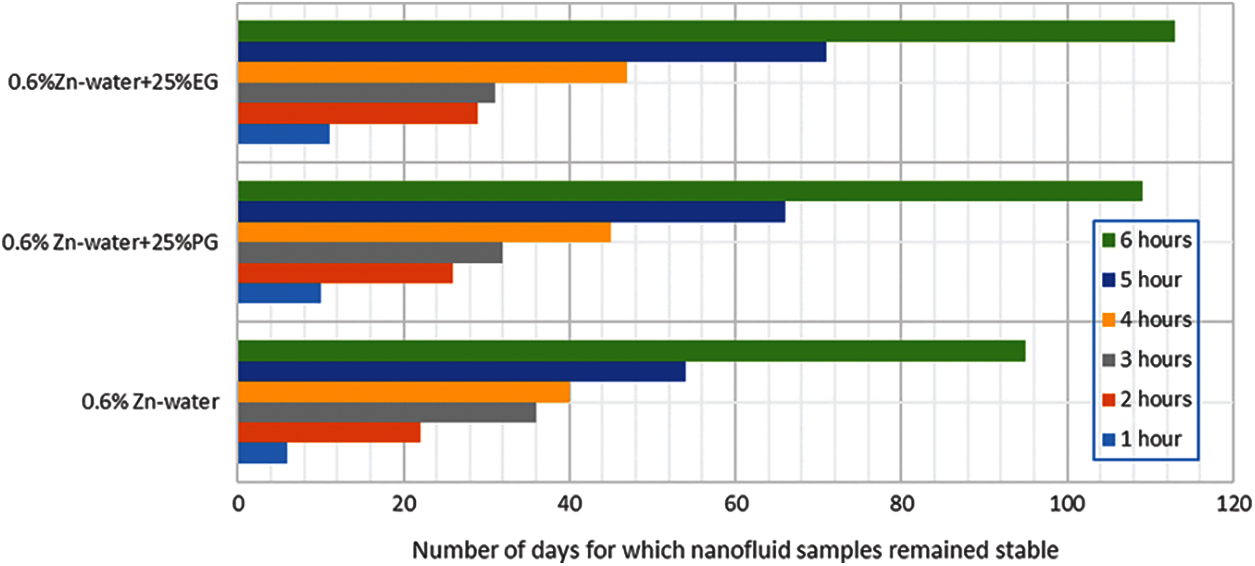
Figure 4: Stability period (days) v/s sonication time (Hours)
In the stability analysis, it was found that 0.6% Zn-water + 25% EG was the most stable of the three with the colloidal particles not settling until the 112th day. This stable nature of the nanofluid mixed with EG renders the system to become commercially viable due to low maintenance costs.
2.3.1 Techno Economic Analysis
The Techno-Economic analysis of a PVT system in done on the basis on life cycle metrics. These metrics evaluate the energy performance of electricity-generating systems. There are mainly 3 life cycle metrics namely Energy payback time (EPBP), Electricity Production Factor (EPF) and Life Cycle Conversion Efficiency (LCCE). The techno-economic analysis will be carried out by evaluating the annual energy output (sum of annual electrical and thermal energy output) with respect to the embodied energy of the PVT system. Based on the calculations, an Energy Pay Back Period (or EPBP), Energy Production Factor (or EPF) and Life Cycle Conversion Efficiency (LCCE) will be determined [22–24]. The duration of time in which net energy yield derived from the PVT setup breaks even with respect to the embodied energy of the system [25]. It is calculated in years and determined using Eq. (13) as:
where Pee is the invested energy or the embodied energy of the system.
The Energy production factor (EPF) is evaluated by Eq. (14) as the ratio of net energy yield derived from the PVT setup during its lifespan (Ptotal lifetime) with respect to the embodied energy of the system.
The aggregate energy producing capacity evaluated with respect to the amount of total irradiance throughout the lifespan of a PVT system is termed as Life Cycle Conversion Efficiency or LCCE as shown in Eq. (15).
The value of
In this section, the environmental aspects of using PV/T technology will be studied by calculating the amount of Carbon dioxide emissions mitigated by the usage of PV/T systems. Further, the Carbon credit earned by mitigating the Carbon dioxide emission will also be calculated for the different lifetimes of the PV/T system. Approximately 0.98 kg of CO2 is released in the atmosphere for every kWh of electricity produced by coal, thus the net annual CO2 emitted (in kg) can be calculated as [26]:
The net CO2 mitigation in tons over the lifespan of the PVT system is determined as:
The net CO2 credit earned (traded at 20 euro/ton) by the PVT system is calculated as:
A hybrid PV/T module of power rating 300 W sponsored by TEQIP is used in this experiment. Copper tubes are installed at the rear of PV panels through which Zn-water nanofluid in varying concentrations and with different base fluids is circulated. A data logger is connected to five thermocouples which are used to measure temperatures at various points in the experimental setup. An I-V tracer is connected to the output of the PV module. The results recorded by the I-V tracer will be used to measure the electrical efficiency of the module. The PV surface temperature is monitored with the help of the HTC infrared thermometer model MT-4. Thermocouples are placed at the inlet and outlet of the panel are used to measure the temperature values after steady conditions are obtained. The amount of water entering the copper tubing is measured with the help of a flow meter and the mass flow rate of the fluid is kept constant at a rate of 2 litres per minute (0.033 kg/sec). The heated fluid from the outlet of the copper tubing is directed to a finned type heat exchanger where it loses some of its heat. Thermocouples are placed to record the temperature readings at the entry and exit of the heat exchanger. The fluid after being cooled from the heat exchanger is sent to a bucket where it is pumped back to the inlet of the panel and the process is thus repeated by recirculating the fluid with the help of an A.C pump. All the necessary instruments required as mentioned above are connected to the setup and shown in the form of a line diagram in Fig. 5 and the experimental setup is shown in Fig. 6.
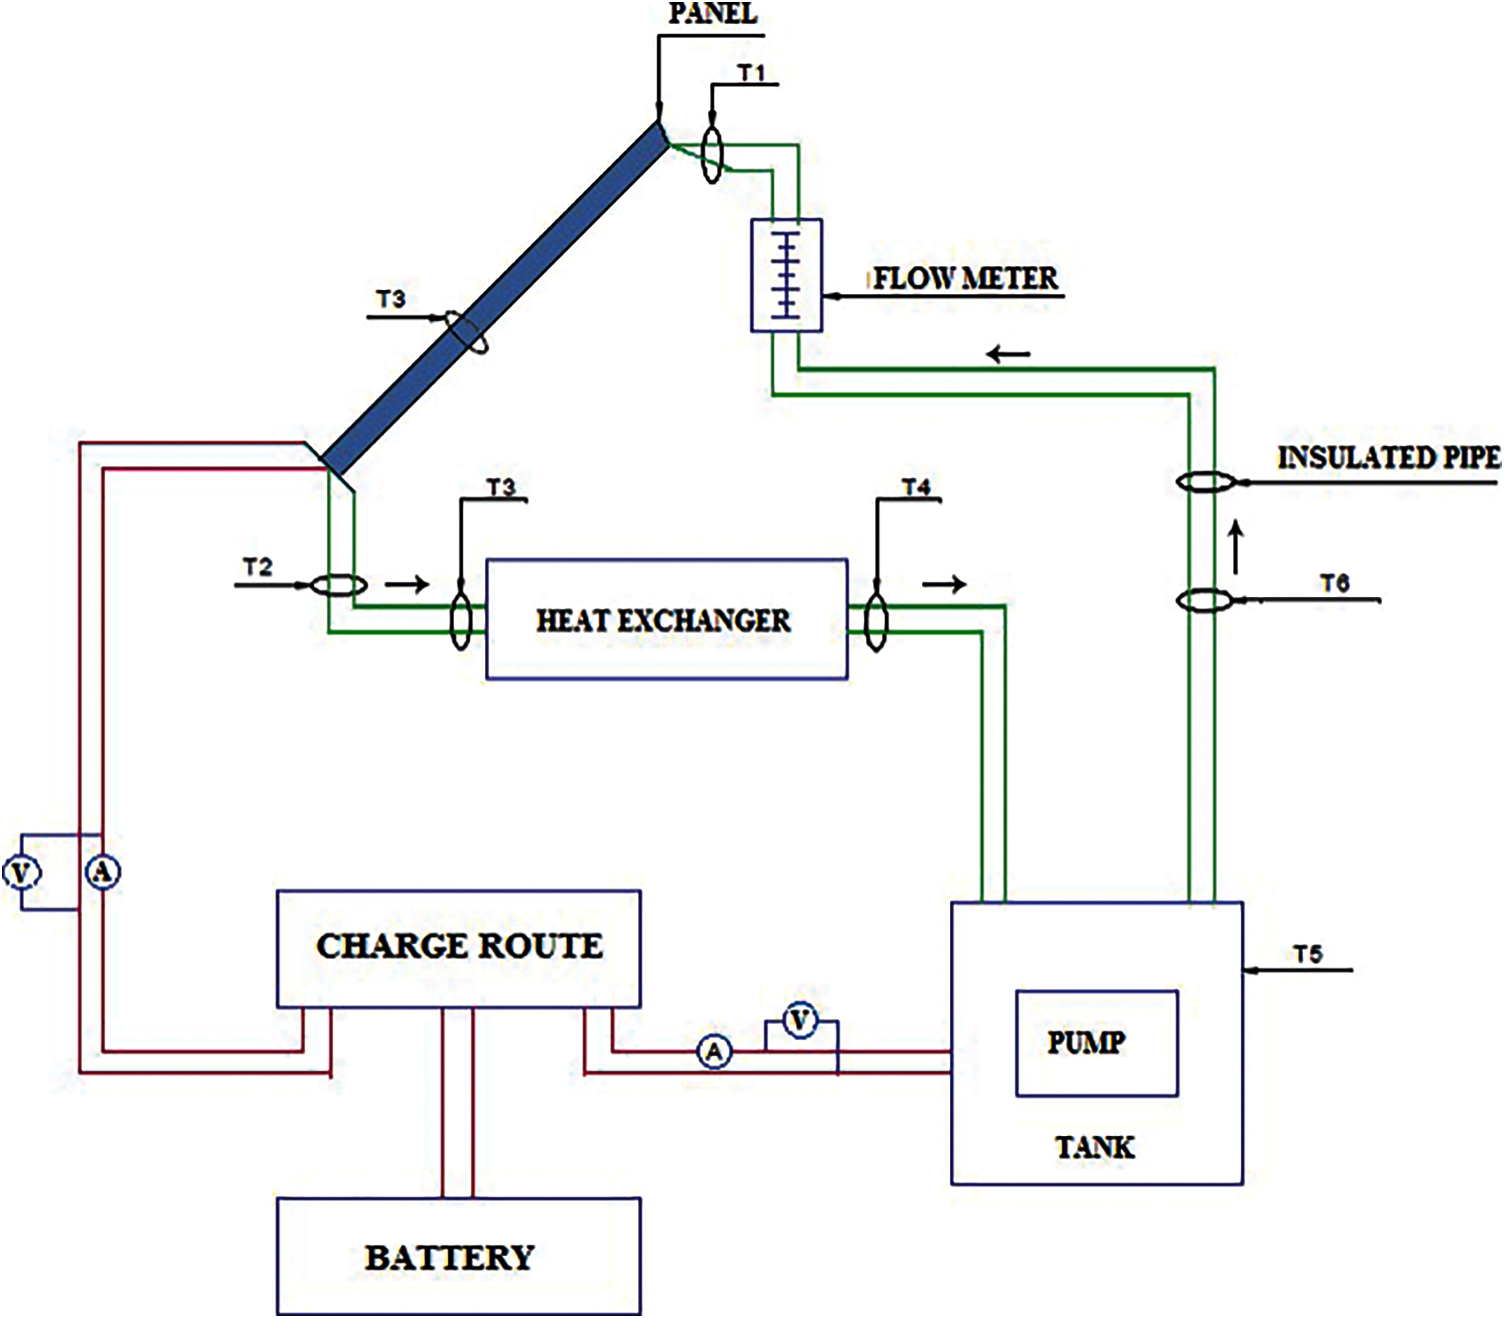
Figure 5: Circuit diagram showing the flow of water/nanofluids in the PV/T hybrid system
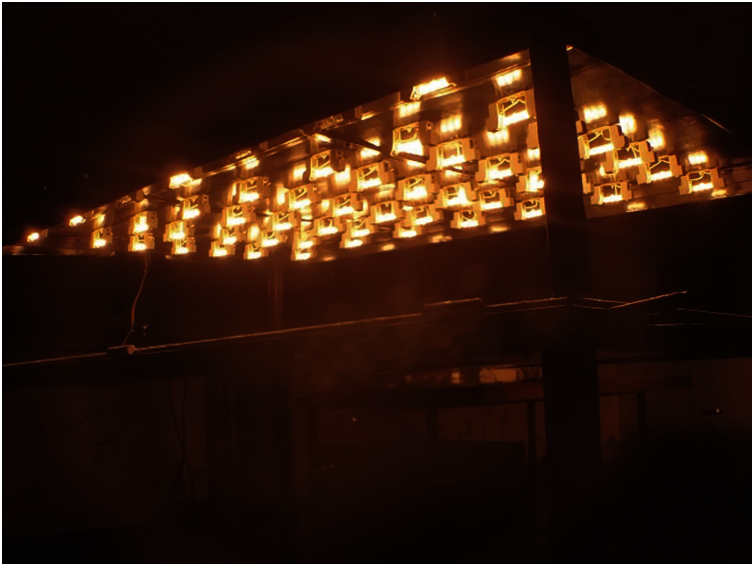
Figure 6: Simulated radiations directed on the PV panel
When the incident solar radiations fall on the photovoltaic panels, electricity is produced by photovoltaic effect and the heat extraction process from PV panels by circulating different heat transfer fluids at the rear of the PV panels in the copper tubing installed is studied. The results recorded by the I-V tracer will be used to measure the electrical efficiency of the module. The difference in temperature at the inlet and outlet of the PV panel is used to measure the thermal efficiency of the PV/T module. A steady state of the system is assumed when the data logger shows a temperature of 27°C at the inlet of the copper tubing installed at the rear of the PV panel.
The halogen bulbs attached to the solar simulator are switched ON and the intensity is controlled by the regulators until it sets to values typically ranging between 500 to 950 W/m2 as per the available average monthly irradiance data. Hence by simulating the irradiance values of the outdoor conditions for the city of Aligarh with the help of solar simulator, realistic practical values of the performance parameter results are recorded at regular intervals of 30 min from 9 am to 4 pm.
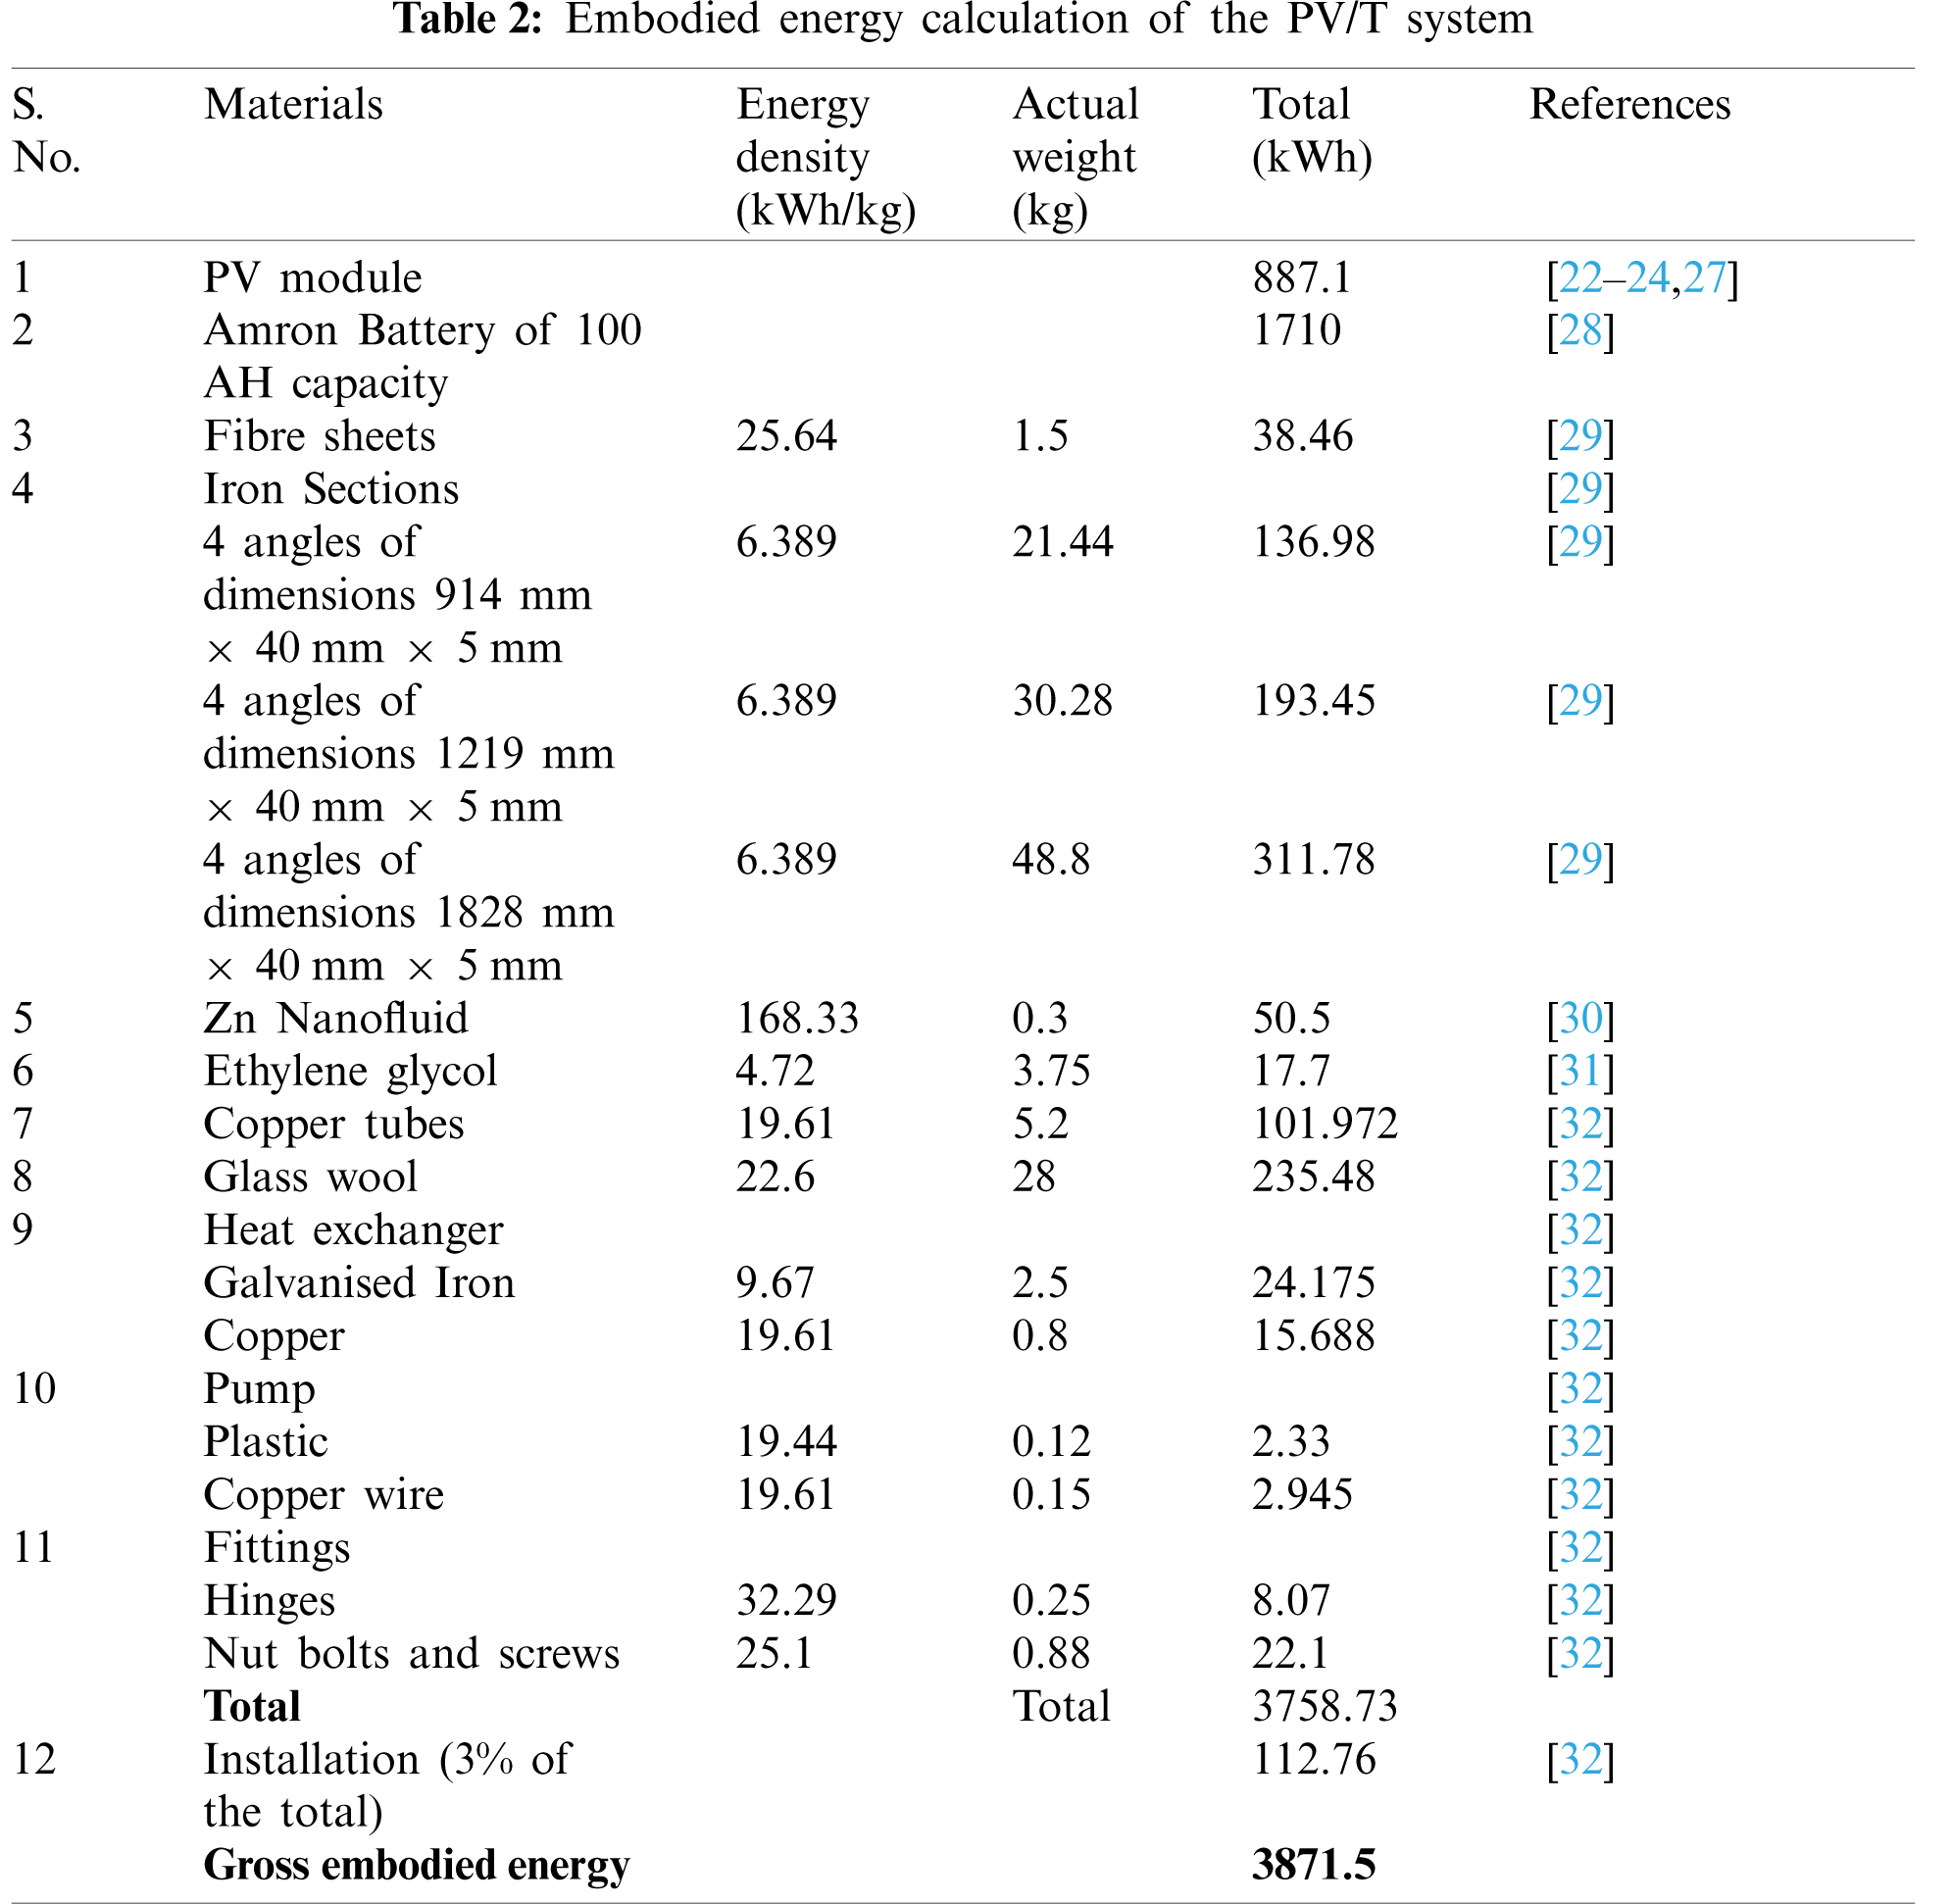
Embodied energy of the Experimental setup
The cradle to gate approach in which the cumulative energy required for the deriving, treating, fabricating and transportation of raw materials to the manufacturing facility is termed as Embodied energy. It is also an indicator of the carbon footprint of the overall system on the environment since all these processes produce carbon di oxide during their operation. Hence, in this experimental study, the Embodied energy concept will be used to evaluate the sustainability of the PV/T panels by comparing it with the energy required to manufacture it. It is measured in Mega joules, quantifying the non-recyclable energy per unit of the raw material of the setup. A comprehensive calculation of the embodied energy of the PV/T system is tabulated in Tables 1 and 2.
3.1 Thermophysical Properties and Preparation of Nanofluids
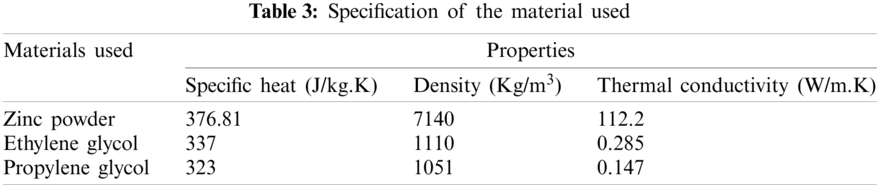
The thermos-physical properties of the different materials used in this experimentation are shown in Table 3.
A major concern while using glycols as a fluid was the increase of viscosity which might possibly contribute towards increase in pumping power thereby reducing the overall efficiency of the system. Hence the viscosity of the four samples of nanofluids were calculated across a range of temperature from 25 to 60 degree Celsius. To perform this, a standard viscometer of make Brookfield was used to determine the viscosity of different nanofluids. The results obtained for temperature range between 25 and 60 degree Celsius are depicted in Fig. 7.
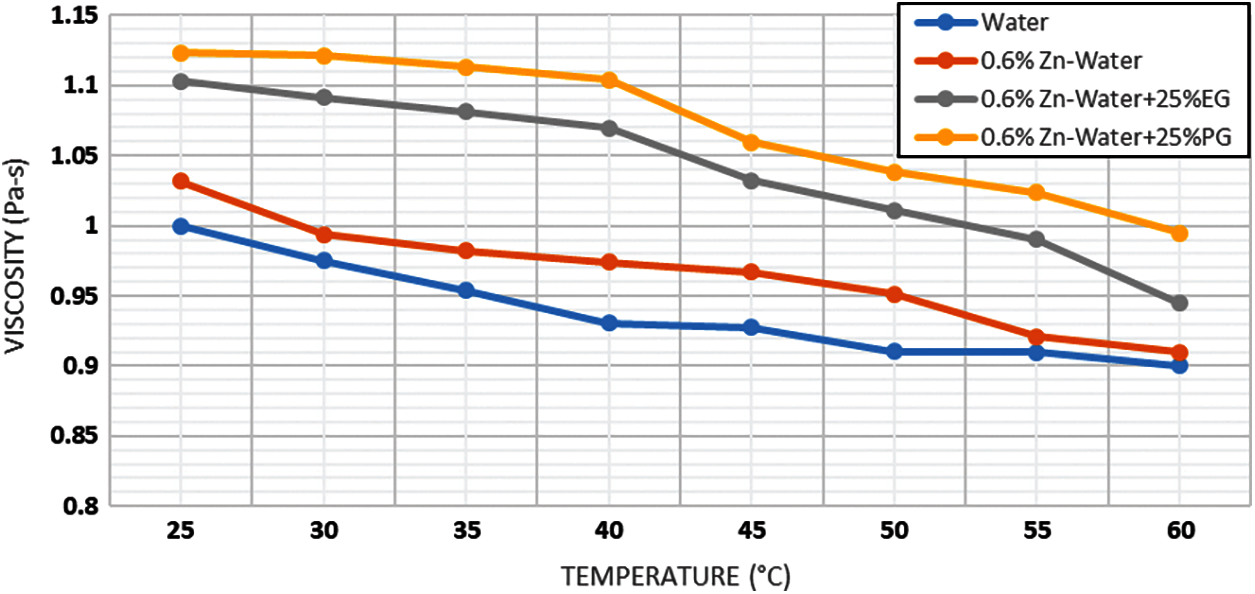
Figure 7: Viscosity measurement of different samples across a range of temperature from 25 to 60 degrees celsius
The apprehensions of increased pumping power by using glycol base fluids were nullified when a mere miniscule increase in viscosity occurred across a range of temperatures. It can be concluded that the use of glycols as base fluids can potential lead of cleanliness of the system by being devoid of typical dirt and ambient particulate of water systems. Moreover, the lack of chemical treatment and filtration eliminate the maintenance costs in glycol systems. By keeping all equipment in mint condition, these systems ensure constant peak performance and accuracy by preventing scale formation in the conduits they are circulated in, thereby inhibiting the fouling effect of the nanofluids in the PVT conduits [33].
In this experiment, the nanofluids have been have prepared by the two step method. In this method, the nano powder is synthesised from different chemical and physical processes and then it is allowed to be mixed with the appropriate base fluids by various intensive agitation methods. The method used in this experimental study is that of ultrasonic agitation.
Assuming R as a function of ‘n’ independent variables, its uncertainty can be represented as a function of the said variables in Eq. (19).
where δR, δvi and δR/vi are respectively the uncertainty of function R, the uncertainty of the parameter vi and the partial derivative of R with respect to the parameter vi.
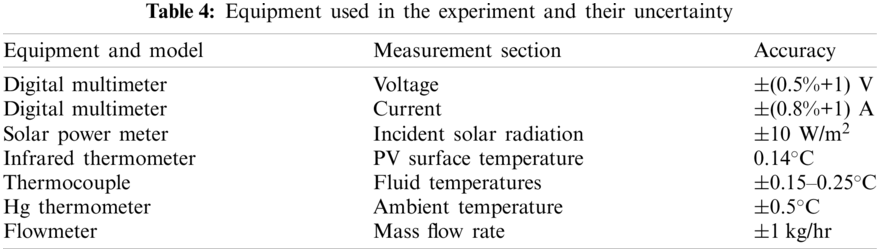
Using Eq. (19), the fractional uncertainties of the solar irradiance and the voltage and current values as noted from the I-V tracer during this experiment as tabulated in Table 4, the maximum uncertainty in electrical efficiency is calculated below:
Similarly, the maximum uncertainty in thermal efficiency is calculated as:
Thus, the uncertainties in the electrical and thermal efficiencies are merely 1.9% and 2.9% respectively which makes a good case for the inference that the measured data is reliable.
This uncertainty of different equipment is Table 4.
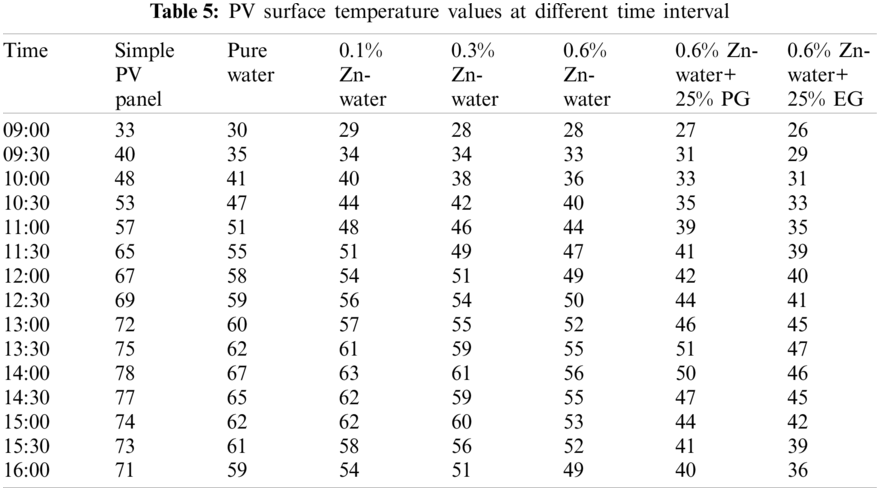
The effect of cooling effect of nanofluids was pretty intriguing and this effect can further be quantified by studying the percentage of PV surface cooling by using pure water and various nanofluids with respect to the earlier scenario when a simple PV panel was used without any rear panel cooling as shown in Table 5.
The variation of PV surface temperature from 9 am to 4 pm is shown in Fig. 8.
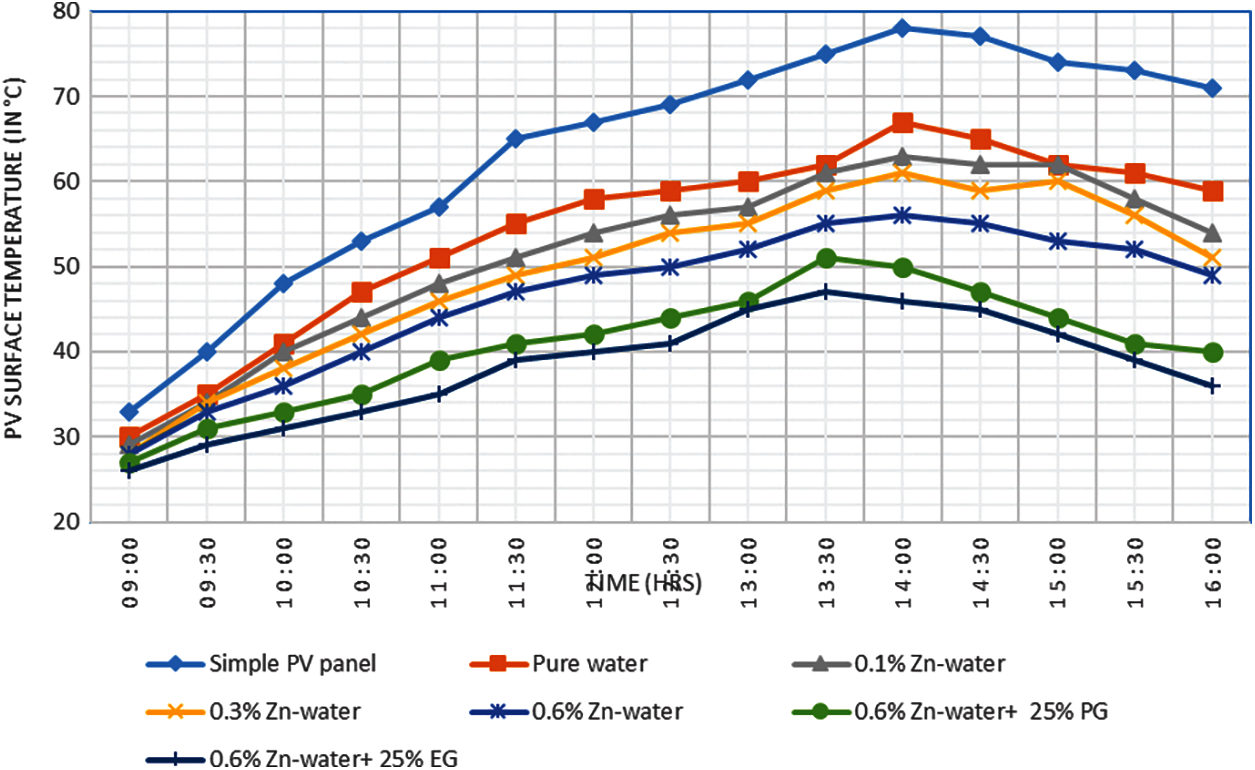
Figure 8: PV surface temperature v/s time for different cooling fluids
Percentage of PV surface Temperature decrement [34] by employing rear panel cooling with respect to the conventional PVT can be calculated from Eq. (20).
It appears that the pure water cooled the PV surface temperature by 14.8% and Zn-water in concentrations of 0.1%, 0.3% and 0.6% respectively reduced the PV surface temperature by 19.26%, 23.45% and 28.2%, respectively. A tremendous cooling of the PV surface temperature was provided by the usage of glycol base fluids. Propylene and Ethylene glycol after being mixed with the Zn-water nanofluid decreased the PV surface temperature by nearly 28.2% and 36.25% respectively for Propylene and Ethylene glycol.
The rear panel cooling using pure water and various nanofluids certainly improved the electrical efficiency by reducing the overheating of the panels but the rate at which the excess heat was removed varied with the usage of different cooling fluid and the electrical efficiency results simulated at steady state can be tabulated in Table 6.
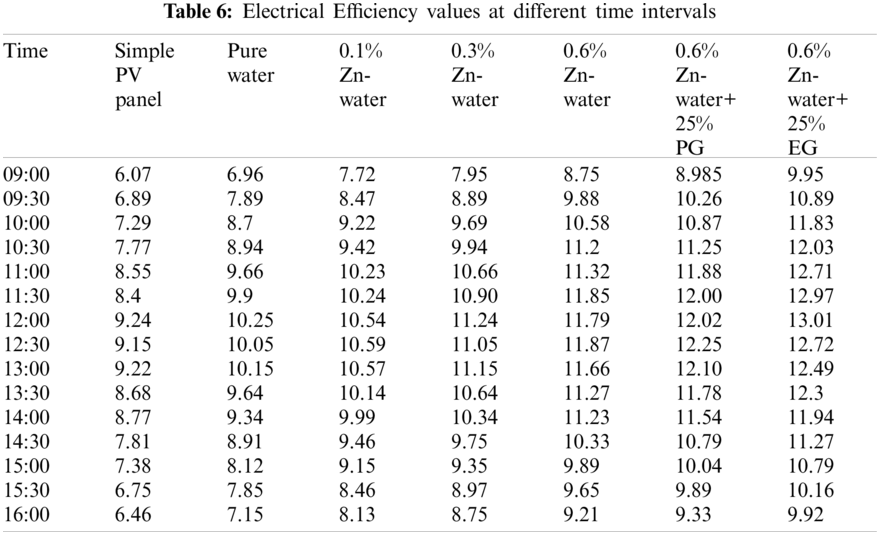
This trend from 9am to 4pm can be shown in Fig. 9.
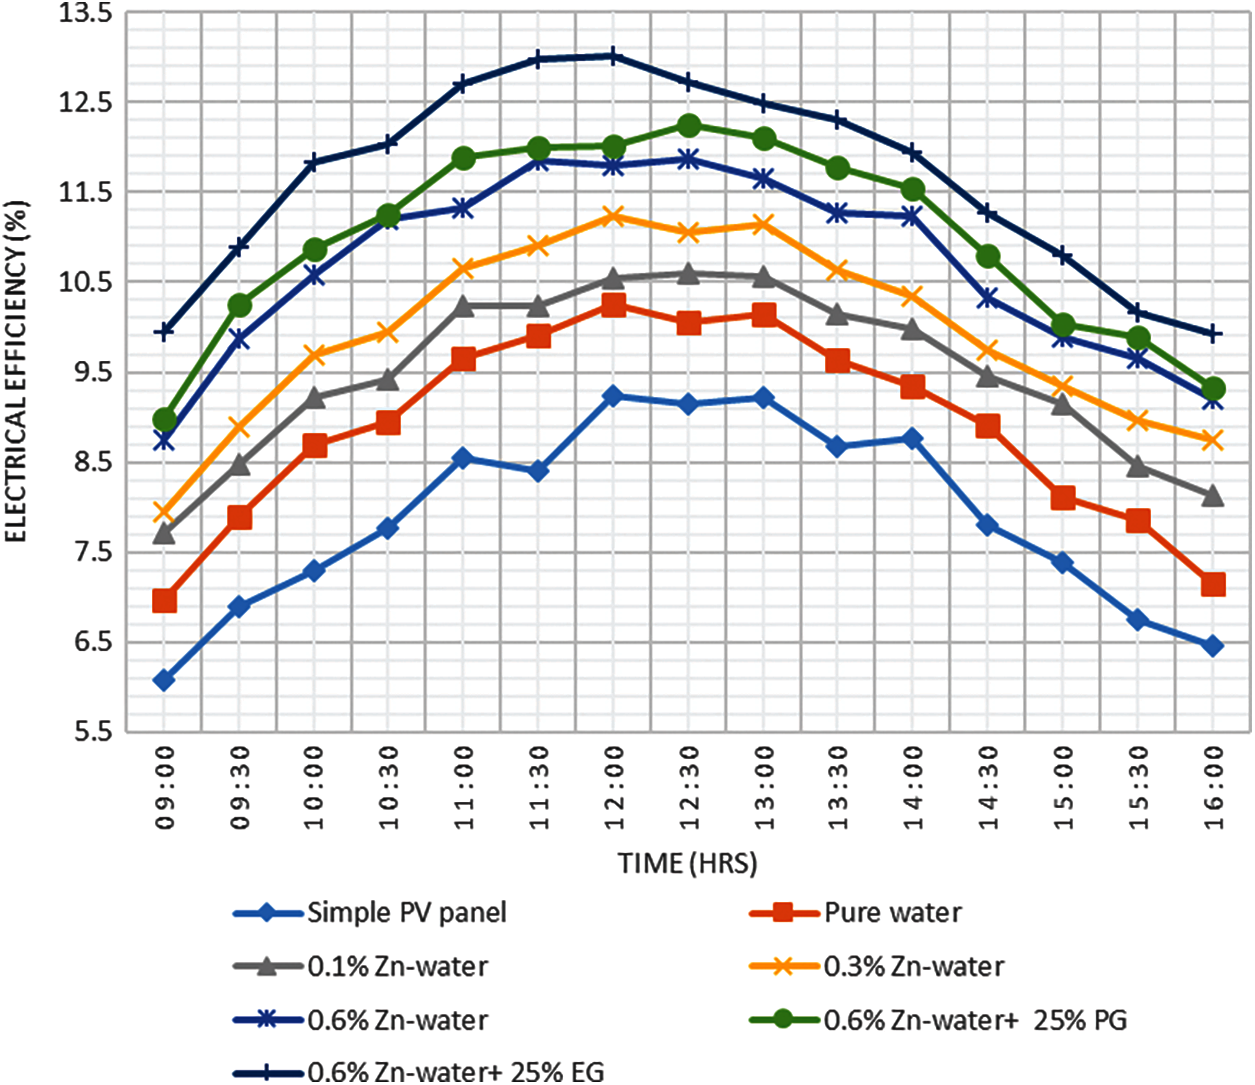
Figure 9: Electrical efficiency v/s time for different cooling fluids
The excess heat extracted by circulating pure water and various nanofluids in the serpentine copper tubing is utilized towards heating water for various domestic purposes and the fluctuation of thermal efficiency through the course of the day is tabulated in Table 7. An appreciable amount of thermal efficiency indicates the hotness of the exiting fluid from the PVT system which determines its suitability for use in various domestic applications.
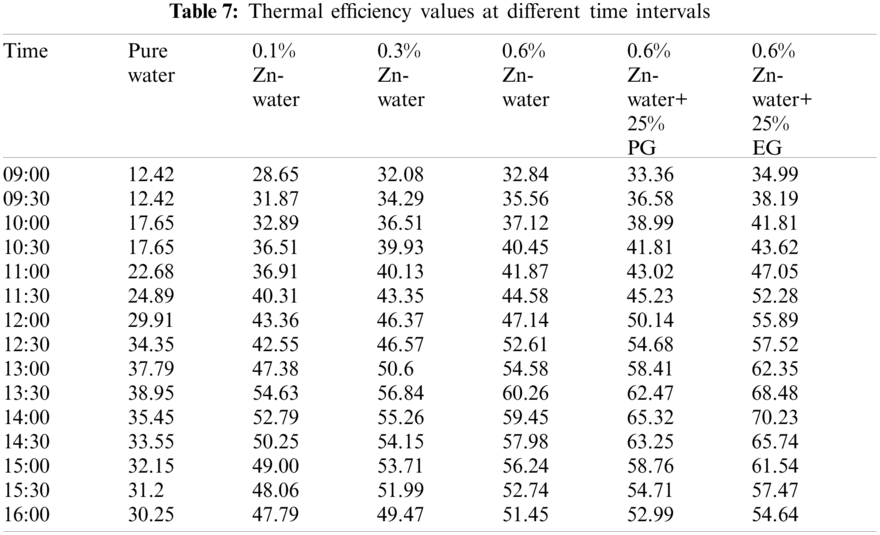
This trend can be represented in the Fig. 10.
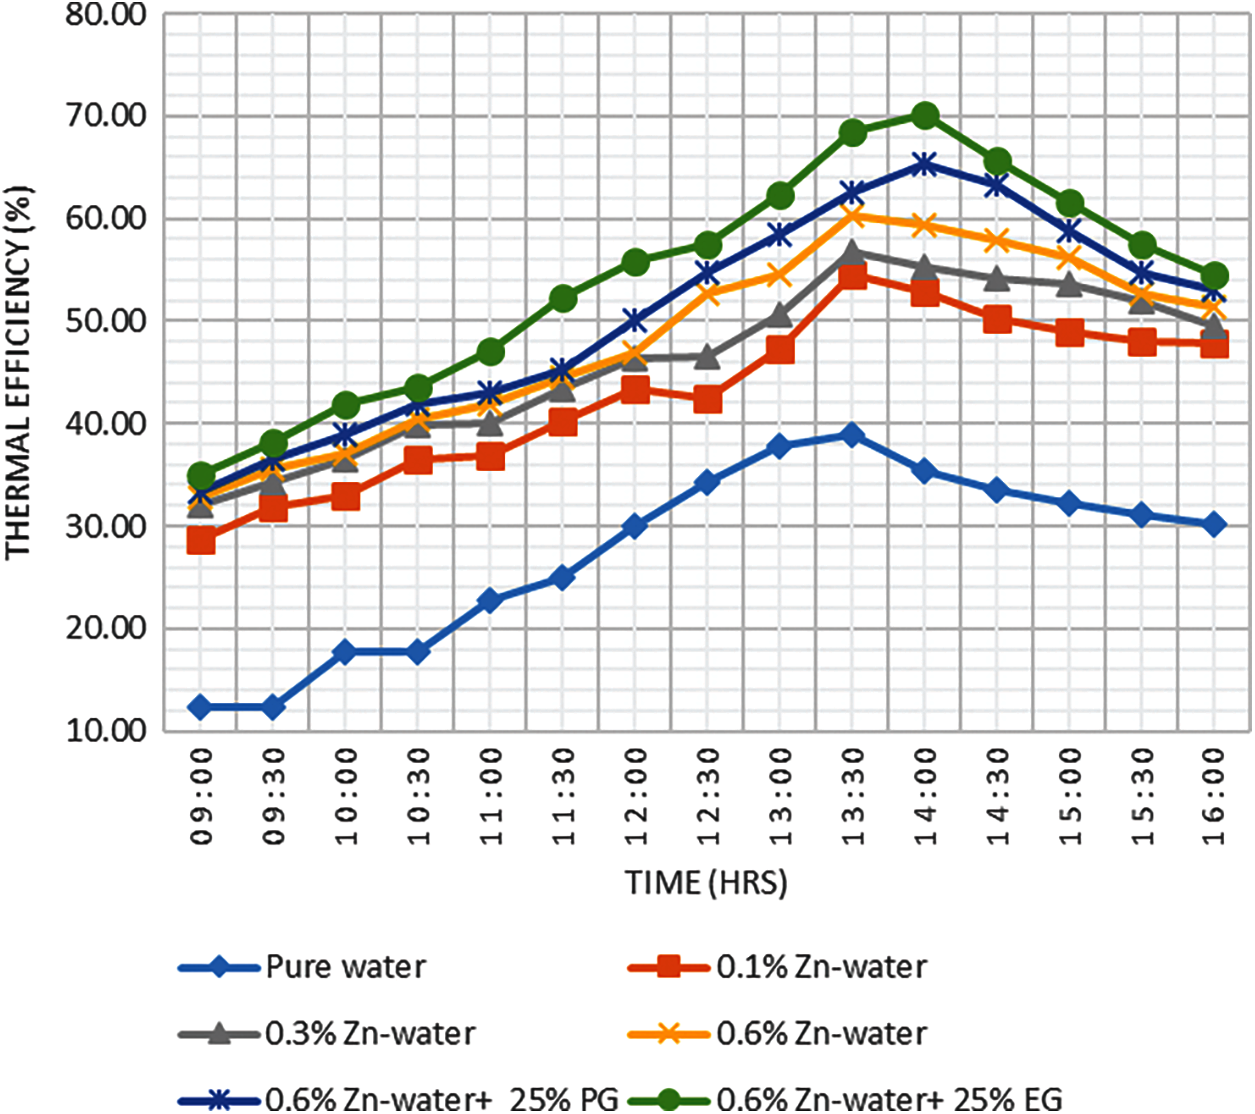
Figure 10: Thermal efficiency v/s time for different cooling fluids
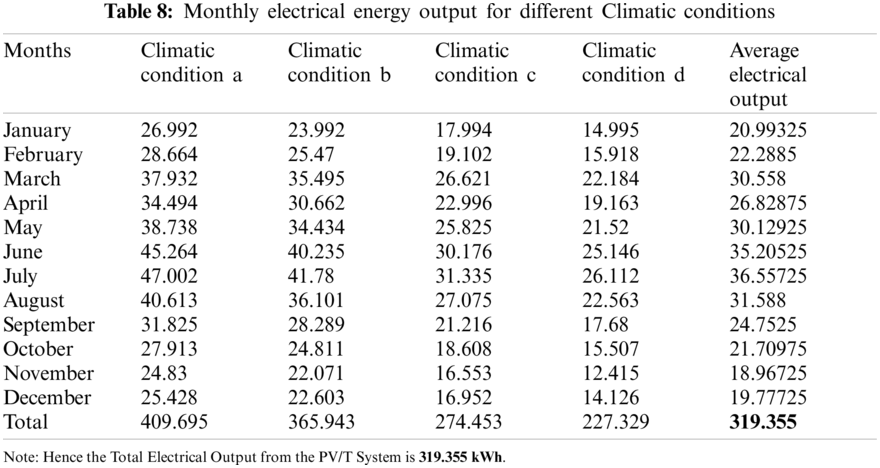
The life-cycle assessment parameters have been chalked out and noted for an entire year and have been calculated from 14th September 2018 to 14th September 2019. The calculation for the monthly electrical energy output is done by substituting the values of the variables mentions in Table 1 relevant to the Climatic condition and month in Eq. (10). The net monthly annual electrical outputs are thus calculated in Table 8.
Similarly, the thermal energy output for each month is calculated in the Table 9 (From Eq. (11)).
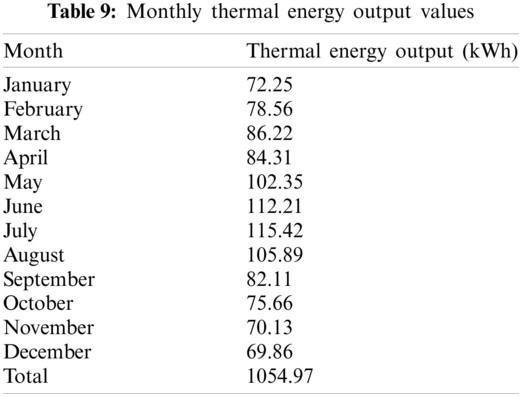
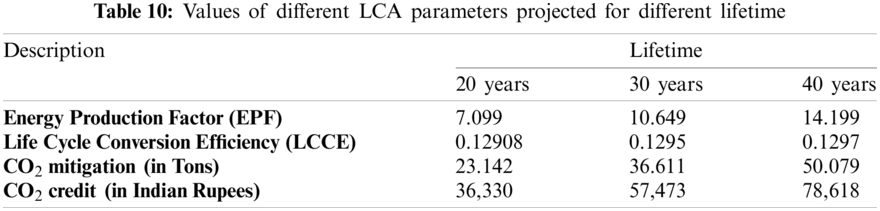
Hence, from Eq. (12), the total annual power output can be calculated for the hybrid PV/T panel as 1374.33 kWh. Similarly, the Energy Payback Period EPBP from Eq. (13) can be calculated to be 2.82 years. Based on the discussion in Section 2.3 and from Eqs. (15)–(18), the important Life Cycle Assessment parameters can be summarized in the Table 10.
5 Conclusions and Future Scope
In this experimental study, an inverse relationship between elevated PV cell temperatures and electrical efficiency has been studied. Using nanofluids as heat transfer fluids due to their superior values of thermal conductivity and specific heat capacity can result in enhanced performance parameters of the PVT modules. The role of glycol base fluids towards bettering the performance of nanofluid based PVT systems was studied leading to ascertaining of its desirable qualities while the optimization of the quantity in which they are required to be added to the nanofluids. This is evident by the fact that while circulating 0.6% Zn-water+25%EG in the rear copper tubing, an electrical and thermal efficiency enhancement of nearly 41% and 75% respectively was observed at the peak value as compare to water based PVT system. If the concentration ratio decreases below 0.6% for Zn/water nanofluid, the PV temperature will increase because of the decrease in the proportion of cooling effect causing Zn-nano powder per unit volume of the resulting nanofluid. Pertinent literature has indicated that the effect of cooling for the nanofluid based PVT systems at usually this concentration whereupon an increase in the agglomeration tendency is observed as the concentration is increased leading to poor stability and overheating issues.
Moreover, the effect of sonication time on the stability period of nanofluid solutions is studies in this study and this is a major step towards achieving stable nanofluid solutions thereby solving the conundrum related to nanofluid agglomeration. Upon analysing the life cycle assessment parameters, far reaching implications of PVT systems in terms of environmental sustainability and economic viability can be derived from this study. The scope of this experimental investigation was not limited to analysis of energy output from the PVT systems, it was also focussed towards highlighting the cost competitiveness of the PVT systems which can possibly lead towards widespread deployment of this technology. The future prospects regarding research on PVT systems are certainly bright and a lot can be done in this field due a lot of possibilities it creates by solving the overheating problem of the PV panels. Concentrations and mass flow rates can be varied to check their role in the optimization of the PVT performance. Moreover, research on building integrated nanofluid based PV/T system could be an advantageous prospect. The use of ETFE (Ethylene Tetrafluoroethylene) layer as a front coating on PV panels can be investigated. Numerical simulations on software like ANSYS and COMSOL Multiphysics can simulate many different cases and scenarios and perform a comparative analysis between them leading to negligible experimentation with reliable results. Intelligent data analytics and smart meters are needed to smoothen the peaks in the production of electricity from photovoltaic technology which can provide a closed loop feedback to factorise the effect of wind, dust and clouds which can signal the regulation of the flow of circulating fluid to the panels as per these weather parameters.
Acknowledgement: The authors would like to thank Department of Mechanical Engineering, A.M.U, Aligarh for all the necessary logistic support.
Funding Statement: The authors received no specific funding for this study.
Conflicts of Interest: The authors declare that they have no conflicts of interest to report regarding the present study.
1. Sarat, S. (2016). Renewable and sustainable energy reviews solar photovoltaic energy progress in India: A review. Renewable and Sustainable Energy Reviews, 59, 927–939. DOI 10.1016/j.rser.2016.01.049. [Google Scholar] [CrossRef]
2. TEDDY (2010). TERI energy data directory and year book. New Delhi: TERI Press. [Google Scholar]
3. Siecker, J., Kanzumba, K., Numbi, B. P. (2017). A review of solar photovoltaic systems cooling technologies. Renewable and Sustainable Energy Reviews, 79, 192–203. DOI 10.1016/j.rser.2017.05.053. [Google Scholar] [CrossRef]
4. Kumar, A., Baredar, P., Qureshi, U. (2015). Historical and recent development of photovoltaic thermal (PVT) technologies. Renewable and Sustainable Energy Reviews, 42, 1428–1436. DOI 10.1016/j.rser.2014.11.044. [Google Scholar] [CrossRef]
5. Wu, J. M., Zhao, J. Y. (2013). A review of nanofluid heat transfer and critical heat flux enhancement: Research gap to engineering application. Progress in Nuclear Energy, 66, 13–24. DOI 10.1016/j.pnucene.2013.03.009. [Google Scholar] [CrossRef]
6. Eastman, J., Choi, S., Li, S., Yu, W., Thompson, L. (2001). Anomalously increased effective thermal conductivity of ethylene glycol-based nanofluids containing copper nanoparticles. Applied Physics Letters, 78, 718–720. DOI 10.1063/1.1341218. [Google Scholar] [CrossRef]
7. Qeays, I., Yahya, S., Arif, M., Jamil, A. (2020). Nanofluids application in hybrid photovoltaic thermal system for performance enhancement: A review. AIMS Energy, 8, 365–393. DOI 10.3934/energy.2020.3.365. [Google Scholar] [CrossRef]
8. Yahya, S. M., Anwer, S. F., Sanghi, S. (2013). Enhanced heat transfer and fluid flow in a channel behind photovoltaic panel in hybrid PV/T system. Industrial & Engineering Chemistry Research, 52(5118413–18420. DOI 10.1021/ie402460n. [Google Scholar] [CrossRef]
9. Hussien, H. A., Noman, A. H. (2017). Abdulmunem raad abdulmunem indoor investigation for improving the hybrid photovoltaic/Thermal system performance using nanofluid (AL2O3-water). Energy Conversion and Management, 148, 963–973. [Google Scholar]
10. Bahaidarah, H., Subhan, A., Gandhidasan, P., Rehman, S. (2013). Performance evaluation of a PV (photovoltaic) module by back surface water cooling for hot climatic conditions. Energy, 59, 445–453. DOI 10.1016/j.energy.2013.07.050. [Google Scholar] [CrossRef]
11. Hamid, A. K. (2014). Electrical/thermal performance of hybrid PV/T system in Sharjah, UAE. International Journal of Smart Grid and Clean Energy, 3, 385–389. DOI 10.12720/sgce.3.4.385-389. [Google Scholar] [CrossRef]
12. Cox, C. H., Raghuraman, P. (1985). Design considerations for flat plate photovoltaic/thermal collectors. Solar Energy, 35, 227–241. DOI 10.1016/0038-092X(85)90102-1. [Google Scholar] [CrossRef]
13. Michael, J. J., Iniyan, S. (2015). Performance analysis of a copper sheet laminated photovoltaic thermal collector using copper oxide–water nanofluid. Solar Energy, 119, 439–451. DOI 10.1016/j.solener.2015.06.028. [Google Scholar] [CrossRef]
14. Al-Waeli, A. H., Sopian, K., Chaichan, M. T., Kazem, H. A., Hasan, H. A. et al. (2017). An experimental investigation of SiC nanofluid as a base-fluid for a photovoltaic thermal PV/T system. Energy Conversion and Management, 142, 547–558. DOI 10.1016/j.enconman.2017.03.076. [Google Scholar] [CrossRef]
15. Gangadevi, R., Vinayagam, B., Raja, S. (2017). Experimental investigations of hybrid PV/Spiral flow thermal collector system performance using Al2O3/water nanofluid. IOP Conference Series: Materials Science and Engineering, Frontiers in Automobile and Mechanical Engineering, Sathyabama University, Chennai, India. DOI 012041.10.1088/1757-899X/197/1/012041. [Google Scholar]
16. Otanicar, T. P., Chowdhury, I., Prasher, R., Phelan, P. E. (2011). Band-gap tuned direct absorption for a hybrid concentrating solar photovoltaic/thermal system. Journal of Solar Energy Engineering, 133(4), 041014. DOI 10.1115/1.4004708. [Google Scholar] [CrossRef]
17. Sardarabadi, M., Passandideh-Fard, M., Heris, S. Z. (2014). Experimental investigation of the effects of silica/water nanofluid on PV/T (photovoltaic thermal units). Energy, 66, 264e272. DOI 10.1016/j.energy.2014.01.102. [Google Scholar] [CrossRef]
18. Lari, M. O., Sahin, A. Z. (2017). Design, performance and economic analysis of a nanofluid-based photovoltaic/thermal system for residential applications. Energy Conversion and Management, 149, 467–484. DOI 10.1016/j.enconman.2017.07.045. [Google Scholar] [CrossRef]
19. Prabhakant, Tiwari, G. (2008). Evaluation of carbon credits earned by a solar energy park in Indian conditions. The Open Fuels and Energy Science Journal, 1, 57–66. DOI 10.2174/1876973X00801010057. [Google Scholar] [CrossRef]
20. Singh, H. N., Tiwari, G. N. (2005). Evaluation of cloudiness/haziness factor for composite climate. Energy, 30, 1589–1601. DOI 10.1016/j.energy.2004.04.036. [Google Scholar] [CrossRef]
21. Setia, H., Gupta, R., Wanchoo, R. K. (2013). Stability of nanofluids. Materials Science Forum, vol. 757, pp. 139–149. DOI 10.4028/www.scientific.net/MSF.757.139. [Google Scholar] [CrossRef]
22. Dones, R., Frischknecht, R. (1998). Life cycle assessment of PV system: Results of Swiss studies on energy chains, Progress in Photovoltaic Research Applications, 6, 117–125. [Google Scholar]
23. Jungbluth, N., Dones, R., Frischknecht, R. (2007). Life cycle assessment of photovoltaics: Update of the ecoinvent database. MRS Proceedings, 1041. [Google Scholar]
24. Kato, K., Murata, A., Sakuta, K. (1998). Energy payback time and life cycle of CO2 emissions of residential PV power system with silicon PV module. Progress in Photovoltaic Research Applications, 6, 105–115. [Google Scholar]
25. Nawaz, I., Tiwari, G. N. (2006). Embodied energy analysis of photovoltaic (PV) system based on macro- and micro-level. Energy Policy, 34, 3144–3152. DOI 10.1016/j.enpol.2005.06.018. [Google Scholar] [CrossRef]
26. Watt, M., Johnson, A., Ellis, M., Quthred, N. (1998). Life cycle air emission from PV power systems. Progress in Photovoltaic Research Applications, 6, 127–136. DOI 10.1002/(ISSN)1099-159X. [Google Scholar] [CrossRef]
27. Tiwari, G. N., Ghosal, M. K. (2004). Renewable energy resources: Basic principles and Applications. Alpha Science Int'L, Ltd. [Google Scholar]
28. Hough, T. P. (2007). Recent developments in solar energy. Nova Science Pub Inc. [Google Scholar]
29. Baird, G., Alcorn, A., Haslam, P. (1997). The energy embodied in building materials–updated New Zealand coefficients and their significance. IPENZ Transactions, 24(1), 46–54. [Google Scholar]
30. Lawson, B. (1996). Building materials, energy and environment: Towards ecologically sustainable development. Royal Australian Institute of Architects, Red Hill, ACT. [Google Scholar]
31. Lawson, B. (2006). The embodied energy of building materials. Environment Design Guide, PRO 2. Royal Australian Institute of Architects, Red Hill, ACT. [Google Scholar]
32. Otanicar, T. P., Golden, J. S. (2009). Comparative environmental and economic analysis of conventional and nanofluid solar Hot water technologies. Environmental Science & Technology, 43(15), 6082–6087. DOI 10.1021/es900031j. [Google Scholar] [CrossRef]
33. Choi, U., Tran, T. (1991). Experimental studies of the effects of non-newtonian surfactant solutions on the performance of a shell-and-tube heat exchanger in recent developments in non-newtonian flows and industrial applications. New York, NY, USA: The American Society of Mechanical Engineers. [Google Scholar]
34. Karami, N., Rahimi, M. (2014). Heat transfer enhancement in a PV cell using boehmite nanofluid. Energy Conversion and Management, 86, 275–285. DOI 10.1016/j.enconman.2014.05.037. [Google Scholar] [CrossRef]
 | This work is licensed under a Creative Commons Attribution 4.0 International License, which permits unrestricted use, distribution, and reproduction in any medium, provided the original work is properly cited. |