| Energy Engineering |
DOI: 10.32604/EE.2022.014718
ARTICLE
Investigation of Inverter Temperature Prediction Model in Wind Farm Based on SCADA Data
1Engineering Research Center of Hunan Province for the Mining and Utilization of WTS Operation Data, Xiangtan, 411201, China
2School of Mechanical Engineering, Hunan University of Science and Technology, Xiangtan, 411201, China
*Corresponding Author: Qihui Ling. Email: lqh_hunan@163.com
Received: 23 October 2020; Accepted: 20 April 2021
Abstract: The inverter is one of the key components of wind turbine, and it is a complex circuit composed of a series of components such as a variety of electronic components and power devices. Therefore, it is difficult to accurately identify the operation states of inverter and some problems regarding its own circuit, especially in the early stages of failure. However, if the inverter temperature prediction model can be established, the early states can be identified through the judgment of the output temperature. Accordingly, considering whether the inverter heats up normally from the perspective of heat dissipation, a method for the early operation state identification of the inverter is provided in this paper. A variable selection method based on fusion analysis of correlation and physical relationship is adopted to extract variables as input variables, which have high correlation with inverter temperature. Then multi-input and multi-output temperature prediction model of inverter is established based on a non-linear autoregressive exogenous model (NARX) network, and the prediction temperature residual is used as the real-time standard to evaluate the inverter states. For validating this, the validity and reliability of the established temperature prediction model are verified through case analysis, and the performance comparison with various models demonstrates that the proposed method has higher accuracy. The construction method of the prediction model can be used for reference to other aspects of wind turbine. All these bring huge benefits to wind energy industry.
Keywords: Wind turbine; inverter; temperature prediction; NARX network; SCADA data
The inverter is the hub connecting the generator and the power grid, which is mainly composed of two inverters with the same structure: the machine-side inverter realizes three-phase rectification and converts the AC voltage on the machine side into the DC voltage on the DC coupling capacitor; the inverter realizes the inversion and converts the DC voltage into AC voltage with the same frequency as the grid voltage [1]. Therefore, as one of the key components of the wind turbine (WT), the reliability level of inverter directly affects the safety of the entire WT and the power grid.
Since the 1990s, in order to promote the rapid development of wind power integration, a series of wind power development support policies have been launched. Up to now, the life of large-scale operation WT has more than half. As an important part of its energy conversion, the components of the inverter system present different degrees of aging, which is easy to cause imperceptible security risks in serious cases, it even causes electrical fire. In order to eliminate the hidden trouble ahead of time, reduce the loss of fault shutdown and the maintenance cost, improve the effective utilization of equipment, and ensure the safe, stable and economic operation of WT, it is necessary to master the real-time operation status of inverter.
However, the electronic control system is more independent and compact, so unless it is redesigned, it is not easy to add additional sensors and data acquisition units, and the monitoring system should not interfere with the normal operation of the electronic control system [2]. The SCADA system provides a good application basis for using the temperature prediction model to predict the operation status of inverter.
Currently, the research work aiming at inverter is mainly carried out on the modular design of inverters, IGBT thermal balance analysis, performance evaluation, control strategy of cooler, and inverter fault diagnosis [3–9]. A newly developed dual bi-directional IGBT-based inverter in conjunction with autonomous microgrid system is investigated with particular focus on the thermal management and performance evaluation under various operation conditions in [10], so the inverter is usually equipped with the ventilation and cooling system. The statistical data presented in [11] shows that almost 60% of failures are caused by temperature cycling. In order to detect such failures, accurate elector-thermal models are essential. Proper thermal models with heat coupling effect analysis were considered in [12], and it studied a thermal impedance matrix that was convenient for thermal coupling effect estimations and representing actual heat path through the device. Generally, almost all these researches are linked to condition monitoring, fault diagnosis and thermal balance analysis of inverter. The understanding of WT inverter has been deepened via the above research works. However, WT inverter is a complex circuit system composed of many electronic components, and its working process is also rather complicated. Hence, it is difficult to accurately identify the operation states of inverter and some problems regarding its own circuit, especially in the early stages of failure.
WT usually equips with SCADA system during the actual operation. Through collecting the data of key components in WT, the operation status of WT can be mastered, and remote control can be carried out in the case of necessary. There have been many relevant researches based on the SCADA data, such as WT power curve calculation, operating state evaluation, identification of abnormal states and fault diagnosis, fault identification and vibration analysis, etc. [13–15]. For example, WT gearbox was monitored through analyzing lube oil and bearing temperature data in [4]. Ageing assessment of WT over time by interpreting wind farm SCADA data in [11]. However, SCADA data are not ideal for conducting a full condition monitoring of WT due to their low sampling frequency as mentioned in [16]. On the contrary, SCADA data are more suitable to be applied to investigate of the status prediction because the huge data volume contain all the operating conditions of WT, which can provide abundant training samples when a prediction model is used for state prediction of WT.
Therefore, it has become a research hotspot to analyze the big data provided by SCADA system and how to realize the operation status identification and prediction of key components of WT. At present, the related researches mainly focus on the state prediction of key components such as wind turbine gearbox [17], generator [18], pitch system [19] by using SCADA data, mainly using long-short term memory (LSTM) [20], support vector machine [21], artificial neural network [22] and other methods, rarely involving complex electrical equipment such as inverter. The regression prediction model of wind turbine active power is establishes based on support vector regression (SVR) algorithm, and realizes the early prediction of wind turbine pitch system fault through the model prediction residual in [23]. Neural networks are used to establish prediction models of the WT condition parameters in [24]. However, the above researches do not consider the relationship between the operation parameters of WTs, and directly use part of the SCADA data, which makes the accuracy and sensitivity of fault prediction insufficient. Monitoring data is essentially a multivariable time series, and there are complex dynamic spatiotemporal correlation characteristics among different variables, which are often easily affected by strong noise and random interference and difficult to mine. Therefore, on the basis of in-depth analysis of the characteristics of multivariable SCADA data, it is necessary to further explore and study the robust multivariable time series deep learning modeling technology, so as to realize the efficient fusion of multi-source heterogeneous monitoring information and the intrinsic eigenstructure feature mining and extraction. Furthermore, there is a wide variety of methods to build a prediction model, such as neural network prediction model and multiple linear regression prediction model, and so on [25,26]. Nevertheless, prediction values of continuous variables with a related prediction model are based on historical data in inverter temperature time series prediction. Accuracy and rationality are extremely crucial for selecting a prediction method. Hence, many researches have been conducted to improve the effectiveness of time series models [27–30].
For the above problems, this paper aims at large direct-drive wind turbines, and provides a method for early operation state identification of the inverter by concerning whether the inverter generates heat normally from the perspective of heat dissipation. The proposed method combines with wind farm SCADA data for monitoring the status of WT inverter, and uses temperature predictive analysis to study the status of wind turbine inverters, where multi-input and multi-output temperature prediction model of inverter is established based on a NARX (Non-linear Autoregressive Exogenous model) network for multi-step-ahead temperature prediction for the inverter. Furthermore, the performance comparison with other prediction methods studied extensively at present such as BP (Back Propagation) neural network, linear neural network, NIO (nonlinear input-output) neural network and NAR (Nonlinear Auto Regressive) neural network demonstrates that the proposed method has higher accuracy.
The remaining part is organized as follows. In Section 2, working environment and functional structure of direct drive WT and the inverter are addressed and analyzed. The data types of the SCADA system are categorized, and the influencing factors of inverter temperature are analyzed in Section 3. Next, in Section 4, the detailed investigation for inverter temperature prediction is carried out, including predictive model establishment and prediction result analysis. Then in Section 5, based on the SCADA data, a case was taken to predict the inverter temperature. Lastly, the main conclusions and future issues for further investigation are given in Section 6. All in all, the inverter state prediction and SCADA system are organically combined, in this paper, to establish a temperature prediction model based on NARX network, so as to identify the status of inverter, which can more effectively provide the operation and maintenance personnel with planned maintenance decision information, and also provide a theoretical basis for the thermal management of WT inverter.
2 Analysis of Inverter Working Environment
The typical three-leaf horizontal axis structure of direct drive WT as depicted in Fig. 1, comprises the wind rotor, Permanent Magnet Synchronous Motor (PMSG), inverter and controller, which is one of the mainstream wind farm models. Affected by time-varying wind speed, PMSG rotor speed is also time-varying, which means the output AC frequency of the generator is unstable. Therefore, it is necessary to connect the generator and the power grid through a full-scale frequency converter system to control PMSG rotor speed and the power flowing to the power grid.
As illustrated in Fig. 1, the full-scale frequency converter consists of two voltage source converters in the form of back-to-back, which is located at the bottom of the wind turbine tower. In the generator-side inverter, the three-phase rectification is realized, and the AC voltage is converted to the DC voltage. In the grid-side inverter, the DC voltage is converted into the AC voltage with the same frequency as the grid voltage. In other words, the voltage and current output by the PMSG will be input to the inverter, it is after being inverted and rectified by the inverter that they can meet the specific frequency required by the power grid. During the inversion and rectification process, the inverter will generate a lot of heat due to the high heat dissipation of high-power electrical components inside the inverter cabinet. In particular, the hub speed changes with the random wind speed, it causes the inverter is always in the operation state. When WT reaches the rated power under full wind speed conditions, the heat generated by the inverter is also the largest. WT inverter systems are usually equipped with ventilation and cooling devices, especially large WTs. However, when the inverter generates heat abnormally, the ventilation and cooling devices are not sufficient to reduce the inverter temperature to the normal range. Therefore, the temperature in the inverter control cabinet will also be abnormal.

Figure 1: Functional structure of direct drive wind turbine
3 Analysis of Influencing Factors of Inverter Temperature
Wind farms are usually equipped with a SCADA system, which acquires and records the operation data of WT and its core components in real time. In this paper, the turbines considered are PMSG WTs from a wind farm in Chenzhou, China. The wind farm SCADA system can provide two types of data, including sampled per second (sampling frequency: 1 Hz) and sampled per ten-minute (the ten-minute data averaged based on the one-second data). There are 55 sensor data, and the remaining 94 data are calculation data, setting parameters, and state quantities. All these parameters are important to ensure the safety and efficient operation of the turbines. In general, the temperature sensors of the WT inverter are installed in the inverter cabinet (one at each of the inlet and the outlet), which can better reflect the temperature status of the inverter. However, inverter temperature has different correlations with other parameter variables. Some of SCADA parameters have high correlations with inverter temperature, such as power and current, while some have low correlations with it. Therefore, it is very crucial to analyze and extract which parameters can affect inverter temperature from such multitudes of SCADA parameters. Next, this paper will explain the influencing factors of inverter temperature through correlation analysis and physical relationship analysis.
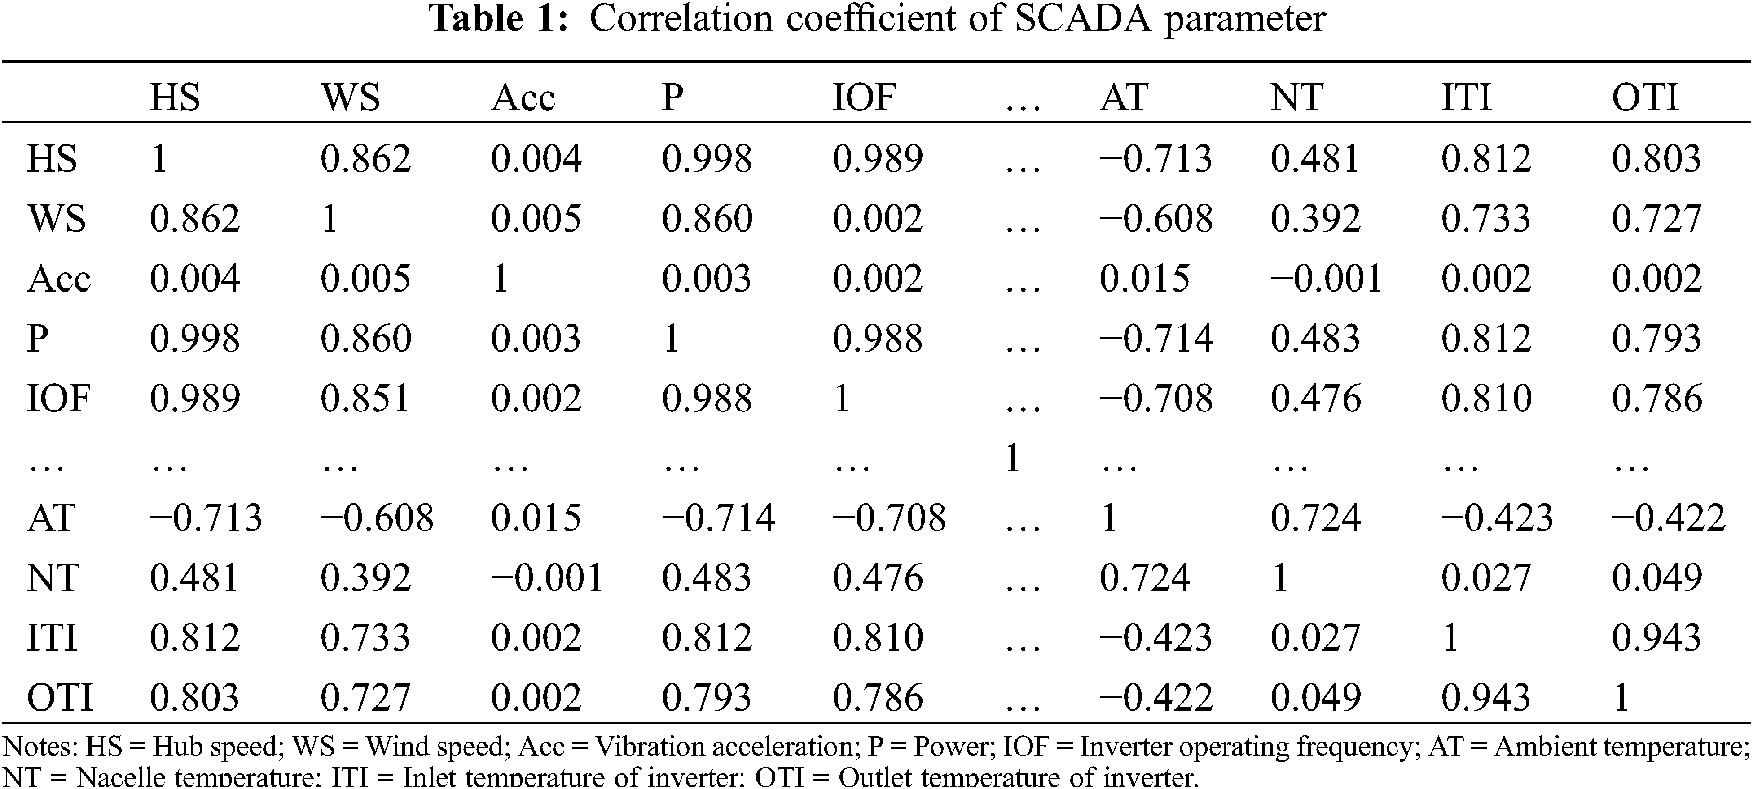
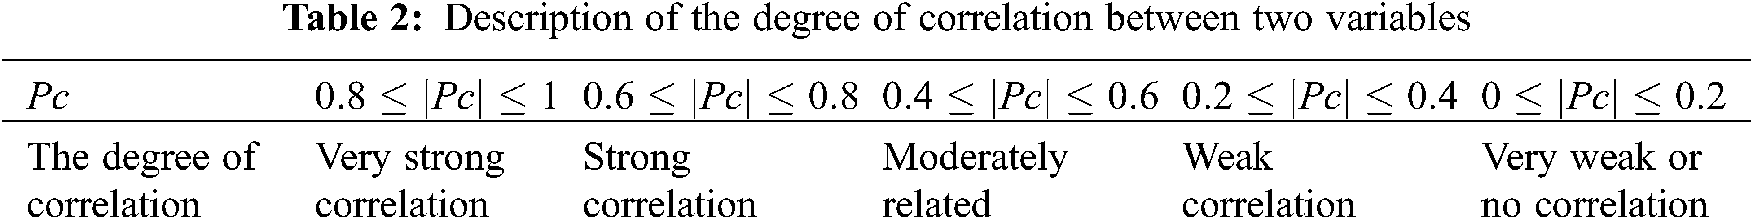
Table 1 illustrates the correlation coefficients between some SCADA parameters in this research due to space limitations. Table 2 describes the degree of correlation between the two variables. As illustrated in Table 2, the larger value of the correlation between two variables means the stronger correlation between them.
Fig. 2 shows the parameter extraction steps. 55 SCADA parameters are divided into 5 categories. The first category has 18 sets of parameters, including some parameters related to the power of WTs, such as hub speed, generator current, voltage and so on. The second category has 24 sets of parameters, which are the monitoring temperature of WT main components and the external environment temperature, such as the main bearing temperature, the generator rotor temperature, and so on. The third category has 5 parameters, mainly affecting the heat dissipation performance of the inverter. The fourth category is inverter operating parameters, which mainly includes 6 parameters. The last category is vibration parameters, mainly used to monitor the nacelle vibration. From the correlation analysis of SCADA parameters shown in Tables 1 and 2, there are nearly 20 SCADA parameters have strong correlations with inverter temperature such as hub speed, wind speed, power, and inverter operating frequency. Some are negatively related to inverter temperature, such as ambient temperature and so on.

Figure 2: Extraction steps of the parameter
If more than 20 parameters are used as the input of the inverter temperature prediction model at the same time, it will not only inevitably bring about information redundancy and increase the difficulty of constructing the prediction model, but also even affect the accuracy of the prediction model. In fact, the correlation coefficient between hub speed and power is close to 1, indicating that the two are basically linearly related. Therefore, only the influence of power on inverter temperature needs to be considered. According to the relationship, the methods of correlation analysis and physical relationship analysis are used to successfully extract 4 parameters that are closely related to the inverter temperature from the 55 SCADA parameters in this paper.

Figure 3: Data from SCADA system (WT1): (a) Rotor speed; (b) Generator power; (c) Wind speed; (d) Inlet temperature of inverter; (e) Outlet temperature of inverter; (f) Inlet pressure of inverter; (g) Outlet pressure of inverter; (h) Ambient temperature; (i) Nacelle temperature
Fig. 3 shows the SCADA data in 1.8 h for a WT including the rotor speed, generator power, wind speed, inlet temperature of inverter, outlet temperature of inverter, inlet pressure of inverter, outlet pressure of inverter, ambient temperature, and nacelle temperature.
Through polynomial curve fitting for each signal, in Fig. 3 inverter temperature changes correspondingly with the change of the rotor speed, generator power, wind speed, inlet pressure of inverter, and outlet pressure of inverter. Specifically, rotor speed, generator power, wind speed, inlet temperature of inverter, outlet temperature of inverter, inlet pressure of inverter, and outlet pressure of inverter have the same trend. While, the inlet temperature of inverter and outlet temperature of inverter have different trend with the ambient temperature and nacelle temperature. The main reason for this difference is that the analysis time is short and the inverter is not in the nacelle of WT. These indicate that though there is a difference between the measured inlet and outlet temperature of inverter and the actual temperature of inverter, the measured inlet and outlet temperature of inverter have the potential to reflect the actual inverter temperature.
4 The Establishment of the Inverter Temperature Prediction Model
4.1 Inverter Temperature Prediction Model Construction Process
In Section 3, SCADA parameters that may affect inverter temperature have been analyzed. Next, the inverter temperature prediction model will be established to identify the inverter status in this section. In this paper, a non-linear autoregressive exogenous model (NARX) network [31] is proposed for multi-step-ahead temperature prediction for the inverter. NARX network is a nonlinear autoregressive model which has exogenous inputs, and can learn to predict one time series given past values of the same time series, the feedback input, and another time series. The network parameters that need to be set mainly include: the number of input layer delays, feedback layer delays and hidden layer sizes.
The performance of the prediction model is very important. However, as a complex electromechanical system, the factors affecting WT inverter temperature, especially the relationship between the temperature and other operation parameters are very complicated. In fact, not all of SCADA parameters are truly useful for conducting the inverter temperature prediction model. In order to improve accuracy of prediction, the appropriate input parameters and training sample should be selected. The useful SCADA parameters will be identified first from these data. Then, the training sample of inverter temperature prediction model will be designed based on the identified SCADA parameters specifically. Therefore, when training a prediction model, the following factors should be considered:
• Selection of input parameters
• Training data selection rules
• Optimal hidden Sizes Row vector
• Optimal feedback Delays Row vector
In addition, the NARX network has various advantages over other types of recurrent neural networks in terms of network learning and generalization capability, so missing individual one-second data has no effect on the model through this method. But the one-second data cannot be used when training the model. There are two main reasons: (1) The amount of one-second data is very large. There are 86,400 sets of data in one day, which is very difficult to train the model. Training a NARX model with such large training samples will take a lot of time and even cause the computer system to crash, (2) If a small amount of one-second data is selected as the training sample, such as 20,000 sets of data, the model training time will be greatly reduced, which may not be able to simulate all the operation conditions of WT inverter and lead to the very poor performance of the prediction model. For the ten-minute data, there are only more than 52,000 sets of data for a wind turbine in a year, and all the power generation conditions will basically appear. However, ten-minute data is a relatively long-time scale. After the data within ten min is averaged, a lot of valuable information may be overwhelmed, and it may not necessarily truly reflect the real-time inverter status. Meanwhile the effect of thermal inertia will be very weak. A new data type which is averaged per 30 s is provided here, and the 30-s data are averaged based on one-second data, it is defined as (1):
Because a problem of data collection could cause the value of one or several consecutive data is zero, the training data with long-term zero power cannot be selected. However, NARX network has a certain generalization ability, thus the influence of individual outliers can be ignored. Based on the above analysis, the structure of the inverter temperature prediction model based on NARX network is shown in Fig. 4.
Firstly, all the power generation conditions of WT are included as much as possible during selecting the training sample. The training sample would include 6 regions [32] and the shutdown situation. In Region 1, although the wind rotor rotates, the generator power is zero. Region 2 is the transition period of Regions 1 and 3 where the relationship between the torque and the rotational speed of the wind rotor is linear. In Region 3 the maximum power coefficient remains constant because the Maximum Power Point Tracking (MPPT) is implemented in this region. Regions 4 and 5 are the transition periods of Regions 3 and 6. Region 6 is the constant power region where the generator power is limited to 2 MW (rated power). Secondly, the optimal input delays, optimal output delays, and optimal hidden layers can be set, as shown in [33]. And then, train and test the prediction model repeatedly. Because the residuals are different during each time the prediction model training, there is even a great difference. In order to reduce this randomness, a total of 20 prediction models are trained, and all prediction models are tested. The one with the smallest prediction residual is selected as the final prediction model to verify the effectiveness of the prediction results. Finally, the prediction set in SCADA database is used to analyze the prediction model residuals.

Figure 4: Implementation steps of the NARX
4.2 Inverter Temperature Prediction
According to implementation steps described in Section 4.1, once the entry variables have been defined, the hidden layer also will be defined, the reason is that in most practical problems it is not necessary to include more, and finally the data are normalized between 0 and 1 [34]. Many simulations are performed using the NARX model varying: the number of delays of the entry variables from 6 to 50, the number of hidden neurons from 16 to 50, and always using a neuron more than in the entry layer. The network with the best performance considering the mean square error (MSE) of the test set is the one defined by 36 delays and 32 neurons in the hidden layer. For the generation of the neural network models, 40,000 sets of 30-s SCADA data are employed to train the neural network models. The division of the data in the sample used is as follows: 70% for the training set, 15% for the validation set, and 15% for the test set. These amounts are chosen based on previous rules, which is more convenient to train a neural network model with the best performance.
Fig. 5 shows the comparison between the real data and predication data with NARX. 40,000 sets SCADA data used to train the neural network model are shown in Figs. 5a and 5b. Fig. 5a shows the comparison of inlet temperature between the real data and predication data, and Fig. 5b shows the comparison of outlet temperature. The other 20,000 sets SCADA data are specifically used to test the performance of the model in Figs. 5c and 5d. The performance of the model is shown as these figures.

Figure 5: Comparison between the real data and predication data: (a) Inlet temperature of inverter for training set; (b) Outlet temperature of inverter for training set; (c) Inlet temperature of inverter for test set; (d) Outlet temperature of inverter for test set
However, due to the large amount of SCADA data, a significant difference cannot be perceived. To fully appreciate the prediction model performance, the prediction residuals were plotted and the results are shown in Fig. 6. Only by using prediction error measurements can this difference be highlighted. Moreover, the criterion for judging the degree of the prediction residual outliers is the model standard prediction absolute value percentile, that is, after the training of the prediction model is completed, all training samples are input to the model, and the absolute value of the model prediction residual is statistically obtained percentile [29].

Figure 6: Forecast error between the real data and predication data: (a) the training error of inlet temperature of inverter; (b) the training error of outlet temperature of inverter; (c) the prediction error of inlet temperature of inverter; (d) the prediction error of outlet temperature of inverter
It is not difficult to see from Fig. 6 that the training error and prediction error of the inverter inlet temperature both are within 1°C, while the training error of the inverter outlet temperature is within 2°C, and the prediction error is within 3°C. The percentiles of absolute predicted residuals are shown in Fig. 7, where it is not difficult to see that during the model training, the percentiles of the training error of the inverter inlet temperature within 0.5°C is 0.99, and the percentiles of the prediction error within 0.5°C is 0.96; The training error of the outlet temperature is slightly larger than the training error of the inlet temperature, the percentiles within 1°C is 0.98, and the prediction error within 1°C is 0.84. The results demonstrate that the forecast with the NARX model is feasible. It can be observed that even with the other SCADA data, the model continues to behave in an outstanding way.

Figure 7: Percentiles of absolute errors between the real data and predication data
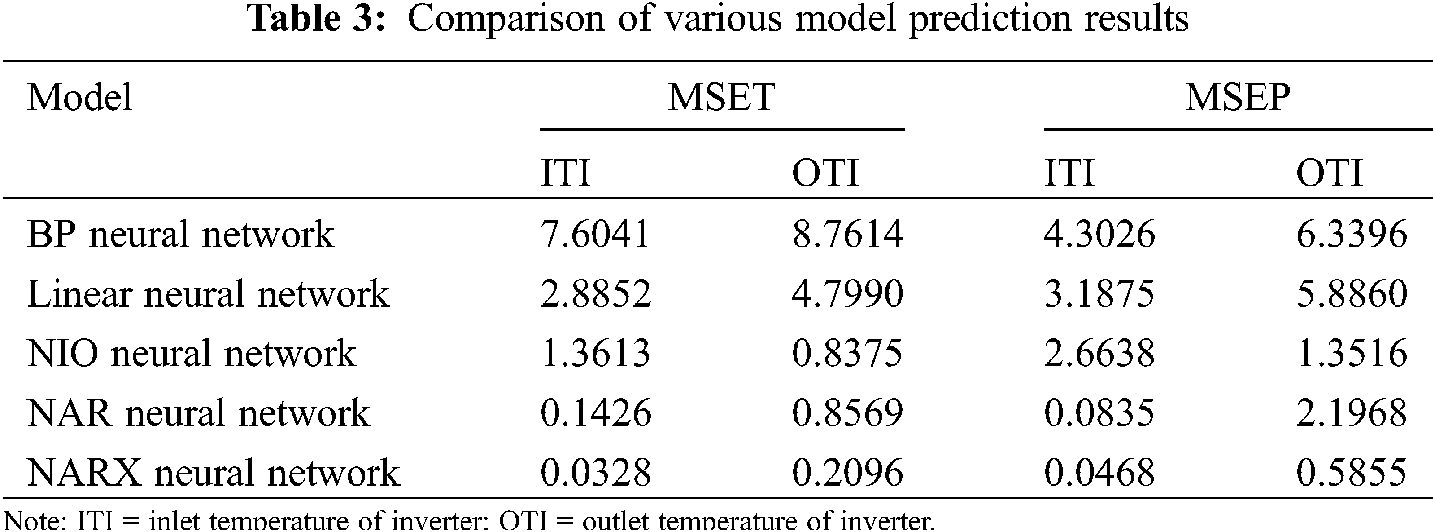
In order to verify the great performance of the proposed model in temperature prediction accuracy, several prediction algorithms have been compared with NARX network. It can be seen from Table 3 that NARX has the smallest MSE of training (MSET) and MSE of prediction (MSEP) and the best accuracy for inlet and outlet temperature prediction. Obviously, the NARX neural network used in this paper has the best accuracy for prediction after data selection, determination of input-output variables, which is compared with BP (Back Propagation) neural network, linear neural network, NIO (nonlinear input-output) neural network and NAR (Nonlinear Auto Regressive) neural network neural network. The four prediction methods selected as comparisons in this paper are both traditional and proven effective models. By comparing with their predictions under the same trade-off indicator, the value and effectiveness of the work of this paper can be visually displayed.
Finally, a section of measured abnormal data is taken as an example for illustration. SCADA data on October 28 to 29 are shown in Fig. 8, which can explain the real-time inverter status. Figs. 8a and 8c are respectively employed to analyze the comparison of inlet temperature and outlet temperature of inverter. To identify the real-time inverter status, Figs. 8b and 8d are respectively corresponding forecasted outputs error of the inverter inlet temperature and the inverter outlet temperature. Generally, the highest operation environment temperature of the inverter is lower than 50°C. If the temperature is too high, the inverter will be easily aged and accelerated the damage. As illustrated in Fig. 8, for the first 1,600 sets, the prediction error of the inlet temperature and outlet temperature of the inverter remained within a relatively normal range, and then began to increase significantly, indicating that the inverter status has changed significantly. If the prediction residuals of the temperature at the inlet and outlet of the inverter is larger, the inverter status needs special attention. When it about reaches 4,200 sets, the prediction error returns to the normal range.
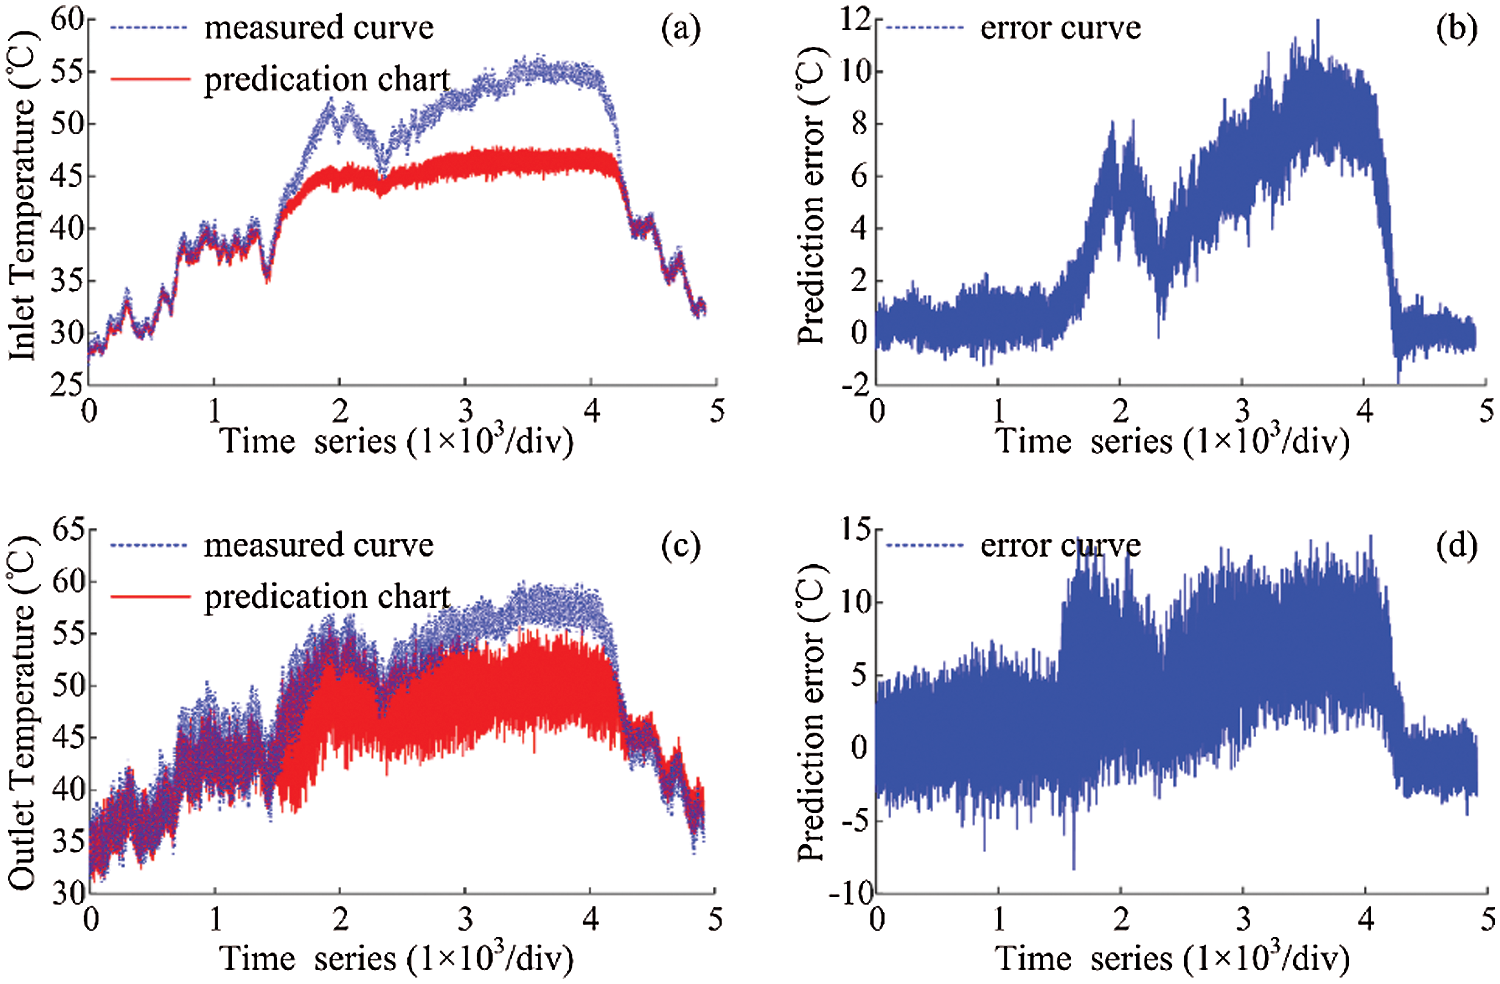
Figure 8: Forecast for the inverter temperature: (a) the comparison of measured curve and predication chart of inlet temperature of inverter; (b) the comparison of measured curve and predication chart of outlet temperature of inverter; (c) forecasted outputs error of inlet temperature of inverter; (d) forecasted outputs error of outlet temperature of inverter
Inverter status is an important indicator for the safe operation of the WTs. Combining with wind farm SCADA data, this paper establishes a multi-input and multi-output temperature prediction model based on NARX neural network, in order to study the multi-step-ahead temperature prediction for WT inverter. The predicted residual error is obtained to determine the real-time service status of the inverter. Main conclusions are drawn as follows:
(1) The inverter temperature which can represent the operation state of the inverter is selected as the output of the model. Based on the fusion analysis of correlation and physical relationship, four parameters closely related to the output are selected as the input of the model from 55 SCADA parameters;
(2) Considering the optimal input model parameters (including input layer node, output layer node and delay layer node), the temperature prediction model of WT inverter is established based on NARX network and SCADA data, and the predicted temperature residual is used as the real-time index to evaluate the inverter status;
(3) The analysis of an example shows that the proposed method can effectively identify the operation state of WT inverter, which can more effectively provide the operation and maintenance personnel with planned maintenance decision information, and also provide the practical benefits for energy companies and the energy market policy-makers.
In the future, by establishing prediction model of WTs inverter, more intensive investigation conclusions will be obtained. In order to clearly present the implied information on the health condition of WTs contained in the model prediction residuals, a new kind of health index from inverter temperature should be developed, which can effectively reflect some early health problems of WTs to provide a reference for their scientific maintenance. All these new investigation achievements will be reported in separate papers.
Acknowledgement: The authors would like to thank the Hara XEMC Wind Power Co., Ltd., China.
Funding Statement: This work is supported by the National Natural Science Foundation of People’s Republic of China (Grant No. 51875199); Hunan Provincial Natural Science Foundation (Grant No. 2019JJ50154) and the Key Research and Development Program of Hunan Province, China (Grant No. 2018GK2073).
Conflicts of Interest: The authors declare that they have no conflicts of interest to report regarding the present study.
1. Tahir, A., EL-Mukhtar, M., EL-Faituri, A., Mohamed, F. (2020). Grid connected wind energy system through a back-to-back converter. Computers & Electrical Engineering, 85(6), 106660. DOI 10.1016/j.compeleceng.2020.106660. [Google Scholar] [CrossRef]
2. Shi, Y. H., Feng, Y. H., Ren, M., Qiu, Y. N. (2020). Study on fault diagnosis method of converter in permanent magnet synchronous wind power system by fusion of current and vibration signals. Proceedings of the CSEE, 40(23), 7750–7760. DOI 10.13334/j.0258-8013.pcsee.200886. [Google Scholar] [CrossRef]
3. Macarios, T. D. C., Barbosa, J. R. (2015). Infrared thermal imaging analysis of a 1-kW variable capacity compressor frequency inverter. Journal Brazilian Society of Mechanical Sciences and Engineering, 37(1), 275–284. DOI 10.1007/s40430-014-0148-9. [Google Scholar] [CrossRef]
4. Venkatramanan, D., Adapa, A. K., John, V. (2017). Design and comparative study of discrete and module-based IGBT power converters. Sādhanā, 42(8), 1–9. DOI 10.1007/s12046-017-0682-0. [Google Scholar] [CrossRef]
5. Zavrel, M., Kindl, V., Pechanek, R. (2020). Sensorless control strategy of cooler for reduction dimensions and operating characteristic improvement in double three-phase inverter. Electrical Engineering, 102(1), 117–127. DOI 10.1007/s00202-019-00787-9. [Google Scholar] [CrossRef]
6. Li, X. W., Richard, A., Thomas, A. L. (2009). Analysis of power-cycling capability of IGBT modules in a conventional matrix converter. IEEE Transactions on Industry Applications, 45(4), 1443–1451. DOI 10.1109/TIA.2009.2023556. [Google Scholar] [CrossRef]
7. Ma, K., Liserre, M., Blaabjerg, F. (2012). Reactive power influence on the thermal cycling of multi-MW wind power inverter. Proceedings of IEEE Applied Power Electronics Conference and Exposition, pp. 1048–2334, Orlando, FL, USA. [Google Scholar]
8. Busca, C., Teodorescu, R., Blaabjerg, F. (2011). An overview of the reliability prediction related aspects of high power IGBTs in wind power applications. Microelectronics Reliability, 51(9), 1903–1907. DOI 10.1016/j.microrel.2011.06.053. [Google Scholar] [CrossRef]
9. Wei, L., Kerkman, R. J., Lukaszewski, R. A., Lu, H., Yuan, Z. (2011). Analysis of IGBT power cycling capabilities used in doubly fed induction generator wind power system. IEEE Transactions on Industry Applications, 47(4), 1794–1801. DOI 10.1109/TIA.2011.2153172. [Google Scholar] [CrossRef]
10. Chang, T. C., Fuh, Y. K., Lu, H. Y. (2016). Thermal management and performance evaluation of a dual bi-directional, soft-switched IGBT-based inverter for the 1st autonomous microgrid power system in Taiwan under various operating conditions. Heat & Mass Transfer, 52(6), 1231–1241. DOI 10.1007/s00231-015-1628-x. [Google Scholar] [CrossRef]
11. Dai, J. C., Yang, W. X., Cao, J. W., Liu, D. S., Long, X. (2018). Ageing assessment of a wind turbine over time by interpreting wind farm SCADA data. Renewable Energy, 116(9), 199–208. DOI 10.1016/j.renene.2017.03.097. [Google Scholar] [CrossRef]
12. Yang, W. X., Tavner, P. J., Crabtree, C. J. (2014). Wind turbine condition monitoring: Technical and commercial challenges. Wind Energy, 17(5), 673–693. DOI 10.1002/we.v17.5. [Google Scholar] [CrossRef]
13. Zhang, Z. J., Kusiak, A. (2012). Monitoring wind turbine vibration based on SCADA data. Journal of Solar Energy Engineering, 134(2), 21004. DOI 10.1115/1.4005753. [Google Scholar] [CrossRef]
14. Dai, J. C., Tan, Y. Y., Yang, W. X. (2017). Investigation of wind resource characteristics in mountain wind farm using multiple-unit SCADA data in Chenzhou: A case study. Energy Conversion and Management, 148(3), 378–393. DOI 10.1016/j.enconman.2017.05.075. [Google Scholar] [CrossRef]
15. Dai, J. C., Cao, J. W., Liu, D. S. (2017). Power fluctuation evaluation of large-scale wind turbines based on SCADA data. IET Renewable Power Generation, 11(4), 395–402. DOI 10.1049/iet-rpg.2016.0124. [Google Scholar] [CrossRef]
16. Kusiak, A., Zhang, Z. J. (2010). Analysis of wind turbine vibrations based on SCADA data. Journal of Solar Energy Engineering, 132(3), 031008. DOI 10.1115/1.4001461. [Google Scholar] [CrossRef]
17. Corley, B., Carroll, J., Mcdonald, A. (2020). Fault detection of wind turbine gearbox using thermal network modelling and scada data. Journal of Physics: Conference Series, 1618(2), 22042. DOI 10.1088/1742-6596/1618/2/022042. [Google Scholar] [CrossRef]
18. Zhang, S., Lang, Z. Q. (2020). Scada-data-based wind turbine fault detection: A dynamic model sensor method. Control Engineering Practice, 102(3), 104546. DOI 10.1016/j.conengprac.2020.104546. [Google Scholar] [CrossRef]
19. Wang, S. X., Guo, T. T., Li, M. (2019). On-line abnormal state identification of pitch system based on transitional mode for wind turbine. Proceedings of the CSEE, 39(17), 5144–5152+5295. DOI 10.13334/j.0258-8013.pcsee.182500. [Google Scholar] [CrossRef]
20. Huang, R. Z., Tang, B. P., Yang, Y. N., Deng, L. (2021). Condition monitoring of wind turbine gearbox based on LSTM neural network fusing SCADA data. Acta Energiae Solaris Sinica, 42(1), 235–239. DOI 10.19912/j.0254-0096.tynxb.2018-0802. [Google Scholar] [CrossRef]
21. Yang, C., Liu, J., Zeng, Y. (2019). Real-time condition monitoring and fault detection of components based on machine-learning reconstruction model. Renewable Energy, 133, 433–441. DOI 10.1016/j.renene.2018.10.062. [Google Scholar] [CrossRef]
22. Bangalore, P., Tjernberg, L. B. (2015). An artificial neural network approach for early fault detection of gearbox bearings. IEEE Transactions on Smart Grid, 6(2), 980–987. DOI 10.1109/TSG.2014.2386305. [Google Scholar] [CrossRef]
23. Liang, Y., Fang, R. M. (2013). An online wind turbine condition assessment method based on SCADA and support vector regression. Automation of Electric Power Systems, 37(14), 7–12. DOI 10.7500/AEPS201209163. [Google Scholar] [CrossRef]
24. Sun, P., Li, J., Wang, C. S. (2016). A generalized model for wind turbine anomaly identification based on SCADA data. Applied Energy, 168(3), 550–567. DOI 10.1016/j.apenergy.2016.01.133. [Google Scholar] [CrossRef]
25. Botre, C., Mansouri, M., Karim, M. N., Nounou, H., Nounou, M. (2017). Multiscale PLS-based GLRT for fault detection of chemical processes. Journal of Loss Prevention in the Process Industries, 46(4), 143–153. DOI 10.1016/j.jlp.2017.01.008. [Google Scholar] [CrossRef]
26. Jain, L. C., Seera, M., Lim, C. P. (2014). A review of online learning in supervised neural networks. Neural Computing & Applications, 25(3–4), 491–509. DOI 10.1007/s00521-013-1534-4. [Google Scholar] [CrossRef]
27. Mishra, D. P., Ray, P. (2018). Fault detection, location and classification of a transmission line. Neural Computing and Applications, 30(5), 1377–1424. DOI 10.1007/s00521-017-3295-y. [Google Scholar] [CrossRef]
28. Taqvi, S. A., Tufa, L. D., Zabiri, H. (2017). Artificial neural network for anomalies detection in distillation column. Proceedings of Asian Simulation Conference, pp. 302–311. Singapore, Springer. [Google Scholar]
29. Sheikh, M. A., Nor, N. M., Ibrahim, T., Irfan, M. (2017). Unsupervised on-line method to diagnose unbalanced voltage in three-phase induction motor. Neural Computing and Applications, 13, 1–16. DOI 10.1007/s00521-017-2973-0. [Google Scholar] [CrossRef]
30. Ayubi Rad, M. A., Yazdanpanah, M. J. (2015). Designing supervised local neural network classifiers based on EM clustering for fault diagnosis of Tennessee Eastman process. Chemometrics and Intelligent Laboratory Systems, 146, 149–157. DOI 10.1016/j.chemolab.2015.05.013. [Google Scholar] [CrossRef]
31. Chatterjee, S., Nigam, S., Singh, J. B. (2012). Software fault prediction using nonlinear autoregressive with exogenous inputs (NARX) network. Applied Intelligence, 37(1), 121–129. DOI 10.1007/s10489-011-0316-x. [Google Scholar] [CrossRef]
32. Dai, J. C., Liu, D. S., Wen, L. (2016). Research on power coefficient of wind turbines based on SCADA data. Renewable Energy, 86(1), 206–215. DOI 10.1016/j.renene.2015.08.023. [Google Scholar] [CrossRef]
33. Wang, X., Zhao, Q. C., Yang, X. B. (2020). Condition monitoring of wind turbines based on analysis of temperature-related parameters in supervisory control and data acquisition data. Measurement and Control, 53(1–2), 1–17. DOI 10.1177/0020294019888239. [Google Scholar] [CrossRef]
34. Cadenas, E., Rivera, W., Campos-Amezcua, R. (2016). Wind speed forecasting using the NARX model, case: La Mata, Oaxaca, México. Neural Computing & Applications, 27(8), 2417–2428. DOI 10.1007/s00521-015-2012-y. [Google Scholar] [CrossRef]
 | This work is licensed under a Creative Commons Attribution 4.0 International License, which permits unrestricted use, distribution, and reproduction in any medium, provided the original work is properly cited. |