| Energy Engineering |
DOI: 10.32604/EE.2021.017282
ARTICLE
Investigation of Plans Shape and Glazing Percentage for the Energy Efficiency of Residential Buildings
School of Architecture, College of Fine Arts, University of Tehran, Tehran, Iran
*Corresponding Author: Tayyebeh Yazarlou. Email: t.yazarlou@alumni.ut.ac.ir
Received: 28 April 2021; Accepted: 24 July 2021
Abstract: The room's plan shape, the area of the window, and the impact of the materials are significant parameters in determining the thermal needs of buildings. In traditional houses of the hot and dry climate of Iran, the plan shape of the room, the ratio of the window area to the floor area, and the comparison between traditional and prevalent materials have been less studied. This study investigated the thermal performance of seven different models of the plan shape, five different ratios of window area to plan area, and three material structures in a selected room of Yazd City using EnergyPlus software. Seven models have different plan shapes but the same floor area, whose thermal balance process calculations have been performed by the CTF method. The results show that the best thermal comfort conditions for the residents are at the window area to floor area ratio of 12% for the brick buildings and 15% for the buildings with thermal insulation and proposed materials. The lowest cooling and heating needs are obtained in a room with an east-west extension and a length-to-width ratio of about 1.38, which indicates the proper plan shape of the selected room. This research can be considered as a climatic strategy to improve the energy efficiency of residential buildings in Yazd.
Keywords: Energy efficiency; thermal comfort; plan shape; window area to plan area
Energy consumption is increasing worldwide [1] and buildings account for a large portion of the world's energy consumption [2,3]. Meanwhile, the residential sector has a complex pattern in energy consumption [4]. Numerous researches have been done on the design of buildings and energy, most of which are about facades (e.g., [5]), materials (e.g., [6–8]), envelopes (e.g., [9,10]), atriums (e.g., [11]), shading devices (e.g., [12]), shapes, and the geometry of the buildings (e.g., [13–15]).
Numerous factors such as different forms, orientation, and percentage of the translucent area have a significant impact on the heating loads of a building [16,17]. The building form is one of the crucial factors that can increase/decrease the heating and cooling loads required by the building [18]. The shape of the building is one of the most significant design factors of a building, which is due to its tremendous effect on energy efficiency and construction costs [17]. Variables that are dependent on the shape of the building and affect the heating and cooling needs are shape factor, climate, and the effect of form on the building life cycle [19].
AlAnzi et al. [20] investigated building energy efficiency for several different building forms and shapes, the ratio of window to wall, and glazing types for a prototypical Kuwaiti office building. They reported that for buildings with a low window to wall ratio, the energy demands of a building are inversely proportional to building compactness rather than its form. While energy consumption and the shape of the buildings have a strong correlation [21]. Ferdous [22] carried out a study on minimizing energy consumption and office building geometry for the five different models. The results showed that energy deviation from one shape to another is relatively small. However, the ratio of the window to the wall has a significant impact on the energy use pattern of the building compared to the form.
Hemsath et al. [23] compared the vertical and horizontal geometric proportions with material consideration. Their results showed that both types are equally sensitive to specific material. In addition, the building form is one of the most significant factors to estimate energy performance which can be considered by architects and building engineers to achieve low carbon construction. Generally, the total building energy consumption can be reduced by the energy-efficient design of the building geometry by using advantages of renewable energy resources such as sunlight, wind, etc. [24].
In previous studies, the building form, the orientation, and the area of the window have been discussed. While the relationship between the aspect ratio of the rectangular plan shape and the ratio of the south window area to plan area has been less studied due to the effect of building materials that can reduce the thermal needs of the building and improve the thermal comfort of space users. Also, according to the Fourth National Building Regulations of Iran, the ratio of window to the floor area in the residential spaces is about 1:7 and 1:8 floor area. However, the impact of climate and the estimation of the building thermal need are not considered in this proposed range. Based on this, the research questions were as follows:
– What is the effect of plan shape on cooling/heating loads of rectangular rooms in Yazd City?
– What is the ratio of window area to plan area with the thermal need of the building?
– How much does a material with better thermal performance than the current structure affect the thermal loads of the building?
This study presents a simulation-based approach to assist building engineers in designing and choosing the appropriate rectangular plan shapes and the south window to the floor area ratio in residential buildings in hot and arid regions of Iran. The method can provide a design solution to improve the building's energy performance. Moreover, the results can be used as an architectural strategy in the Central Plateau of Iran.
In this study, the thermal performance of the building was simulated by EnergyPlus software version 8.7.0 developed by the US Department of Energy (DOE). Seven isolated models with rectangular plan shapes (with different dimensions, the same area, and three different structures for the walls) and five different window area ratios for each model were investigated, and their effect on the heating and cooling loads required by the building was measured. The proportions of a winter living room with dimensions of 6.57 m × 4.75 m × 3.32 m (length × width × height) in a traditional house in the city of Yazd (Ataian House) has been considered as the selected model (Fig. 1). Then, six different rooms were designed. For nine months of the year, the heating requirement of the models is about zero or negligible. Also, the cooling load is very low or zero for about seven months of the year. Therefore, heating and cooling loads in July as the hottest and January as the coldest months, as the critical time of the year, were studied for all models based on the ratio of south window area to floor area with ratios of 7%, 12%, 15%, 20%, and 30% for three different wall structures. In addition, thermal loads are investigated for each model as a seasonal average throughout the year.
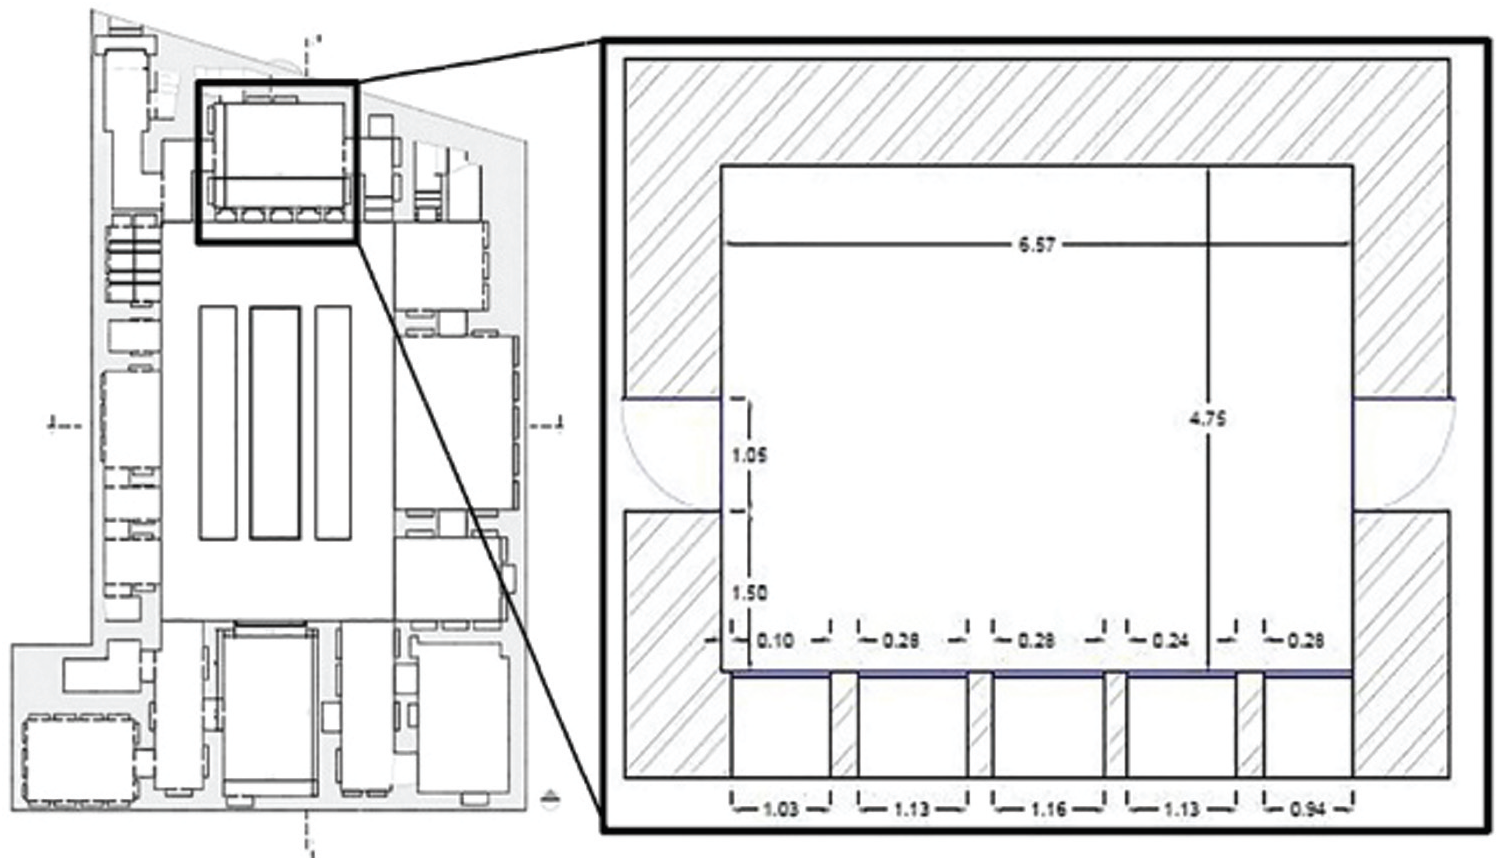
Figure 1: Plan of ataian yazd house and enlargement of winter living room
2.1 Specifications of the Models
Fig. 2 shows the different modes of the studied models. Model b is related to the available room. The other six models were designed with the same floor area and height as the selected model but with different elongation and length-to-width ratios.
2.2 Specifications of the Walls
Thermal resistance is the reciprocal of thermal conductance. Since the purpose of thermal insulation is to resist heat flow it is convenient to measure a material's performance in terms of its thermal resistance, which is calculated by dividing the thickness expressed in meters by the thermal conductivity. Furthermore, Surface heat transfer coefficient (thermal transmittance) refers to the ability of a part of the outer envelope of a building to transfer heat in stable conditions, which expresses the amount of heat transferred per unit area, time unit, and one-degree temperature difference. This coefficient is obtained from the inverse sum of the thermal resistances of different wall layers and air layers. The efficiency of thermal insulation of the building walls depends on this coefficient [25] which is calculated by Eqs. (1) and (2) [3,25]. The lower this coefficient, the more heat-resistant the wall is.
where; d = thickness λ = heat conductivity coefficient
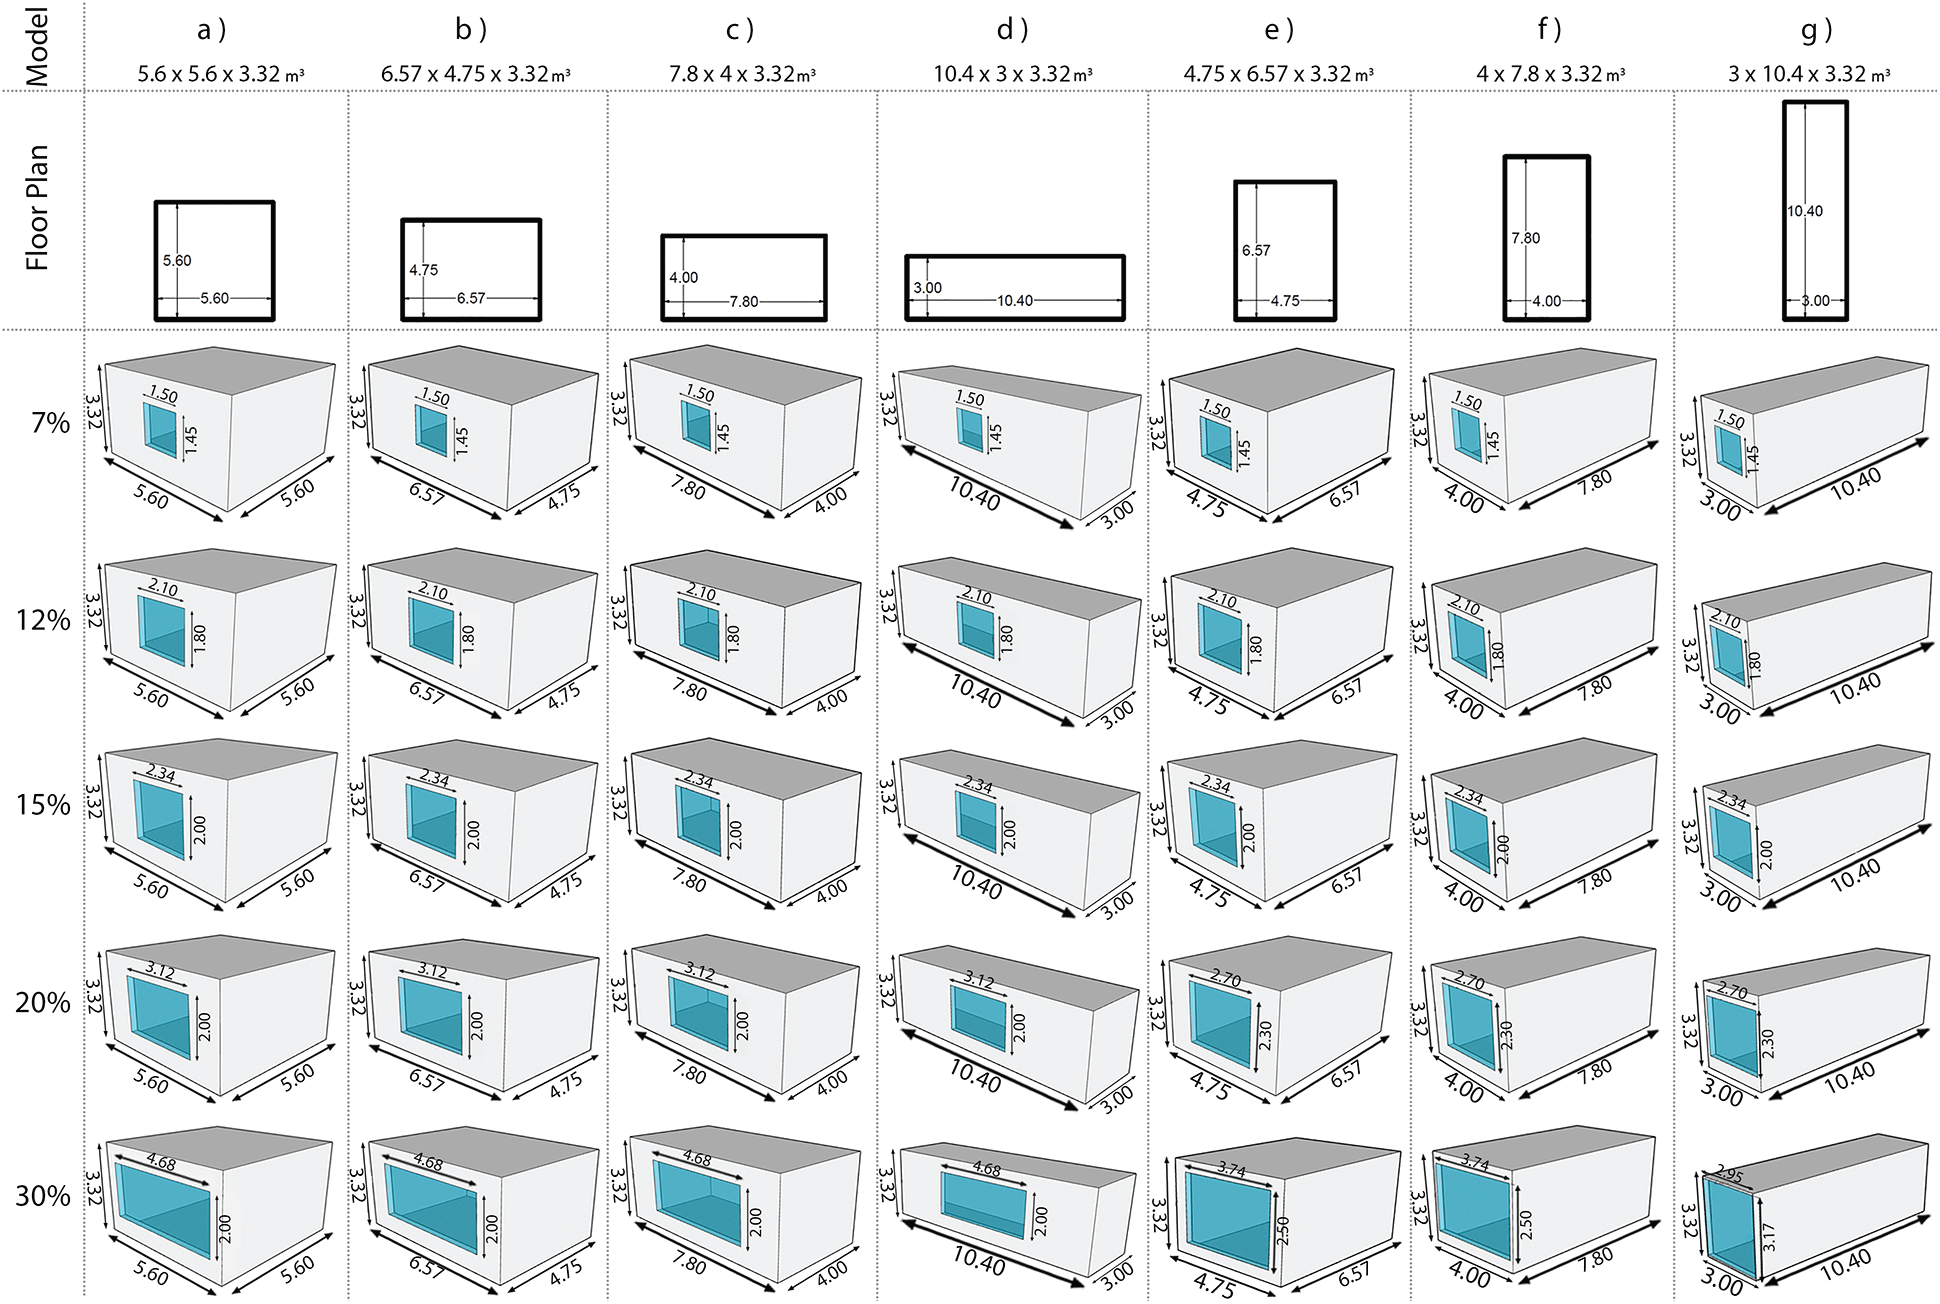
Figure 2: Examined models: (a) square plan shape, (b) available room, (c, d) the plan stretches in an east-west direction, and (e, f, g) the plan stretches in a north-south direction
The available room is made of brick and has a single-glazed window. The thickness of the wall, ceiling, and floor of this room are 100, 80, and 30 cm, respectively, which yield a thermal conductivity of 1.1 W/mK. Their surface heat transfer coefficients are 0.9, 0.7, and 0.27, respectively. The surface heat transfer coefficient of the single-glazed glass is 5.8 W/m2K. Solar transmittance at normal incidence is considered 0.6 and 0.775 for the low emission and ordinary clear glass, respectively. Three different surface structures (brick and single-glazed window, proposed opaque materials in Tab. 1 and single-glazed window, proposed opaque and translucent materials in Tab. 1 with double-glazed window) have been investigated for all 35 models. In all cases, a wooden door with thermal conductivity of 0.14 W/mK has been considered. Tab. 1 shows the specifications of the suggested structures, and Figs. 3a–3c depict a schematic section of them.
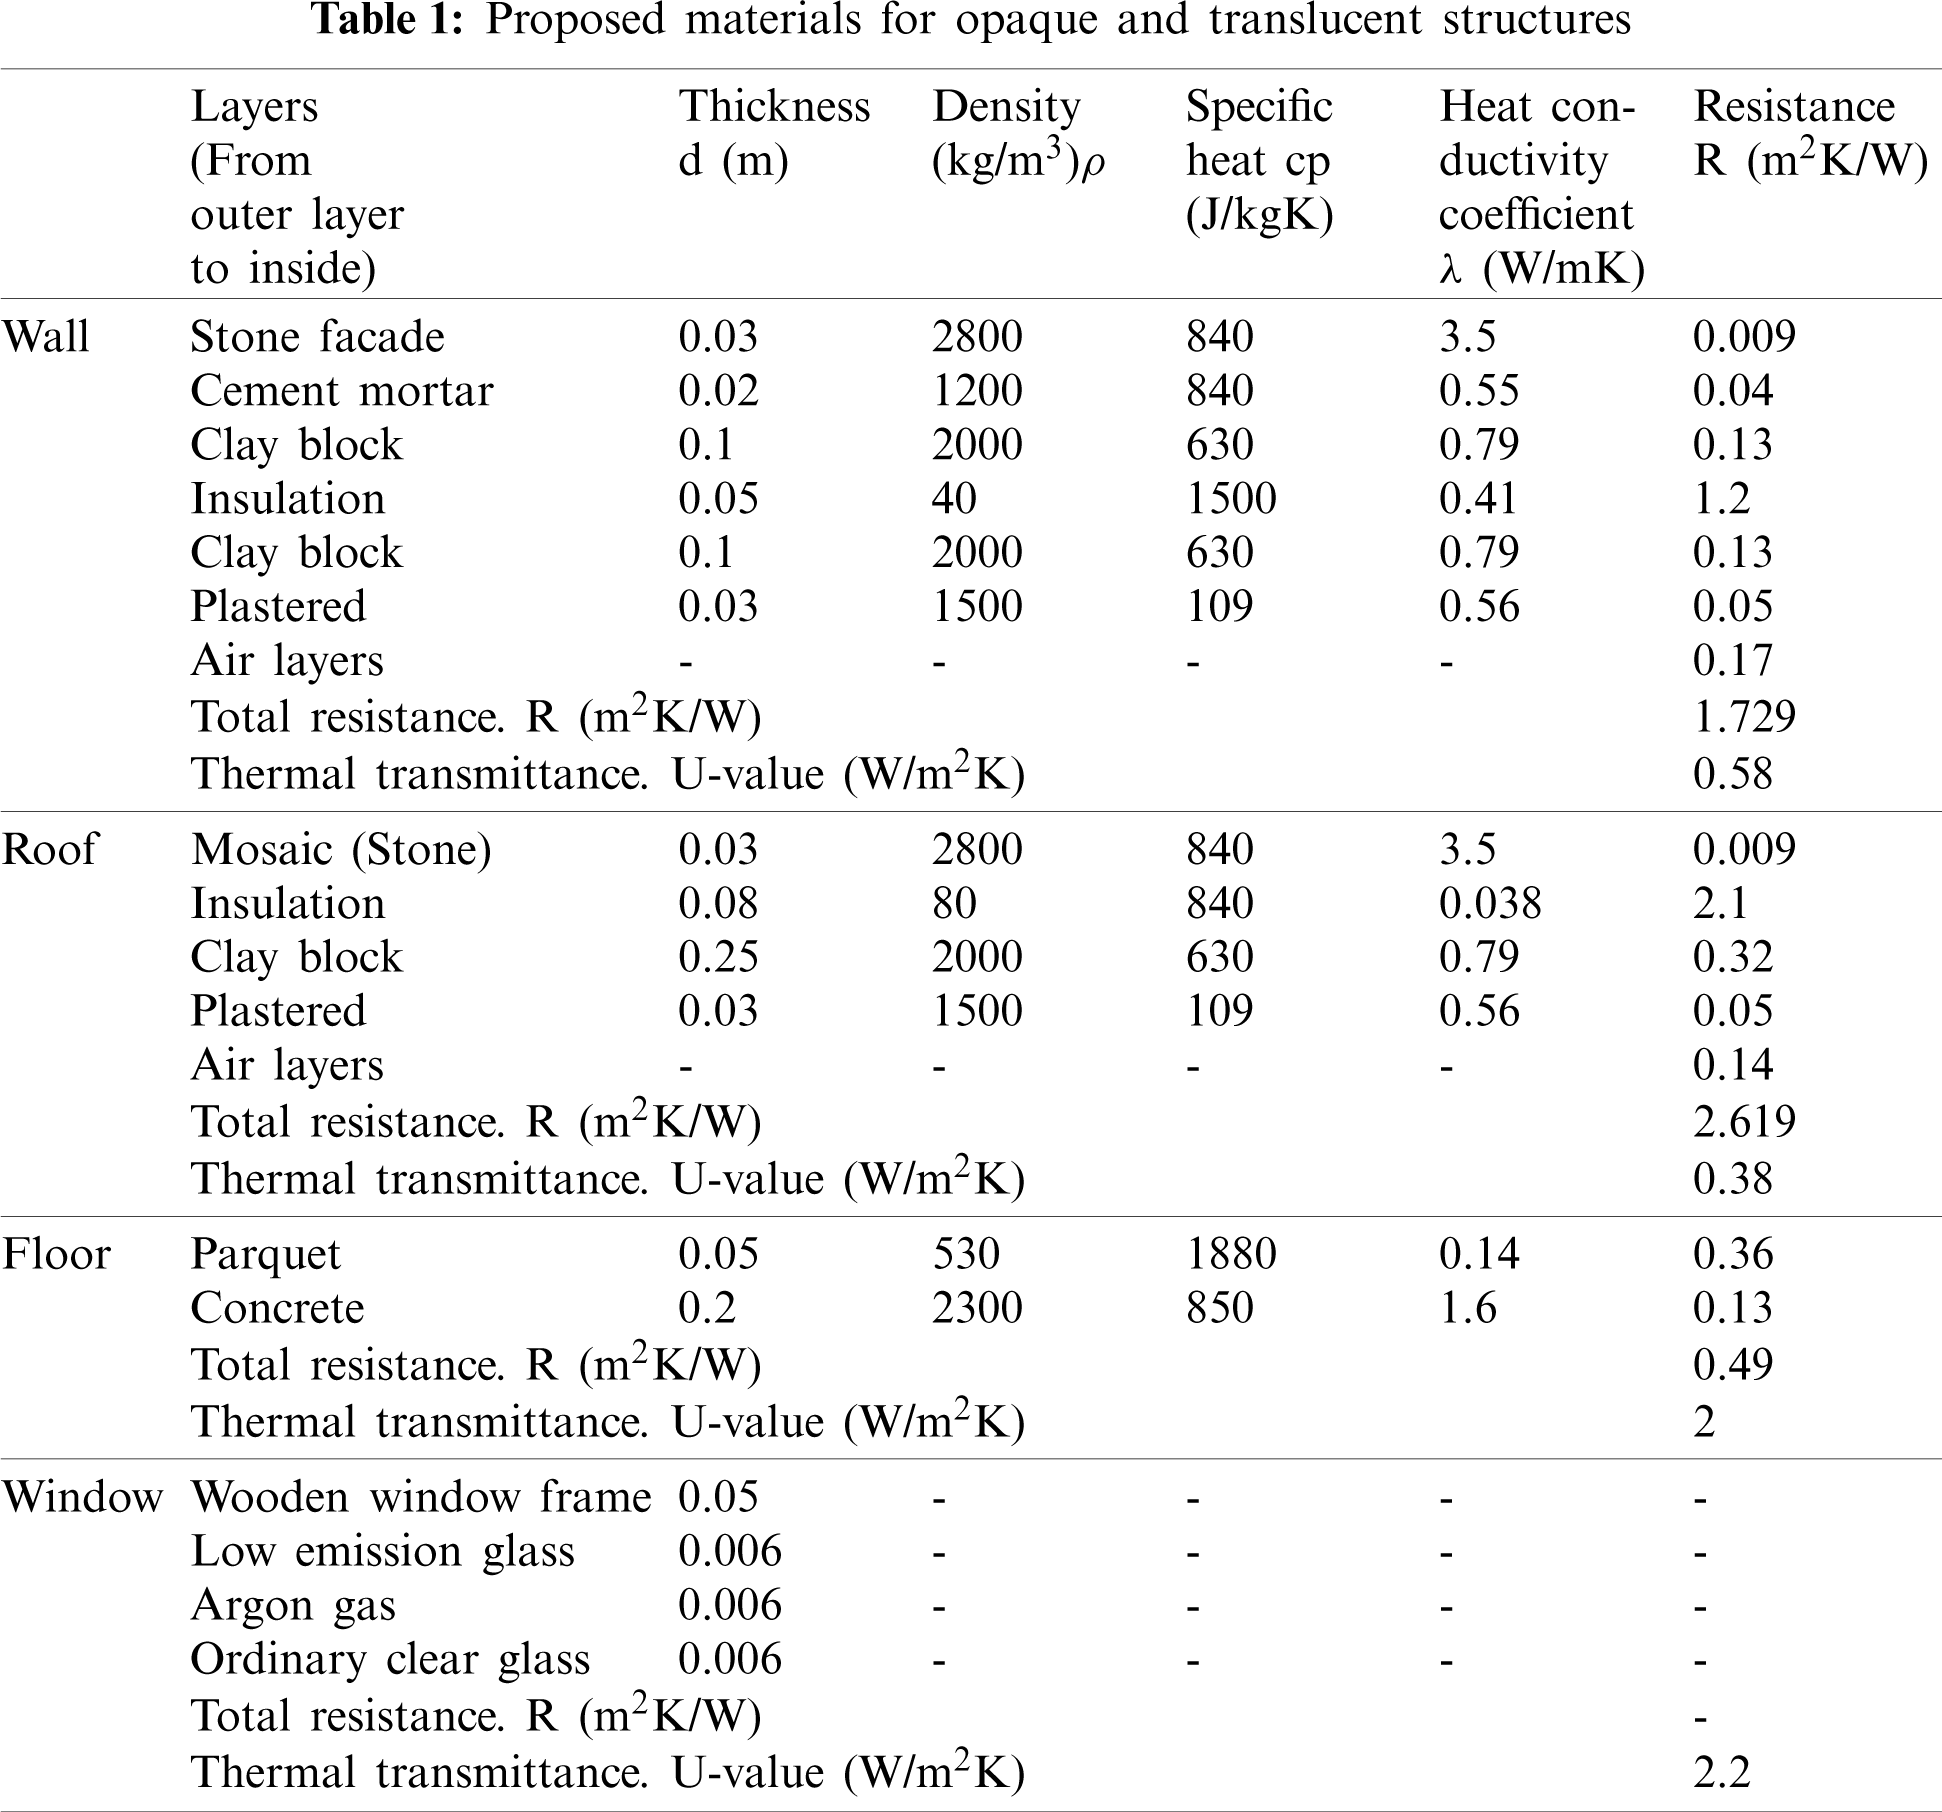
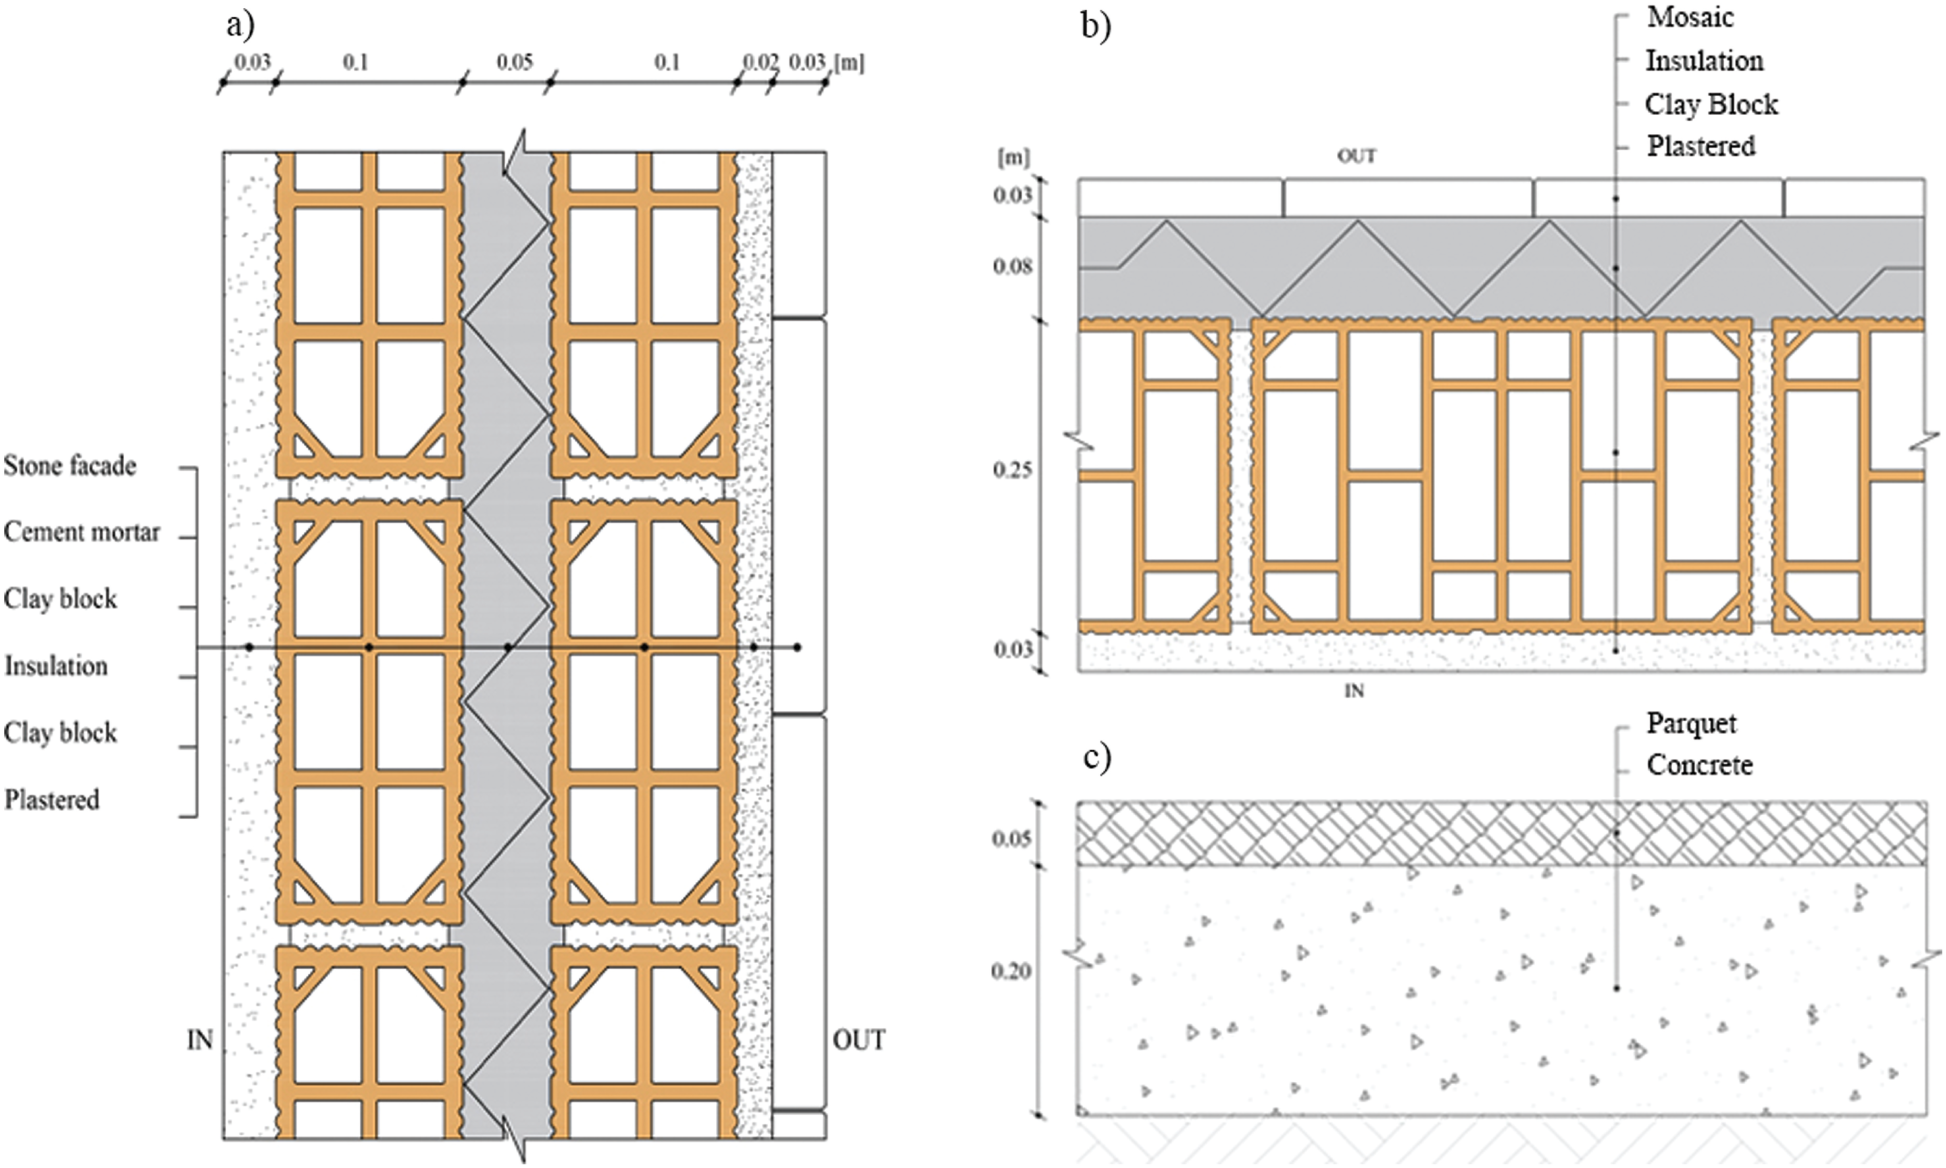
Figure 3: A schematic section of the proposed structures: (a) Walls, (b) Roof, and (c) Floor
The studied models have been simulated based on the climate data of Yazd City, which is located in the center of Iran (northern latitude: 31.880 and eastern longitude: 54.280). The EPW weather data file of Yazd city prepared by DOE has been used for the simulations. The average temperature in Yazd is about 32°C in the hottest month and 5°C in the coldest month. The average temperature is near 18°C, and the average relative humidity is near 25% [26]. Foruzanmehr [27] investigated summer-time thermal comfort in the traditional buildings of Yazd and reported a comfort-temperature range of 25°C to 30°C for the residents of vernacular buildings in Yazd.
In this study, EnergyPlus software has been used due to its accessibility, ease of use, and widespread approval [28]. EnergyPlus has been used as a software to simulate the performance of building energy efficiency in many studies [2,12,28–31]. To simplify the calculation of heat conduction through the structure of multilayer walls of the buildings and improve the efficiency of calculations in heating and cooling loads, using the conduction transfer function is recommended by ASHRAE [32].
In this research, the surface heat balance process with the conduction transfer function method (CTF) has been used to calculate the thermal loads. This method simulates all the thermal equilibria of the inside and outside surfaces as well as the transient thermal conductivity of the building in each time step [31], which has been widely used to calculate the transient thermal conductivity of buildings in many studies [32–34]. Tab. 1 shows the wall specifications. The temperature setpoint is set at 18°C, while the cooling setpoint has been considered at 26°C. Humidity setting points between 30%−60% and fraction radiant of 0.2 have been considered. Furthermore, the design level for the electric equipment is 156 W. Outputs have been reported monthly and results are reported for the hottest and coldest months of the year, besides a seasonal analysis of the average of cooling and heating loads.
Figs. 4–12 show the heating and cooling needs of the models in the hottest and coldest months of the year in kWh. Fig. 4 shows the results for Model a. The maximum cooling requirement of the model is at the window to floor area ratio of 30% with brick walls and single glazing glass (627.56 kWh). The lowest cooling need is observed at the window to floor area ratio of 7% with the recommended materials (284.93 kWh) for the opaque and translucent surfaces. The annual heating need of this model is the highest and the lowest at the window to floor area ratio of 7% with brick walls and ordinary glass (374.48 kWh) and 30% with the proposed materials (5.57 kWh), respectively.
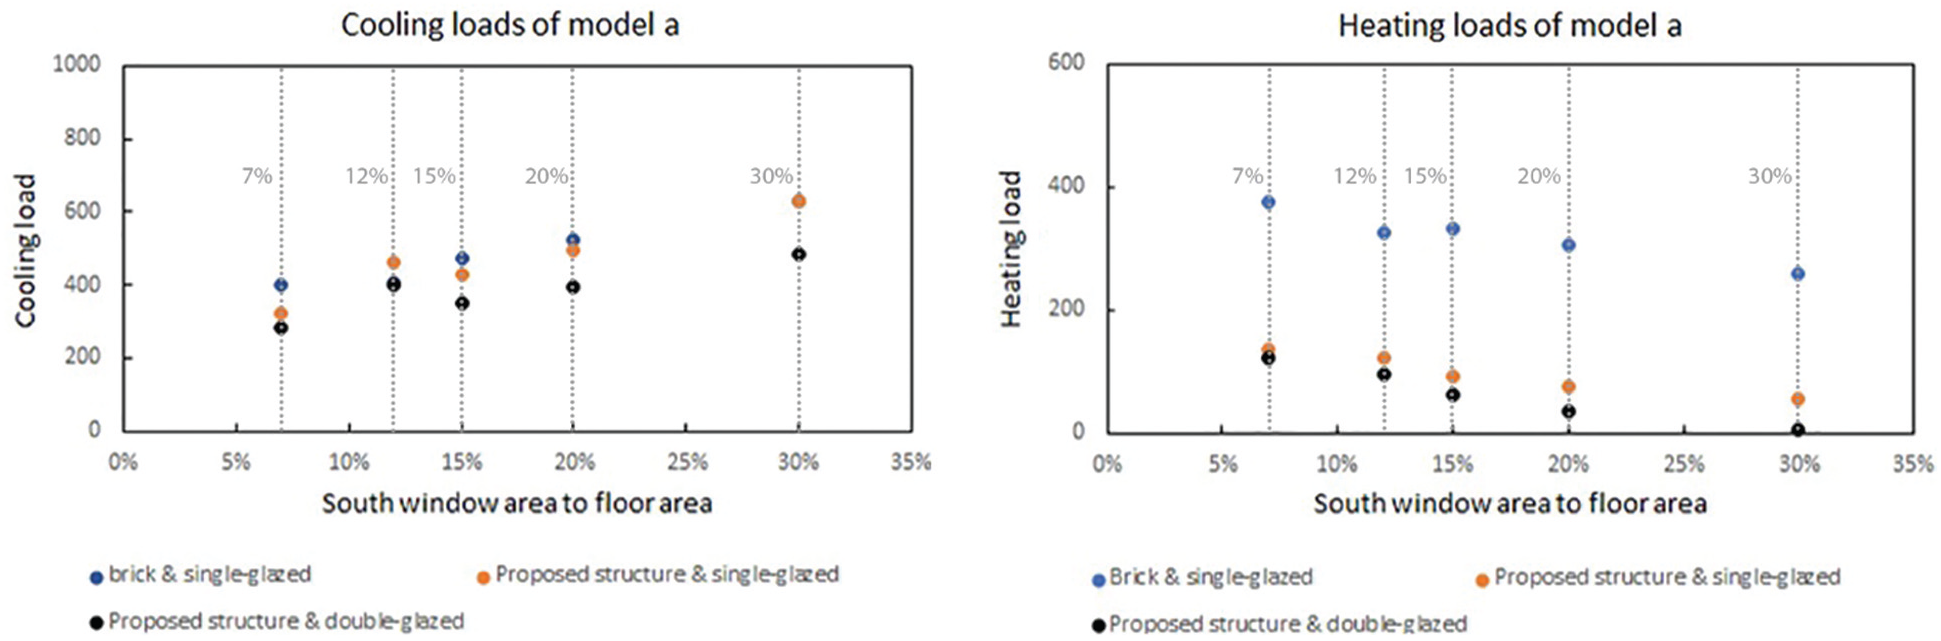
Figure 4: Cooling and heating loads of Model a (in kWh)
In Model b (Fig. 5), the highest need for cooling load is at the ratio of 30% of brick and ordinary glass walls (617.56 kWh), while the lowest demand is at 7% with the proposed materials (281.47 kWh). The heating need is the minimum at the ratio of 30% of the recommended materials (5.45 kWh) and the highest at the window ratio of 7% for brick materials (375 kWh).
Fig. 6 shows the heating and cooling loads required by Model c. The maximum cooling load (627.23 kWh) with a window ratio of 30% for a brick building and its minimum need (288.08 kWh) in a building with proposed materials and a window ratio of 7%. The window to floor ratio of 30% in the building with the recommended materials (6.6 kWh) has the lowest heating need. However, the brick building with a window ratio of 7% (385.45 kWh) provides the highest thermal requirement.
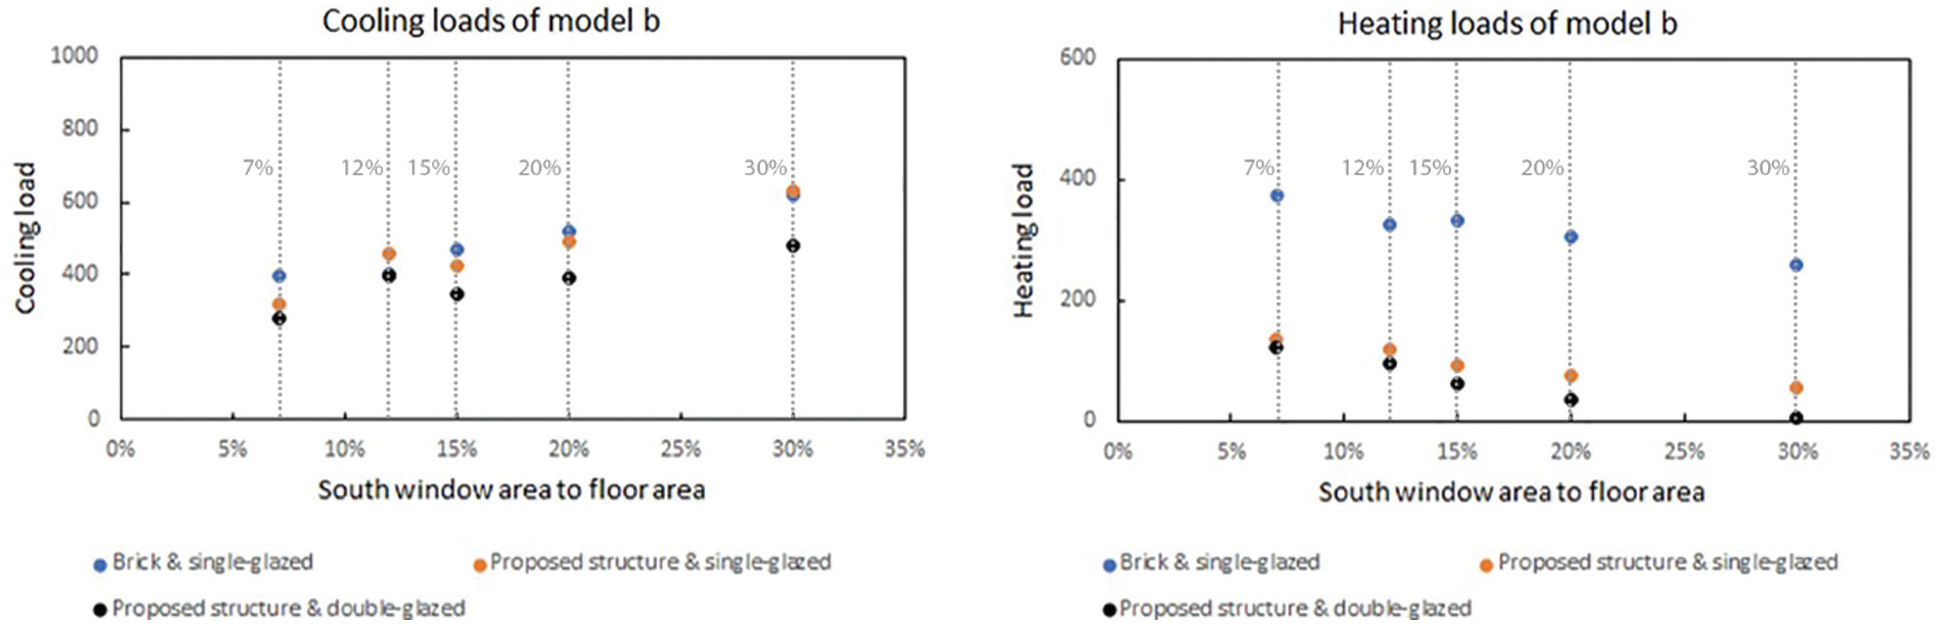
Figure 5: Cooling and heating loads of Model b (in kWh)
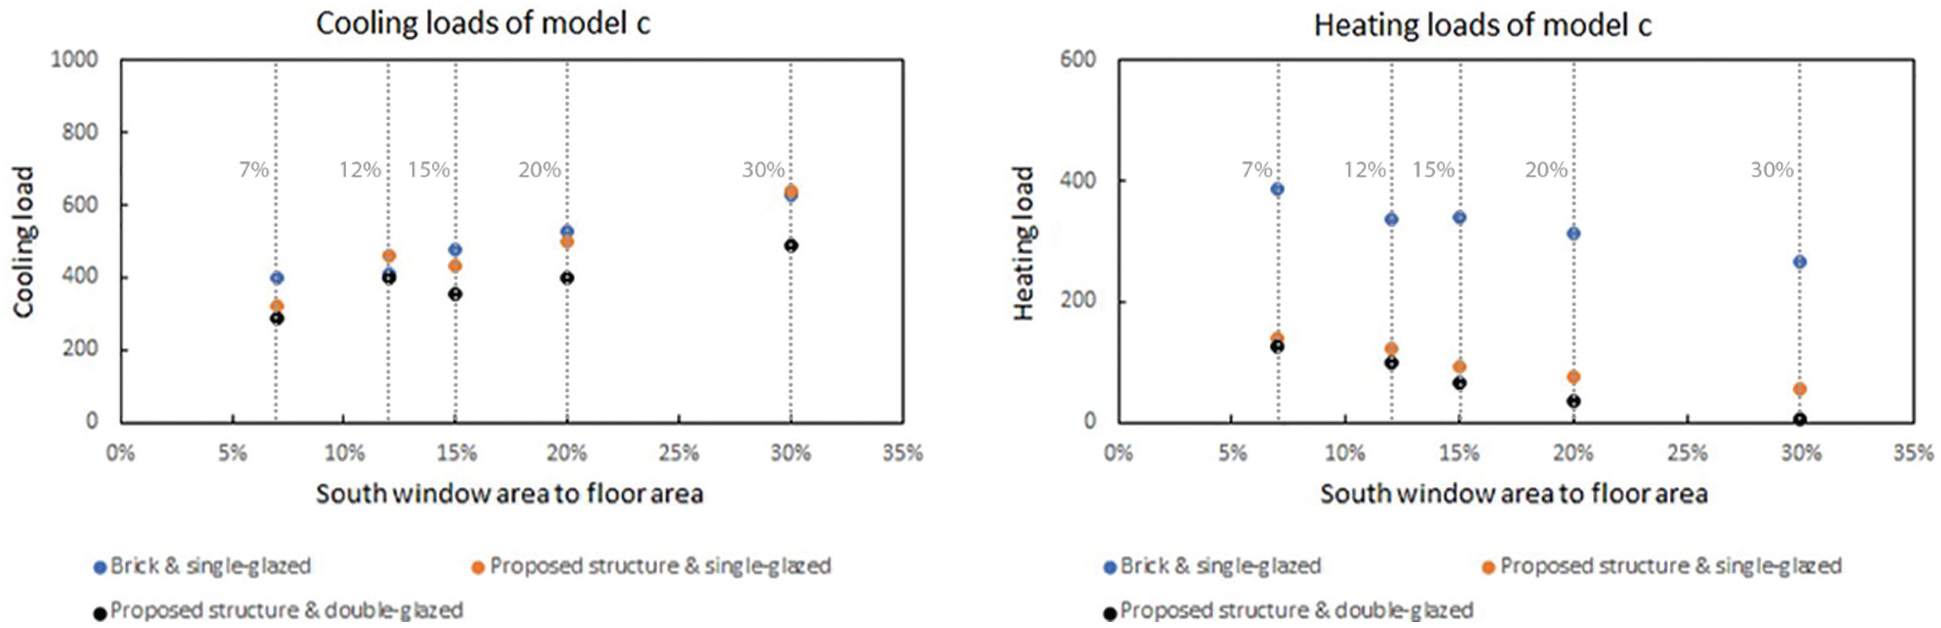
Figure 6: Cooling and heating loads of Model c (in kWh)
The heating and cooling needs of Model d have been shown in Fig. 7. In all three cases, the maximum cooling demand is at the window ratio of 30% and the lowest at 7%. The highest cooling load is for brick buildings (675.49 kWh), while the lowest is for proposed materials (323.19 kWh). The lowest heating need is observed at the ratio of 30% with the recommended materials (12.29 kWh) and the highest at 7% with the brick structure (425.67 kWh).
For Model e (Fig. 8), the highest cooling load (634.94 kWh) is at the ratio of 30% with brick walls and the lowest at the ratio of 7% with the proposed materials (300.36 kWh). The heating load is the minimum at the ratio of 30% with the recommended materials (6.2 kWh) and the highest at 7% with the brick materials (380.95 kWh).
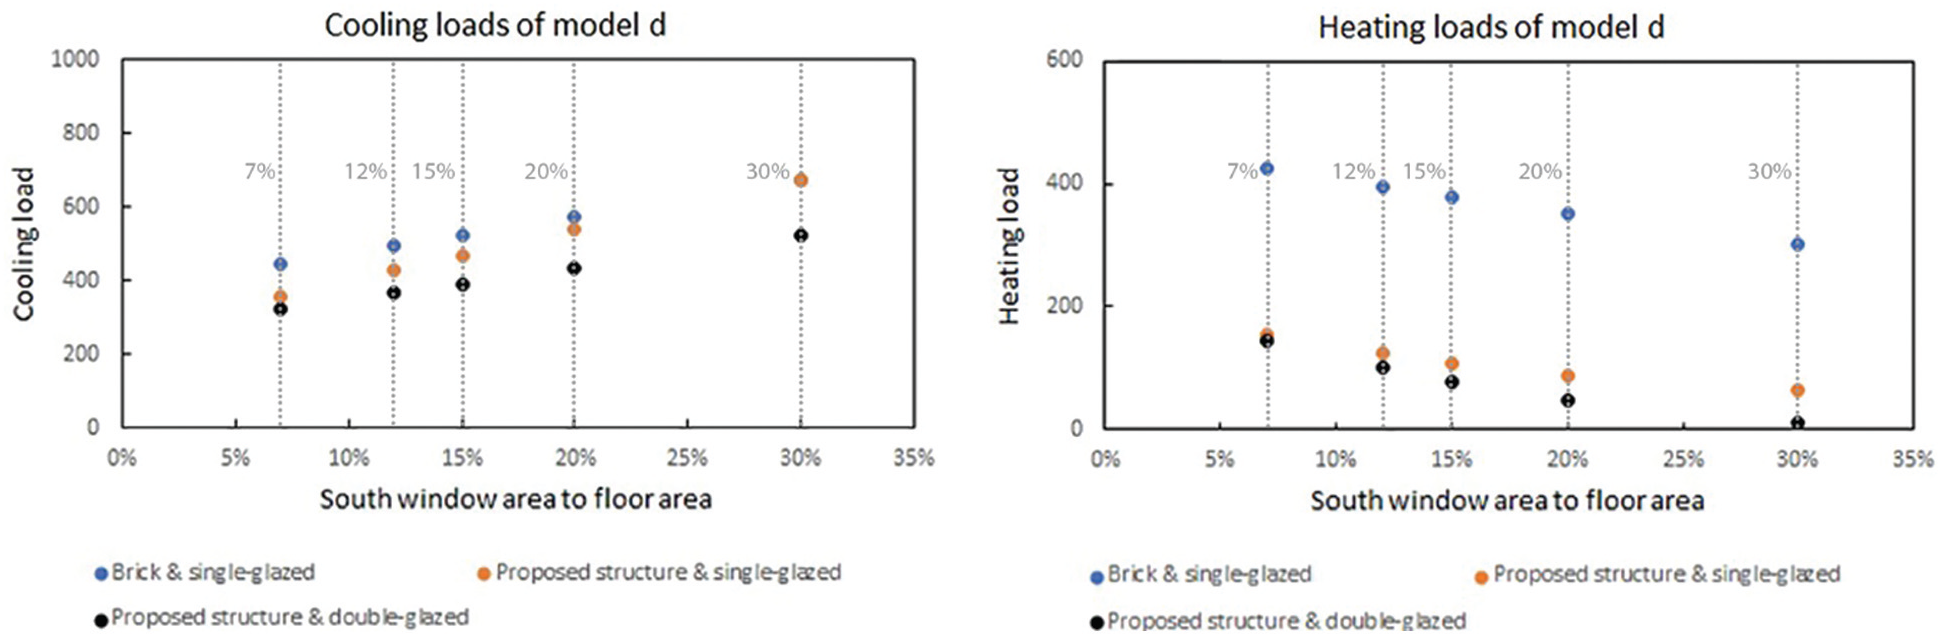
Figure 7: Cooling and heating loads of Model d (in kWh)
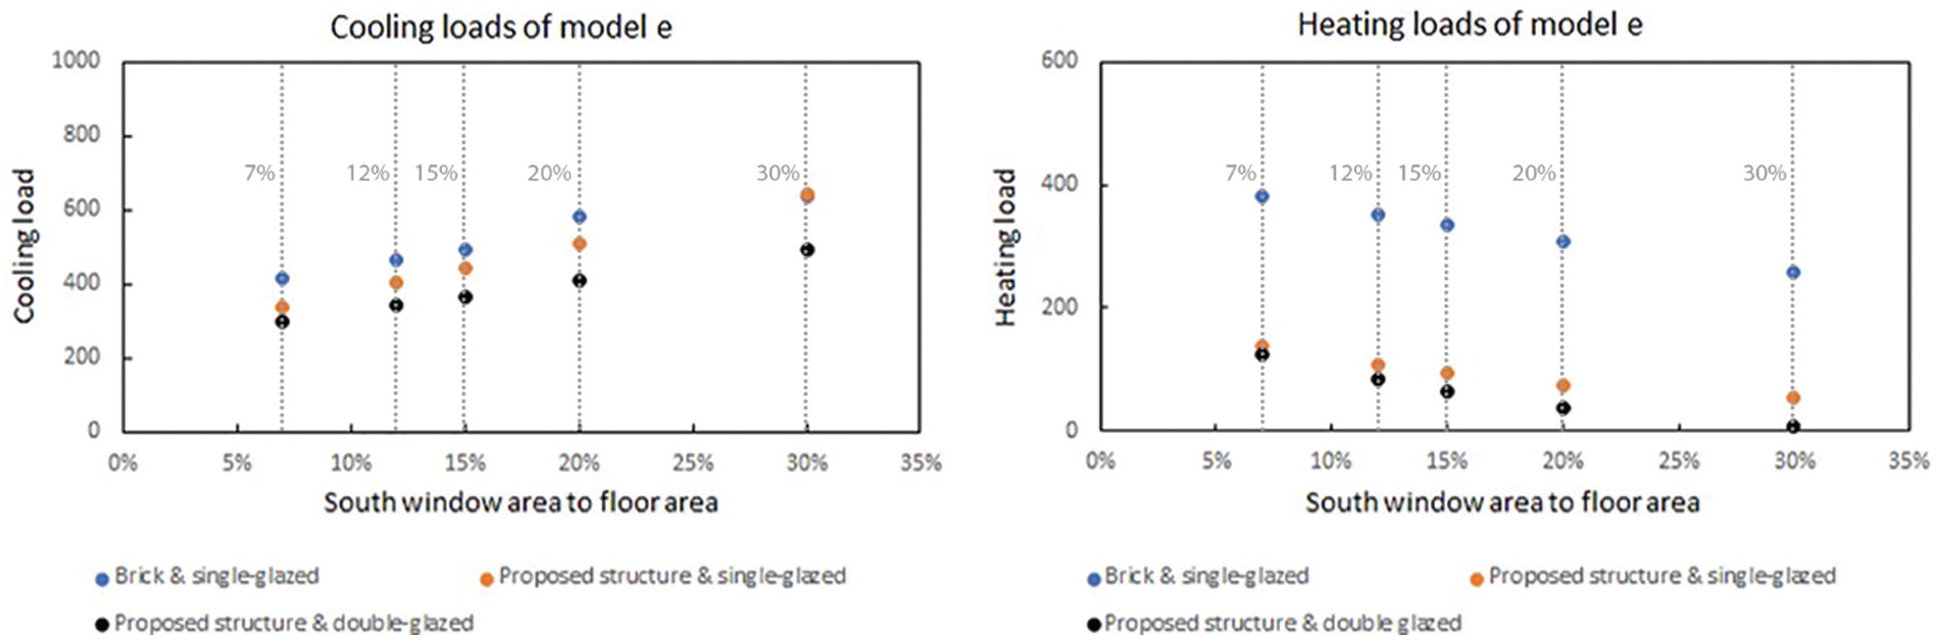
Figure 8: Cooling and heating loads of Model e (in kWh)
Fig. 9 shows the energy required by Model f. The maximum cooling load is 30% (666.9 kWh), while the minimum is 7% of the proposed materials (325.65 kWh). The highest heating need of the model is at the ratio of 7% (396.12 kWh) and the lowest at 30% (8.36 kWh).
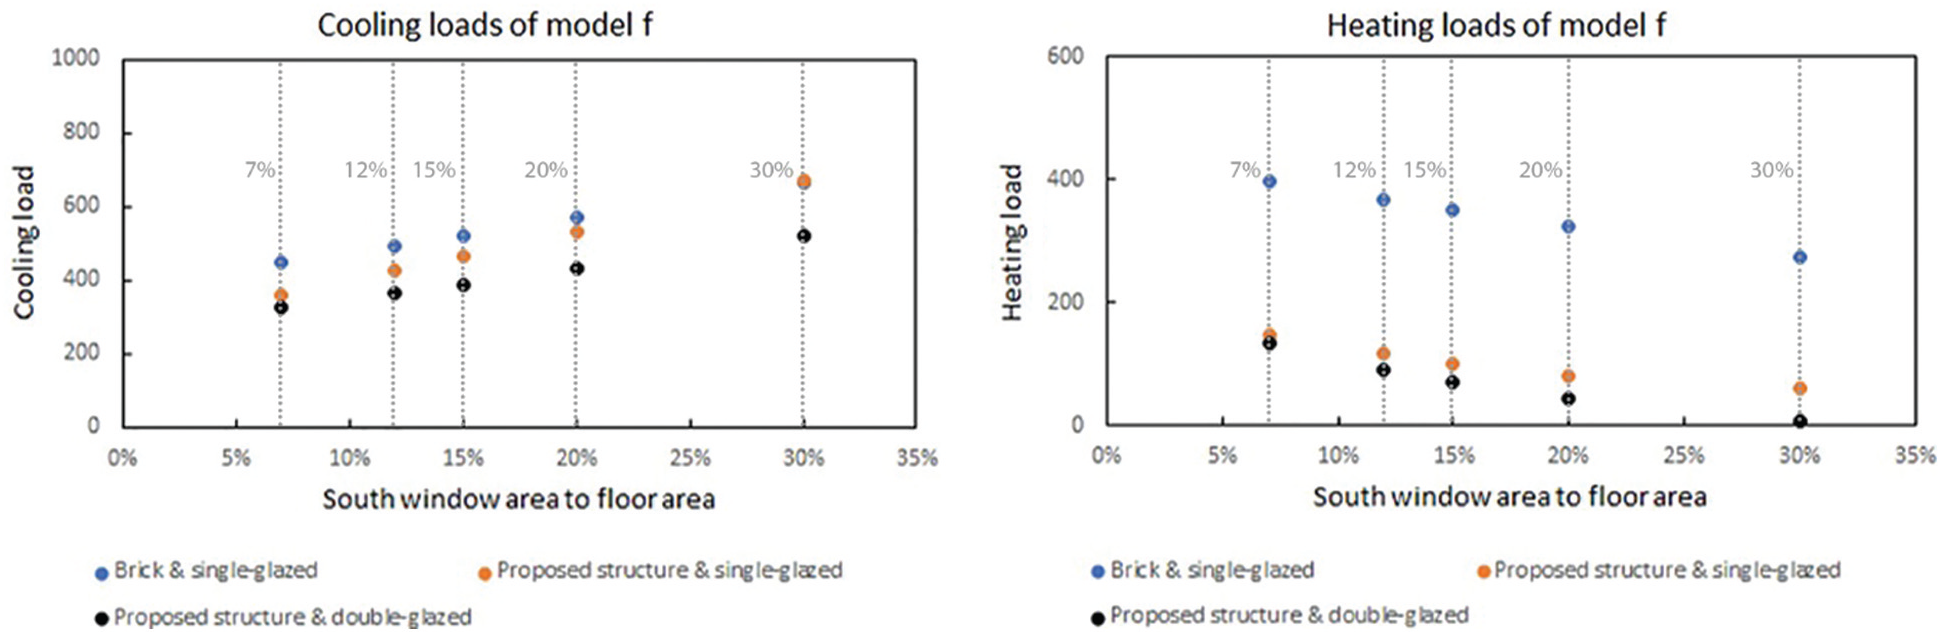
Figure 9: Cooling and heating loads of Model f (in kWh)
For model g (Fig. 10), the highest cooling load (754.28 kWh) is associated with the window ratio of 30% with brick walls, while the lowest amount is achieved with the window ratio of 7% and the proposed materials (395.87 kWh). The lowest heating load is observed at 30% with the recommended materials (17.49 kWh) and the highest at 7% with brick materials (443.48 kWh).
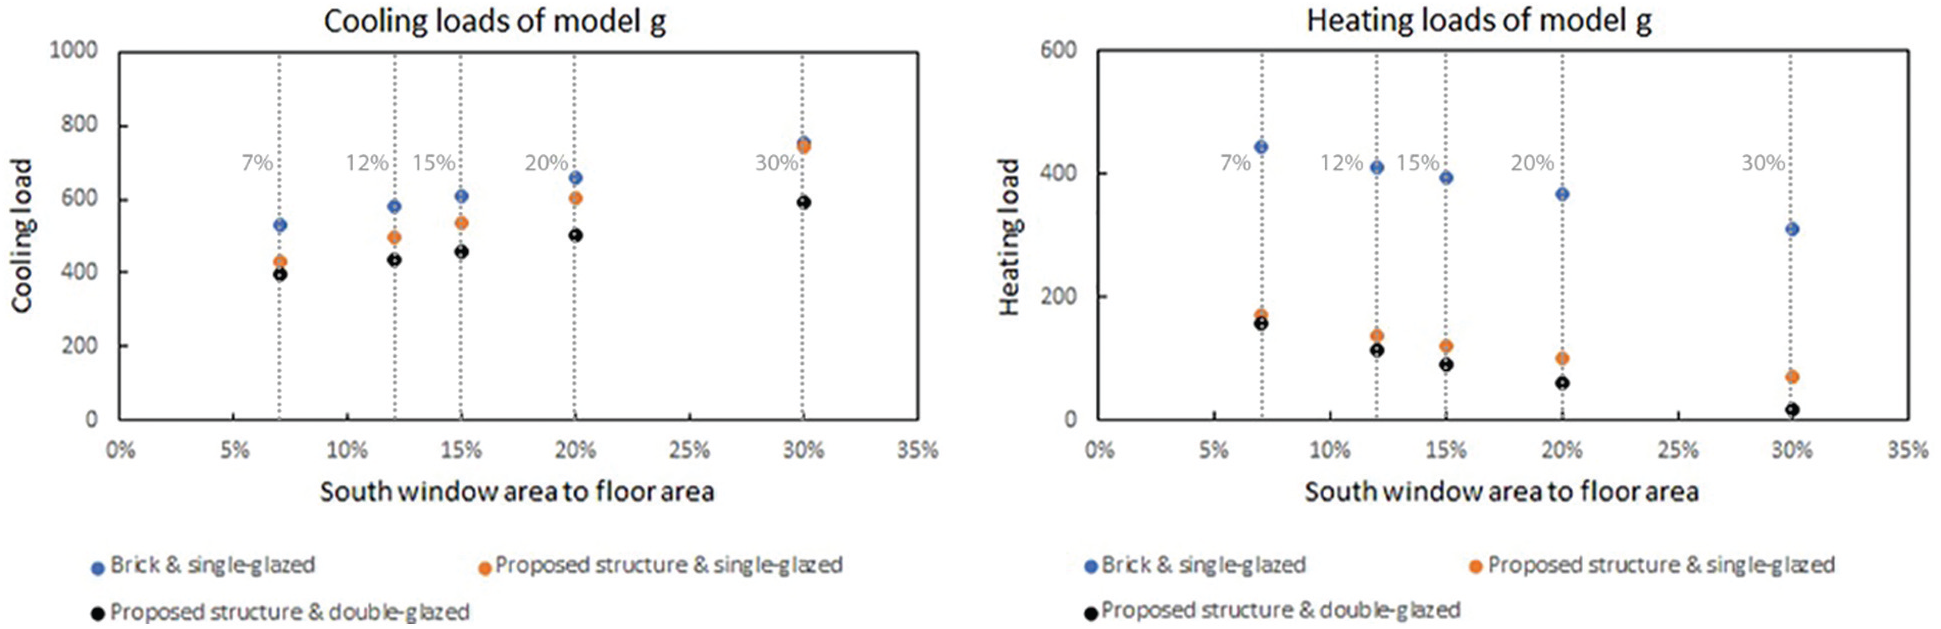
Figure 10: Cooling and heating loads of Model g (in kWh)
Fig. 11 shows the maximum and minimum cooling and heating loads of all seven models based on the structure of the walls and the ratio of window area to plan area. For the proposed and brick materials, the minimum cooling demand is observed in Model b with the window area to plan area ratio of 7% and 30%, while the maximum cooling loads are obtained for the model g with the window ratio of 7% and 30%, respectively. In addition, the maximum and minimum heating loads for brick structure are obtained for Models g and a with the window ratio of 7%, and Models g and b have the maximum and minimum heating requirements with the window ratio of 30% for the proposed material.
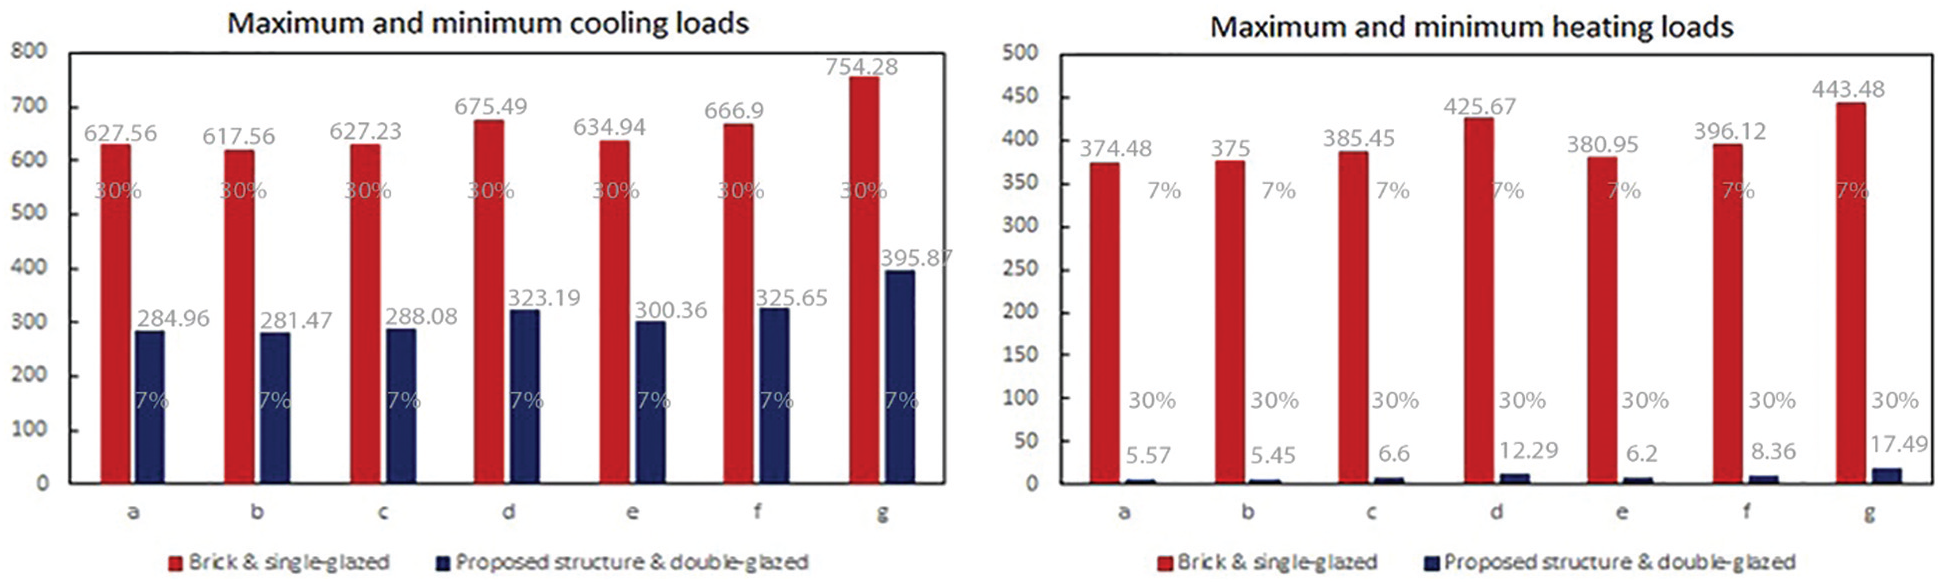
Figure 11: Maximum and minimum cooling and heating loads of seven models (in kWh)
Figs. 12a–12d show the average heating and cooling demands for all models with recommended materials in each season. In spring, the heating demands are zero, while there are cooling loads for all rooms (Fig. 12a). Fig. 12b shows requirements loads in summer, in which all rooms have zero heating needs and the most cooling loads, as predicted. Furthermore, there are cooling requirements in fall that are higher than spring loads for all models and window ratios (Fig. 12c). Winter is the only season in which the rooms need heating loads (Fig. 12d), although there are negligible heating loads in spring. In addition, Model b in the window ratio of 12% jumps and increases the heating/cooling loads in all models and seasons. Moreover, noticeable jumps are observed in Model d in all cases, which can be due to the change in the elongation and the models’ aspect ratio.
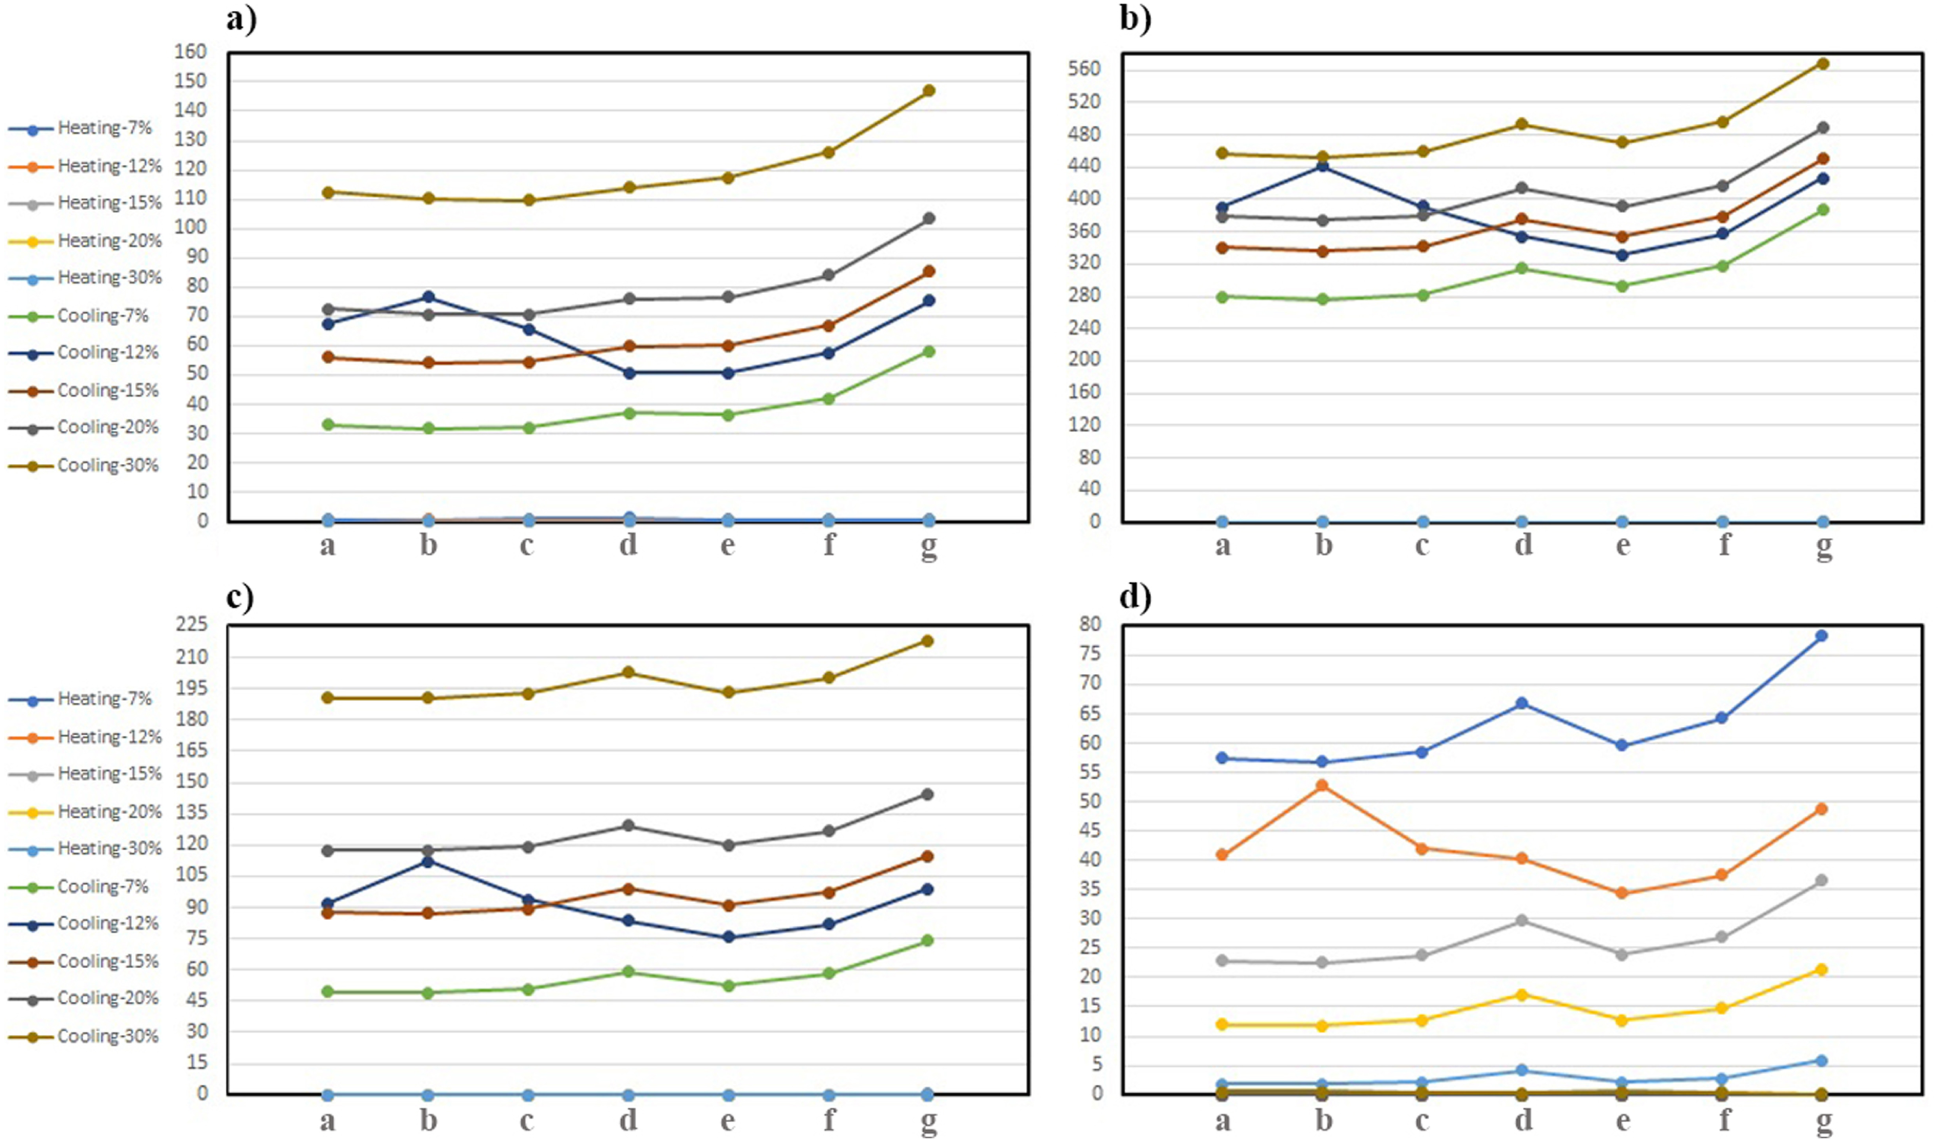
Figure 12: Seasonal average of cooling and heating loads of models in kWh: (a) Spring, (b) Summer, (c) Fall, and (d) winter
According to the simulation results of heating loads for seven models with brick materials, the lower heating demand is observed for the square plan shape (Model a). For rectangular plans, east-west elongation up to the ratio of length to width of 1.5 (close to the proportions of Model b) is better than north-south elongation. Then north-south direction with a length-width proportion of 0.72 (Model e) and then east-west with an aspect ratio of about 2 (Model c), north-south with a proportion of 0.51 (Model f), east-west with a ratio of 3.47 (Model d), and finally north-south with a ratio of 0.29 (Model g). The result of the studies by AlAnzi et al. [20], Hemsath et al. [23] indicate that the impact of the building orientation on energy performance.
Models (b, e), (c, f), and (d, g) have equal dimensions with different elongations, Models b, c, and d have east-west elongation, and Models e, f, and g have the northern-southern extension. In all cases of the ratio of window area to plan area, the east-west direction is better for heating and cooling loads.
The aspect ratio, which is the proportional relationship between the length and width of the building, affects the energy consumption of the building. The thermal performance of Models a and b is very close to each other, but considering the cooling loads, Model b (length to width ratio of 1.38) is more appropriate, which indicates the appropriate dimensions and direction of the selected room. The ratio of 1:1, which represents the square form, has a favorable performance in reducing heating loads in rectangular plans. These results are in line with Ferdous [22] which reported the most compact form has the least total energy use.
By insulating opaque walls (using the structure of Tab. 1) and maintaining single-glazed glass, the heating-cooling loads in the best case (Model b) have been reduced by about 81.37% and 8.33%, respectively. As a result, opaque glazing insulation has a significant effect on space heating loads. Also, by adding double-glazed glass to the proposed structure, the heating and cooling loads compared to brick and single-glazed buildings have been reduced by about 97.89% and 18.57%, respectively. The use of materials with a low heat transfer coefficient in opaque and translucent walls reduces the need for heating and cooling loads and leads to energy saving.
In all models, at the south window surface to the floor ratio of 7%, we have the maximum heating requirement and the minimum cooling need. This ratio is useful for designing rooms that have only summer use. Although maximum and minimum heating and cooling loads in each model in brick buildings are associated with the ratios of 30% and 7%, the window area to floor area ratio of 12% has the best performance in terms of adjusting the annual weather conditions and providing thermal comfort for residents. While in insulated buildings (with single-glazed or double-glazed windows), the more appropriate south window area to floor area ratio is 15%.
The porosity of the south wall (Window-to-Wall Ratio) in the selected room with window ratios of 12% and 15% is about 17% and 21%, respectively. Therefore, the amount of cooling demands increases, and the heating needs decrease, which in line with the result of the Ourghi et al. [21].
In all models, the windows facing south due to the importance of receiving light from the south. The east-west elongation allows for a larger opening surface and adequate direct sunlight, which is in line with Depecker et al. [13]. In traditional buildings of the hot and dry climate of Iran, the whole building gradually collects and stores radiation energy during the day, and at night when there is no solar radiation, the thermal mass plays a key role in the efficient performance of the building in direct reception. Orientation of the most traditional houses in the Central Plateau of Iran is north-south to reduce solar gain. However, the winter section has an east-west extension to gain maximum sunlight on the cold days of the year.
Walls with thermal insulation reduce heat transfer from the outer envelope of the building, which significantly reduces the energy need of the building. Reducing the need for heating and cooling loads in the case of thermal insulation indicates the superiority of insulation over the time lag of traditional materials in this climate.
According to Fig. 12, there are cooling needs in three seasons of the year. However, the heating need only is in one season. The maximum cooling load in summer compared to spring and autumn has increased by about 287% and 160%, respectively. Almost in all cases, room b requires less cooling load, except at the ratio of 12%, where the cooling requirement is surprisingly high. Except for the window ratio of 12%, model g has the highest cooling/heating demands in all studied rooms, which indicates that the north-south stretch of the plan with an aspect ratio of 0.29 is not favorable for this climate. For each studied model, the window area to floor area ratio of 30% and 7% are the highest and lowest cooling requirements, respectively. While for heating needs these ratios are reversed.
According to the fourth National Building Regulations of Iran, in residential spaces, the suggested ratio of window area to floor area is 1:7 and 1:8, which based on the floor area of the studied rooms is about 14% to 12% of the window area to the floor area ratio. Therefore, a window-to-floor ratio of 1:7 is more appropriate. During the warm days, a window ratio of 7% has the minimum cooling requirements, while in cold days the 30% window ratio is optimum. However, for the whole year, the ratio of window area to the floor of 15% is optimal and has a more stable behavior than the window ratio of 12%.
The lack of variety of winter living rooms in traditional houses of the Central Plateau of Iran is one of the limitations of the research. Due to the lack of access to a comprehensive and valid system for the traditional Iranian houses, data collection has faced difficulties and necessitates the need for fieldwork.
This study looked at the impact of the room's plan shape, window area, and the effect of materials on the thermal needs of the building in the hot and arid climate of Iran, Yazd City. This study considered the south-facing rooms as it is the best orientation to receive solar radiation in Iran. The results show that it is more beneficial to have rectangular plans with an aspect ratio of about 1.38 in an east-west direction and a window to floor area ratio close to 15%. The results reveal that using a double-glazed window can significantly improve the thermal loads of the models, with the same materials, compared to the single-glazed window. In plans with east-west elongation, with a ratio of length to width (depth of the room) around 1–2, the heat requirement is less than the elongation of the north-south plans. By reducing the length to width ratio (less than 0.7) in the north-south plans, the cooling/heating load increases significantly. Furthermore, a window-to-floor ratio of 1:7 is more appropriate than a ratio of 1:8 in terms of reducing building thermal demands. The present paper can be considered as an architectural solution to achieve minimum heating/cooling loads in the design of residential buildings in Yazd to improve the building energy performance. The effect of shading devices and more structures can be investigated in future research. The main aspect of any external shading system is the control of solar radiation, which reduces unwanted heat for the users of the space, and the use of advanced building materials may be a solution to improve the thermal comfort of residents and reduce energy demand in the building. The present study is only for the hot and dry climate of Iran and other ratios between window and plan area can be considered in different climates.
Acknowledgement: The authors would like to thank Dr. Hossein Bagheri for his help and guidance in writing the structure of this article.
Funding Statement: The authors received no specific funding for this study.
Conflicts of Interest: The authors declare that they have no conflicts of interest to report regarding the present study.
1. Garcıa, Y., Cuadrado, J., Blanco, J. M., Roji, E. (2018). Optimizing the indoor thermal behaviour of housing units in hot humid climates: Analysis and modelling of sustainable constructive alternatives. Indoor and Built Environment, 28(6), 772–789. DOI 10.1177/1420326X18793965. [Google Scholar] [CrossRef]
2. Solmaz, A. S., Halicioglu, F. H., Gunhan, S. (2016). An approach for making optimal decisions in building energy efficiency retrofit projects. Indoor and Built Environment, 27(3), 348–368. DOI 10.1177/1420326X16674764. [Google Scholar] [CrossRef]
3. Morales, M. P., Juarez, M. C. (2015). Influence of large and highly perforated fired-clay bricks in the improvement of the equivalent thermal transmittance of single-leaf masonry walls. Eco-efficient masonry bricks and blocks. UK: Woodhead Publishing. [Google Scholar]
4. Hossain, M. U., Meng, L., Farzana, S., Thengolose, A. L. (2013). Estimation and prediction of residential building energy consumption in rural areas of chongqing. International Journal of Engineering Transactions C: Aspects, 26(9), 955–962. DOI 10.5829/idosi.ije.2013.26.09c.03. [Google Scholar] [CrossRef]
5. Halawa, E., Ghaffarianhosein, A., Ghaffarianhoseini, A., Trombley, J., Hassan, N. et al. (2018). A review on energy conscious designs of building façades in hot and humid climates: Lessons for (and from) Kuala Lumpur and darwin. Renewable and Sustainable Energy Reviews, 82(3), 2147–2161. DOI 10.1016/j.rser.2017.08.061. [Google Scholar] [CrossRef]
6. Nematchoua, M. K., Orosa, J. A. (2016). Building construction materials effect in tropical wet and cold climates: A case study of office buildings in Cameroon. Case Studies in Thermal Engineering, 7, 55–65. DOI 10.1016/j.csite.2016.01.007. [Google Scholar] [CrossRef]
7. Latha, P. K., Darshan, Y., Venugopal, V. (2015). Role of building material in thermal comfort in tropical climates-a review. Journal of Building Engineering, 3, 104–113. DOI 10.1016/j.jobe.2015.06.003. [Google Scholar] [CrossRef]
8. Jadidi, A. M., Jadidi, M. (2018). An algorithm based on predicting the interface in phase change materials. International Journal of Engineering Transactions B: Applications, 31(5), 799–804. DOI 10.5829/ije.2018.31.05b.15. [Google Scholar] [CrossRef]
9. Yang, L., Lam, J. C., Tsang, C. L. (2008). Energy performance of building envelopes in different climate zones in China. Applied Energy, 85(9), 800–817. DOI 10.1016/j.apenergy.2007.11.002. [Google Scholar] [CrossRef]
10. AlizadehKharazi, B., Alvanchi, A., Taghaddos, H. (2020). A novel building information modeling-based method for improving cost and energy performance of the building envelope. International Journal of Engineering Transactions B: Applications, 33(11), 2162–2173. DOI 10.5829/ije.2020.33.11b.06. [Google Scholar] [CrossRef]
11. Aldawoud, A. (2015). The influence of the atrium geometry on the building energy performance. Energy and Buildings, 57, 1–5. DOI 10.1016/j.enbuild.2012.10.038. [Google Scholar] [CrossRef]
12. Rizi, R. A., Eltaweel, A. (2021). A user detective adaptive facade towards improving visual and thermal comfort. Journal of Building Engineering, 33, 101554. DOI 10.1016/j.jobe.2020.101554. [Google Scholar] [CrossRef]
13. Depecker, P., Menezo, C., Virgone, J., Lepers, S. (2001). Design of buildings shape and energetic consumption. Building and Environment, 36(5), 627–635. DOI 10.1016/S0360-1323(00)00044-5. [Google Scholar] [CrossRef]
14. Rashdi, W. M., Embi, M. R. (2016). Optimum building form in relation to lower cooling load. Procedia-Social and Behavioral Sciences, 222, 782–790. DOI 10.1016/j.sbspro.2016.05.161. [Google Scholar] [CrossRef]
15. Raji, B., Tenpierik, M. J., Dobbelsteen, A. (2017). Early-stage design considerations for the energy-efficiency of high-rise office buildings. Sustainability, 9(4), 623. DOI 10.3390/su9040623. [Google Scholar] [CrossRef]
16. Pessenlehner, W., Mahdavi, A. (2003). Building morphology, transparence, and energy performance. Building Simulation, 8, 1025–1032. Eindhoven, Netherlands. https://citeseerx.ist.psu.edu/viewdoc/download?doi=10.1.1.532.6600&rep=rep1&type=pdf. [Google Scholar]
17. Wang, W., Rivard, H., Zmeureanu, R. (2006). Floor shape optimization for green building design. Advanced Engineering Informatics, 20(4), 363–378. DOI 10.1016/j.aei.2006.07.001. [Google Scholar] [CrossRef]
18. Catalina, T., Virgone, J., Iordache, V. (2012). Study on the impact of the building form on the energy consumption. 12th Conference of International Building Performance Simulation Association, Sydney. [Google Scholar]
19. Pacheco, R., Ordonez, J., Martinez, G. (2012). Energy efficient design of building: A review. Renewable and Sustainable Energy Reviews, 16(6), 3559–3573. DOI 10.1016/j.rser.2012.03.045. [Google Scholar] [CrossRef]
20. AlAnzi, A., Seo, D., Krarti, M. (2009). Impact of building shape on thermal performance of office buildings in Kuwait. Energy Conversion and Management, 50(3), 822–828. DOI 10.1016/j.enconman.2008.09.033. [Google Scholar] [CrossRef]
21. Ourghi, R., AlAnzi, A., Krarti, D. (2007). A simplified analysis method to predict the impact of shape on annual energy use for office buildings. Energy Conversion and Management, 48(1), 300–305. DOI 10.1016/j.enconman.2006.04.011. [Google Scholar] [CrossRef]
22. Ferdous, T. (2012). Determining the effect of building geometry on energy use patterns of office developments (A Major Research Project). Ryerson University, Canada. [Google Scholar]
23. Hemsath, T. L., Alagheband Bandhosseini, K. (2015). Sensitivity analysis evaluating basic building geometry's effect on energy use. Renewable Energy, 76, 526–538. DOI 10.1016/j.renene.2014.11.044. [Google Scholar] [CrossRef]
24. Kheiri, F. (2018). A review on optimization methods applied in energy-efficient building geometry and envelope design. Renewable and Sustainable Energy Reviews, 92, 897–920. DOI 10.1016/j.rser.2018.04.080. [Google Scholar] [CrossRef]
25. Willoughby, J. (2003). Insulation. Plant engineer's reference book. UK: Butterworth-Heinemann. [Google Scholar]
26. Asadi, S., Fakhari, M., Sendi, M. (2016). A study on the thermal behavior of traditional residential buildings: Rasoulian house case study. Building Engineering, 7, 334–342. DOI 10.1016/j.jobe.2016.07.012. [Google Scholar] [CrossRef]
27. Foruzanmehr, A. (2012). Summer-time thermal comfort in vernacular earth dwellings in Yazd, Iran. International Journal of Sustainable Design, 9(1), 46–63. DOI 10.1504/IJSDES.2012.051479. [Google Scholar] [CrossRef]
28. Simon, F., Ordonez, J., Girard, A., Parrado, C. (2018). Modelling energy use in residential buildings: How design decisions influence final energy performance in various Chilean climates. Indoor and Built Environment, 28(4), 533–551. DOI 10.1177/1420326X18792661. [Google Scholar] [CrossRef]
29. Seyedzadeh, S., Rahimian, F. P., Oliver, S., Glesk, I., Kumar, B. (2020). Data driven model improved by multi-objective optimisation for prediction of building energy loads. Automation in Construction, 116, 103188. DOI 10.1016/j.autcon.2020.103188. [Google Scholar] [CrossRef]
30. Tabadkani, A., Tsangrassoulis, A., Roetzel, A., Li, H. X. (2020). Innovative control approaches to assess energy implications of adaptive facades based on simulation using EnergyPlus. Solar Energy, 206, 256–268. DOI 10.1016/j.solener.2020.05.087. [Google Scholar] [CrossRef]
31. Carlos, J. S. (2015). Simulation of the influence of an attic on the building energy efficiency in the Portuguese climate. Indoor and Built Environment, 25(4), 674–690. DOI 10.1177/1420326X15573846. [Google Scholar] [CrossRef]
32. Sassine, E., Younsi, Z., Cherif, Y., Antczak, E. (2017). Thermal performance evaluation of a massive brick wall under real weather conditions via the conduction transfer function method. Case Studies in Construction Materials, 7, 56–65. DOI 10.1016/j.cscm.2017.04.003. [Google Scholar] [CrossRef]
33. Mazzarella, L., Pasini, M. (2015). CTF vs. FD based numerical methods: Accuracy, stability and computational time's comparison. Energy Procedia, 78, 2620–2625. DOI 10.1016/j.egypro.2015.11.324. [Google Scholar] [CrossRef]
34. Xu, X., Wang, S. (2008). A simplified dynamic model for existing buildings using CTF and thermal network models. International Journal of Thermal Sciences, 47(9), 1249–1262. DOI 10.1016/j.ijthermalsci.2007.10.011. [Google Scholar] [CrossRef]
 | This work is licensed under a Creative Commons Attribution 4.0 International License, which permits unrestricted use, distribution, and reproduction in any medium, provided the original work is properly cited. |