| Energy Engineering |
DOI: 10.32604/EE.2021.016798
ARTICLE
Effect of Dust and Shadow on Performance of Solar Photovoltaic Modules: Experimental Analysis
1School of Electrical and Electronics Engineering, SASTRA Deemed University, Tamilnadu, 613401, India
2Department of Electrical and Electronics Engineering, Srinivasa Ramanujan Centre, SASTRA Deemed University, Tamilnadu, 612001, India
3Faculty of Mechanical and Automotive Engineering Technology, Universiti Malaysia Pahang, Pahang, 26600, Malaysia
4Centre for Automotive Engineering, Universiti Malaysia Pahang, Pahang, 26600, Malaysia
5Energy Centre, Maulana Azad National Institute of Technology, Bhopal, 462003, India
*Corresponding Author: Chinnayan Karuppaiyah Sundarabalan. Email: cksbalan@eee.sastra.edu
Received: 27 March 2021; Accepted: 23 July 2021
Abstract: This study presents an experimental performance of a solar photovoltaic module under clean, dust, and shadow conditions. It is found that there is a significant decrease in electrical power produced (40% in the case of dust panels and 80% in the case of shadow panels) and a decrease in efficiency of around 6% in the case with dust and 9% in the case with the shadow, as compared to the clean panel. From the results, it is clear that there is a substantial effect of a partial shadow than dust on the performance of the solar panel. This is due to the more obstruction of the sunlight by the shadowed area compared to the dust. The dust being finer particles for the given local experimental condition did not influence the panel than the shadow. The main outcome of this study is that the shadowing effect may cause more harm to the PV module than dust for the given experimental conditions. However, Further long-term studies on the effect of dust and shadow are needed to understand the effect on performance degradation and module life.
Keywords: Shadow; dust; soiling; PV module; PV performance
Nowadays, the energy-term has become a key aspect all over the world for everything. This involves the sustainable use of resources. Because the current (I)–voltage (V) and power (P)–voltage (V) characteristics are extremely non-linear, estimating the efficiency of a PV system is one of the most difficult challenges when considering commercial uses of photovoltaic (PV) systems [1]. Parameters for creating photovoltaic models using observed voltage-current characteristics are critical for photovoltaic-based system simulation, control, and assessment [2]. Though PV systems are known to be maintenance-free, the system's performance must be evaluated regularly to ensure maximum PV power consumption and to decrease the influence of shade and PV module orientation on the output power [3,4]. Precise forecasting of P--V characteristics, V--I features, open-circuit voltage, short circuit current, and maximum power point (MPP) for varied temperature and solar irradiation conditions has lately become extremely important [5,6]. Premkumar et al. provided a detailed analysis and assessment of interconnected photovoltaic (PV) modules under different shading conditions and various shading patterns [7]. Solar PV research has been classified into three generations according to the developments made in PV cells, from crystalline PV cells to thin films and later to dye-sensitized PV cells [8]. There have been several studies on solar PV applications in the area of stand-alone photovoltaic systems (SAPV) [9–12], building integrated photovoltaic systems (BIPV) [12–15] and performance analysis [16–20]. This paper is divided into three sections. Section 2 discusses the literature review of the current work; Section 3 discusses the experimental methodology, and Section 4 discusses the results of the current research.
The accumulation of dust on the surface of a photovoltaic module decreases the radiation reaching the solar cell and produces losses in the generated power [21]. Dust reduces the radiation available for the photovoltaic conversion on the solar cell and increases the energy loss of the system. Accumulation of dirt or dust particles on the solar photovoltaic panel surface, such as dust, water, and sand, block or hinder light energy from entering the solar cells [22]. It is a major problem since the materials for light obstruction pose as external resistances which reduce solar photovoltaic efficiency [23]. The dust will surely reduce the absorption capacity of the panel's photovoltaic cells. A single layer of dust is enough to obstruct the passage of light, and this will make the solar cells ineffective. Heavy dust covering the surface of the solar panel will reduce the output of the system [24]. The effect would be more obvious if the PV system consists of more cells or Stand-Alone Photovoltaic (SAPV) systems installed in areas where there will be heavy dust. Due to environmental conditions because of the exposure of surfaces, layers of dust are accumulated. Many other factors, such as the direction of the wind, humidity, etc also influence the deposition of dust [25]. It is preferable to have high wind speeds as they help in driving away from the accumulated dust. Pmax, Imax, Isc, and fill factor (FF) are the most affected performance characteristics by the dust deposits on the PV module surface [26]. Studies have shown that accumulated dust can reduce solar panel performance, but the results have not been clearly quantified [27].
2.2 Studies on Effect of Shadow
The location of solar panels is important when deciding on the development of a photovoltaic solar system [28]. It is very clear that solar panels should be placed in such a way as to absorb solar radiation during the time when the sun is at its highest as shading supersedes this when it comes to dominance [29]. Shadow effects solar panel performance considerably [30]. Partial shadow or full shadow both affect the amount of solar radiation received by cells. When shaded by a tree branch, building, or module dust, a cell's output declines [31]. The output decreases in proportion to the amount of shading. So, depending on the area of the cell that is shaded, the power-producing capacity of the cell will go down [32]. Hence there will be a drop in the amount of energy output of the Solar PV. The disadvantage of a series connection of cells is that one cell will affect the performance of the whole panel [33]. The same concept is applicable, even in the case when a series of panels are connected in the form of an array [34]. For completely opaque objects like a leaf, the decrease of the cell's current output is proportional to the amount of the cell that is obscured.
2.3 Objective and Scope of the Study
Recent studies have shown that research has generally been performed, taking into account the effect of dust and the effect of shadows separately. Still, there is very little literature that discusses the study of dust and the shadows simultaneously. This paper is written to bridge that gap to take into account the broader picture so that the overall performance reduction of the solar PV system can be analyzed. The present work was carried out to experimentally investigate the accumulation of dirt or particles and shadow on the electrical performance of the solar PV panel. This research work is not intended to study the quantitative effect of dust and % of the shadow, which is also the limitation of the study.
3.1 Experimental Setup and Procedure
The small-scale experimental setup is described in this section. Three sets of experiments were conducted for a 3 Wp power capacity panel manufactured by Tata Solar available in the laboratory for this experimental investigation. Based on the latitude of Thanjavur, the panel was oriented for receiving solar radiation for the maximum number of hours. The specifications of the panel are listed in Tab. 1. A 50 Ω rheostat was connected to the PV module for measuring the IV characteristics. The solar panel was tested in the standard test conditions (STC) corresponding to AM 1.5, 25°C, and 1000 W/m2. Experiments using solar panels partially obstructed with shadow and soil dirt were conducted under natural outdoor conditions The block diagram of the experimental setup is shown in Fig. 1. Fig. 2 describes the experimental setup of the cleaned PV module, module with shadow and dust, respectively. Fig. 3 shows the solar panel with and without dust. The whole methodology of the experimental study is presented in Fig. 4.
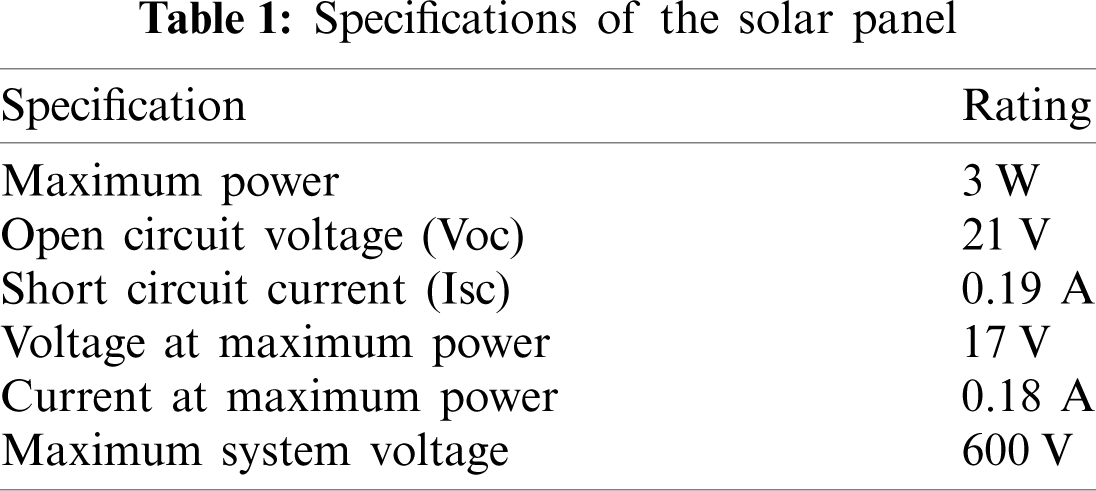

Figure 1: Sample circuit diagram of PV system with dust

Figure 2: Experimental setup of clean panel, shadow panel and with dust (i) Clean PV panel (ii) PV panel (partially shadowed) (iii) PV panel with soil dust
Digital Multimeter was used to measure the open-circuit voltage and short circuit current of the solar panel with the following specifications: DC Voltage: 0–100 V, DC Current: 0–10 A, Double Display, Brand Name: “Tfpro” was used. A light meter, range 0–50000 lux, brand name: “WE300” was used to determine the lux level. The temperature of the PV module was assessed with the Infra-read thermometer. Air temperature and relative humidity were recorded using a thermo-hygrometer with an accuracy of ±2%.
For the first set of studies, the experiment is performed on a cleaned solar PV panel without any dust. The same set of analyses are repeated with the accumulation of dust and under the influence of shadow. The performance analysis is studied using the various equations given in Eqs. (1)–(4). The effect of dust and shadow was studied based on the percentage reduction in power and efficiency of the solar PV modules.
where,
Voc = Voltage of electricity produced (volts)
Isc = Electrical current produced by the solar PV panel (Ampere)
FF = Fill Factor = 0.75
A = Area of solar panel (cross-section of panel) = 180 ∗ 150 mm2
I = Intensity of solar radiation (W/m2) = 1000 W/m2
The following assumptions were made during the study:
(1) The experiments were done on consecutive days on clear sky days during which the climatic conditions are assumed to be similar.
(2) The effect of temperature and irradiance on the power output of the solar PV module is already accounted for by measuring voltage and current in outdoor conditions.
(3) The analysis of electrical efficiency was evaluated for standard test conditions for 1000 W/m2 irradiance.

Figure 3: Solar panel with and without dust
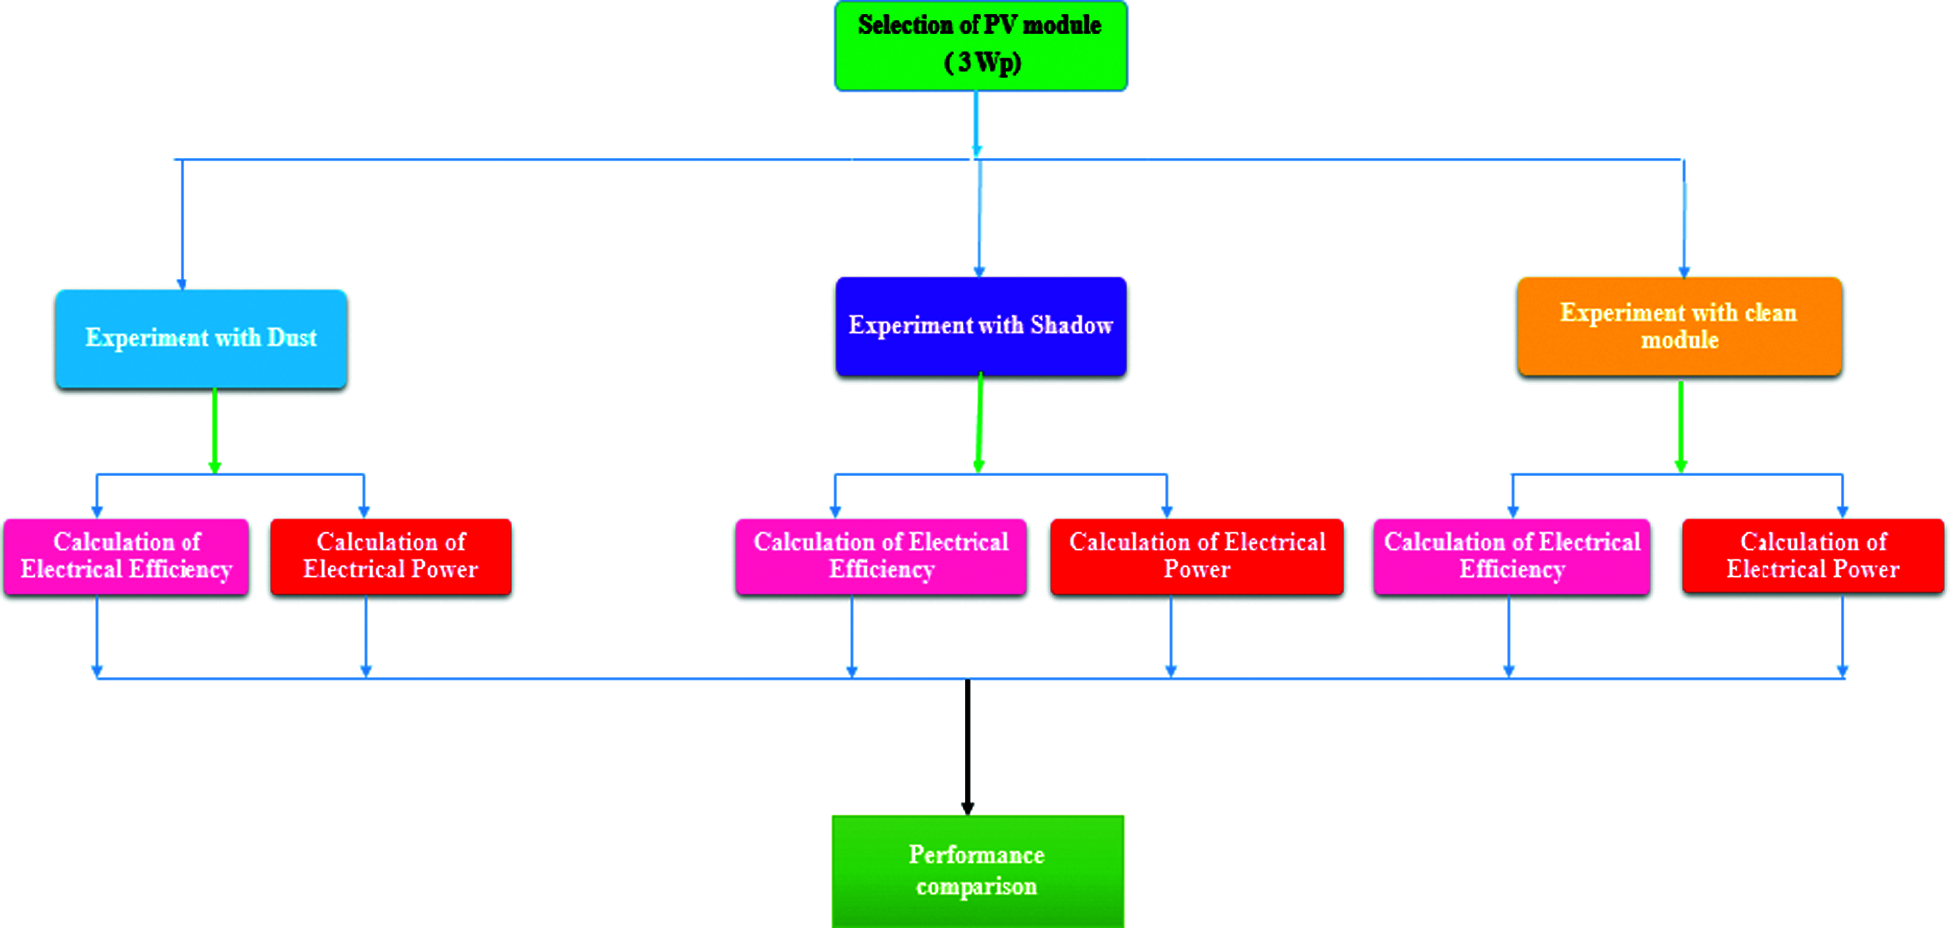
Figure 4: Flowchart of the proposed work
4.1 Voltage and Current Variation
The experimental investigation was carried out with natural dust (soil) and shadow. Performance parameters such as voltage, current, Electrical power, and Electrical efficiency were compared with and without shadow. Fig. 5 shows the comparison of the current of the cleaned panel, with shadow and dust. The peak voltage of 17.56 V and current of 0.147 A for the cleaned panel and peak voltage when the cells of the panel are shadowed is 10.1 V and 0.06 A at 1:00 pm. It can be observed that there is a drop in the peak voltage level by 0.8 V when the panel is accumulated with dust. It is observed that peak radiation is obtained from the sun at 2:30 pm with a voltage of 17.56 V and 0.147 A for the cleaned panel and maximum voltage when the panel accumulated with the dust is 16.8 V and 0.12 A at 1:00 pm. This effect will further increase if the panel capacity increases and the panel is installed at the location where there will be heavy dust concentration. Fig. 6 shows the comparison of the current of the cleaned panel, with shadow and with dust. Natural dust or sand particles are considered to affect the power output more compared to other types of dust. Shading affects the output generated by the solar panel as it leads to hot spots, which may sometimes lead to permanent damage to solar cells.
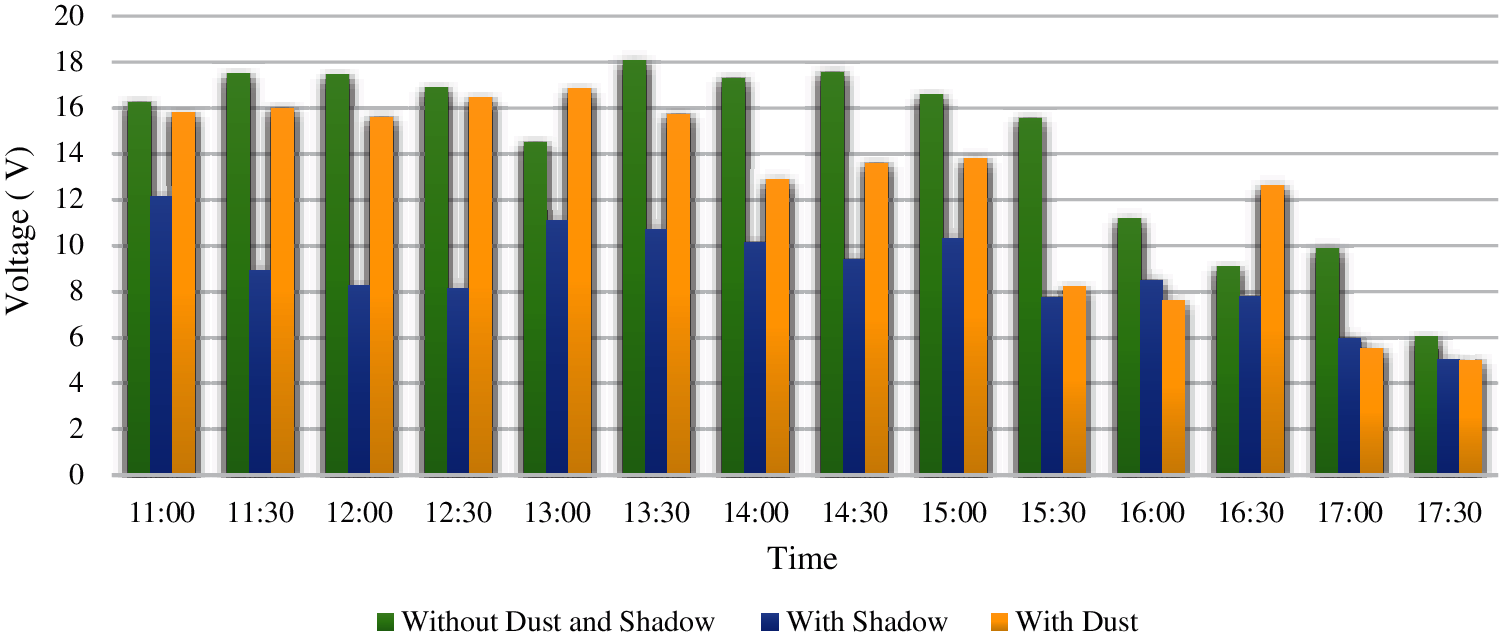
Figure 5: Comparison of the voltage of cleaned panel, with shadow and dust
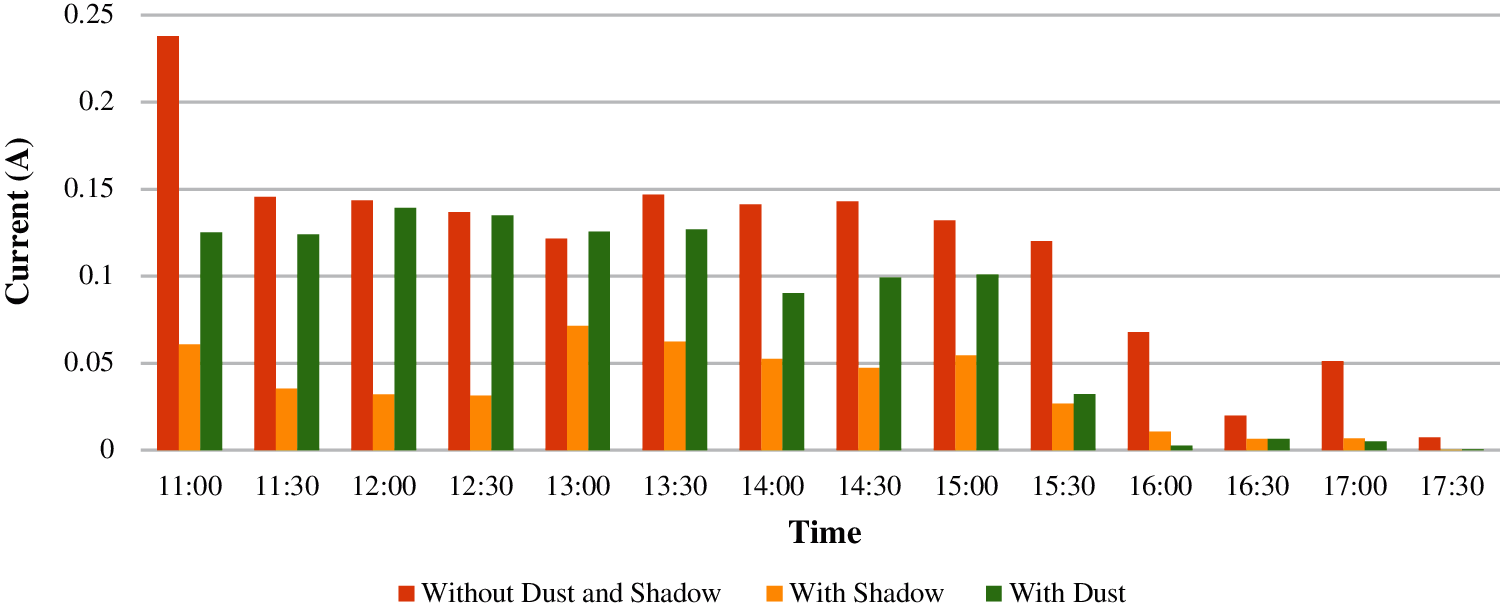
Figure 6: Comparison of the current of the cleaned panel, with shadow and dust
Fig. 7 shows the comparison of the power of the clean panel, with dust and with shadow. The power output was decreased to 60% of the maximum power that was obtained without any dust. The power output was decreased to 20% of the output power when compared to the one without dust shadow. The results show that the electrical performance of the panel is significantly affected because of shadow [35].
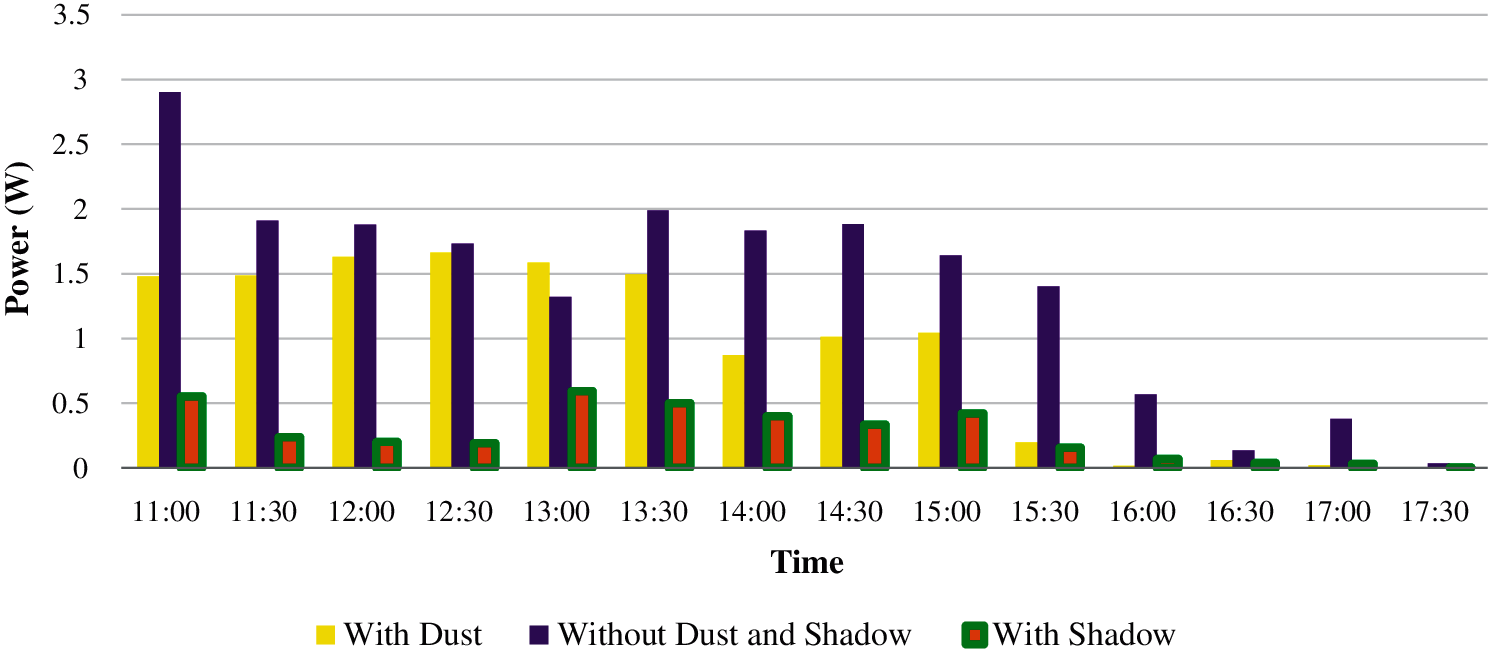
Figure 7: Comparison of power of clean panel, with dust and with shadow
4.3. Module Efficiency Variation
There was a decrease in efficiency by 6% when compared to the one without any dust. These results are in line with various other studies that have been reported in the literature [36–44].
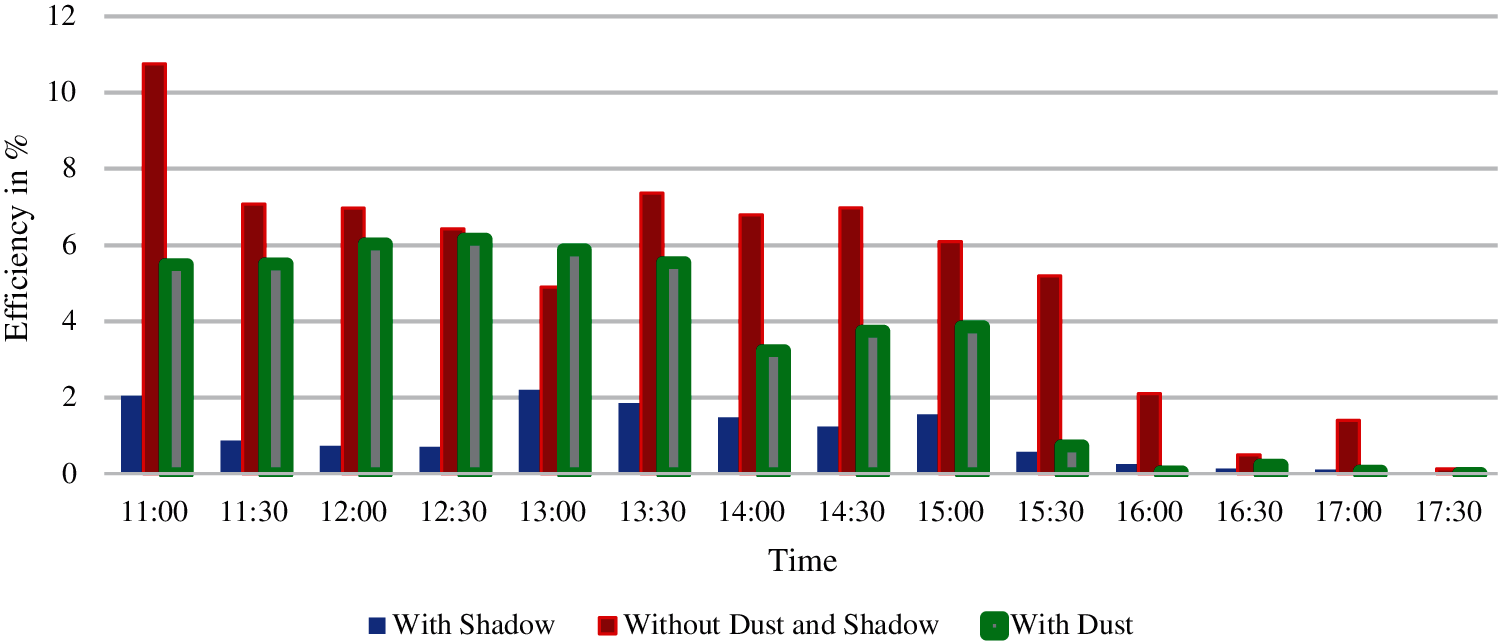
Figure 8: Comparison of the efficiency of clean panel, with dust and with shadow
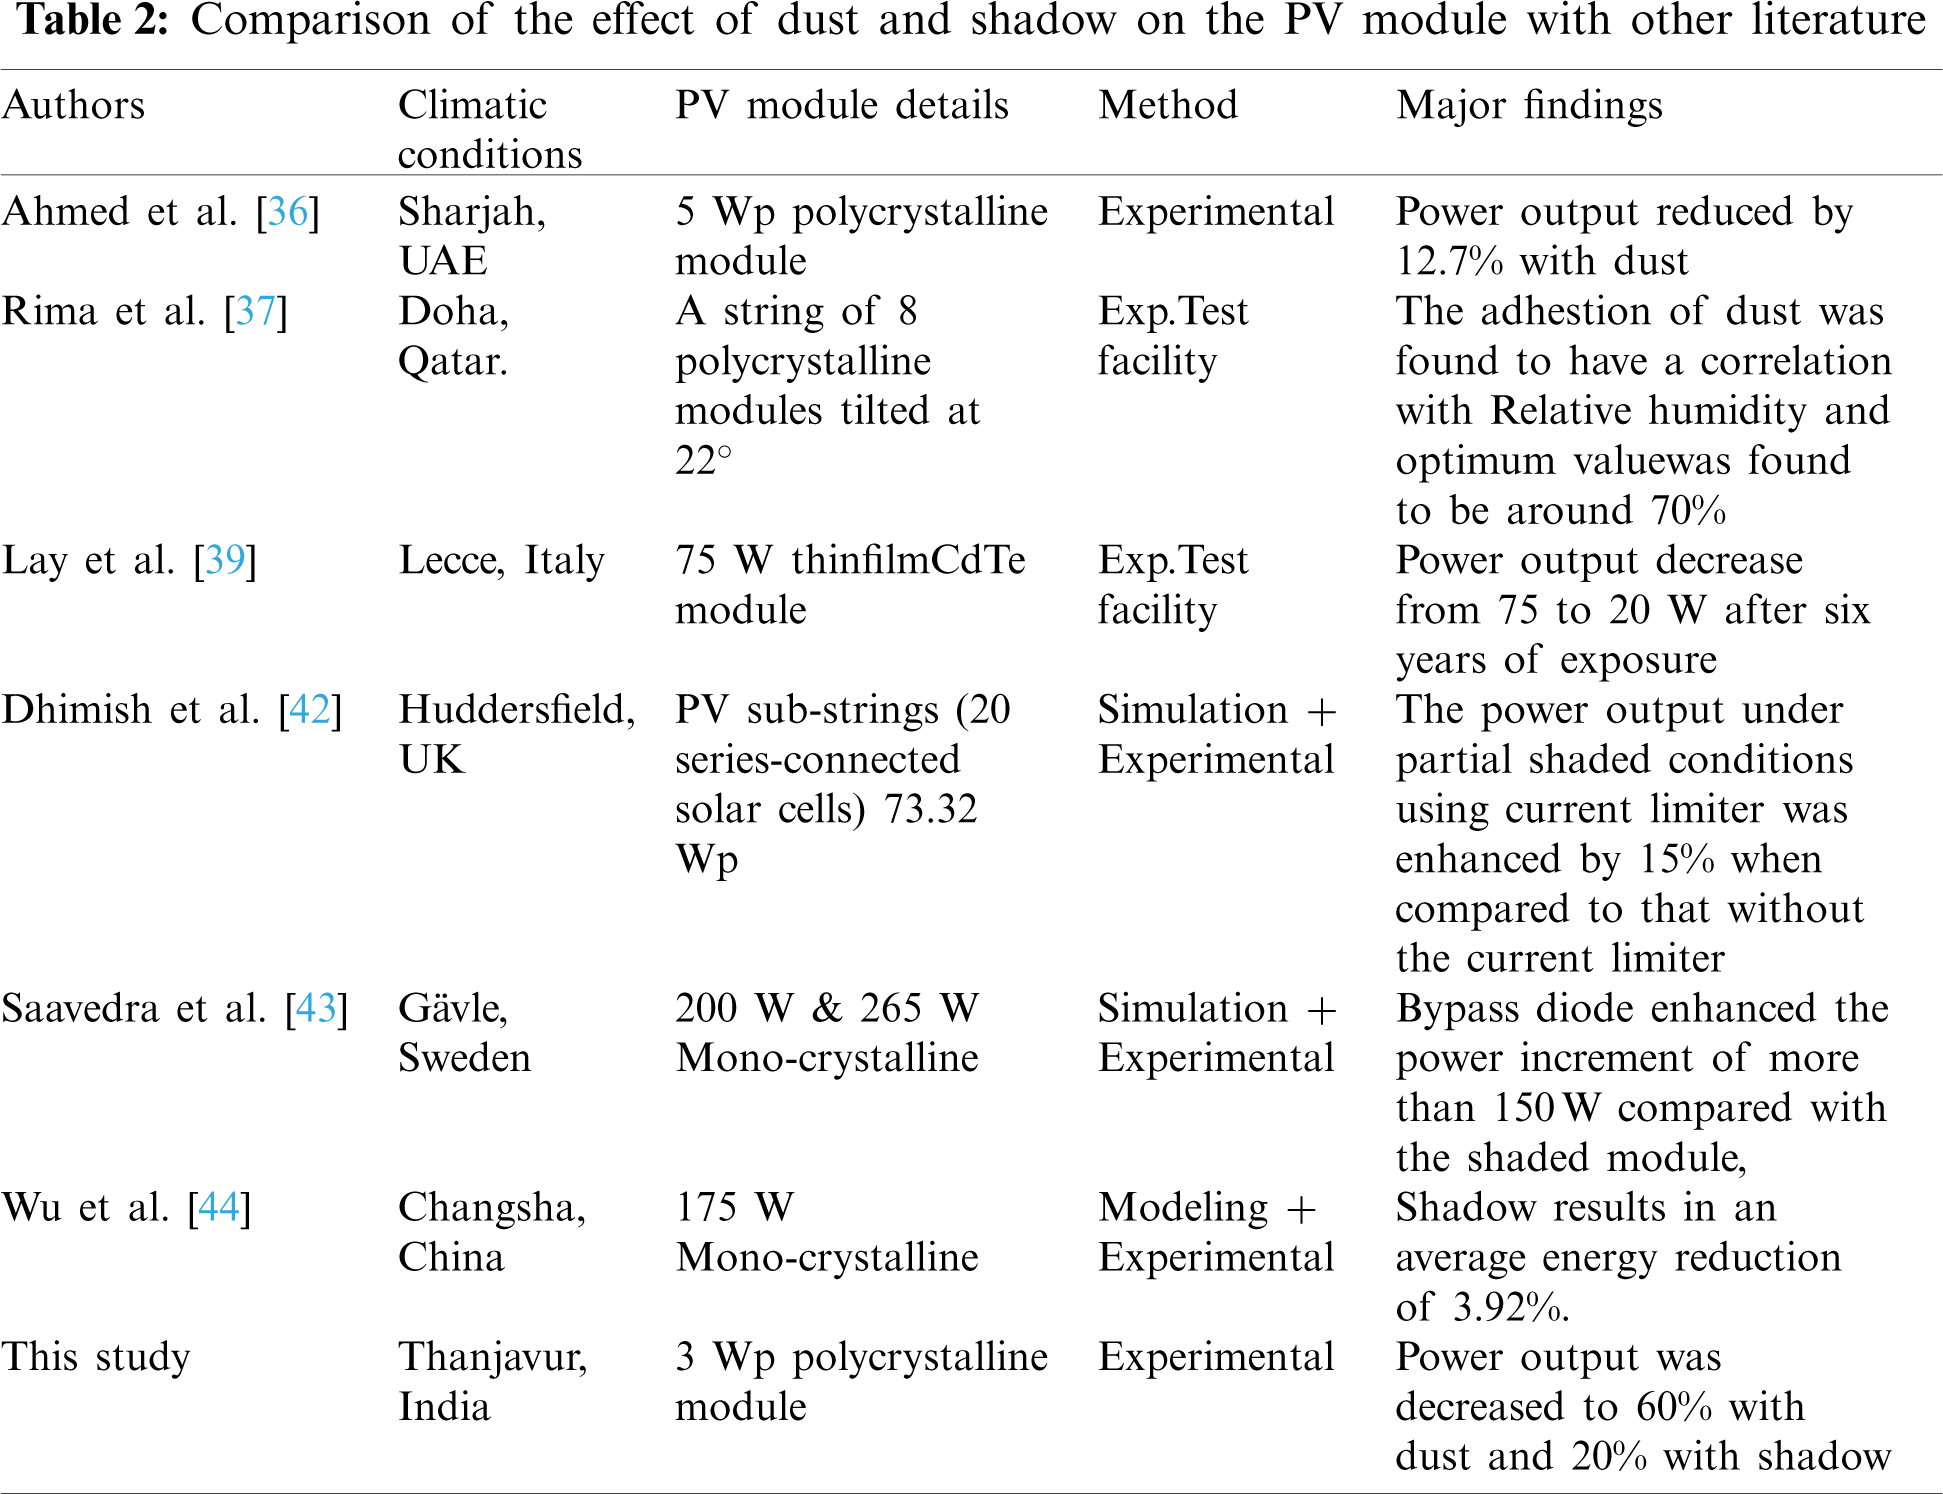
This can be attributed to the fact that natural dust consists of various materials of various sizes [38]. Due to several irregularities, solar cell efficiency is affected, thereby affecting the overall efficiency of the panel [40]. Similarly, there is a significant decrease in the efficiency of the panel due to the effect of shadow. There was a 9% decrease in maximum efficiency due to the effect of shadow. Although the performance of the clean panel is not affected, the improvement was evident when compared to the one exposed to dust and shadow (Fig. 8). From the above characteristics, it can be realized that the power output and efficiency, which primarily describes the performance analysis of any system, is decreased because of the accumulation of dust [41]. The comparison of the present work with other literature on dust and shadow is listed in Tab. 2.
It shows the importance of the proper maintenance of the PV panel in such a way it is free from dust and shadow to generate maximum power under the given climatic conditions.
The performance of three conditions of PV modules under the real experimental conditions has been compared to analyze the effect of shadow and dust.
• It was observed that there was an 80% reduction in electrical power production with shadow and 40% reduction in electrical power production with dust. compared to the panel free from dust and shadow.
• It was observed that there was a 9% reduction in electrical efficiency of the panel with shadow and a 6% reduction in efficiency in case of dust compared to the panel free from dust and shadow.
• For the experimental conditions studied, it is concluded that even partial shadow conditions substantially influence the performance of the solar panel when compared to dust.
• It is imperative to identify and select a location where solar PV is maintained without any dust and shadows. Also, as solar PV technologies are increasingly applied in Building Integrated Photo Voltaic (BIPV), it is of great importance to see that there is a process of regular maintenance and that the PV is free from any shadows for the optimal use of solar energy. Thus, the importance of maintaining the PV panels clean and free of shadows has been realized.
• The characterization of the size and type of deposition of dust can also be done in the future to analyze and understand the effect of dust on the performance of Solar PV.
Acknowledgement: The authors like to thank Sastra Deemed University for giving facilities to carry out the work.
Funding Statement: The authors received no specific funding for this study.
Conflicts of Interest: The authors declare that they have no conflicts of interest to report regarding the present study.
1. Premkumar, M., Jangir, P., Ramakrishnan, C., Nalinipriya, G., Alhelou, H. H. et al. (2021). Identification of solar photovoltaic model parameters using an improved gradient-based optimization algorithm with chaotic drifts. IEEE Access, 9, 62347–62379. DOI 10.1109/Access.6287639. [Google Scholar] [CrossRef]
2. Premkumar, M., Jangir, P., Sowmya, R., Elavarasan, R. M., Santhosh Kumar, B. (2021). Enhanced chaotic JAYA algorithm for parameter estimation of photovoltaic cell/modules. ISA Transactions In Press. DOI 10.1016/j.isatra.2021.01.045. [Google Scholar] [CrossRef]
3. Premkumar, M., Sowmya, R., Mosaad, M. I., Abdul Fattah, T. A. (2020). Design and development of low-cost photovoltaic module characterization educational demonstration tool. Materials Today: Proceedings, 46, 5433–5440. DOI 10.1016/j.matpr.2020.09.135. [Google Scholar] [CrossRef]
4. Menaga, D., Premkumar, M., Sowmya, R., Narasimman, S. (2020). Design of nonlinear uncertainty controller for grid-tied solar photovoltaic system using sliding mode control. Energy Engineering, 117(6), 481–495. DOI 10.32604/EE.2020.013282. [Google Scholar] [CrossRef]
5. Premkumar, M., Kumar, C., Sowmya, R. (2020). Mathematical modelling of solar photovoltaic cell/Panel/Array based on the physical parameters from the manufacturer's datasheet. International Journal of Renewable Energy Development, 9(1), 7–22. DOI 10.14710/ijred.9.1.7-22. [Google Scholar] [CrossRef]
6. Premkumar, M., Umashankar, S., Sudhakar Babu, T., Sanjeevikumar, P., Holm-Nielsen, J. et al. (2020). Improved perturb and observation MPPT technique for solar photovoltaic power generation systems. IEEE Systems Journal, 15(2), 3024–3035. DOI 10.1109/JSYST.2020.3003255. [Google Scholar] [CrossRef]
7. Premkumar, M., Subramaniam, U., Babu, T. S., Elavarasan, R. M., Mihet-Popa, L. (2020). Evaluation of mathematical model to characterize the performance of conventional and hybrid PV array topologies under static and dynamic shading patterns, Energies, 13(12), 3216. DOI 10.3390/en13123216. [Google Scholar] [CrossRef]
8. Esposito, S., D'Angelo, A., Antonaia, A., Castaldo, A., Ferrara, M. et al. (2016). Optimization procedure and fabrication of highly efficient and thermally stable solar coating for receiver operating at high temperature. Solar Energy Materials and Solar Cells, 157, 429–437. DOI 10.1016/j.solmat.2016.06.047. [Google Scholar] [CrossRef]
9. Mary, D., Sudhakar, K., Baredar, P. (2016). Comparison of BIPV and BIPVT: A review. Resource-Efficient Technologies, 3(3), 263–271. DOI 10.1016/j.reffit.2016.11.013. [Google Scholar] [CrossRef]
10. Dondariya, C., Porwal, D., Awasthi, A., Shukla, A. K., Sudhakar, K. et al. (2018). Performance simulation of grid-connected rooftop solar PV system for small households: A case study of Ujjain, India. Energy Reports, 4, 546–553. DOI 10.1016/j.egyr.2018.08.002. [Google Scholar] [CrossRef]
11. Mary, D., Sudhakar, K., Baredar, P. (2017). Thermal modelling, exergy analysis, performance of BIPV and BIPVT: A review. Renewable and Sustainable Energy Reviews, 73, 1276–1288. DOI 10.1016/j.rser.2017.02.035. [Google Scholar] [CrossRef]
12. Sreenath, S., Sudhakar, K., Yusop, A. F., Cuce, E., Solomin, E. (2020). Analysis of solar PV glare in airport environment: Potential solutions. Results in Engineering, 5, 100079. DOI 10.1016/j.rineng.2019.100079. [Google Scholar] [CrossRef]
13. Karthick, A., Kalidasa Murugavel, K., Ghosh, A., Sudhakar, K., Ramanan, P. (2020). Investigation of a binary eutectic mixture of phase change material for building integrated photovoltaic (BIPV) system. Solar Energy Materials and Solar Cells, 207, 110360. DOI 10.1016/j.solmat.2019.110360. [Google Scholar] [CrossRef]
14. Shukla, A. K., Sudhakar, K., Baredar, P. (2016). A comprehensive review on design of building integrated photovoltaic system. Energy and Buildings, 128, 99–110. DOI 10.1016/j.enbuild.2016.06.077. [Google Scholar] [CrossRef]
15. Kumar, N. M., Sudhakar, K., Samykano, M., Sukumaran, S. (2018). Dust cleaning robots (DCR) for BIPV and BAPV solar power plants—A conceptual framework and research challenges. Procedia Computer Science, 133, 746–754. DOI 10.1016/j.procs.2018.07.123. [Google Scholar] [CrossRef]
16. Shukla, A. K., Sudhakar, K., Baredar, P., Mamat, R. (2018). BIPV based sustainable building in south asian countries. Solar Energy, 170, 1162–1170. DOI 10.1016/j.solener.2018.06.026. [Google Scholar] [CrossRef]
17. Shukla, A. K., Sudhakar, K., Baredar, P., Mamat, R. (2017). BIPV in southeast asian countries—Opportunities and challenges. Renewable Energy Focus, 21, 25–32. DOI 10.1016/j.ref.2017.07.001. [Google Scholar] [CrossRef]
18. Shukla, A. K., Sudhakar, K., Baredar, P., Mamat, R. (2018). Solar PV and BIPV system: Barrier, challenges and policy recommendation in India. Renewable and Sustainable Energy Reviews, 82, 3314–3322. DOI 10.1016/j.rser.2017.10.013. [Google Scholar] [CrossRef]
19. Hyder, F., Baredar, P., Sudhakar, K., Mamat, R. (2018). Performance and land footprint analysis of a solar photovoltaic tree. Journal of Cleaner Production, 187, 432–448. DOI 10.1016/j.jclepro.2018.03.249. [Google Scholar] [CrossRef]
20. Sreenath, S., Sudhakar, K., Yusop, A. F., Solomin, E., Kirpichnikova, I. M. (2020). Solar PV energy system in Malaysian airport: Glare analysis, general design and performance assessment. Energy Reports, 6, 698–712. DOI 10.1016/j.egyr.2020.03.015. [Google Scholar] [CrossRef]
21. Mekhilef, S., Saidur, R., Kamalisarvestani, M. (2012). Effect of dust, humidity and air velocity on efficiency of photovoltaic cells. Renewable and Sustainable Energy Reviews, 16, 2920–2925. DOI 10.1016/j.rser.2012.02.012. [Google Scholar] [CrossRef]
22. Darwish, Z. A., Kazem, H. A., Sopian, K., Alghoul, M. A., Chaichan, M. T. (2013). Impact of some environmental variables with dust on solar photovoltaic (PV) performance: Review and research status. International Journal of Energy and Environment, 7, 152–159. [Google Scholar]
23. Ghazi, S., Ip, A. S. K. (2014). Dust effect on flat surfaces—A review paper. Renewable and Sustainable Energy Reviews, 33, 742–751. DOI 10.1016/j.rser.2014.02.016. [Google Scholar] [CrossRef]
24. Kazem, A. A., Chaichan, M. T., Kazem, H. A. (2014). Dust effect on photovoltaic utilization in Iraq: Review article. Renewabe and Sustainable Energy Reviews, 37, 734–749. DOI 10.1016/j.rser.2014.05.073. [Google Scholar] [CrossRef]
25. Sayyah, A., Horenstein, M. N., Mazumder, M. K. (2014). Energy yield loss caused by dust deposition on photovoltaicpanels. Solar Energy, 107, 576–604. DOI 10.1016/j.solener.2014.05.030. [Google Scholar] [CrossRef]
26. Maghami, M. R., Hizam, H., Gomes, C., Radzi, M. A., Rezadad, M. I. et al. (2016). Power loss due to soiling on solar panel: A review. Renewable and Sustainable. Energy Reviews, 59, 1307–1316. DOI 10.1016/j.rser.2016.01.044. [Google Scholar] [CrossRef]
27. Zaihidee, F. M., Mekhilef, S., Seyedmahmoudian, M., Horan, B. (2016). Dust as an unalterable deteriorative factor affecting PV panel's efficiency: Why and how. Renewable and Sustainable. Energy Reviews, 65, 1267–1278. DOI 10.1016/j.rser.2016.06.068. [Google Scholar] [CrossRef]
28. Bruendlinger, R., Bletterie, B., Milde, M., Oldenkamp, H. (2006). Maximum power point tracking performance under partially shaded PV array conditions. Proeedings of 21st EUPVSEC, pp. 2157–2160 Germany. [Google Scholar]
29. Mahammad, A. K., Saon, S., Chee, W. S. (2013). Development of optimum controller based on MPPT for photovoltaic system during shading condition. Procedia Engineering, 53, 337–346. [Google Scholar]
30. Ramaprabha, R., Mathur, B., Murthy, M., Madhumitha, S. (2010). New configuration of solar photovoltaic array to address partial shaded conditions. Proceedings of 3rd International Conference of Emerging Trends Engineering and Technology, pp. 328–333. Goa, India. [Google Scholar]
31. Kazem, H. A., Chaichan, M. T., Alwaeli, A. H., Mani, K. (2015). Effect of shadow on the performance of solar photovoltaic. Conference in Mediterranean Green Buildings & Renewable Energy. Florence, Italy. [Google Scholar]
32. Patel, H., Agarwal, V. (2008). MATLAB-Based modeling to study the effects of partial shading on PV array characteristics. IEEE Transactions on Energy Conversion, 23, 302–310. DOI 10.1109/TEC.2007.914308. [Google Scholar] [CrossRef]
33. Lua, F., Guo, S., Walsh, T. M., Aberle, A. G. (2013). Improved PV module performance under partial shading conditions. Energy Procedia, 33, 248–255. DOI 10.1016/j.egypro.2013.05.065. [Google Scholar] [CrossRef]
34. Teo, J. C., Tan, R. H. G., Mok, V. H., Ramachandaramurthy, V. K., Tan, C. (2018). Mpact of partial shading on the P--V chracteristics and the maximum power of a photovoltaic string. Energies, 11, 1838–1860. [Google Scholar]
35. Sisodia, A. K., Mathus, R. K. (2019). Impact of bird dropping deposition on solar photovoltaic module performance: A systematic study in Western Rajasthan. Environmental Science and Pollution Research, 26, 31119–31132. DOI 10.1007/s11356-019-06100-2. [Google Scholar] [CrossRef]
36. Hachicha, A. A., Al-Sawafta, I., Said, Z. (2019). Impact of dust on the performance of solar photovoltaic (PV) systems under United Arab Emirates weather conditions. Renewable Energy, 141, 287–297. DOI 10.1016/j.renene.2019.04.004. [Google Scholar] [CrossRef]
37. Isaifan, R. J., Johnson, D., Ackermann, L., Figgis, B., Ayoub, M. (2019). Evaluation of the adhesion forces between dust particles and photovoltaic module surfaces. Solar Energy Materials and Solar Cells, 191, 413–421. DOI 10.1016/j.solmat.2018.11.031. [Google Scholar] [CrossRef]
38. Picotti, G., Borghesani, P., Cholette, M. E., Manzolini, G., Soiling of Solar Collectors (2018). Modelling approaches for airborne dust and its interactions with surfaces. Renewable and Sustainable Energy Reviews, 81(2), 2343–2357. [Google Scholar]
39. Lay-Ekuakille, A., Ciaccioli, A., Griffo, G., Visconti, P., Andria, G. (2018). Effects of dust on photovoltaic measurements: A comparative study. Measurement, 113, 181–188. DOI 10.1016/j.measurement.2017.06.025. [Google Scholar] [CrossRef]
40. Said, S. A. M., Hassan, G., Walwil, H. M., Al-Aqeeli, N. (2018). The effect of environmental factors and dust accumulation on photovoltaic modules and dust-accumulation mitigation strategies. Renewable and Sustainable Energy Reviews, 82(1), 743–780. DOI 10.1016/j.rser.2017.09.042. [Google Scholar] [CrossRef]
41. IIse, K. K., Figgis, B. W., Naumann, V., Hagendrof, C., Bagdahn, J. (2018). Fundamentals of soiling processes on photovoltaics modules. Renewable and Sustainable Reviews, 98, 239–254. DOI 10.1016/j.rser.2018.09.015. [Google Scholar] [CrossRef]
42. Dhimish, M., Badran, G. (2020). Current limiter circuit to avoid photovoltaic mismatch conditions including hot-spots and shading. Renewable Energy, 145, 2201–2216. DOI 10.1016/j.renene.2019.07.156. [Google Scholar] [CrossRef]
43. Gallardo-Saavedra, S., Karlsson, B. (2018). Simulation, validation and analysis of shading effects on a PV system. Solar Energy, 170, 828–839. DOI 10.1016/j.solener.2018.06.035. [Google Scholar] [CrossRef]
44. Wua, J., Zhang, L., Liu, Z., Luo, Y., Wu, Z. et al. (2020). Experimental and theoretical study on the performance of semi-transparent photovoltaic glazing façade under shaded conditions. Energy, 207, 118314. [Google Scholar]
 | This work is licensed under a Creative Commons Attribution 4.0 International License, which permits unrestricted use, distribution, and reproduction in any medium, provided the original work is properly cited. |