| Energy Engineering |
DOI: 10.32604/EE.2021.014818
ARTICLE
Optimal Allocation of Comprehensive Resources for Large-Scale Access of Electric Kiln to the Distribution Network
1Key Laboratory of Smart Grid of Education Ministry, Tianjin University, Tianjin, 300072, China
2Tianjin University of Technology, Tianjin, 300072, China
3Electric Power Science Research Institute of State Grid Jiangxi Electric Power Co., Ltd., Nanchang, 330096, China
4CNOOC Enertech Equipment Technology Co., Ltd., Tianjin, 300452, China
*Corresponding Author: Wei Li. Email: liweitjut@163.com
Received: 02 November 2020; Accepted: 15 March 2021
Abstract: With the significant progress of the “coal to electricity” project, the electric kiln equipment began to be connected to the distribution network on a large scale, which caused power quality problems such as low voltage, high harmonic distortion rate, and high reactive power loss. This paper proposes a two-stage power grid comprehensive resource optimization configuration model. A multi-objective optimization solution based on the joint simulation platform of Matlab and OpenDSS is developed. The solution aims to control harmonics and optimize reactive power. In the first stage, a multi-objective optimization model is established to minimize the active network loss, voltage deviation, and equipment cost under the constraint conditions of voltage margin, power factor, and reactive power compensation capacity. Furthermore, the first stage uses a particle swarm optimization (PSO) algorithm to optimize the location and capacity of both series and parallel compensation devices in the distribution network. In the second stage, the optimal configuration model of the active power filter assumes the cost of the APF as the objective function and takes the harmonic voltage content rate, the total voltage distortion rate, and the allowable harmonic current as the constraint conditions. The proposed solution eliminates the harmonics by uniformly configuring active filters in the distribution network and centrally control harmonics at the system level. Finally, taking the IEEE33 distribution network as the object and considering the change of electric furnace permeability in the range of 20%–50%, the simulation results show that the proposed algorithm effectively reduces the distribution network’s loss, its harmonic content and significantly improve its voltage.
Keywords: Electric furnace; reactive compensation; filter optimization configuration; multi-objective optimization; particle swarm algorithm
Due to the rapid economic development and the consumption of conventional energy, environmental pollution, and energy crisis have become problems that cannot be ignored [1]. Electric energy substitution is a sustainable development strategy to implement national energy conservation and emission reduction policies, prevent air pollution, and optimize energy consumption structure [2,3]. As the first batch of electrical energy substitute products, electric kilns have been widely promoted and used in Jingdezhen. Compared with wood kilns, coal kilns, and gas kilns, electric kilns have a series of advantages such as a small footprint, high thermal efficiency, and good product firing quality [4,5]. However, the large-scale connection of electric energy substitute products represented by electric kilns to the grid will cause a series of power quality problems such as low voltage, high harmonic distortion rate, and high reactive power loss in the distribution network, which will significantly affect the safe and reliable operation of the distribution network [3].
The static var compensator’s installation position and installation capacity are generally optimized in the traditional distribution networks. The total voltage deviation, installation capacity, and reactive power loss weighting are converted into a single objective and solved by a particle swarm algorithm to effectively reduce Power loss and reduce voltage deviation to achieve the distribution network’s economical and safe operation [6–8]. Based on considering the grid demand response and safety constraints, the mixed-integer second-order cone is used to optimize the dispatching of the active distribution network and the switching of electric vehicles and shunt capacitors in [9,10]. However, there are discrete and continuous optimization variables. There are difficulties in solving the two forms. The problem of coordination and optimization of capacitor banks and distributed power sources under load fluctuations have been solved in [11]. A multi-objective dynamic reactive power optimization model for active distribution networks is established, taking distributed power investment benefits and network active power losses as the objective function. However, the research focuses on distributed power sources. Yang et al. suggested that economic constraints pursued the maximum net profit and solved it using particle swarm algorithm. It studied the three states of high, medium, and low load and finally got the installation position and number of capacitor banks [12]. In terms of the optimal configuration of the filter, the harmonic voltage distortion rate is taken as the constraint condition, and the total cost of the active filter is used as the objective function in [13]. The filter is fixedly installed at the harmonic source node, and the various components of the active filter are optimized—sub-harmonic current. In the case of the most severe harmonic pollution under multiple harmonic sources, the capacity and the active filter installed in the distribution network are taken as the optimization objective, and the harmonic distortion rate is the constraint condition. The genetic algorithm is used to optimize the solution in [14]. A double-layer loop is used in the filter configuration in [15]. The inner loop optimizes the voltage distortion rate as the objective function. The outer loop optimizes the objective function with the minimum installation cost, considering the low harmonic distortion rate requirements and low cost and determining the filter Installation location and capacity.
In the actual operation process, the scale of alternative loads such as electric furnaces and electric heating significantly impact the power supply capacity of the distribution network. However, the existing literature rarely studies the reactive power optimization problem and the harmonic suppression problem after the electric furnace is connected to the distribution network on a large scale. In this context, it is necessary to make proper application planning for the treatment device to solve the power quality problems such as reactive power, high harmonic distortion rate, and low voltage caused by large-scale access to ensure the safe and stable operation of the system and the voltage quality of the user terminal within the standard range.
Reactive power compensation management devices are divided into parallel compensation and series compensation. Parallel compensation is connected to a compensation capacitor on the feeder, reducing the inductive reactive power flow on the user side, reducing line loss, and reducing voltage drop. However, the reactive power provided by it is proportional to the square of the voltage. When it increases significantly, the line voltage is too low to achieve the control effect [16–18]. The series compensation capacitor can reduce the line reactance, increase the voltage at the end of the line and improve the voltage quality. However, the series compensation cannot reduce the reactive power on the user side, resulting in the reactive power still flowing in the line. There is still a significant network loss. This article intends to use a combination of parallel compensator and series compensator for reactive power compensation in the distribution network system.
There are two main aspects of harmonic control. On the one hand, the harmonic source itself is restricted. On the other hand, passive power filters (PPF) or active power filters (APF) are installed in the power grid to achieve harmonic suppression such that the harmonic meet the national standard [19]. Although the passive filter has the advantages of low cost, simple structure, and easy implementation, its filtering characteristics are not good [20]. This article configures an active filter with superior performance in the distribution network.
In the context of the large-scale application of electric kilns, this paper proposes a two-stage power grid comprehensive resource optimization model considering reactive power optimization and harmonic control. In the first stage, an optimization model was established from the three aspects of investment, network loss, and voltage deviation to evaluate the impact of the electric furnace on the system after being connected to the distribution network. Moreover, the first stage use particle swarm optimization (PSO) algorithm to optimize the location and capacity of series compensation device and parallel compensation device in the distribution network. In the second stage, through the unified configuration of active filters in the distribution network to eliminate harmonics. Harmonics are managed in a centralized and unified manner at the system level. By establishing the comprehensive resource optimal allocation model of the power grid, the treatment equipment was rationally planned, which solved the power quality problem after the large-scale application of electric kilns and provided a specific theoretical basis for the “coal-to-electricity” supporting power grid renovation project.
2 Electric Furnace System for Large-Scale Application
2.1 Large-scale Access Scenario of Electric Kiln
The equivalent model of the distribution network includes the electric furnace load, compensation device, and the upper-level grid system. The power quality impact of electric kiln load mainly includes reactive power and voltage drop. Fig. 1 is an equivalent electric kiln load model connected to the distribution network on a large scale, including multiple electric kiln loads, reactive power compensation devices, and filter branches.
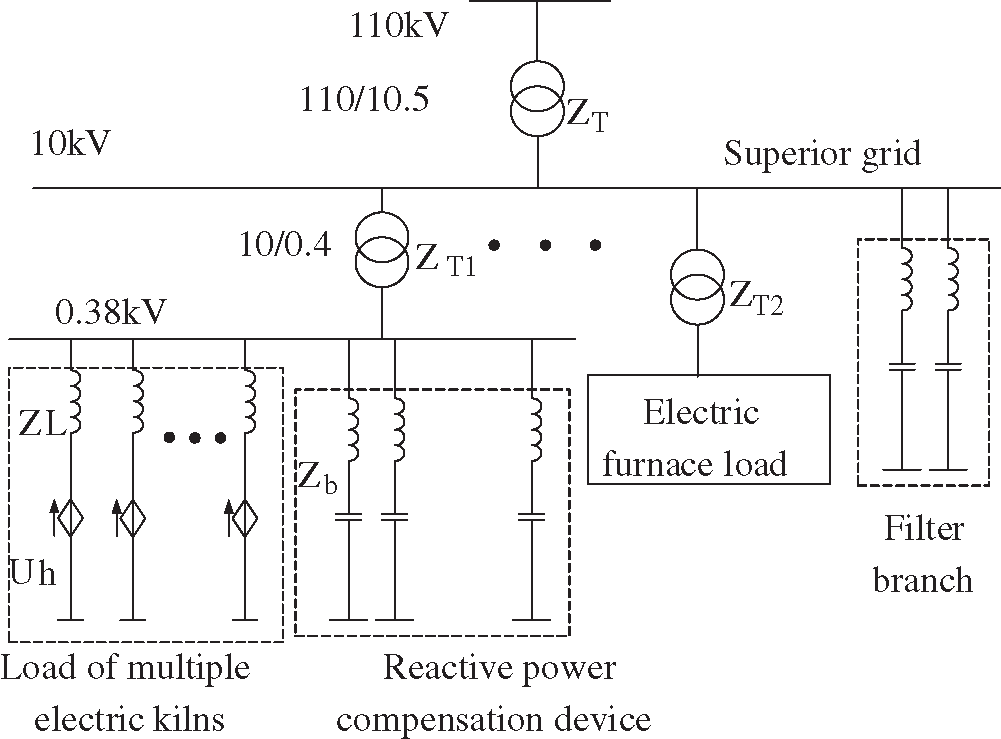
Figure 1: The equivalent model of large-scale access of electric kiln to the distribution network
Among them, the influence of reactive power mainly has the following three aspects: 1) When the reactive power consumed by the electric furnace increases, the power factor of the distribution network will decrease. 2) When the electric furnace load is connected to the power grid on a large scale, it consumes a large amount of reactive power, causing a significant line voltage drop, making the line terminal voltage too low, causing the electric furnace equipment to fail to start. 3) Distribution transformers and power supply lines are designed and operated based on a certain rated current. When electric kilns are connected on a large scale, a large amount of reactive power will be consumed. When the transmitted reactive power is considerable, the distribution transformer will be affected. The ability to transmit active power with the power supply line causes a decrease in power transmission efficiency and decreased capacity utilization rate of power supply equipment. Reactive current is transmitted in distribution transformers and power supply lines, resulting in additional active losses in the equivalent resistance of power distribution and power supply lines, affecting the economic operation of the distribution network.
Permeability index is used to express the large-scale access of electric furnace load. The penetration rate of electric kiln equipment, as expressed in (1), refers to the ratio of the total power of electric kiln equipment to the total power of all low-voltage loads.
where: η is the penetration rate of electric kiln equipment (%); PERH is the total power of the electric kiln equipment in stable operation (kW); PT is the total power on the low-voltage side of the distribution transformer (kW); PLV is the general load of the low-voltage distribution network Total power (kW).
3 The First Stage: Establish a Multi-Objective Reactive Power Optimization Mathematical Model
This paper adopts the method of installing reactive power compensation at the PQ node of the system or between the two branches to compensate the electric kiln large-scale access to the distribution network, considering the smallest investment in reactive power compensation devices, the slightest voltage deviation. The minimum network loss is used as three objective functions to optimize the system with multi-objective reactive power. Considering that the unit resistance value of the line is much greater than the unit reactance value, the calculation of the network loss of the distribution network is to calculate the resistance loss on the line [21]. The multi-objective site selection and capacity optimization model established in this paper is shown in formulas (2)–(5).
where: Cinvest and Ccap is the total investment of reactive power compensation device and the investment of unit capacity; Qi is the reactive power connected at the node i; Ui, Uref, ΔU are the voltage of node I, the reference voltage amplitude during regular operation and the total Voltage deviation; Nb is the number of branches of the system; Ri the resistance of branch i; Pi, Qi, Ploss are the active power, reactive power of branch i and the network loss of the distribution network system, respectively.
The constraint conditions of reactive power optimization control variables need to meet the node active and reactive power balance constraints, as shown in (6) and (7), respectively.
where: PGi PLi are the generator active power and active load of node i, respectively; QGi QCi QLi are the generator reactive power, reactive power load and reactive power compensation capacity of node i, respectively; Ui Uj are nodes respectively the voltage of i and node j; Gij Bij θij—nodes i and j are connected, and the conductance, susceptance, and phase angle difference between the two nodes; N is the total number of nodes in the system.
Inequality constraints are divided into control variable constraints and state variable constraints. This paper selects generator node voltage and reactive power compensation device capacity as control variable constraints. It selects load node voltage and distribution network power factor as state variable constraints, as shown in Eqs. (8) and (9), respectively.
where: UGi UGimin UGimax are the breakpoint voltage of generator node i and its lower limit and upper limit respectively; QCi QCimin QCimax are the reactive power compensation capacity and its lower limit and upper limit respectively; ULi ULimin ULimax are the voltage of load node i and its lower limit and upper limit; puis the power factor when the distribution network is running; NG NC NL are the number of generator nodes in the grid, the number of reactive power compensation nodes, and the number of PQ nodes.
3.4 Normalization and Weight Determination
Due to the different dimensions and units of voltage deviation, active power loss, and investment cost, it is impossible to connect with weights. It is necessary to normalize the weights first to obtain the minimum value of the objective function (Cost-based quantitative target). The normalization process is shown in Eqs. (10)–(12):
where: ΔUde,ΔPloss and ΔCinvest are the voltage deviation, active loss, and equipment investment before adding series compensation and parallel compensation, ΔUmax, ΔUmin, Pmax, Pmin, Cmax, and Cmin are the maximum and minimum voltage deviation, active loss, and equipment investment, respectively.
The weight is directly given by the expert decision method, namely the Delphi method. Applying the traditional analytic hierarchy process to obtain the weight is shown in Fig. 2.
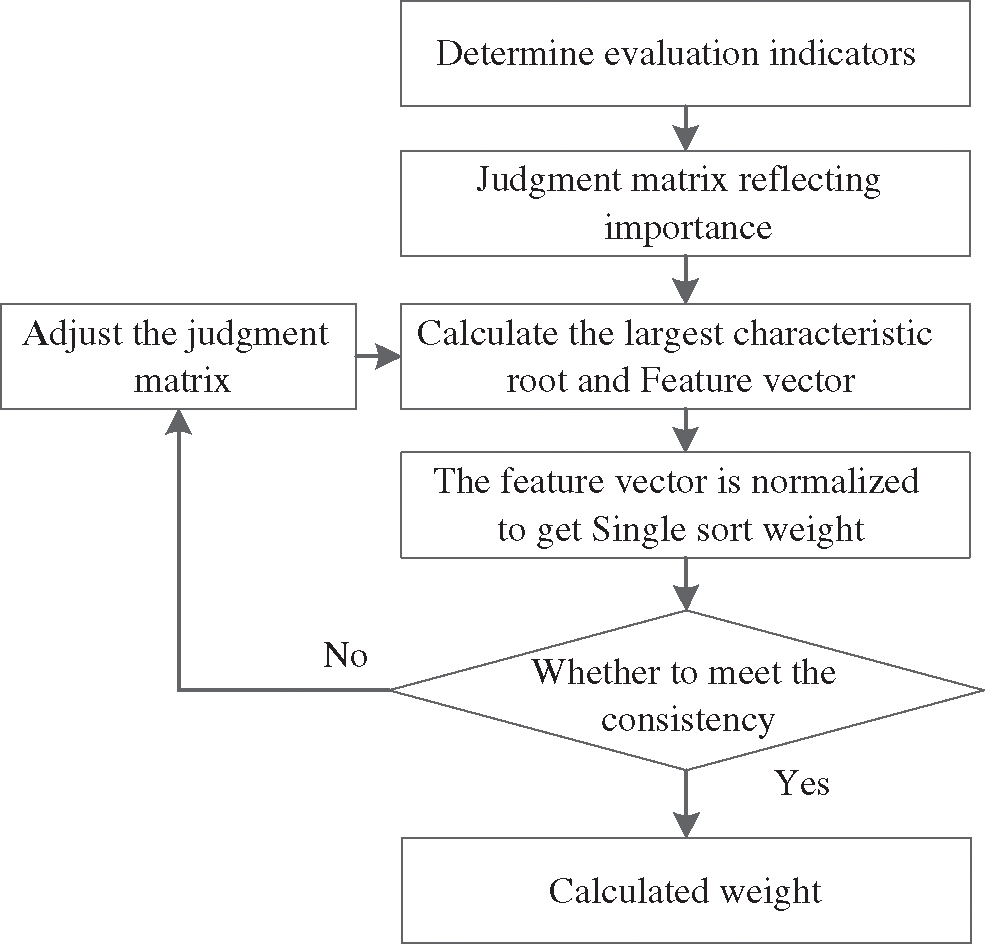
Figure 2: Weight calculation flowchart
First of all, the voltage quality should be met. Therefore, the voltage deviation is a crucial evaluation standard for the planning of reactive power compensation devices, so it is regarded as the first level; because the network loss cost value is relatively small, as the second level, it meets the voltage requirements and network loss requirements After that, a certain degree of the economy needs to be considered, that is, the fixed investment cost in the power company investment expense, as the third level. According to expert experience to judge the importance of each target, the index judgment matrix J is a 3 * 3 matrix:
According to the expert experience calculated in flow chart 3, the weight W of the first-level index is calculated as:
Therefore, the objective function of multi-objective optimization after the large-scale application of electric kiln is:
4 The Second Stage: The Mathematical Model of Active Filter Optimal Configuration
4.1 Active Filter Equivalent Model
The essence of APF is a controlled current source with current feedback control [22], the APF equivalent model is shown in Fig. 3. Fig. 4 is the proposed equivalent model of a single APF, which contains two parts: the three-level inverter part and the grid. The three-level inverter part includes command current Iref and output impedance Z1, and the grid part is composed of grid voltage E and grid impedance ZE.
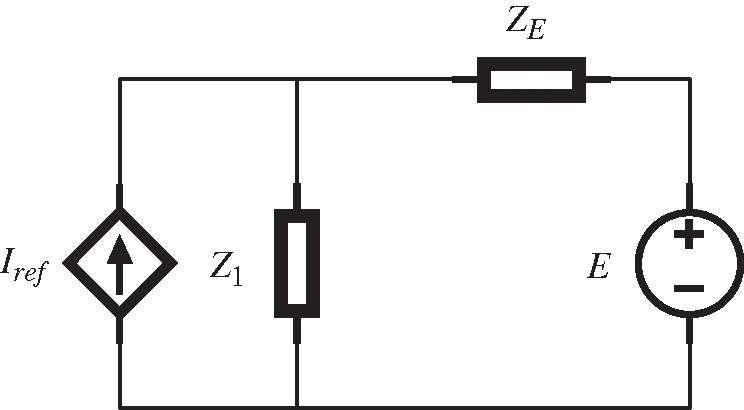
Figure 3: APF equivalent model
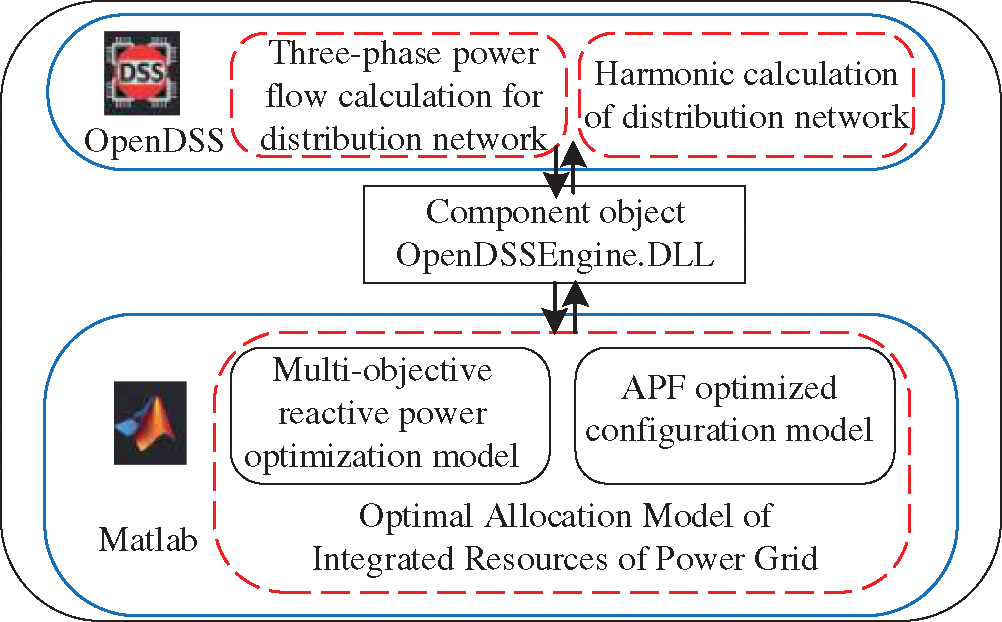
Figure 4: MATLAB and OpenDSS joint simulation platform
Assuming that the active filter only absorbs part of the harmonic current of this node in a particular proportion [23], let Ah represent the coefficient of the active filter absorbing the h harmonic current generated by the harmonic source at the node. The relationship between the h harmonic current absorbed by each active filter IAh and the harmonic current injected by the harmonic source Ih is shown below:
4.2 Mathematical Model of Optimal Filter Configuration
The optimized configuration of the filter means that after the filter is installed, the harmonic content rate (URH), harmonic voltage distortion rate (UTHD), and allowable value of each harmonic current of each node of the network meet the requirements of the national standard. The optimization result minimizes the initial investment of the filter and achieves the maximum economic benefit while ensuring the safe operation of the filter.
The optimal configuration model takes the cost of the active power filter installed on the low-voltage side of the transformer in the distribution network as the objective function and takes the allowable value of the harmonic current injected into the common connection point, the distortion rate, and the content rate of the harmonic voltage as constraints.
The objective function is as follows:
where: S is the rated capacity of the active filter, b0 and b1 are the base price of the active filter of 400,000 yuan and the coefficient between the capacity and the cost of 450,000/MVA.
where: HRUh is the h harmonic voltage content rate, Uh is the effective value of the h harmonic voltage, U1 is the effective value of the fundamental voltage, UTHD is the total distortion rate of the harmonic voltage, IBh and Ih0 are the harmonic current injected into the common connection point and the allowable value of the harmonic current.
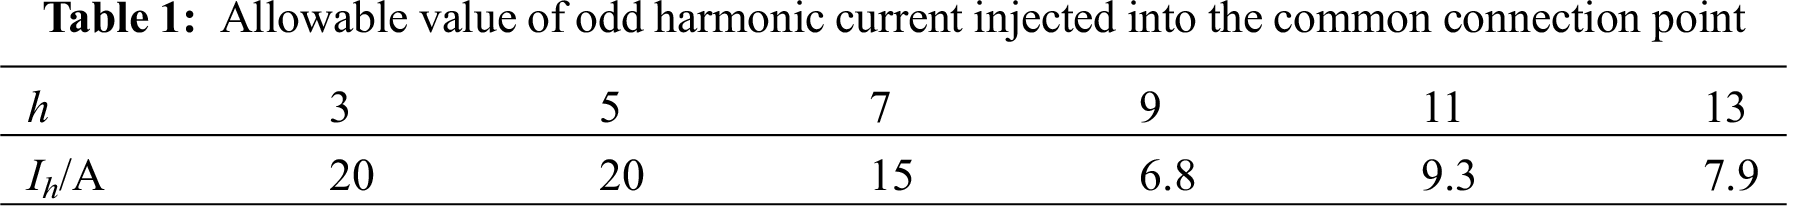
According to the national standard [19], the limit value of harmonic voltage content rate of 10 kV distribution network is 3.2%, the limit value of total harmonic voltage distortion rate is 4%, and the allowable value of odd harmonic current injected into the common connection point (the reference short-circuit capacity is 100 MVA) is shown in Tab. 1.
5 Multi-Objective Optimization Algorithm Based on Matlab and OpenDSS
To optimize the overall resource configuration of the power grid after the large-scale electric furnace is connected to the distribution network, it is necessary to effectively solve the multi-objective reactive power optimization model and the filter optimization configuration model. This paper builds a computing platform shown in Fig. 4 based on the Matlab and OpenDSS platforms.
The entire calculation platform mainly includes three calculation modules: (1) the three-phase power flow calculation module of the distribution network, (2) distribution network harmonic calculation module, (3) comprehensive resource optimization configuration module. OpenDSS is used for three-phase power flow calculation and harmonic calculation of distribution network [17,18], and optimal allocation of comprehensive resources is realized on the MATLAB platform. Based on the component object (OpenDSSEngine.DLL), data communication between the OpenDSS calculation program and other calculation and analysis modules of the MATLAB platform can be realized [24].
Set up the OpenDSS/MATLAB joint simulation platform: Firstly, build a district distribution network model on the OpenDSS software and perform fast power flow calculations and harmonic calculations. Secondly, complete the establishment of the governance device model and parameter settings in MATLAB and the above-established improved particle swarm optimization algorithm. The two software exchange information through the COM interface [25]. The direct control of the treatment device is realized in MATLAB. The node voltage, power loss, and harmonic components calculated by OpenDSS flow are returned to the MATLAB optimization algorithm part through the COM interface to determine whether the constraint conditions are met. The above process is repeated until the optimization ends.
In this paper, the overall flow chart of the establishment and solution of the comprehensive resource optimal allocation model of the distribution network after the large-scale application of electric kilns is shown in Fig. 5.
(1) Build the IEEE33-node distribution network model after the large-scale access of electric kilns in OpenDSS and set network operating parameters and harmonic source spectrum parameters for fast power flow calculation. Realize data transmission between node voltage, power factor, and active power in OpenDSS and MATLAB through a COM interface.
(2) In the first stage of optimization, a multi-objective reactive power optimization model is constructed in MATLAB. Use particle swarm algorithm to find the optimal installation position and compensation capacity of parallel and series reactive power compensation devices.
(3) Analyze the harmonics of the distribution network and realize the data transmission of each node’s harmonic components in OpenDSS and MATLAB through the COM interface.
(4) In the second stage of optimization, the active filter optimal configuration model is constructed in MATLAB. The particle swarm algorithm is used to find the optimal compensation capacity of APF.
(5) Output the optimization results of the first stage and the second stage.
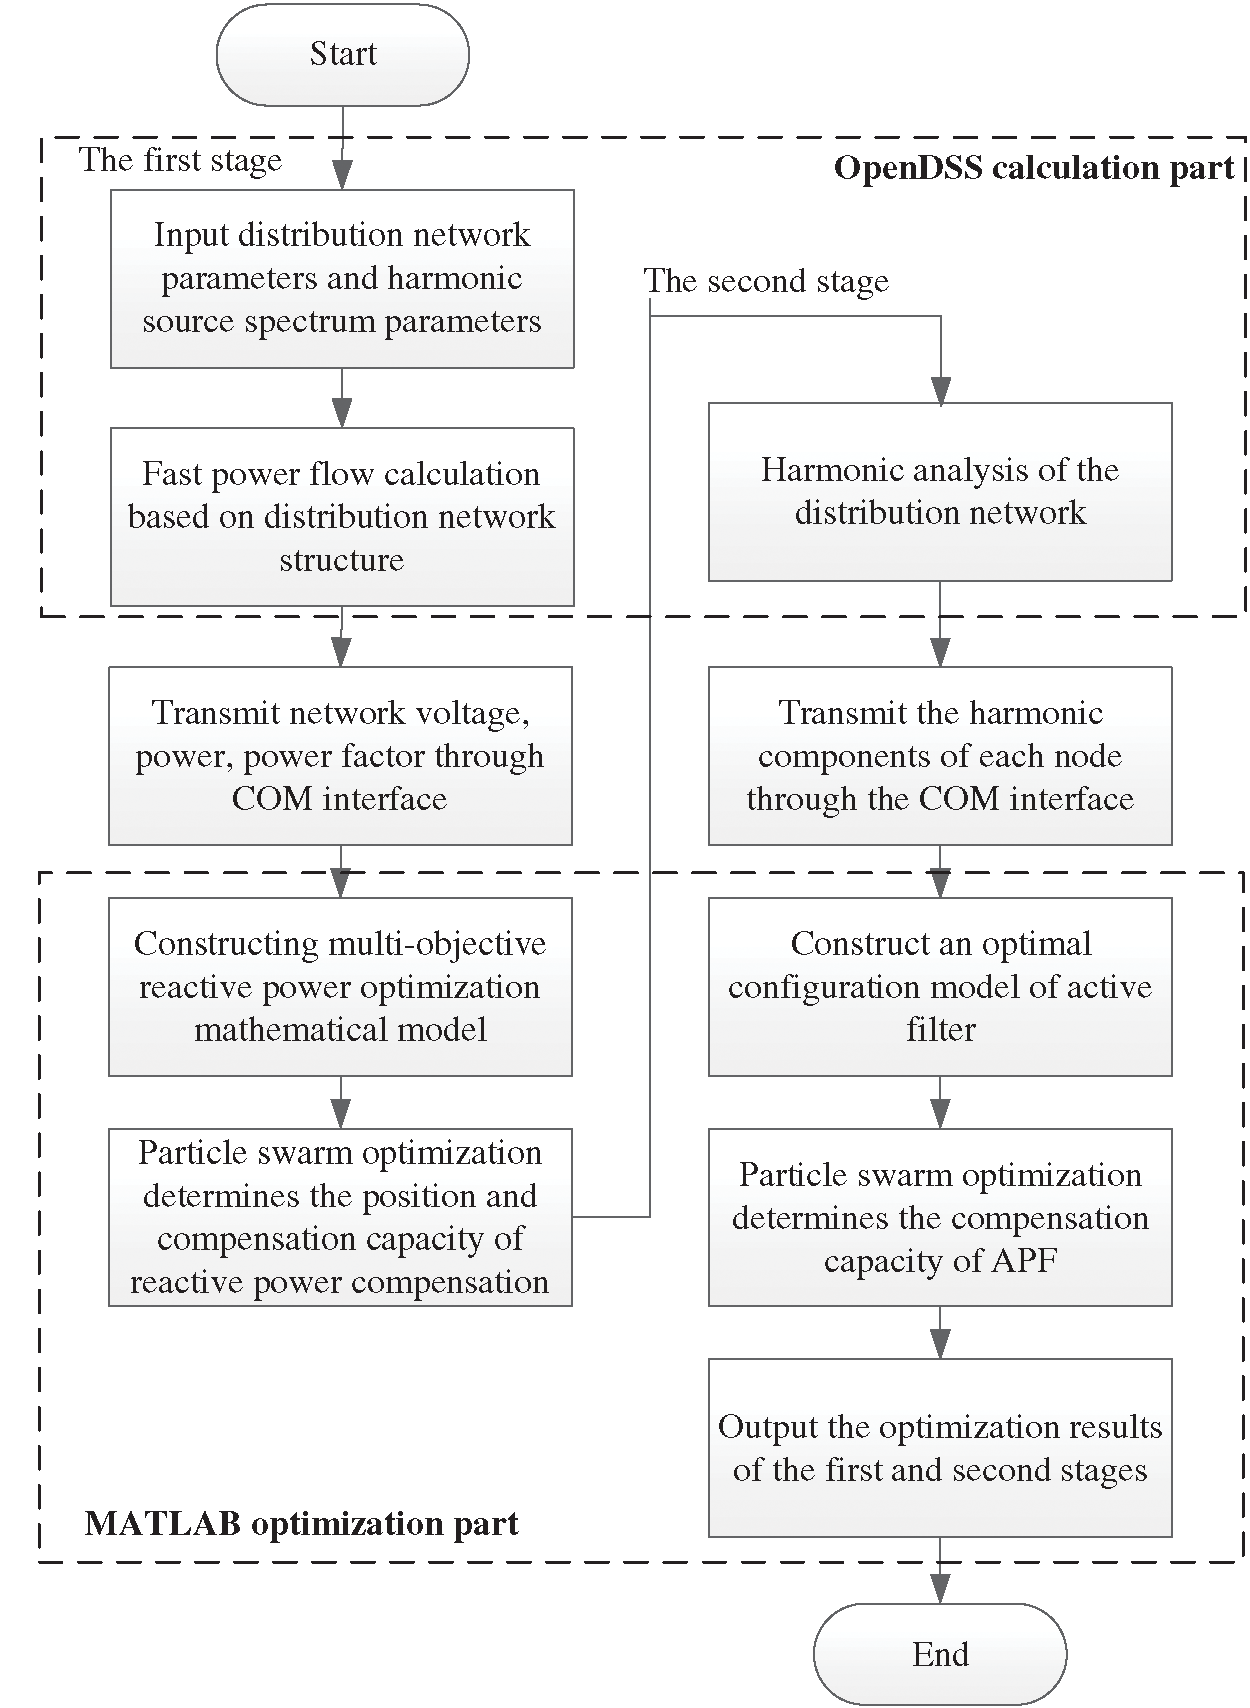
Figure 5: MATLAB and OpenDSS interaction diagram
The installation location and capacity of the optimized management device after the electric kiln scale is connected with the IEEE33 node network as the prototype, the IEEE33 distribution network node diagram is shown in Fig. 6. The calculation example is a 10 kV power distribution line with IEEE33 nodes. The first section of the network is a balanced node, and its voltage is assumed to be 10.5 kV, and the remaining nodes are all PQ nodes. When the replacement load is not connected, the total network load in the system is 5084.26 + j2547.32 kVA. The qualified range of the node voltage is ±6% of the reference value voltage, and the capacity range of the parallel reactive power compensation device connected at a single node is 0–1500 kVar. The capacity range of the fixed series compensation device is 0–0.06 Ω.
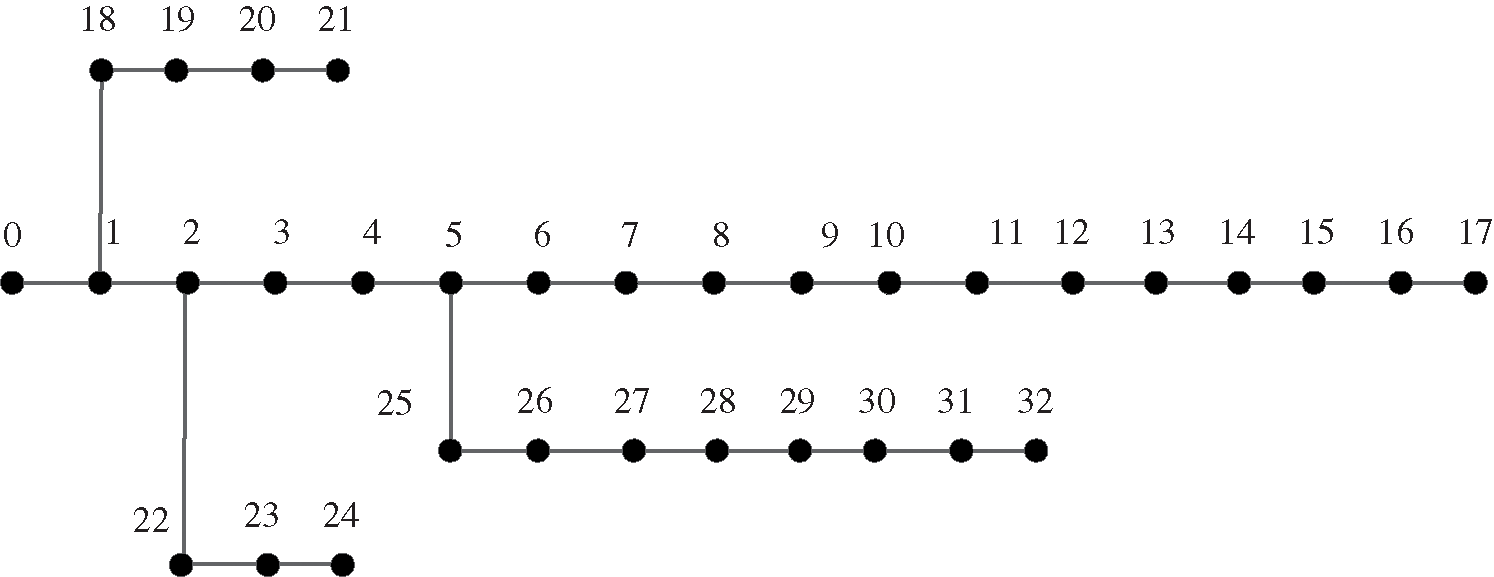
Figure 6: IEEE33 distribution network node diagram
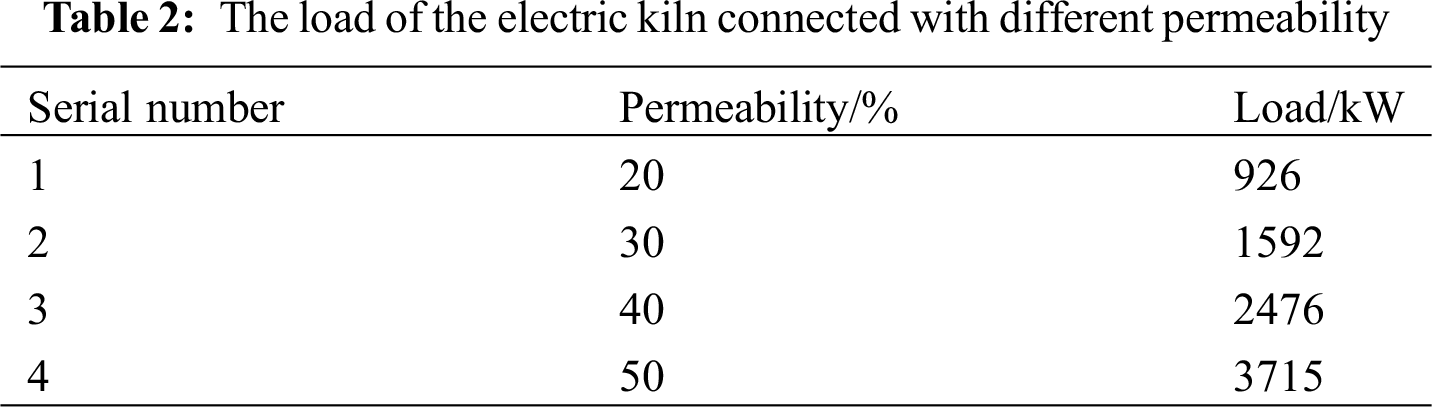
Start the penetration rate of the electric furnace from 20% and gradually increase to 30%, 40%, and 50%. When the distribution network is connected to electric kiln loads with different penetration rates, the distribution network is optimized for reactive power optimization and harmonic control in a two-stage grid comprehensive resource optimization configuration. Tab. 2 shows the electric furnace load when the distribution network is connected to different penetration rates.
6.1 Analysis of the First Stage Optimization Results
To study the reactive power optimization configuration of the distribution network after the large-scale connection of electric kilns, several electric kiln equipment with a power factor of 0.8 and a load capacity of 25 + j20kVA were connected in the station area. The penetration rate of the electric furnace load of the distribution network is 20%, 30%, 40%, and 50%, respectively. After being connected in the four scenarios, the operation of the electric furnace is studied. The reactive power compensation optimization calculation is carried out using a series and parallel reactive power compensation devices. The reactive power compensation response strategy under the large-scale application of electric kilns is proposed. The installation position and capacity of the optimized reactive power compensation device and the comparison of the distribution network situation before and after optimization are shown in Tab. 3 and Tab. 4. The comparison of node voltages before and after compensation is shown in Fig. 7.
(1) With the gradual increase in the penetration rate of electric kilns, due to insufficient reactive power in the system, to further increase the distribution network’s voltage level and reduce network losses, it is necessary to allocate reactive resources and optimize reactive power rationally. Simple parallel compensation can solve the reactive power problem in the low-permeability scenario. However, as the penetration rate increases, the simple parallel reactive power optimization is not enough to solve the reactive power problem. The combination of series compensation and parallel compensation is used to install two fixed series reactive power compensation devices and three parallel reactive power compensation devices in the distribution network, which can quickly and improve the distribution. The voltage level of the grid.
(2) The reactive power compensation device is optimized in four scenarios where the electric furnace load penetration rate is 20%, 30%, 40%, and 50%. Due to the relatively abundant reactive power resources of the system, the minimum node voltage of each node before and after optimization increased from 0.8739 p.u., 0.8159 p.u., 0.7366 p.u. and 0.5497 p.u. to 0.9552 p.u., 0.9857 p.u., 0.9853 p.u. and 0.9346 p.u. The minimum node voltage is greater than 0.93 pu. The voltage qualification rate is significantly improved, and the power factor can reach 0.95 or more after compensation, which significantly improves the quality of power supply for users.
(3) After optimized calculation, the reactive power compensation capacity and supplementary points of the network line are increased, which reduces the active power loss of the entire line, saves economic expenditures, and increases the economic benefits of the enterprise.
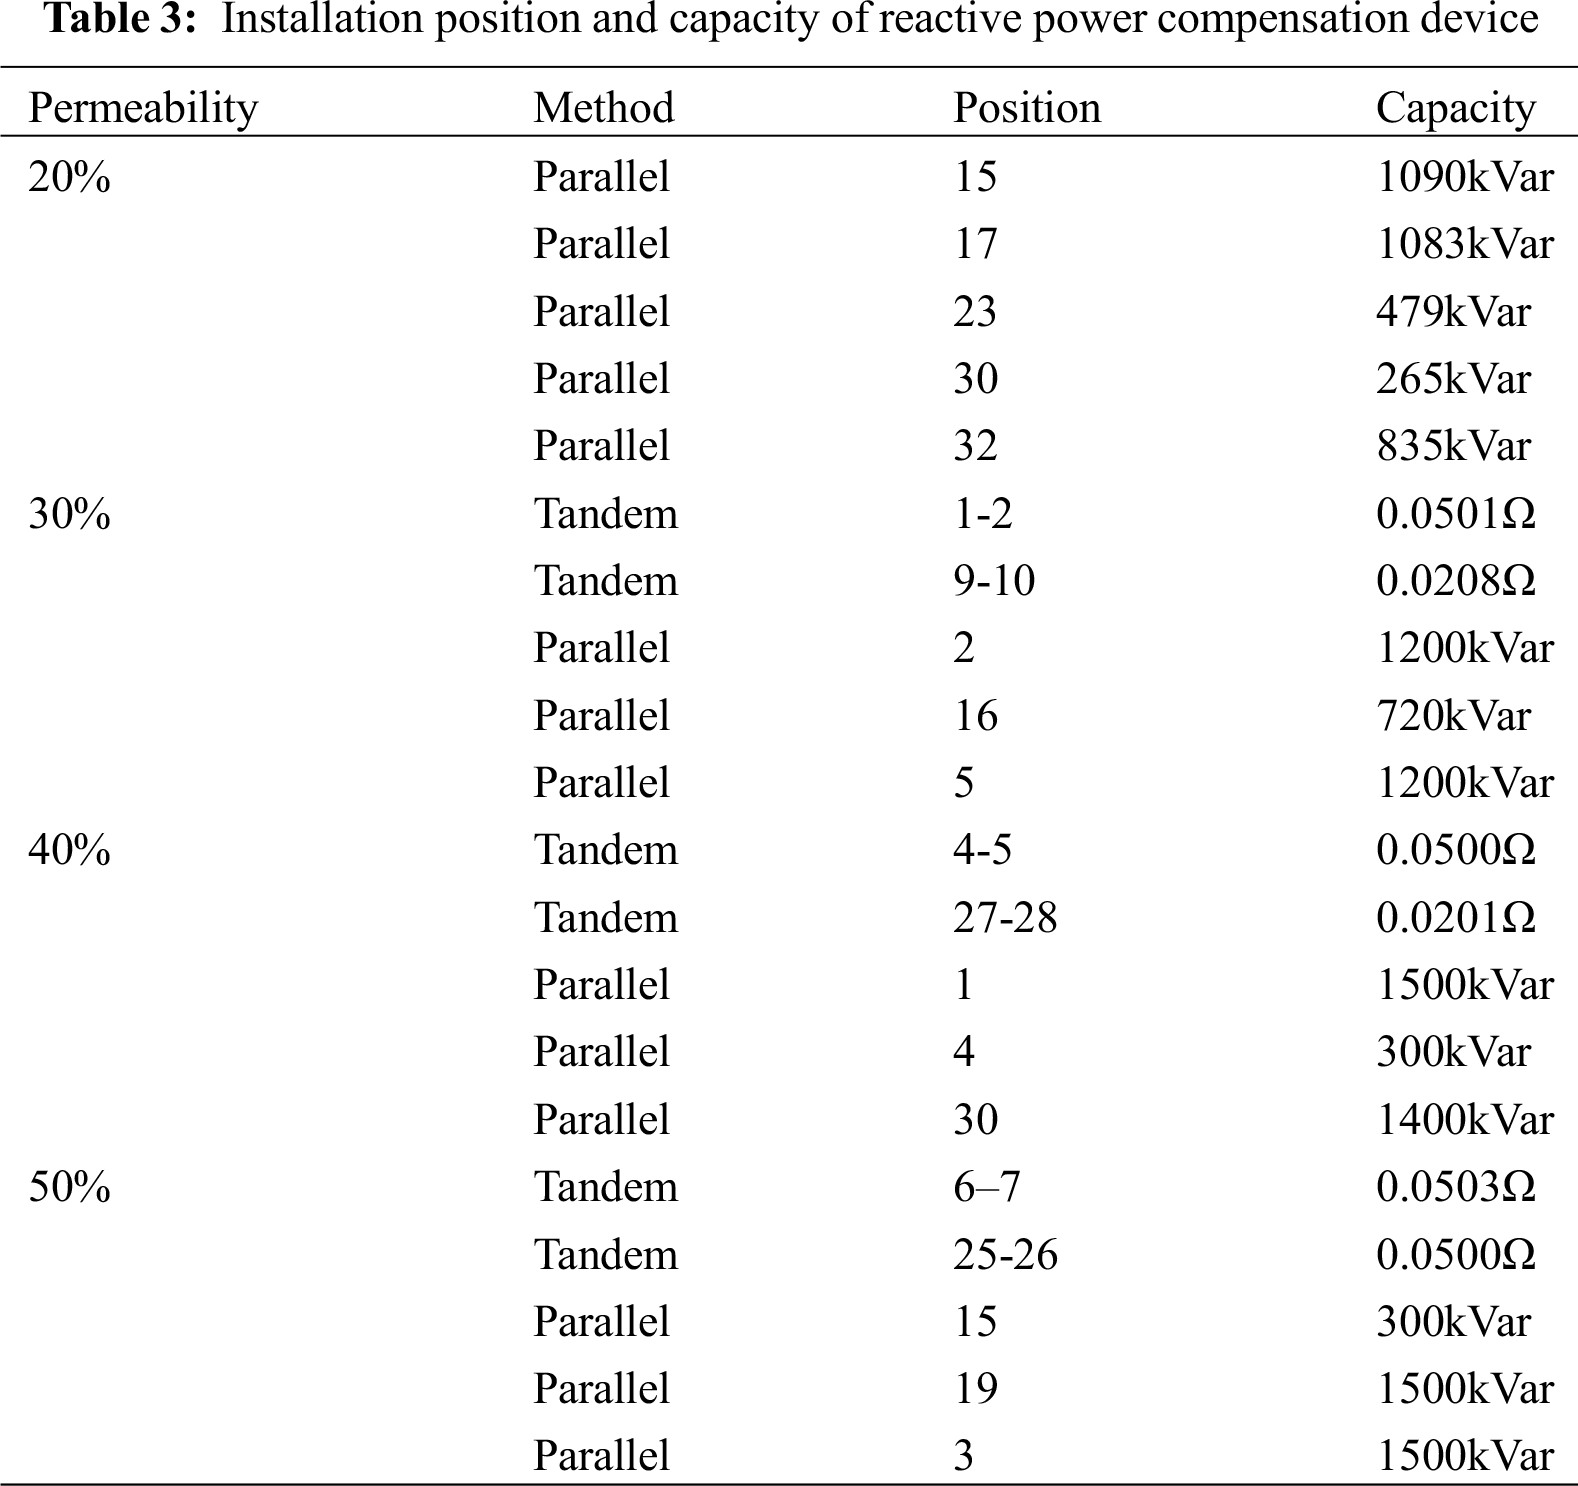
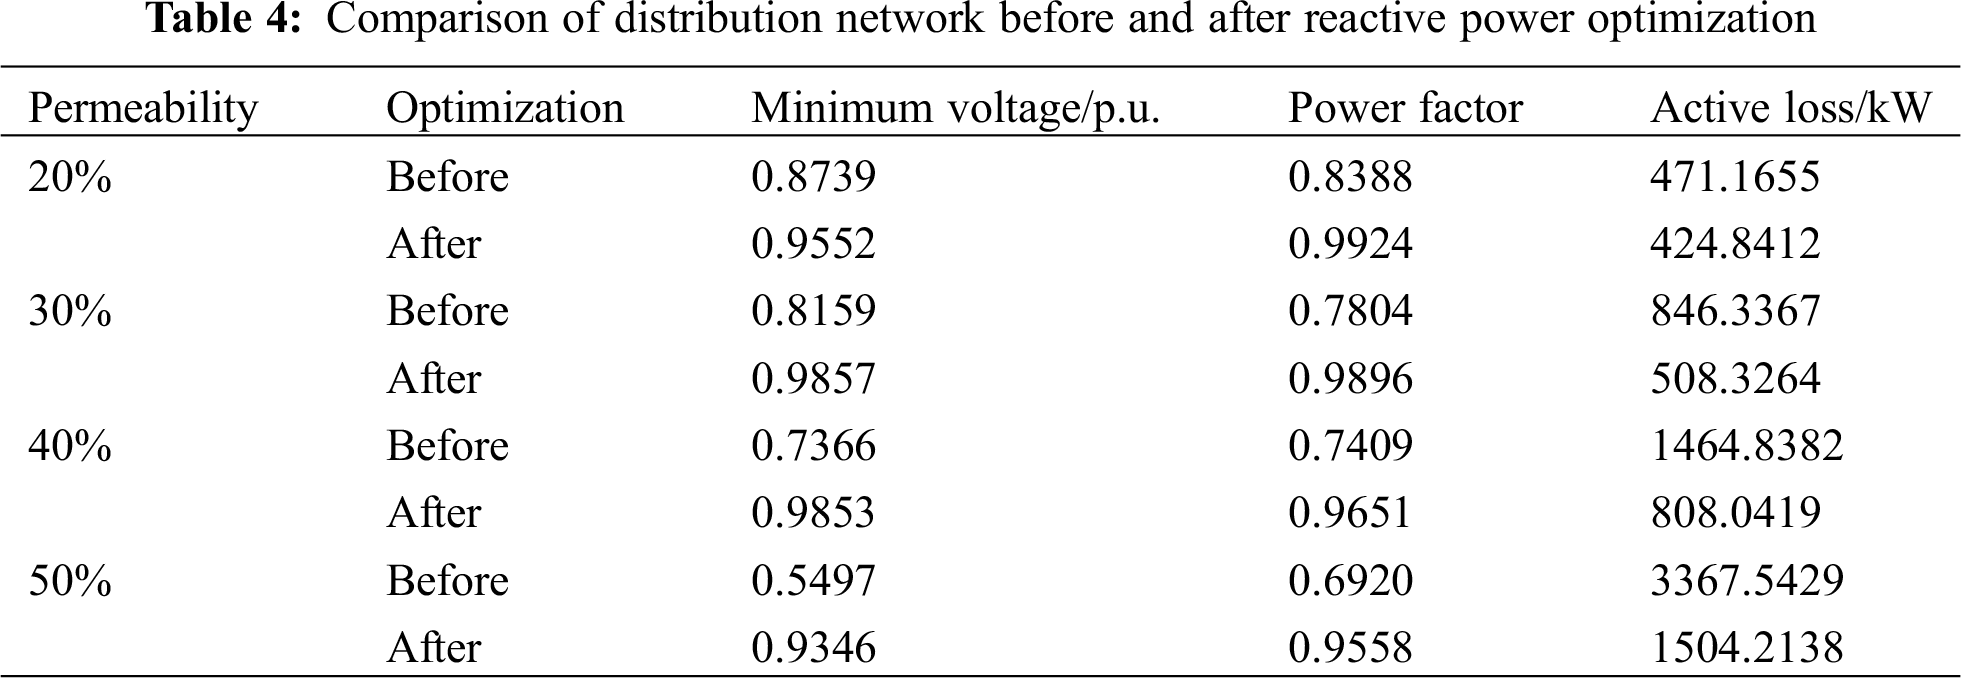
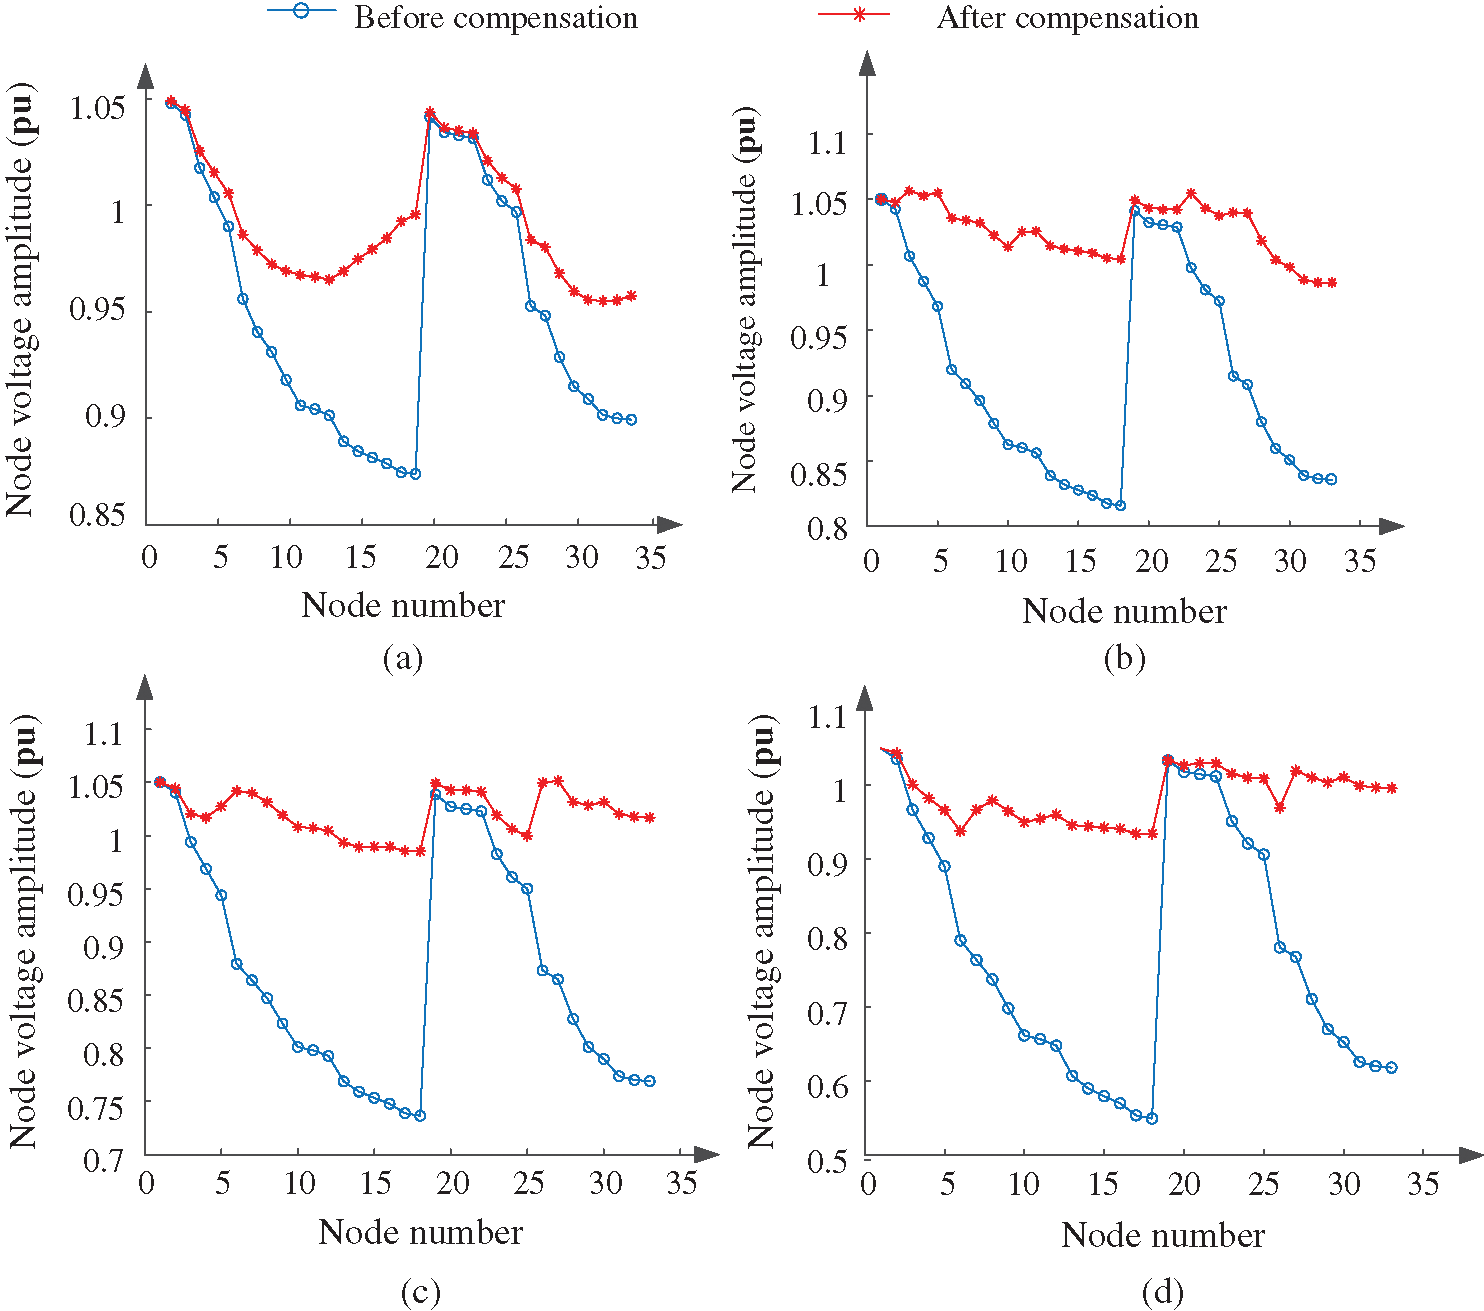
Figure 7: Comparison diagram of node voltage after reactive power optimization under different permeability (a) 20% penetration (b) 30% penetration (c) 40% penetration (d) 50% penetration
6.2 Analysis of the Second Stage Optimization Results
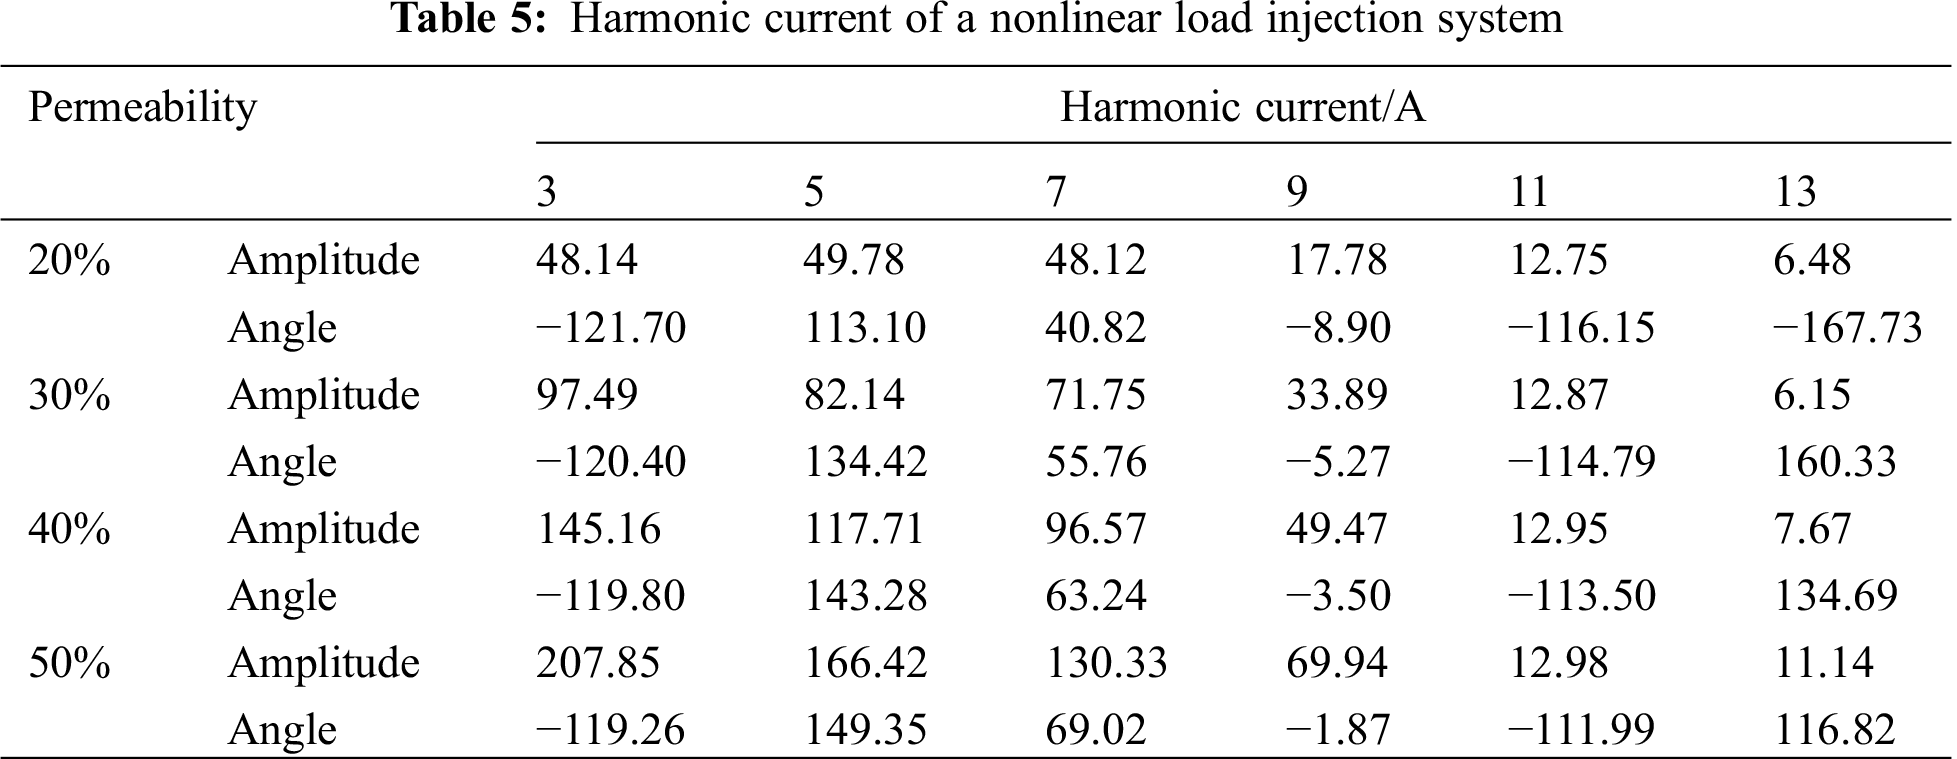
The calculation example continues to use the IEEE33 node power distribution system, the system reference voltage is 10.5 kV, and the reference capacity is 10MVA. The harmonic control of the large-scale application of the harmonic source electric kiln mainly considers four application scenarios with a penetration rate of 20%–50%. The harmonic currents of the common connection points are shown in Tab. 5.
The optimized configuration of active filters is carried out on the IEEE33 distribution network connected to electric furnaces on a large scale. The optimal configuration of active filters is shown in Tab. 6.
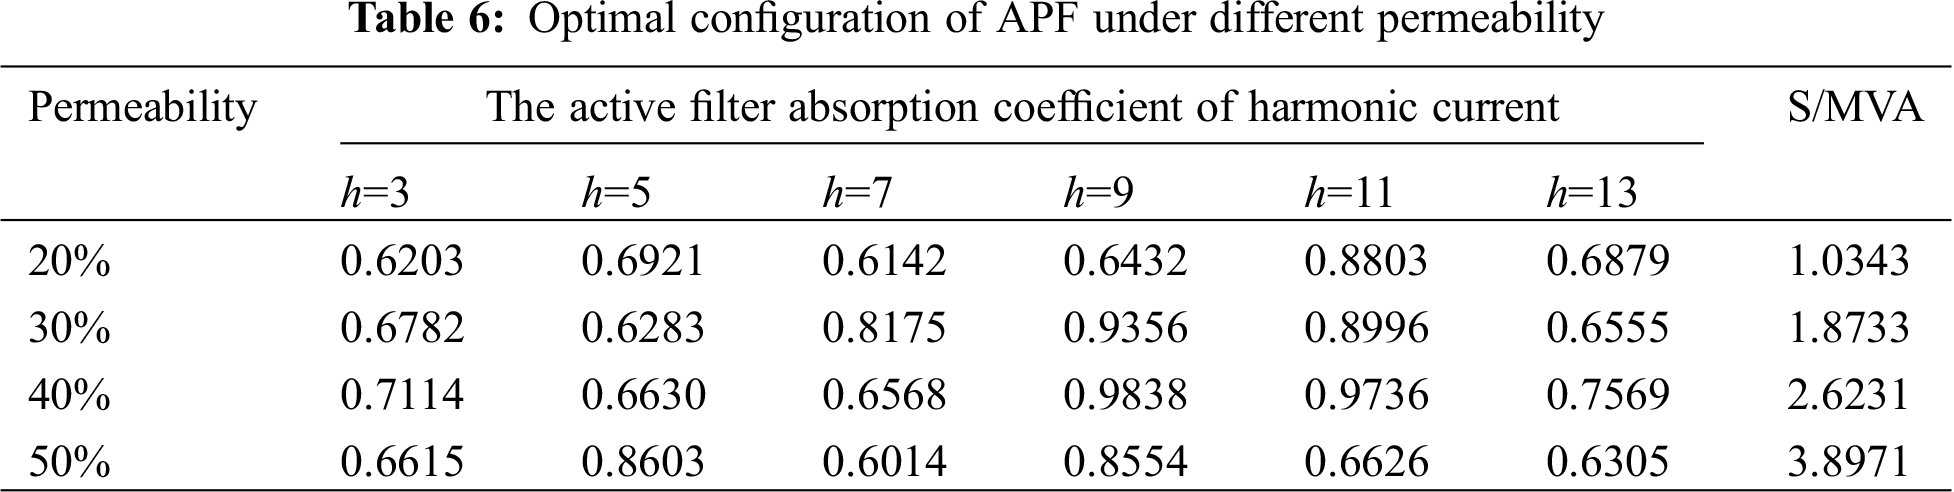
After optimizing the active filter configuration in the distribution network, the total harmonic voltage distortion rate of the distribution network for each scenario under different penetration rates is 0.42%, 0.64%, 0.89%, and 1.23%, which are all dropped to within 4%. The harmonic currents of the common connection points are all less than the allowable value of the harmonic current specified in the national standard, which improves the operating conditions of the system.
This paper studies a two-stage power grid comprehensive resource optimization model after the large-scale integration of electric kiln equipment, considering reactive power optimization and harmonic control. The paper proposes a multi-objective optimization algorithm based on the joint simulation platform of Matlab and OpenDSS. It solves low voltage, harmonics, and high reactive power loss in the distribution network after the large-scale electric furnace is connected to the distribution network. Details of the algorithm are as follows:
(1) At a penetration rate of 20%, install a parallel capacitive reactive power compensation device. The optimization result is that it is close to the side with a heavier load to better control the effect. However, the voltage deviation phenomenon is caused by the distribution network’s high penetration rate. The improvement is not apparent, and the desired governance effect cannot be achieved well;
(2) For distribution networks with 30%, 40%, and 50% permeability, the combination of series compensation and parallel compensation is adopted. The treatment effect is noticeable, and it can ensure the low voltage problem in the case of the high permeability of electric kilns. Improve, reduce active power loss simultaneously, and improve the economy of distribution network operation.
(3) The optimized configuration of active filters was carried out for the four scenarios after the large-scale application of electric kilns, which suppressed the voltage distortion rate, improved the power supply quality of the distribution network, and achieved good economic results.
Funding Statement: Science and Technology Project of State Grid Corporation of China, Scale application and benefit evaluation of typical power substitution technology considering power quality influence (52182018000H).
Conflicts of Interest: The authors declare that they have no conflicts of interest to report regarding the present study.
1. Zhang, Q. (2020). Implement the national development strategy and focus on improving investment efficiency and benefits. State Grid, 1, 71–73. DOI CNKI:SUN:GJDW.0.2020-01-029. [Google Scholar]
2. Xu, X. (2020). Promote electric energy substitution and expand integrated energy service channels. Rural Power Management, 1, 48–49. DOI CNKI:SUN:NDGL.0.2020-01-023. [Google Scholar]
3. Pei, H. B., Li, D. Z., Han, W. J., Guo, W. Z. (2016). Electric energy substitution technology for new energy consumption. Power Demand Side Management, 18(6), 45–48. DOI 10.3969/j.issn.1009-1831.2016.06.010. [Google Scholar] [CrossRef]
4. Wei, J. X., Ma, Z. B., Huang, S., Wang, H. P., Zhang, C. et al. (2016). Economic and environmental benefit analysis of “replace coal with electricity” in kiln production. North China Electric Power Technology, 3, 66–70. DOI 10.16308/j.cnki.issn1003-9171.2015.00.019. [Google Scholar] [CrossRef]
5. Jiang, T., He, W., Zhu, M. X., Sun, M. (2020). Research on the harmonic emission characteristics of electric kilns considering the interaction of network and load. Power Capacitors and Reactive Power Compensation, 41(3), 112–118. DOI 10.14044/j.1674-1757.pcrpc.2020.03.019. [Google Scholar] [CrossRef]
6. Le, J., Wang, C., Li, X. R., Zhou, Q. (2019). Multi-objective distributed optimization control strategy for medium voltage distribution network. Journal of Electrotechnical Engineering, 34(23), 4972–4981. DOI 10.19595/j.cnki.1000-6753.tces.181408. [Google Scholar] [CrossRef]
7. Dong, P., Xu, L. D., Liu, M. B. (2014). Multi-objective coordinated control of multi-site reactive power compensation device. Proceedings of the Chinese Society of Electrical Engineering, 34(4), 587–595. DOI 10.13334/j.0258-8013.pcsee.2014.04.010. [Google Scholar] [CrossRef]
8. Zhang, T., Xu, X. Q., Shi, S. Y., Sun, X. W. (2015). STATCOM location and capacity optimization based on improved multi-swarm quantum particle swarm algorithm. Proceedings of the Chinese Society of Electrical Engineering, 35(S1), 75–81. DOI 10.13334/j.0258-8013.pcsee.2015.S.010. [Google Scholar] [CrossRef]
9. Guo, Q. Y., Wu, J. K., Mo, C., Xu, H. H. (2018). New energy distribution network voltage and reactive power collaborative optimization model based on mixed integer second-order cone gauge. Proceedings of the Chinese Society for Electrical Engineering, 38(5), 1385–1396. DOI 10.13334/j.0258-8013.pcsee.170247. [Google Scholar] [CrossRef]
10. Li, P. C., Duan, X. Y., Yang, J., Hu, Z. (2017). Coordinated EV charging and reactive power optimization for radial distribution network using mixed integer second-order cone programming. 2017 IEEE Transportation Electrification Conference and Expo. Asia-Pacific, pp. 1–5. Harbin: IEEE. DOI 10.1109/itec-ap.2017.8080845. [Google Scholar] [CrossRef]
11. Ge, Z. H., Wang, Y., Liu, M. Y., Qi, X. G., Lin, R. et al. (2018). Active distribution network multi-objective dynamic reactive power optimization based on adaptive particle swarm optimization algorithm. Journal of Electric Power System and Automation, 30(11), 44–51. DOI 10.19635/j.cnki.csu-epsa.000055. [Google Scholar] [CrossRef]
12. Yang, D. C., Liao, W. L., Sun, X., Tang, W., Geng, G. F. (2017). Active distribution network reactive power optimization based on satisfaction threshold judgment. Power System Technology, 41(9), 3003–3010. DOI 10.13335/j.1000-3673.pst.2017.0119. [Google Scholar] [CrossRef]
13. Fu, X. Y., Wang, R. T., Wang, J. Z., Ji, Y. C., Wang, Y. F. (2007). Optimal configuration of active filter based on PSO algorithm. Electrical Application, 26(2A), 62–64. DOI 10.3969/j.issn.1672-9560.2007.02.017. [Google Scholar] [CrossRef]
14. Weng, L. M., Wang, M. (2000). Application of improved genetic algorithm to restrain harmonics in distribution system. Power System Technology, 22(4A), 23–26. DOI 10.13335/j.1000-3673.pst.2000.04.006. [Google Scholar] [CrossRef]
15. Lin, D. X. (2015). Research on optimal configuration of distribution network filters based on hybrid particle swarm algorithm. Northeast Petroleum University. DOI 10.3969/j.issn.1000-3886.2015.01.026. [Google Scholar] [CrossRef]
16. Li, Z. G., Dong, F. Z., Li, Y. (2014). Simulation analysis of short circuit impulse test of series compensation capacitor. China Electric Power, 47(3), 101–106. DOI 10.1004-9649(2014)03-0101-06. [Google Scholar]
17. Deng, C. H., Ma, Q., Xiao, Y., You, J. B., Li, S. C. (2014). Reactive power optimization method based on self-learning transfer particle swarm optimization and Gaussian penalty function. Power System Technology, 38(12), 3341–3346. DOI 10.13335/j.1000-3673.pst.2014.12.011. [Google Scholar] [CrossRef]
18. Liu, S. F., Wang, H., Wu, G., Wang, B. D., Zhao, X. Q. (2019). Distribution network optimization considering series compensation and parallel compensation. Power Capacitors and Reactive Power Compensation, 40(6), 18–23. DOI 10.14044/j.1674-1757.pcrpc.2019.06.004. [Google Scholar] [CrossRef]
19. GB/T 14549–1993 (2018). Power quality public grid harmonics. Beijing: National Bureau of Technical Supervision. [Google Scholar]
20. Shen, G., Tan, T. Y., Le, J. (2009). Research on power filtering technology. Jilin Electric Power, 37(1), 20–23. DOI 10.16109/j.cnki.jldl.2009.01.021. [Google Scholar] [CrossRef]
21. Tan, Q. M., Cui, H., Zhang, Z. J. (2016). The application of an advanced series-parallel comprehensive compensation device in the distribution network. Power Capacitors and Reactive Power Compensation, 37(4), 1–6. DOI 10.14044/j.1674-1757.pcrpc.2016.04.001. [Google Scholar] [CrossRef]
22. Lin, C., Ma, Q. F., Yu, Q. Y., Sun, B., Fu, J. B. et al. (2018). Parallel modeling and resonance analysis of modular APF. Electrical Measurement and Instrumentation, 55(9), 52–57. DOI 10.1001-1390(2018)09-0052-06. [Google Scholar]
23. Yang, W. Y., Liu, J., Yu, J. M., Gao, X. (2004). Application of improved adaptive genetic algorithm in harmonic suppression of distribution network. Relay, 4, 24–27+35. DOI 1003-4897(2004)04-0024-04. [Google Scholar]
24. Dugan, R. C. (2012). Reference guide: The open distribution system simulator TM (OpenDSS)Palo Alto, pp. 118–194. California: Electric Power Research Institute. [Google Scholar]
25. Wang, C. S., Nie, T., Xu, R. L., Li, P., Li, C. B. (2014). Analysis of the impact of distributed power access on distribution network reconfiguration. Journal of Tianjin University: Natural Science and Engineering Technology Edition, 47(3), 1. DOI 10.11784/tdxbz201206043. [Google Scholar] [CrossRef]
 | This work is licensed under a Creative Commons Attribution 4.0 International License, which permits unrestricted use, distribution, and reproduction in any medium, provided the original work is properly cited. |