| Energy Engineering |
DOI: 10.32604/EE.2021.015574
ARTICLE
Assessment of the Rural Water Supply Potential by Mechanical Wind Pumping Around the Floodplains of Lake Chad
1University of Maroua, Maroua, Cameroon
2Université de Lorraine, LMOPS-EA 4423, Metz, 57070, France
3CentraleSupélec, LMOPS, Metz, 57070, France
*Corresponding Author: Dieudonné Kaoga Kidmo. Email: kidmokaoga@gmail.com
Received: 28 December 2020; Accepted: 21 April 2021
Abstract: In the present work, an assessment of the rural water supply potential by mechanical wind pumping around the floodplains of Lake Chad has been considered. Inside the floodplains around Lake Chad, available surface water is largely contaminated and represents health hazards to populations. Access to underground and clean water has increasingly become rare. Moreover, clean water scarcity has led to conflict and territorial pressures, which are contributing factors to poverty in the considered area. Four localities, Baga, Baga-Sola, Makari and Nguigmi, respectively, in Nigeria, Chad, Cameroon and Niger have been selected inside the floodplains around Lake Chad, to evaluate the potential of wind power and prospects of windmills development to provide safe drinking-water supply, livestock watering and small-scale irrigation. Long-term satellite-derived data, obtained through the Prediction of Worldwide renewable Energy Resources have been considered suitable and viable alternative to missing site-specific data from ground stations. Windmill of Multi-blade driven piston pump is the preferred water pumping option for this study because of its higher overall system efficiency. The results of this study indicate that mean wind speeds, at 10 m height above ground level, are 4.64 m/s for Baga, 4.76 m/s for Baga-Sola, 4.32 m/s for Makari and 4.44 m/s for Nguigmi. In addition, wind speeds for Baga, for instance, are in the range of 2.5–10 m (working range of a wind pump), at 10, 15, 20 and 25 m height agl, for 79.64, 82.80, 84.79, and 86.19 per cent of the time. Corresponding values for Baga-Sola, Makari and Nguigmi are in the range of 80.50–87.76 per cent, 76.86–85, 58 per cent, 77.92–86.21 per cent, respectively. For a Windmill with a 2 m-blade, a 25 m-height tower and considering a total dynamic head of 30 m, average monthly discharges for the dry season are 1,330, 1,374, 1,200 and 1,199 m3, respectively for Baga, Baga-Sola, Makari and Nguigmi. Furthermore, corresponding costs of water are 9.53, 9.23, 10.56 and 10.57 XAF/m3, for Baga, Baga-Sola, Makari and Nguigmi, in that order.
Keywords: Wind energy; windmill; water pumping; lake chad
Nomenclature
| f(V) | Probability distribution function |
| F(V) | Cumulative distribution function |
| V | Wind speed (m/s) |
| Vm | Mean wind speed (m/s) |
| C | Scale parameter (m/s) |
| Z | Elevation (m) |
| T | Temperature at the considered site (°K) |
| agl | Above ground level |
| V10 | Wind speed available at 10 m height agl |
| z10 | 10 m height agl |
| n | Power law exponent |
| C10 | Scale parameter (m/s) at 10 m height agl |
| Vz | Wind speed at the height to be extrapolated |
| H | Pump head (m) |
| g | Acceleration due to gravity (m/s2) |
| Vw | Volume of water (m3) |
| EH | Hydraulic energy |
| KO | Pump constant |
| VI | Cut-in wind speed (m/s) |
| C | Scale parameter (m/s) |
| C0 | Power coefficient of the rotor at the design point |
| CP | Power coefficient of the rotor |
| PV | Power developed by the system in pumping water |
| ρa | Air density at the site |
| A | Rotor area (m²) |
| η | Pump and transmission efficiency |
| CP·η | Overall system (wind to water) efficiency |
| Cz | Scale parameter (m/s) at z m height agl |
| z | Desired height agl |
| ρw | Water density (kg/m3) |
Wind energy is now widely seen as an environmentally friendly alternative energy for a sustainable development as well as for easing energy crisis [1], mainly in Sub-Saharan Africans countries. As such, a wind energy conversion system harnesses the power of wind and converts it into electrical or mechanical energy to improve access to electricity or water [2] for remote locations not connected to the grid. For locations where low wind speeds prevail, such as most Sub-Saharan African countries, low wind speed wind turbine technology, such as pumping applications for water supply, are the preferred option [3].
In Sub-Saharan Africa, around 40 per cent of people do not have access to clean and safe water, and more than 8 out 10 people in rural areas are without improved drinking water sources, where they continue to live largely through primitive subsistence farming [4]. The majority of people in rural areas inside the floodplains around Lake Chad, most of whom are low-income households, have limited access to affordable and reliable modern energy services. The lack of dissemination of modern energy services in the aforesaid areas offers prospects for the penetration of renewable energy such as wind energy. The potential for extensive use of wind pumping is significant as the average wind speeds, which are 4.64 m/s for Baga, 4.76 m/s for Baga-Sola, 4.32 m/s for Makari and 4.44 m/s for Nguigmi, are sufficient for water pumping [5]. Therefore, the use of mechanical wind driven systems for clean and safe water pumping in the aforementioned locations can provide a valuable prospect for meeting the greatest drinking water spending needs as well as improving health and increase the productive capacity of households [6].
The current contribution investigates wind energy using mechanical wind driven systems for water pumping, with an objective of evaluating the potential of mechanical wind pumping to improve rural water supplies around Lake Chad floodplains. The Rayleigh distribution, which is the Weibull distribution with a shape parameter k = 2, has been considered adequately accurate to model wind regimes at the selected locations. The power curve model of the considered windmills has been defined in a quadratic form [7,8]. The costs per cubic meter of water discharged using the Present Value of Costs (PVC) of energy produced over the lifetime of Windmills are explored for the selected localities. Windmills of different rotors sizes, ranging from 1.5 to 3 m are studied using TDH in the range of 10–30 m, in increments of 5 m. Long-term satellite-derived data, obtained through the POWER (Prediction of Worldwide renewable Energy Resources) [9], have been considered suitable and viable alternative to missing site-specific data from ground stations.
After a brief presentation of the selected study cases used in the current study, we provide the tools developed to elaborate the methodology for the modeling of the wind speed, the potentiality of mechanical wind pumping and of the cost of energy. Within these input data and modeling tools, we report and discuss the results obtained for the specific cases of the selected locations inside Lake Chad floodplains.
In this analysis, four selected locations inside Lake Chad floodplains are considered as seen (yellow color) in Fig. 1. The Lake is surrounded by Cameroon, Central African Republic (CAR), Chad, Niger and Nigeria, though its drainage basin, which covers around 8 per cent of the surface area of Africa, spreads over Algeria, Central African Republic (CAR), Libya and Sudan. The Saharan climate characterizes the Lake Chad Basin. The dry season usually lasts 8 months and is accompanied by Harmattan winds originated from the Sahara Desert. Lake Chad, a historically large and shallow, occupied first place among the endorheic lakes, up until 1960 [10]. Lake Chad is a vital source of fresh water to human, agriculture, livestock and wildlife and is a vast water lot surrounded by shoe string sand and floodplains [11]. The considered locations, Makari in Cameroon, Baga Sola in Chad, Baga in Nigeria and Nguigmi in Niger, were selected based on the potential of economic life as well as livelihood of rural communities residing on the lake shores. Makari is located on the East bank of a distributary of the Chari River in the delta just before it enters Lake Chad [12]. Baga is a city in the Northeastern Nigerian state of Borno, close to Lake Chad [10]. Baga and Baga Sola lie on the border of Lake Chad, are fishing centers as well as farming localities. Baga Sola is a locality on the shore of Lake Chad in western Chad. Nguigmi is a city in the easternmost part of Niger, on the shore of Lake Chad, whose primary economic activities are fishing and farming [13].
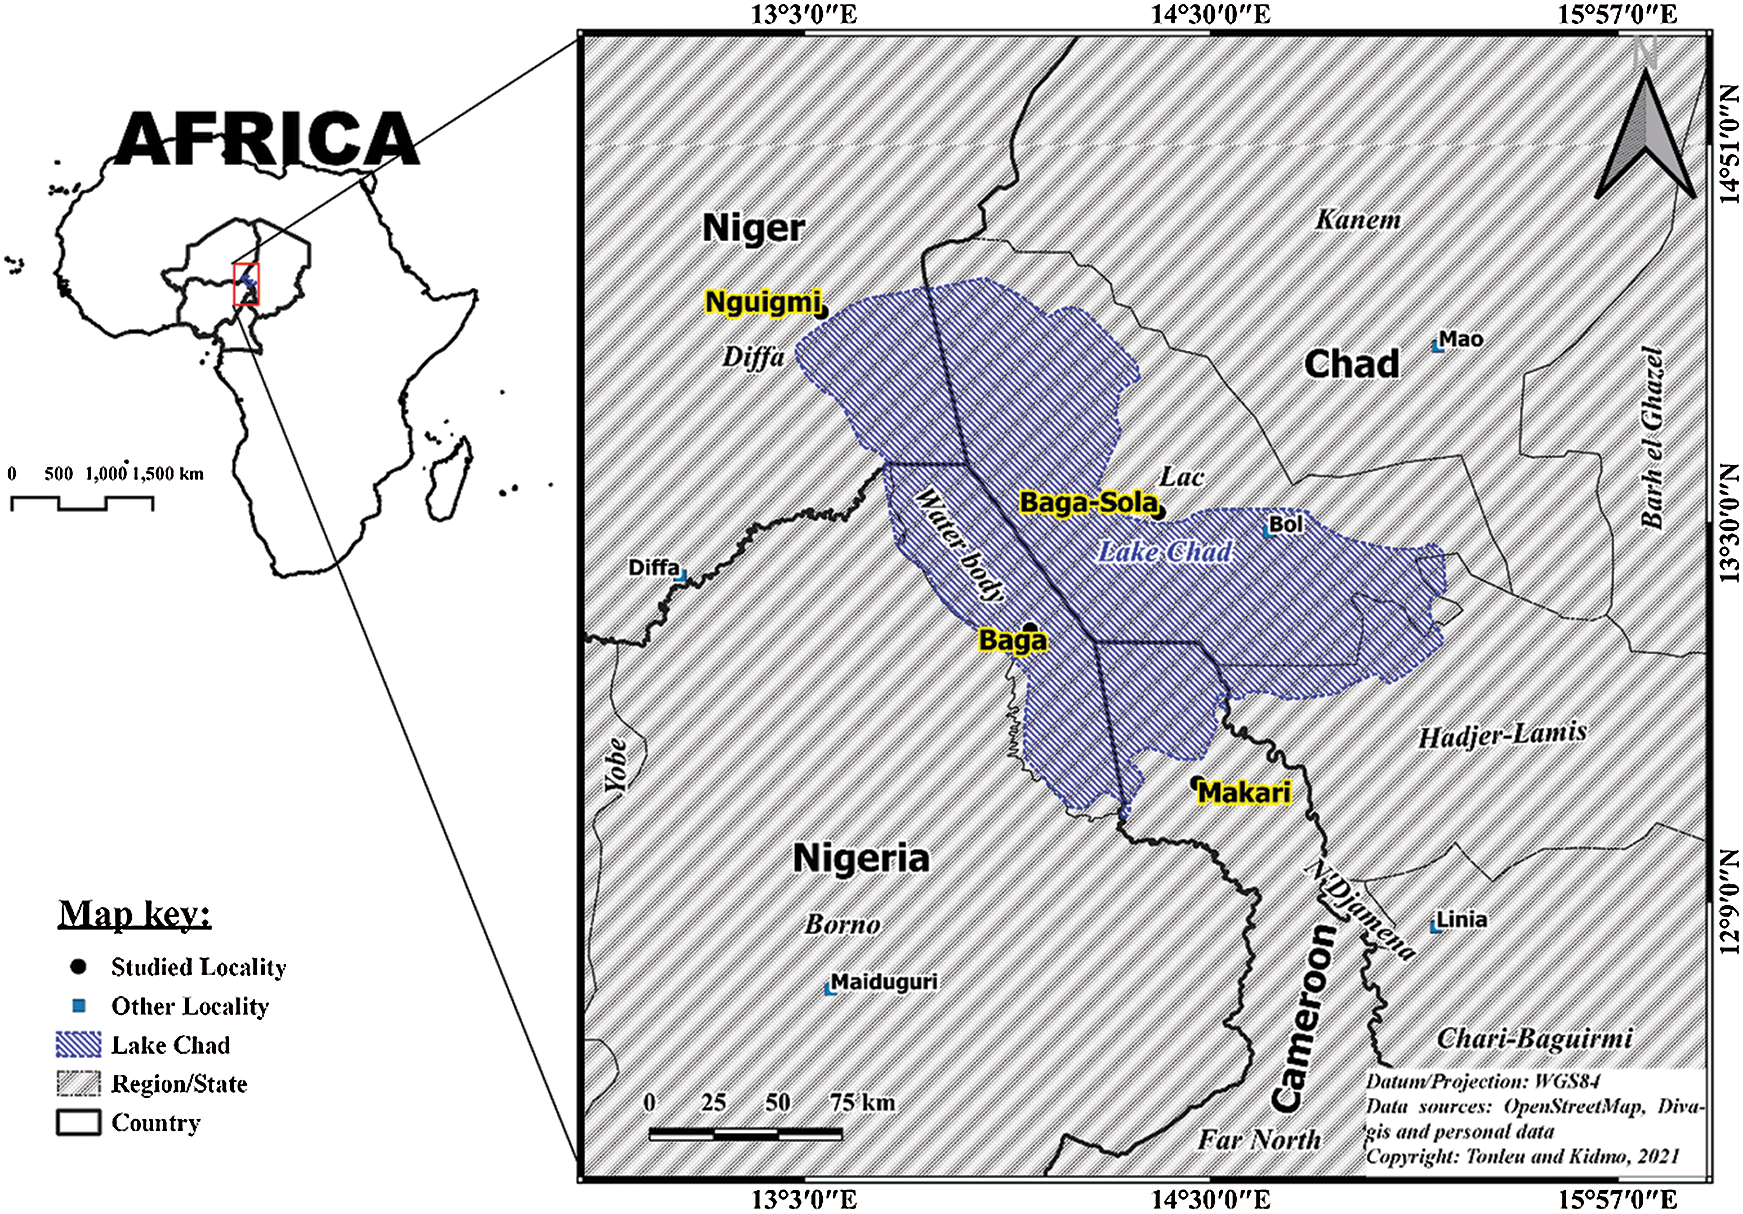
Figure 1: Map showing the four locations inside floodplains around Lake Chad
2.2 Wind Data Description and Source
Since ground-based measurement data are missing for the four selected locations, long-term satellite-derived data, obtained through the POWER, are considered suitable and viable alternative to site-specific data from ground stations [14–18]. These satellite-derived data are at daily level, at a 0.5 × 0.5-degree resolution. The time span of the presently used daily data is from January 2005 to January 2020. These data are obtained from the NASA Langley Research Center (LaRC) POWER Project funded through the NASA Earth Science/Applied Science Program [9]. Tab. 1 provides geographical coordinates of the selected locations, all of which are in the surroundings of the Lake’s floodplains, in its four border countries.
Table 1: Geographical data for the selected locations around Lake Chad
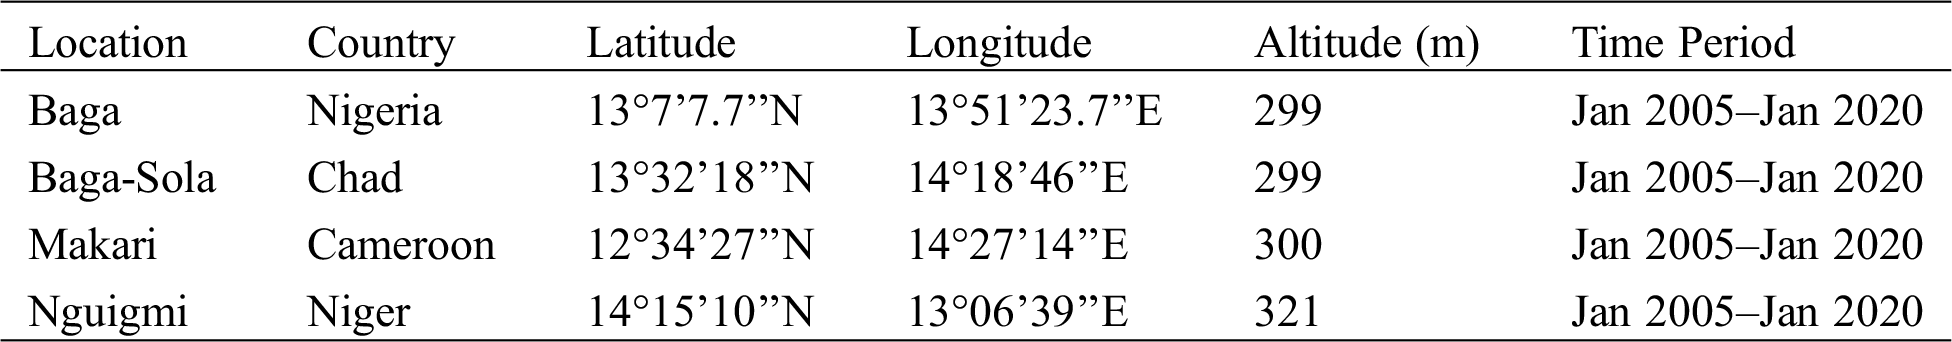
Fig. 2 provides monthly mean wind speed and standard deviation at 10 m height agl for Baga, Baga-Sola, Makari and Nguigmi. It is observed that higher mean wind speeds occur during the dry season (Jan-Jun and Nov-Dec), while lower values appeared in the rainy season (Jul-Oct). Average wind speeds, at 10 m height agl, are 4.64 m/s for Baga, 4.76 m/s for Baga-Sola, 4.32 m/s for Makari and 4.44 m/s for Nguigmi.
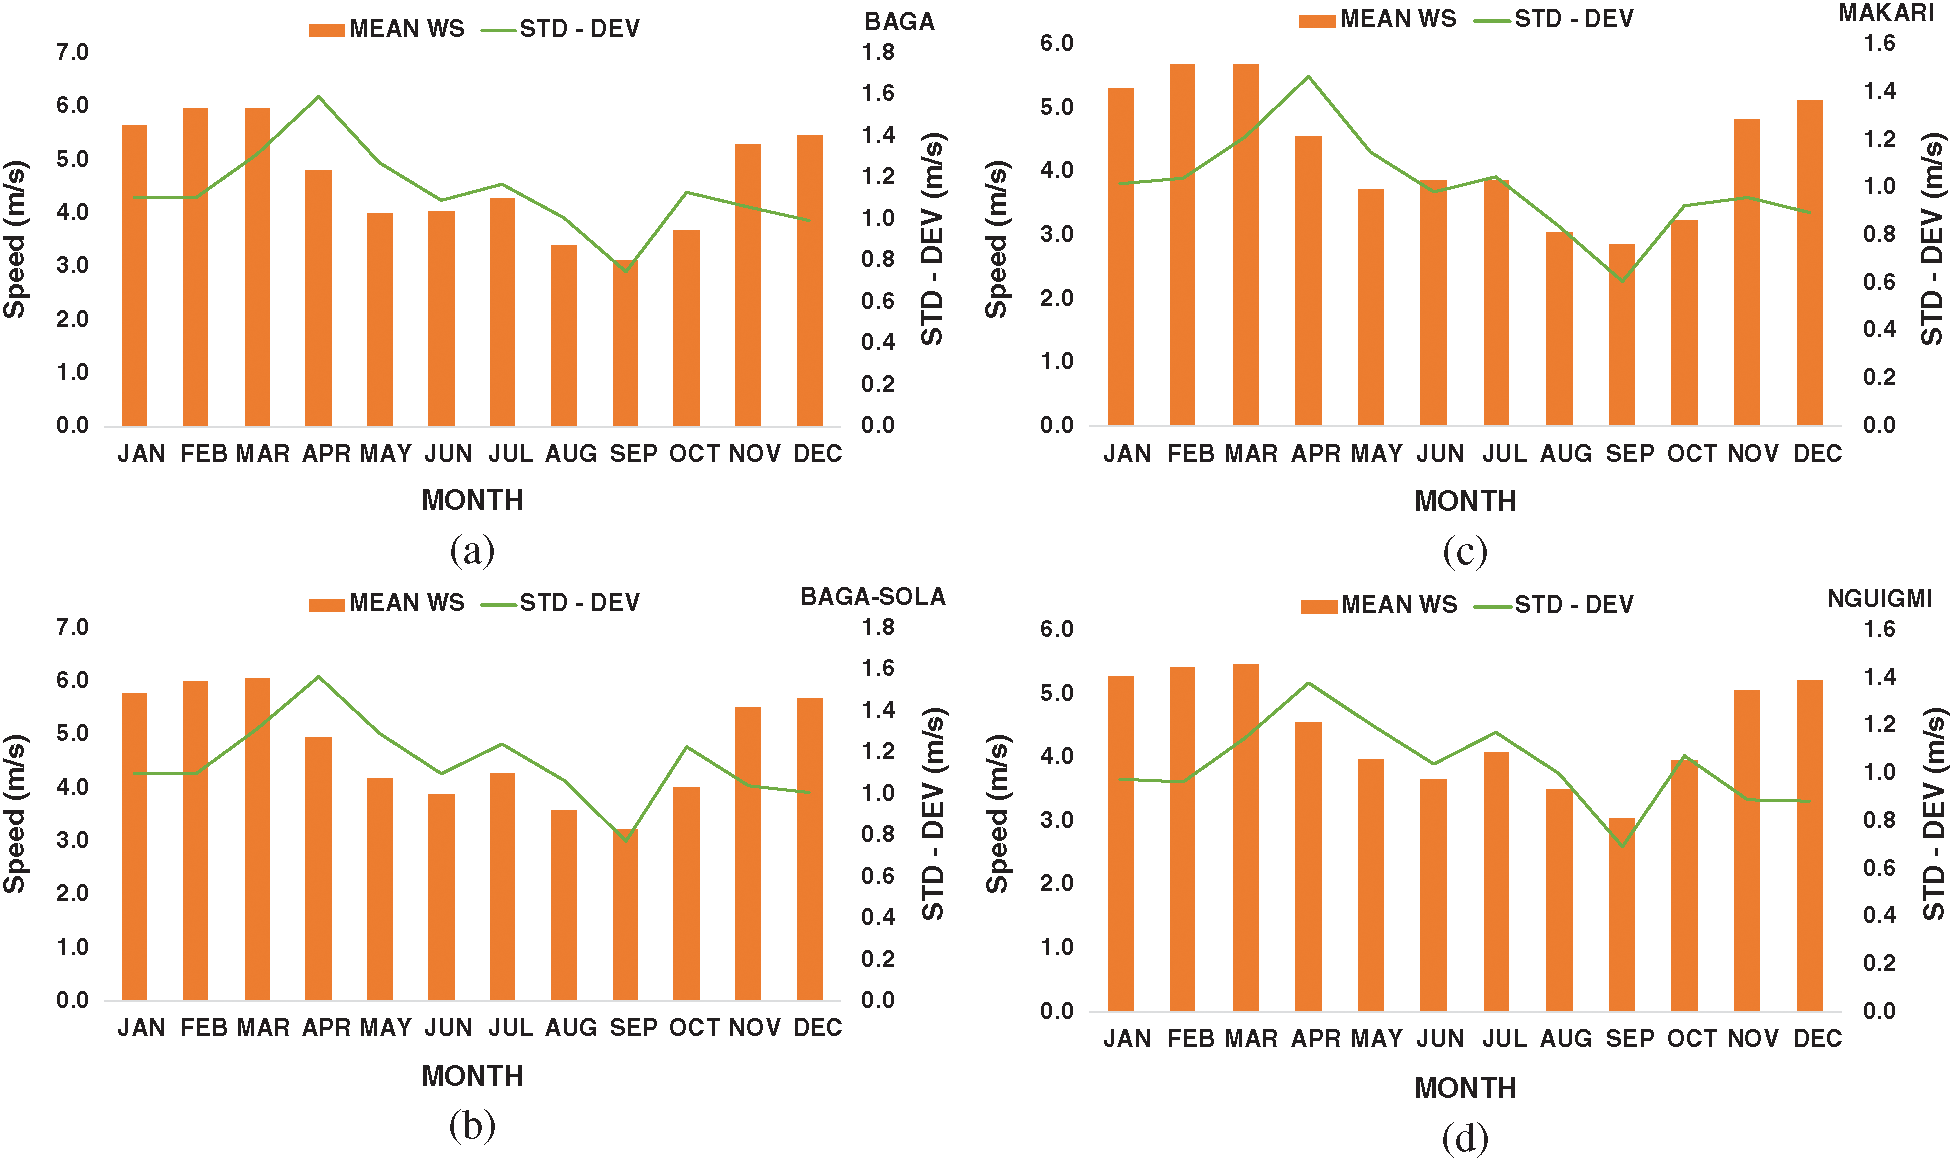
Figure 2: Monthly mean wind speeds at 10 m height agl and standard deviation for (a) Baga (b) Baga-Sola (c) Makari (d) Nguigmi
The monthly variation of mean temperature, at 2 m height agl, is shown in Fig. 3. It is observed that the four selected sites display similar values. Monthly mean temperatures, at 2 m height agl, are 29.67°C, 29.32°C, 29.38°C and 28.56°C, respectively for Baga, Baga-Sola, Makari and Nguigmi.
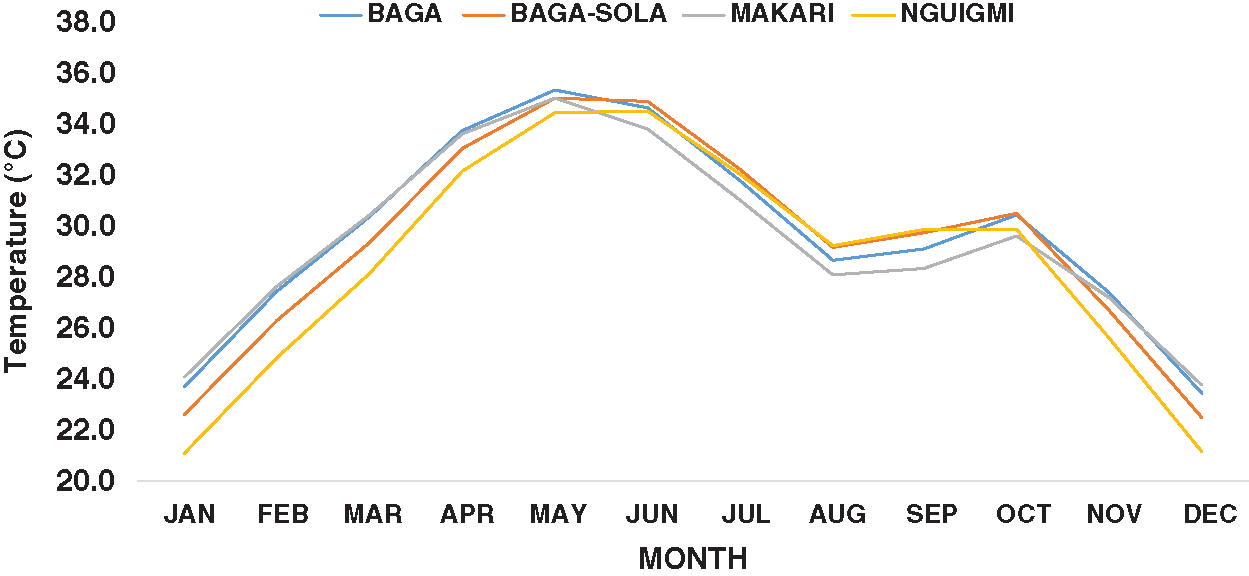
Figure 3: Monthly mean temperatures at 2 meters height AGL for Baga, Baga-Sola, Makari and Nguigmi
3.1 Rayleigh Probability Distribution Function
In this work, the considered approach for modeling wind speed data is based on the Rayleigh probability distribution function (PDF). The Rayleigh PDF, which is a special case of the Weibull PDF when the shape parameter is equal to 2, is defined by its PDF f(V) and cumulative distribution function (CDF), F(V), respectively as given by Eqs. (1) and (2) [19,20]:
where V = wind speed [m/s] and
With regards to the Rayleigh PDF, the scale parameter C is given by the equation:
3.2 Extrapolation of Wind Speeds at Different Hub Heights
Wind speed increases with elevation agl. In this study, windmills hub heights of interest range from 10 m to a maximum of 25 m. Since the available wind speed data are at 10 m height agl, wind speeds need to be adjusted to relevant windmills hub heights. In the scientific literature, several studies with reference to vertical wind profiles are acknowledged and the approaches for wind height extrapolation include the power law and logarithmic law [21,22]. The power law is recognized to give a better approach for wind profiles and is, for this reason, preferred in the present case study. It can be expressed as given [23]:
where V10 = wind speed available at 10 m height agl, z10 = 10 m height agl, and Vz = wind speed at the height to be extrapolated; zz = the desired height agl.
The power law exponent n is given by:
Alternatively, the Weibull PDF can be used to extrapolate wind profiles at different desired windmills hub heights. The Weibull parameters C10 and k10 determined at 10 m height agl are adjusted to any desired height z by the following relations [24,25]:
It is worth mentioning here that for the Rayleigh PDF, the shape parameter kz is equal 2, where z and z10 are in meters, and the power law exponent n is given by:
3.3 Power Curve Model and Expected Wind Pump Discharges
The considered windmills are mechanically coupled to a piston pump with neither power regulation nor controllability. Accordingly, the windmill power curve can be modeled as a function of cut-in wind speed (VI), cut-out wind speed (VO) and maximum reached power (PO) [26,27]. As a general rule, variations in rotor power with the wind speed can be matched by different polynomial expressions [28]. In the literature, a variety of models using linear, quadratic, cubic and higher powers of wind speed or their combinations are utilized [8]. In the present study, it is assumed that windmills rotors utilized for water pumping show a quadratic wind speed-power relationship and the instantaneous power output (PV) at wind speed V, is given as follows [26]:
The maximum reached power (PO) takes into consideration the rotor, pump and wind regime characteristics. It can be written as expressed [28]:
And the overall system (wind to water) efficiency (CP ⋅ η0) can be modelled as [26]:
where A is the rotor area
From Eqs. (9) and (10), PO can further be simplified as:
The air density at the site is often written in a simple form [29]:
where
The energy produced by the windmill in a given time period (T) can be expressed as [26]:
After further substitutions, integrations and simplification, Eq. (13) yields:
The hydraulic energy (EH) needed by the pump for delivering a volume of water Vw(m3), can be given as [30]:
Equating Eqs. (14) and (15), the volume of water Vw(m3) expected from the wind driven piston pump, installed at a given site, can be estimated, over a given time period T, using the following expression [28]:
where
The economic evaluation of the wind-generated water is assessed using the present value of costs (PVC) of energy produced during the entire lifetime of the Windmill [31]:
where the following assumptions are made to estimate the cost of energy produced by the windmill:
• I is the investment cost, which includes the windmill price in addition to 10 per cent for civil works and other connections;
• The windmill price is assumed to be US$ 250 (XAF 150,000) per m2 swept area of the rotor;
• n is the useful lifetime of WT in years (20 years);
• io is the nominal interest rate (16 per cent);
• Com is the operation and maintenance costs (5 per cent of the investment cost);
• S is the scrap value (10 per cent of the windmill price);
• i is the inflation rate (3.6 per cent);
The discount rate (r) is determined using the following expression [31]:
The annual volume of water Vy (m3/year) produced by the windmill is determined from:
The Cost of water (XAF/m3), COW using the PVC method can be estimated using the following expression:
The Rayleigh PDF allows to model wind characteristics for Baga, Baga Sola, Makari and Nguigmi, located inside Lake Chad floodplains. These locations are low wind speed resource areas, as wind power class 2 areas, which are thus considered as marginal for wind power development in the wind power scheme proposed by Battelle—Pacific Northwest Labs (PNL) [32]. These marginal areas for wind power development necessitate low wind speed wind turbine technology, such as windmills. By investigating wind energy option for wind power development in the considered locations, it is expected to raise awareness on forgotten wind water pumping niches which could help alleviating clean and safe water access, mainly in rural areas. The findings of this study are provided in the next sections.
4.1 Rayleigh Probability Distribution Function
From the results obtained, the monthly PDF and CDF at 10–30 m agl, as shown, respectively, in Figs. 4 and 5, are obtained from long-term satellite-derived wind speeds data, for Baga, Baga-Sola, Makari and Nguigmi. It is found that monthly Weibull scale parameters, C, at 10–30 m agl are in the range of 5.24–6.70, 5.37–6.85, 4.87–6.28 and 5.00–6.43 m/s, with their corresponding monthly mean wind speeds in the range of 5.65–7.09, 5.77–7.23, 5.33–6.73 and 5.28–6.67 m/s, respectively, for Baga, Baga-Sola, Makari and Nguigmi. In addition, it is observed that the most probable wind speeds, range from 3.70 m/s at 10 m agl to 4.78 m/s at 30 m agl for Baga, from 3.80 m/s at 10 m agl to 4.88 m/s at 30 m agl for Baga-Sola, from 3.45 m/s at 10 m agl to 4.48 m/s at 30 m agl for Makari and from 3.54 m/s at 10 m agl to 4.58 m/s at 30 m agl for Nguigmi. Furthermore, the maximum energy carrying wind speeds at 10–30 m agl are in the range of 7.41–9.43, 7.59–9.63, 6.89–8.83 and 7.08–9.04 m/s, for Baga, Baga-Sola, Makari and Nguigmi, in that order.
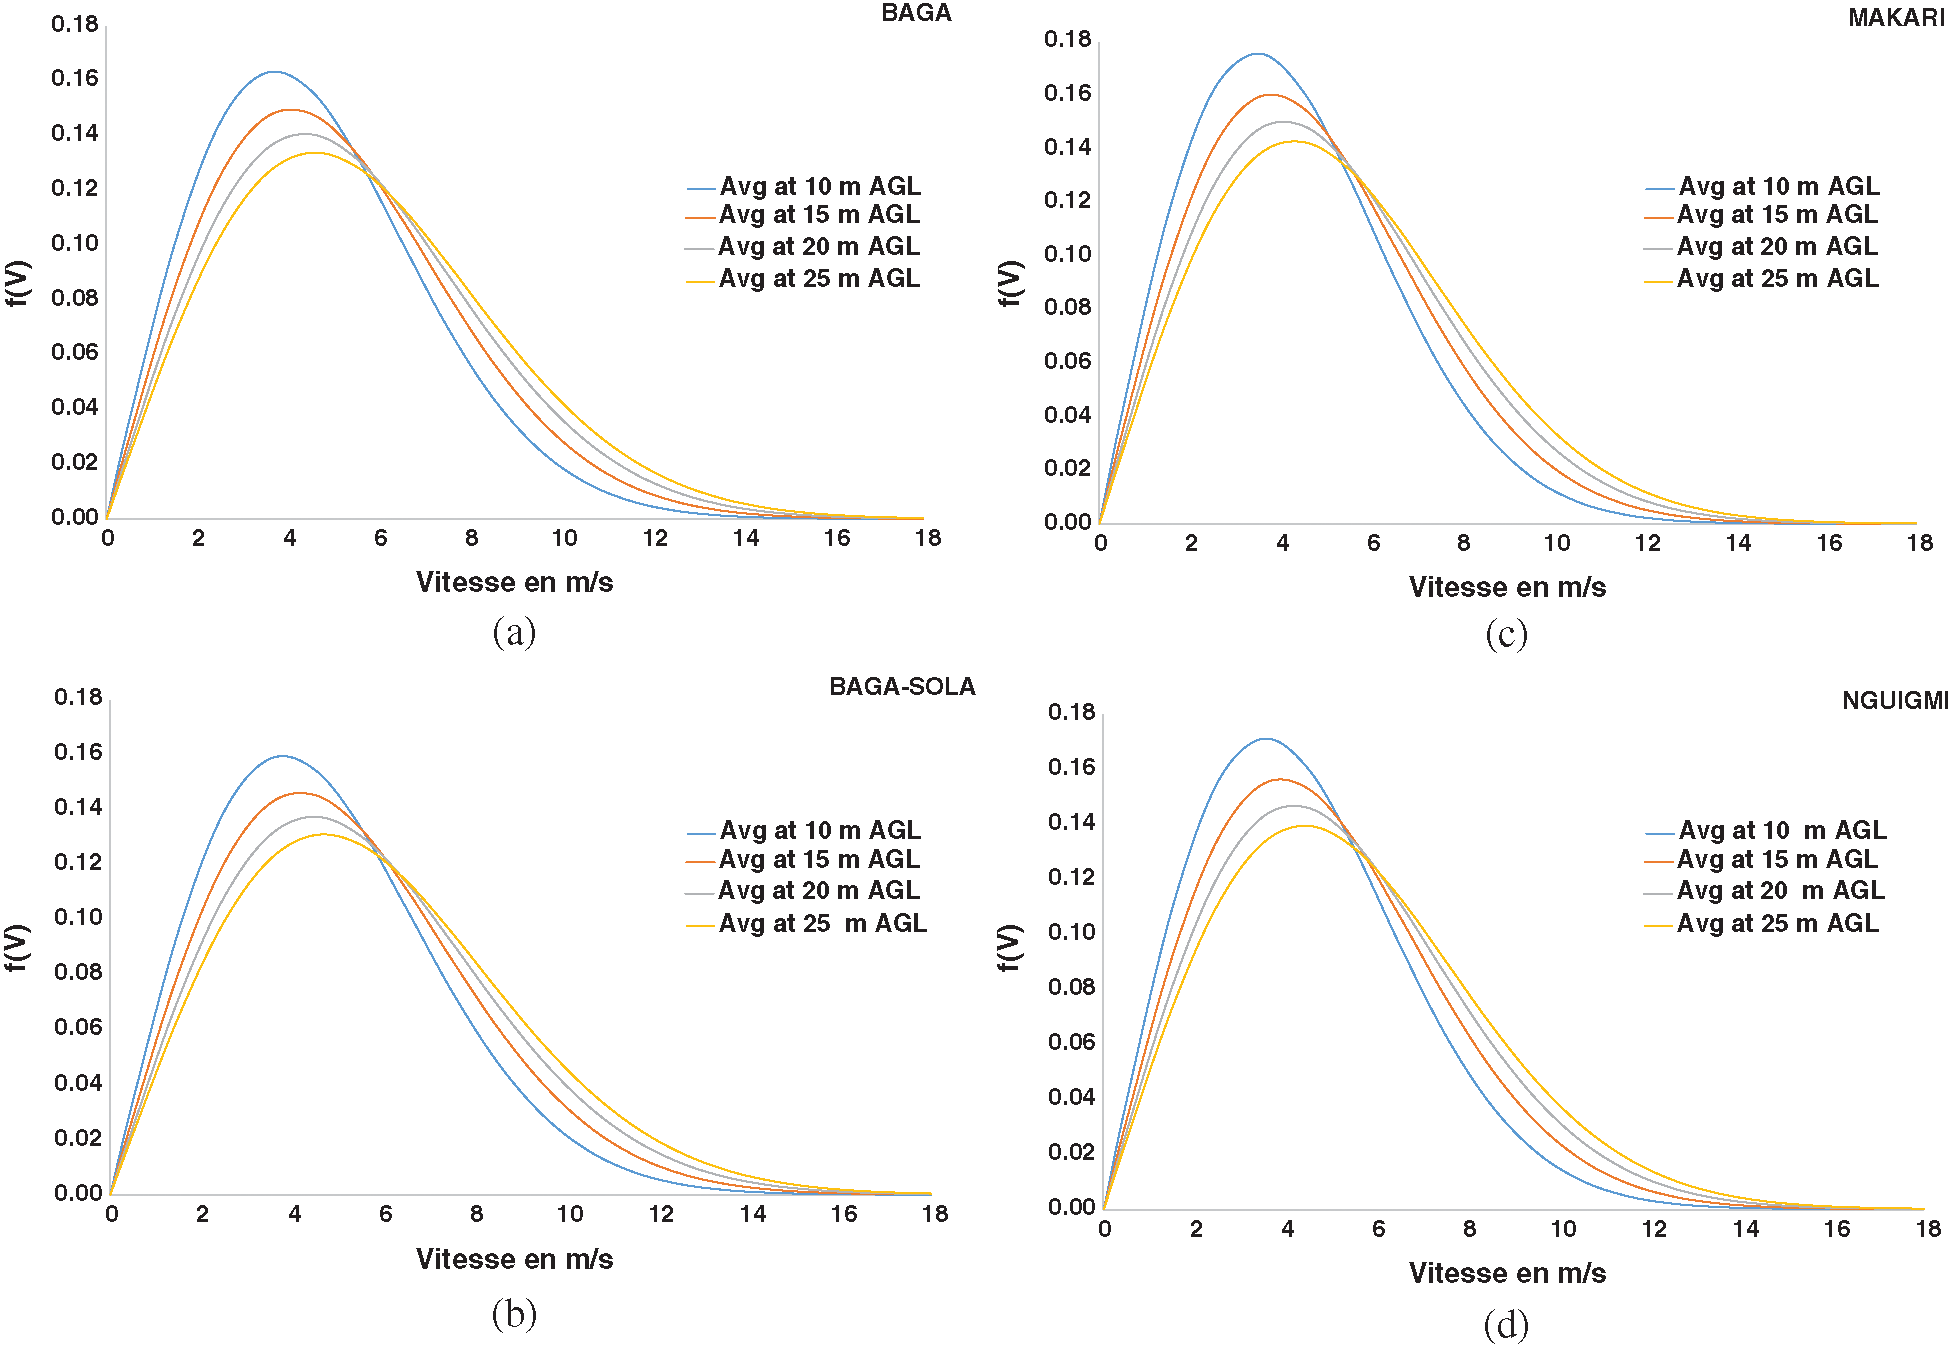
Figure 4: PDF at 10–30 m height agl for (a) Baga (b) Baga-Sola (c) Makari (d) Nguigmi
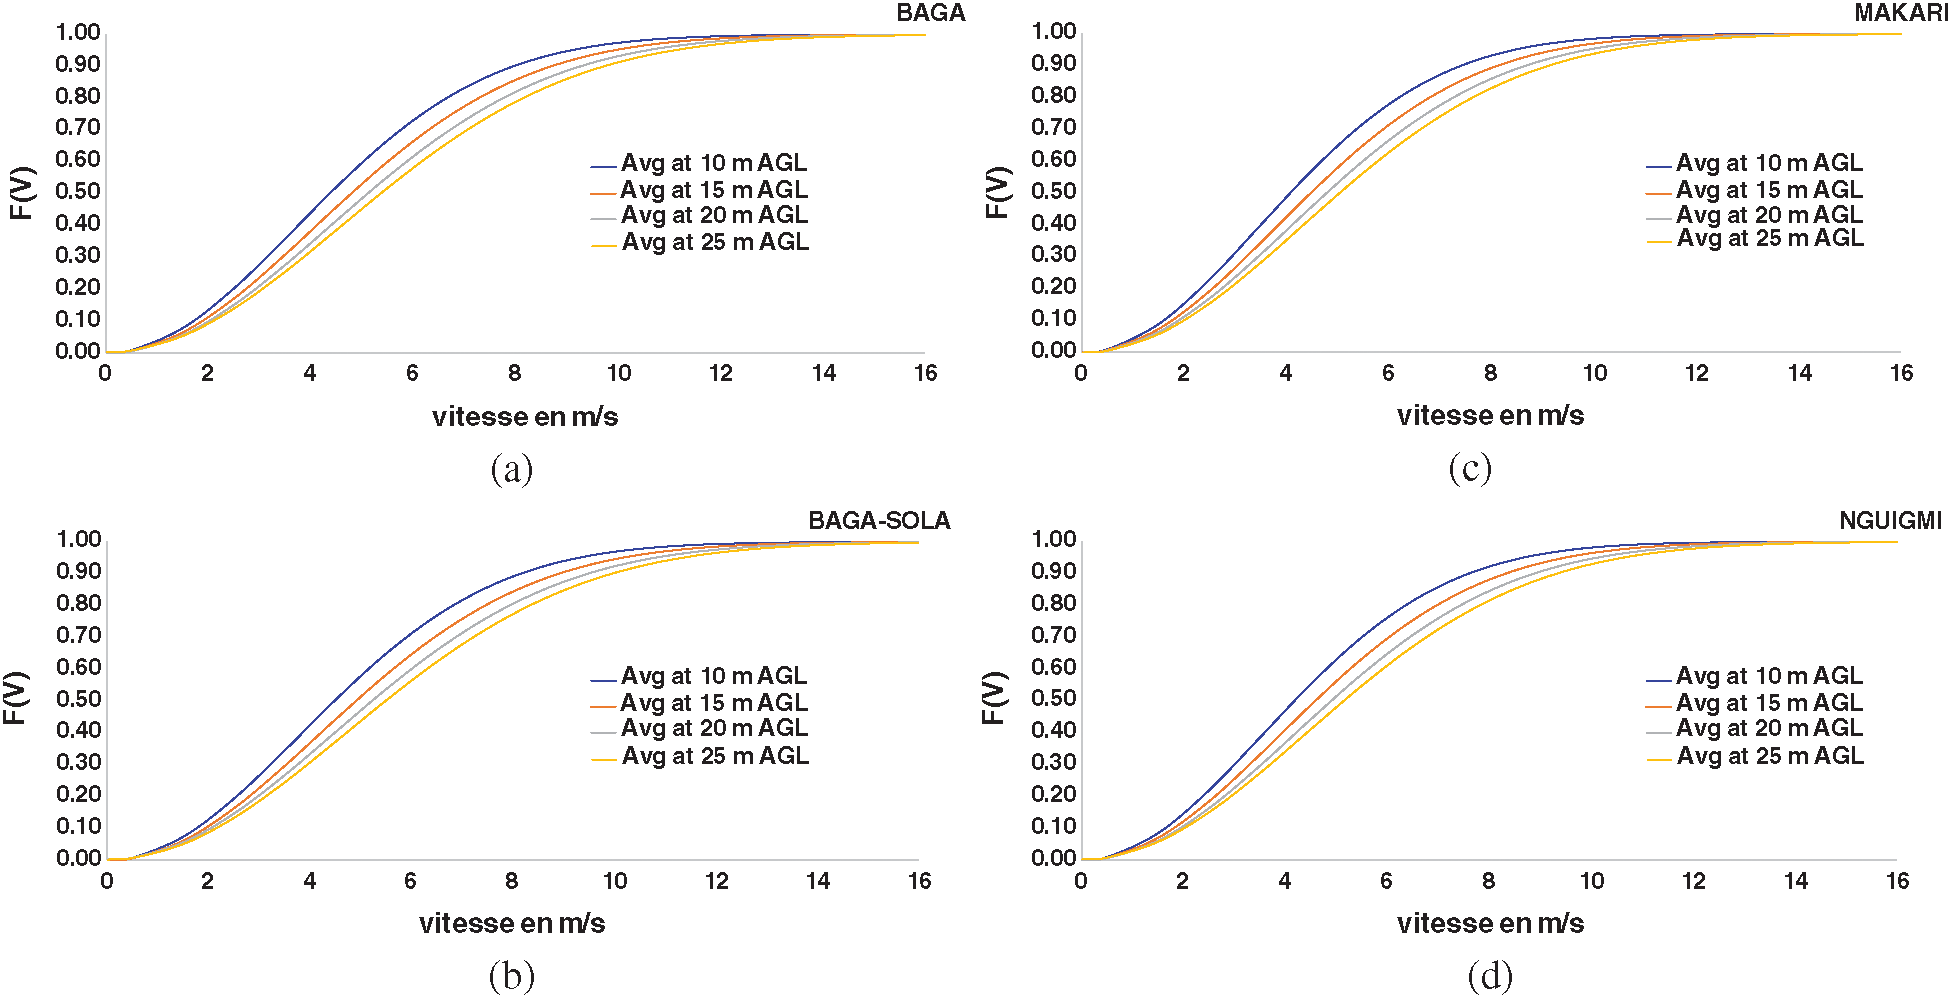
Figure 5: CDF at 10 m height agl for (a) Baga (b) Baga-Sola (c) Makari (d) Nguigmi
The monthly CDF calculated from the satellite-derived wind speeds at 10, 15, 20, and 25 m agl for Baga, Baga-Sola, Makari and Nguigmi, in that order, are shown in Fig. 5. For Baga, it can be seen that, the wind speed is in the range of 2.5–10 m (working range of a wind pump), at 10, 15, 20, 25 and 30 m agl, for 79.64, 82.80, 84.79, 86.19 and 87.25 per cent of the time. Corresponding values for Baga-Sola, Makari and Nguigmi are in the range of 80.50–87.76 per cent, 76.86–85, 58 per cent, 77.92–86.21 per cent, respectively.
When considering mechanical wind pumps with mechanical transmission, numerous types of pumps are available, such as centrifugal pump, compressor pump, piston pump and screw pump [24,31]. Windmills of Multi-blade driven piston pump are the preferred water pumping option for this study because of its higher overall system efficiency (the volumetric efficiency is higher than 90 per cent), in addition to acceptable performance and efficiency at lower range wind speeds and with an interesting performance/price ratio. Fig. 6 shows a typical water pumping windmill. The considered applications range from community water supply to cattle watering and small-scale irrigation. Rotor sizes ranging from 1.5 to 3 m are chosen for estimating power output and hydraulic power delivered by the piston pump. Total dynamic heads in the range of 15–30 m are considered, reflecting head range nearby floodplains around Baga, Baga-Sola, Makari and Nguigmi.
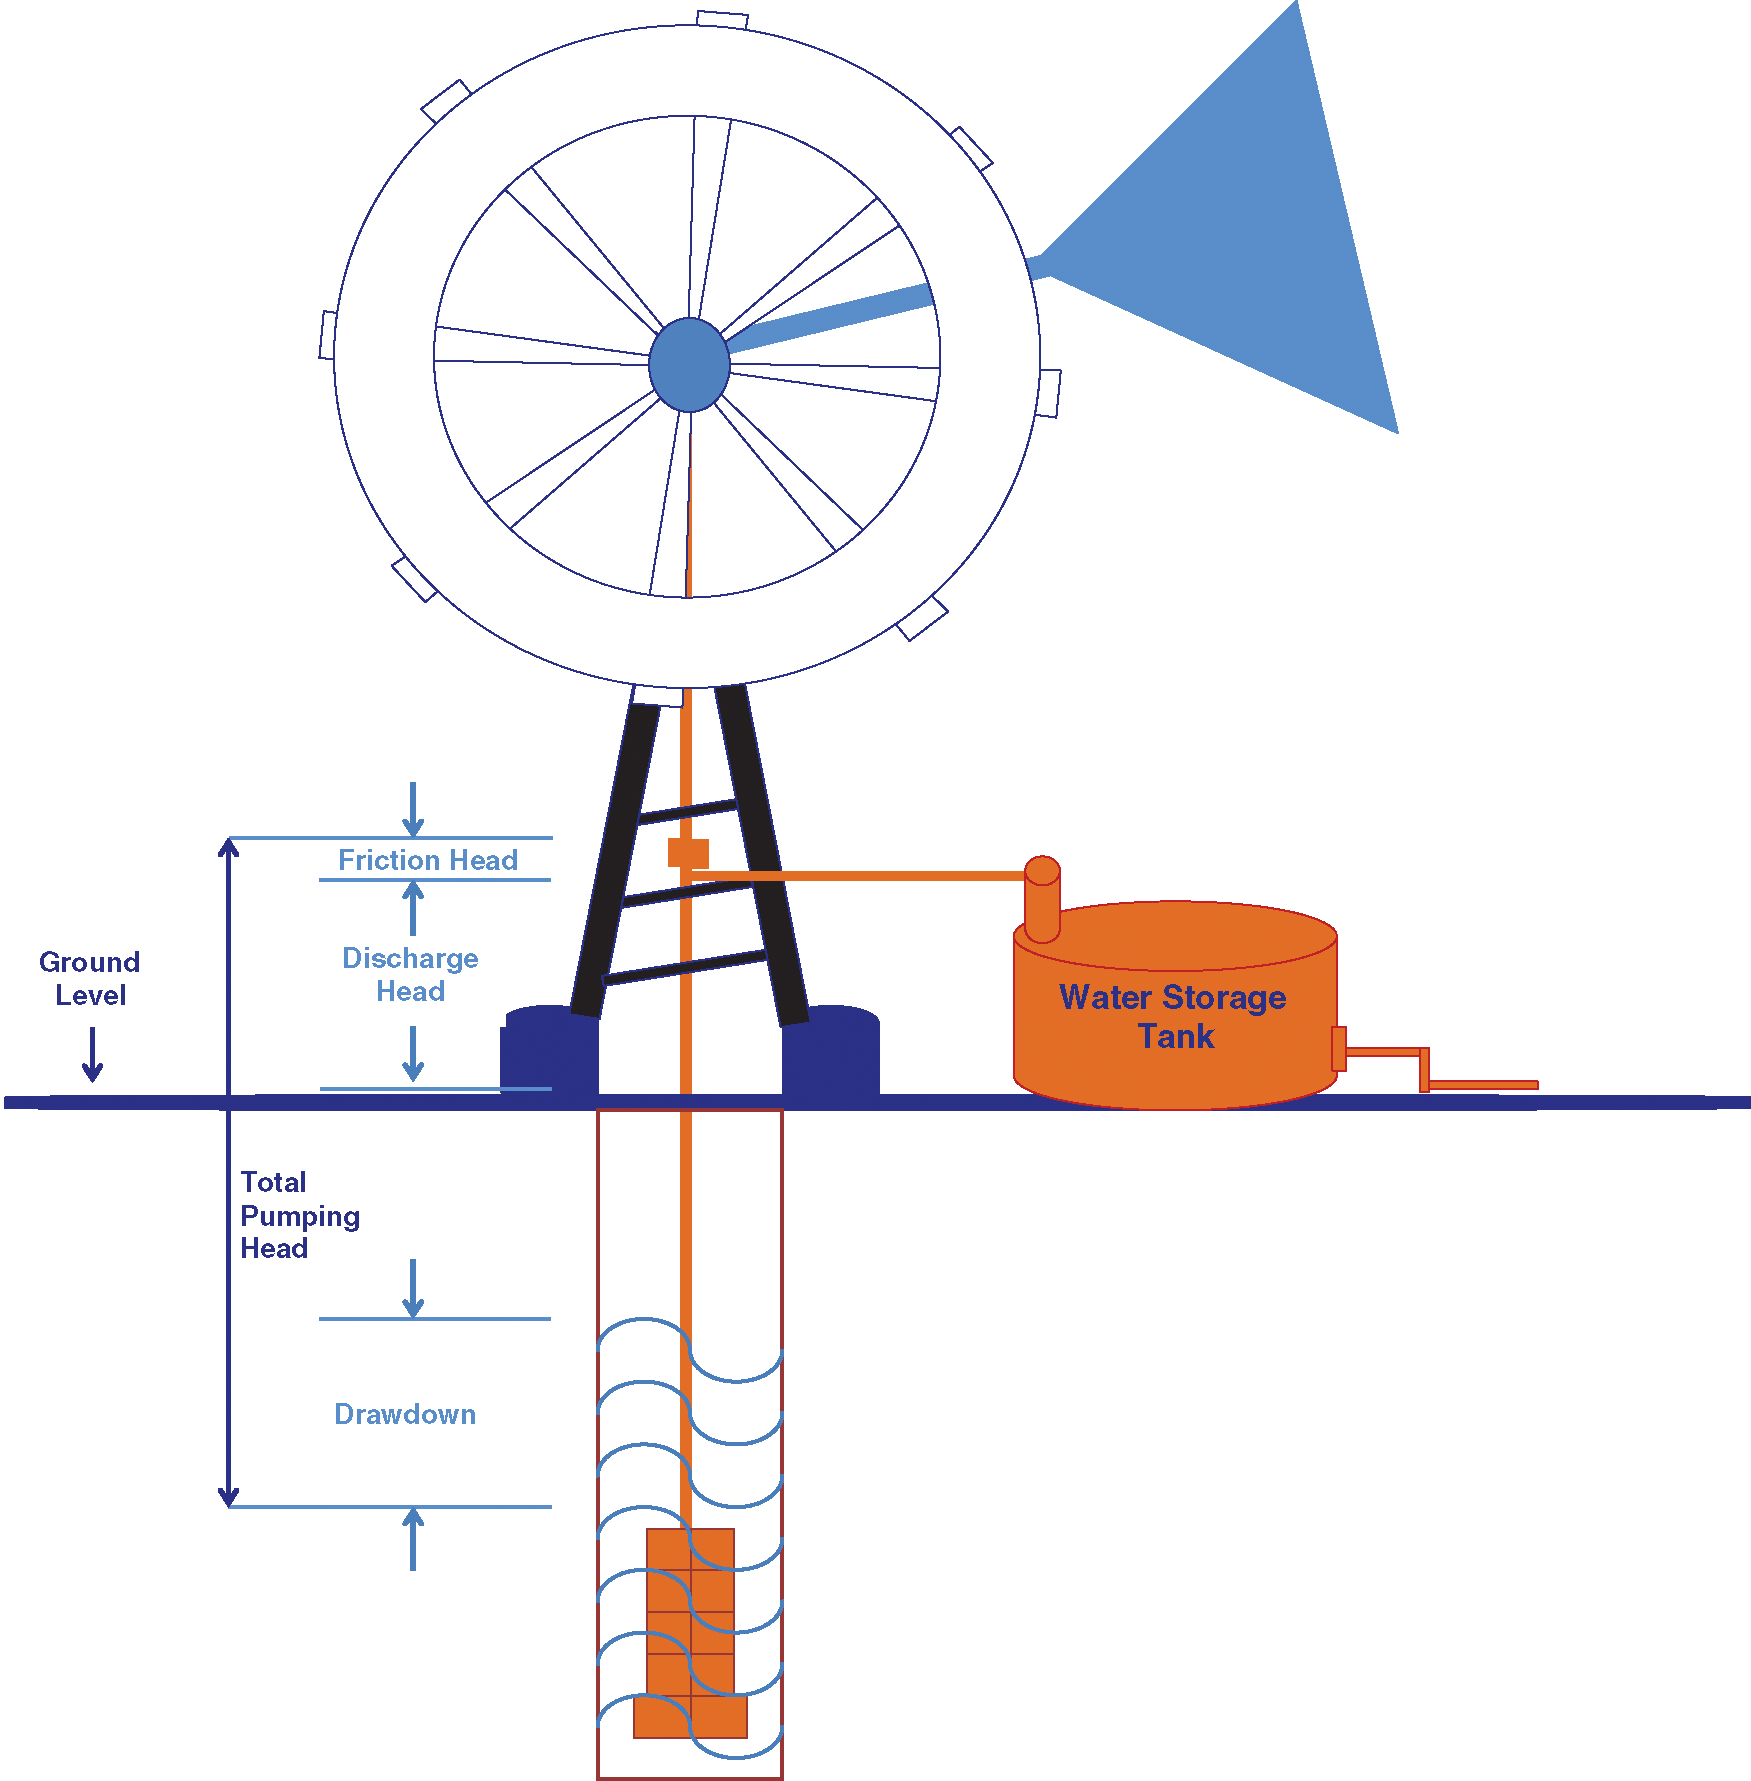
Figure 6: Typical windmill for pumping systems
4.3 Wind Pump Discharges at Different Heads
The expected wind pump discharges are computed considering a total pumping head (TDH) of 30 m, a 2 m-blade and hub heights of 10, 15, 20 and 25 m agl. To estimate the discharge volume of water Vw(m3) over a year, the design power coefficient C0 is set to 0.3, the combined transmission and pump efficiency η0 = 0.95 and KO = 0.25. Fig. 7 illustrates monthly discharges at the studied sites using a 2 m-blade, 25 m-height tower and 30 m-dynamic head and at the aforementioned hub heights. When looking at TDH, it’s seen that pump discharges values decreases by one-third from 15 to 20 m TDH, while their values are reduced by 25 and 20 per cent, respectively from 20 to 25 m and from 25 to 30 m TDH. Shallower TDH provides substantial opportunities for larger water pumping volume. When upgrading a 1 m-blade to a 1.5 m-blade, a 125 per cent volume increase is observed, while an upgrade of a 1.5 m-blade to a 2 m-blade, provide a 78 per cent volume increase. Furthermore, 56 and 44 per cent volume increases are noticed, when upgrading, respectively from a 2 m-blade to a 2.5 m-blade and from a 2.5 m-blade to a 3 m-blade. The highest monthly volumes are observed from January to April and from November to December, corresponding to the dry season, while the lowest monthly volumes are seen in august, September and October, which corresponds to the rainy season. For a 2 m-blade, a 25 m-height tower and at a TDH of 30 m, average monthly dry season discharges are 1,330.05, 1,374.19, 1,200.74 and 1,199.47 m3, respectively for Baga, Baga-Sola, Makari and Nguigmi. These discharges values during the rainy season are reduced to 629.55 m3 for Baga, 697.77 m3 for Baga-Sola, 463.31 m3 for Makari and 640,51 m3 for Nguigmi. There is, on average, a volume gain in the range of 19–22 per cent, when using a 15 m-height tower in comparison to a 10 m-height tower, while a volume gain in the range of 12–14 per cent is seen when switching from a 15 m-height tower to a 20 m-height tower. Furthermore, when replacing a 20 m-height tower by a 25 m-height tower it is seen an 8.46 per cent volume gain for Baga, an 8.08 per cent volume gain for Baga-Sola, a 9.64 per cent volume gain for Makari and a 9.19 per cent volume gain for Nguigmi.
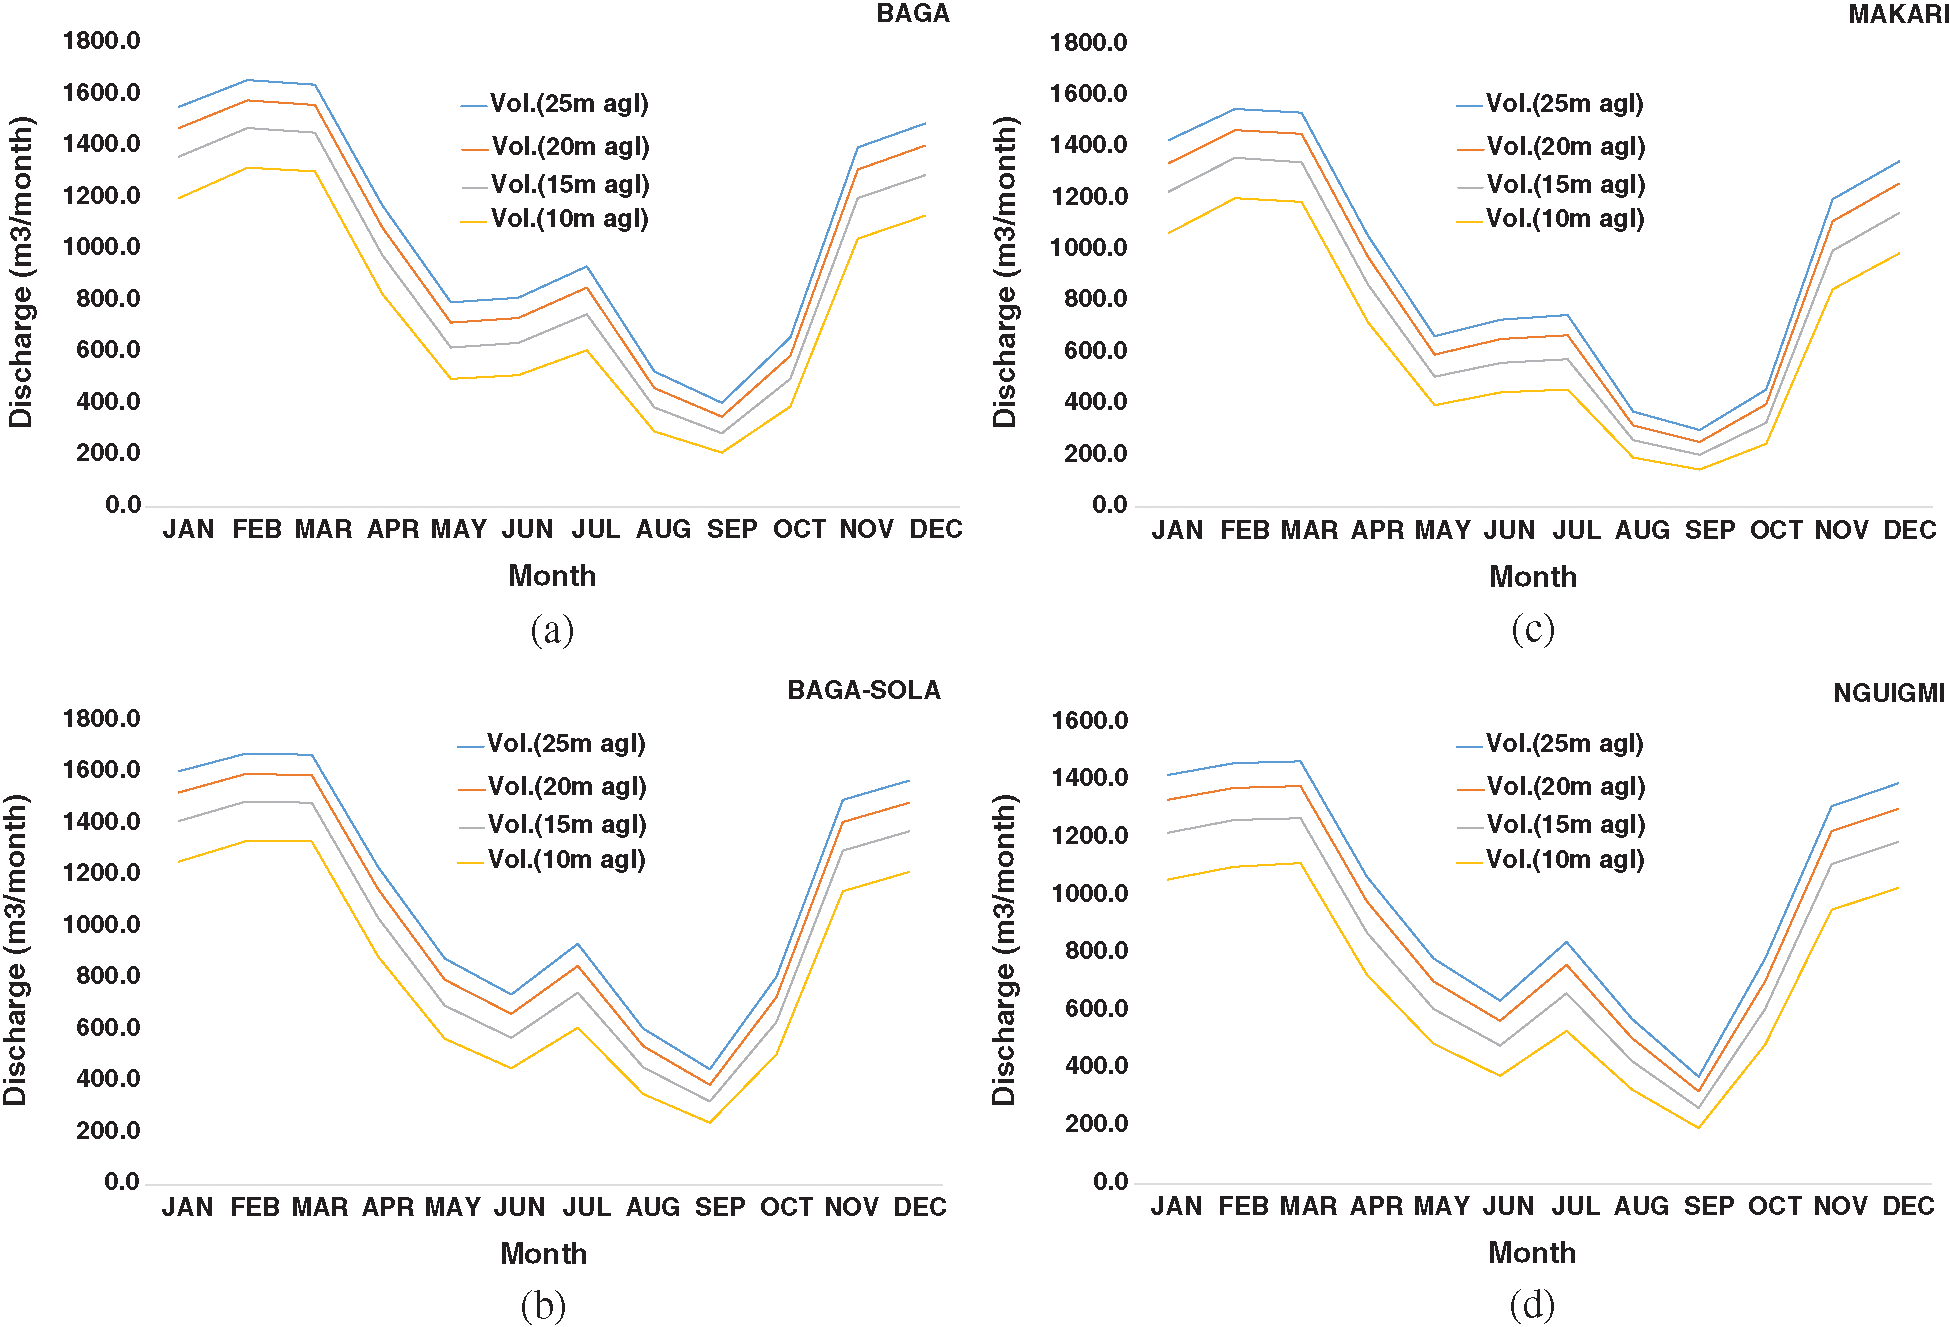
Figure 7: Monthly discharge and required energy using a 2 m-blade, 25 m-height tower and 30 m-dynamic head for (a) Baga (b) Baga-Sola (c) Makari (d) Nguigmi
The economic evaluation of the multi-blade driven piston pump for water pumping has been assessed using the present value of costs (PVC) of water produced during the entire lifetime of the Windmill. Fig. 8 presents the cost of water using a 2 m-blade, a 25 m-height tower and a 30 m-dynamic head at hub heights of 10, 15, 20 and 25 m agl for the four selected localities. Average costs of water (COW) at 10–25 m agl, are in the range of 11.43–16.59 XAF/m3 for Baga, 10.91–16.60 XAF/m3 for Baga-Sola, 13.19–20.08 XAF/m3 for Makari and 12.46–18.63 XAF/m3 for Nguigmi, with the lowest costs observed at 25 m height agl, while the highest costs are seen at 10 m height agl. For a 2 m-blade, a 25 m-height tower and at a TDH of 30 m, average COWs in the dry season are 9.53, 9.23, 10.56 and 10.57 XAF/m3, respectively for Baga, Baga-Sola, Makari and Nguigmi. These COWs soar during the rainy season to 20.14 XAF/m3 for Baga, 18.17 XAF/m3 for Baga-Sola, 27.36 XAF/m3 for Makari and 19.79 XAF/m3 for Nguigmi.
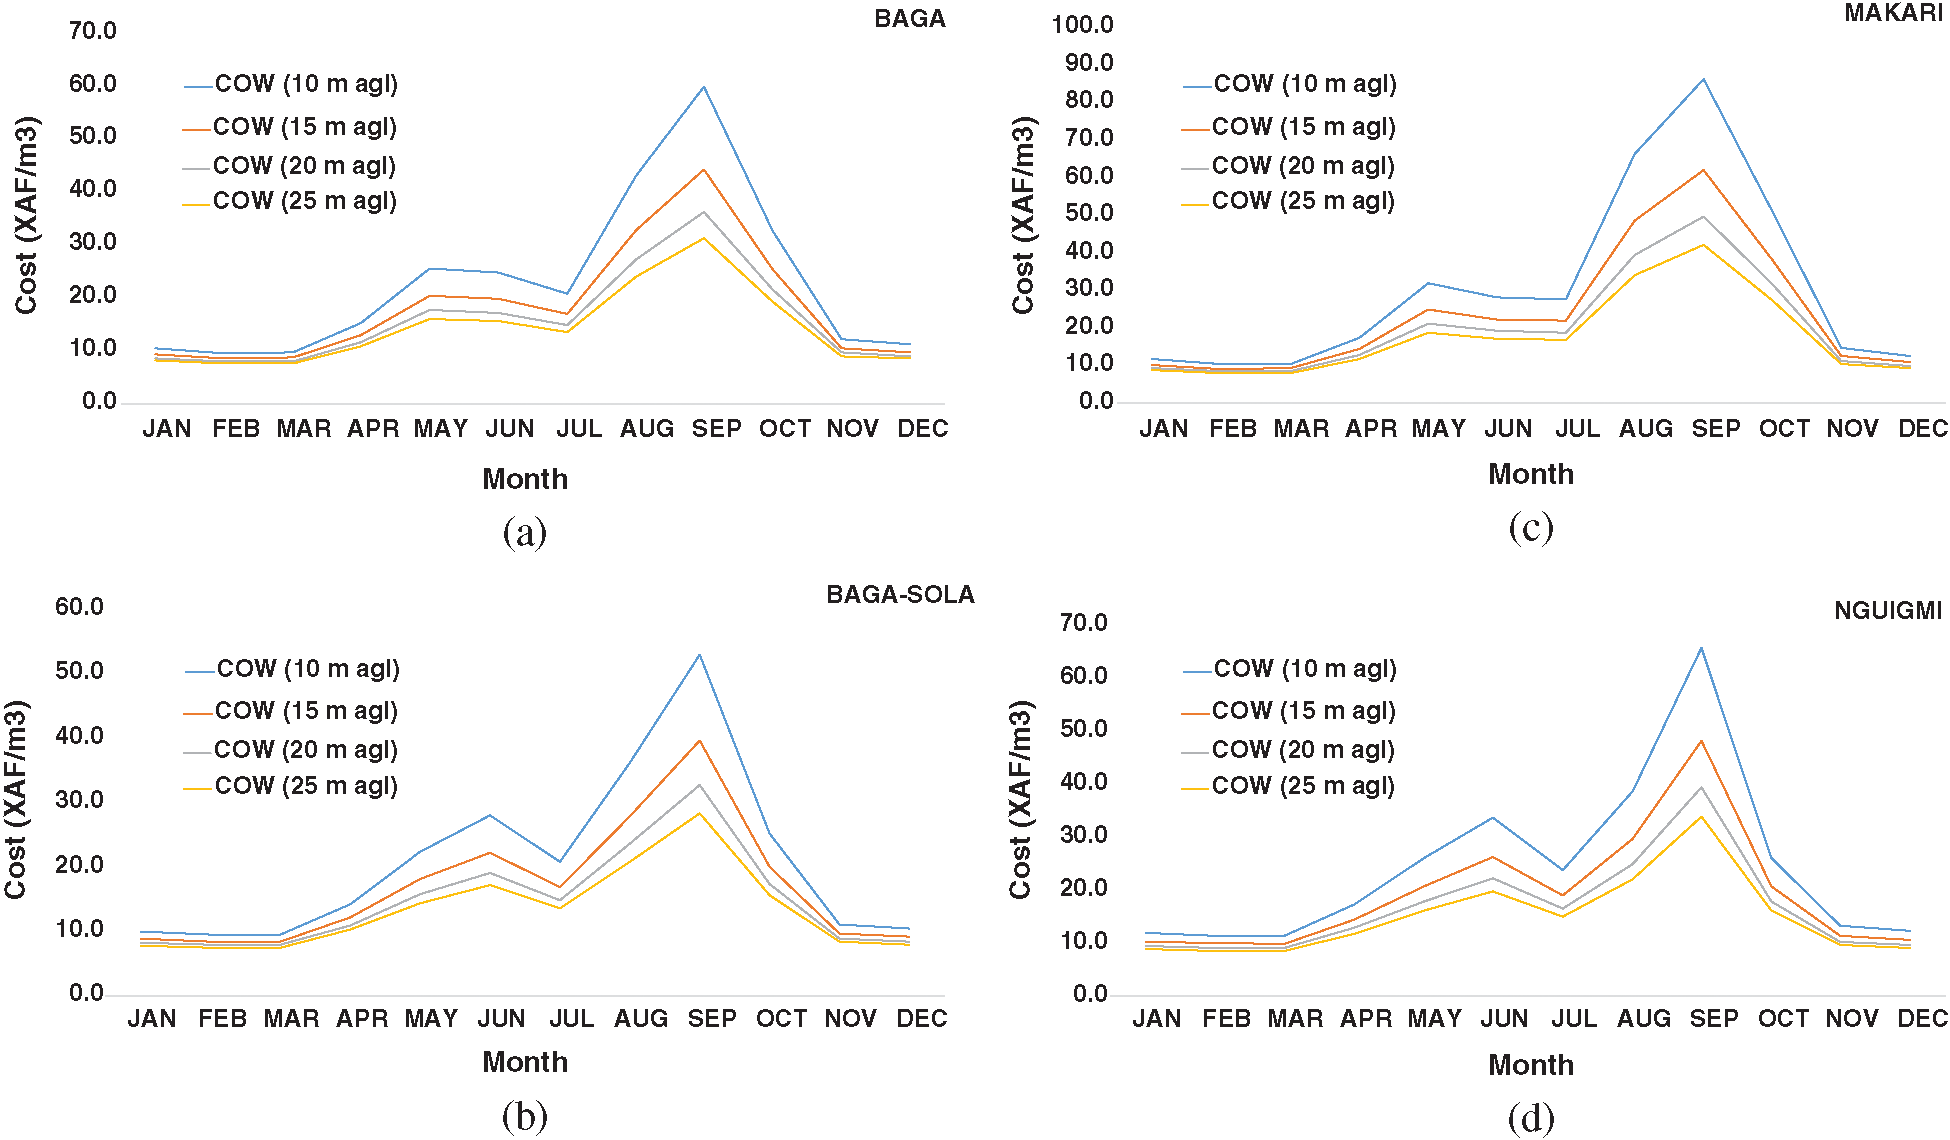
Figure 8: Cost of water using a 2 m-blade, 25 m-height tower and 30 m-dynamic head for (a) Baga (b) Baga-Sola (c) Makari (d) Nguigmi
Clean water scarcity is acknowledged as a major regional threat to security and stability around the shrinking Lake Chad. Moreover, the surface water poses significant health hazards to populations inside the floodplains around Lake Chad. To develop sustainable solutions to overcome water and health related crisis, mechanical wind pumping system has been explored to raise stakeholders’ awareness for the option of using windmills driven piston pump for improving access to clean and safe drinking water. This study outlines the following:
• No ground measurements are available and wind data utilized for this study are provided by NASA-SSE, satellite measurements;
• Lake Chad floodplains are considered low wind speed resource areas and per se, necessitate low wind speed wind turbine technology, such as windmills;
• Mean wind speeds, at 10 m height above agl, range from 4.64 m/s in Baga, 4.76 m/s in Baga-Sola, 4.32 m/s in Makari to 4.44 m/s in Nguigmi;
• Wind speeds are in the range of 2.5–10 m (working range of a wind pump), at 10, 15, 20 and 25 m height agl, for 79.64, 82.80, 84.79, and 86.19 per cent of the time;
• For Windmill with a 2 m-blade, a 25 m-height tower and considering a TDH of 30 m during the dry season:
average monthly discharges are 1,330, 1,374, 1,200 and 1,199 m3, respectively for Baga, Baga-Sola, Makari and Nguigmi;
• Average COWs are 9.53, 9.23, 10.56 and 10.57 XAF/m3, respectively for Baga, Baga-Sola, Makari and Nguigmi.
The expected wind pump discharges have the potential to improve clean and safe water access;
Inside floodplains of Lake Chad, average wind speed values are higher during the dry season and wind water pumping for farming during that season can be a sustainable manner to diversify agriculture and enhance food productivity;
Larger rotor sizes yield better windmill pumping capacity.
Acknowledgement: The authors gratefully acknowledge the NASA Langley Research Center (LaRC) POWER Project funded through the NASA Earth Science/Applied Science Program for providing wind and temperature data used in this project.
Funding Statement: The authors received no specific funding for this study.
Conflicts of Interest: The authors declare that they have no conflicts of interest to report regarding the present study.
1. Deng, X., Shao, H., Wang, X. (2020). Seasonal characteristics analysis and uncertainty measurement for wind speed time series. Energy Engineering, 117(5), 289–299. 10.32604/EE.2020.011126. [Google Scholar] [CrossRef]
2. Zou, H. X., Zhao, L. C., Gao, Q. H., Zuo, L., Liu, F. R. et al. (2019). Mechanical modulations for enhancing energy harvesting: Principles, methods and applications. Applied Energy, 255, 113871. DOI 10.1016/j.apenergy.2019.113871. [Google Scholar] [CrossRef]
3. Martin, S., Jung, S.,Vanli, A. (2020). Impact of near-future turbine technology on the wind power potential of low wind regions. Applied Energy, 272, 115251. DOI 10.1016/j.apenergy.2020.115251. [Google Scholar] [CrossRef]
4. WHO/UNICEF (2015). 2015 update and MDG assessment. World Health Organization, 1–80. DOI 10.1007/s13398-014-0173-7.2. [Google Scholar] [CrossRef]
5. Poompavai, T., Kowsalya, M. (2019). Control and energy management strategies applied for solar photovoltaic and wind energy fed water pumping system: A review. Renewable and Sustainable Energy Reviews, 107, 108–122. DOI 10.1016/j.rser.2019.02.023. [Google Scholar] [CrossRef]
6. Bruns, B. (2021). Polycentric solutions for groundwater governance in Sub-saharan Africa: Encouraging institutional artisanship in an extended ladder of participation. Water (Switzerland), 13(5). DOI 10.3390/w13050630. [Google Scholar] [CrossRef]
7. Notton, G., Diaf, S., Stoyanov, L. (2011). Hybrid photovoltaic/Wind energy systems for remote locations. Energy Procedia, 6, 666–677. DOI 10.1016/j.egypro.2011.05.076. [Google Scholar] [CrossRef]
8. Diaf, S., Notton, G., Diaf, D. (2013). Technical and economic assessment of wind farm power generation at adrar in southern Algeria. Energy Procedia, 42, 53–62. DOI 10.1016/j.egypro.2013.11.005. [Google Scholar] [CrossRef]
9. NASA POWER (2021). Data Access Viewer. https://power.larc.nasa.gov/data-access-viewer/. [Google Scholar]
10. Fortnam, M. P., Oguntola, J. A. (2004). Lake Chad Basin. GIWA Regional Assessment, vol. 43. University of Kalmar, Kalmar, Sweden. [Google Scholar]
11. Zieba, F. W., Yengoh, G. T., Tom, A. (2017). Seasonal migration and settlement around lake Chad: Strategies for control of resources in an increasingly drying lake. Resources, 41(6), 1–17. DOI 10.3390/resources6030041. [Google Scholar] [CrossRef]
12. Gbetkom, P. G., Gadal, S., Aboudi, A. El, Ngandam, H., Gbetkom, P. G. et al. (2018). Mapping of built up areas in the cameroonians shores of lake chad and its hinterland through based object classification of sentinel 2 images. GEOBIA 2018: From Pixels to Ecosystems and Global Sustainability, Montpellier, France. [Google Scholar]
13. Sebag, D., Durand, A., Garba, Z., Verrecchia, E. P. (2013). Paleohydrological reconstruction from late holocene records in interdune lakes (N’Guigmi, northern bank of the lake Chad, Niger). Open Journal of Geology, Scientific Research Publishing, 2013, 3(2), 143–155. DOI 10.4236/ojg.2013.32018.hal-00842661. [Google Scholar] [CrossRef]
14. White, J. W., Hoogenboom, G., Stackhouse, P. W., Hoell, J. M. (2008). Evaluation of NASA satellite- and assimilation model-derived long-term daily temperature data over the continental US. Agricultural and Forest Meteorology, 148(10), 1574–1584. DOI 10.1016/j.agrformet.2008.05.017. [Google Scholar] [CrossRef]
15. White, J. W., Hoogenboom, G., Wilkens, P. W., Stackhouse, Jr. P. W., Hoel, J. M. (2011). Evaluation of satellite-based, modeled-derived daily solar radiation data for the continental United States. Cimatology & Water Management, 103(4), 1242–1251. DOI 10.2134/agronj2011.0038. [Google Scholar] [CrossRef]
16. Bai, J., Chen, X., Dobermann, A., Yang, H., Cassman, K. G. et al. (2010). Evaluation of nasa satellite-and model-derived weather data for simulation of maize yield potential in China. Agronomy Journal, 102(1), 9–16. DOI 10.2134/agronj2009.0085. [Google Scholar] [CrossRef]
17. Bright, J. M. (2019). Solcast: Validation of a satellite-derived solar irradiance dataset. Solar Energy, 189, 435–449. DOI 10.1016/j.solener.2019.07.086. [Google Scholar] [CrossRef]
18. Zen, S., Hart, E., Medina-Lopez, E. (2021). The use of satellite products to assess spatial uncertainty and reduce life-time costs of offshore wind farms. Cleaner Environmental Systems, 2, 100008. DOI 10.1016/j.cesys.2020.100008. [Google Scholar] [CrossRef]
19. Seo, S., Oh, S. D., Kwak, H. Y. (2019). Wind turbine power curve modeling using maximum likelihood estimation method. Renewable Energy, 136, 1164–1169. DOI 10.1016/j.renene.2018.09.087. [Google Scholar] [CrossRef]
20. Nedaei, M., Assareh, E., Walsh, P. R. (2018). A comprehensive evaluation of the wind resource characteristics to investigate the short term penetration of regional wind power based on different probability statistical methods. Renewable Energy, 128, 362–374. DOI 10.1016/j.renene.2018.05.077. [Google Scholar] [CrossRef]
21. Paraschiv, L. S., Paraschiv, S., Ion, I. V. (2019). Investigation of wind power density distribution using Rayleigh probability density function. Energy Procedia, 157(2018), 1546–1552. DOI 10.1016/j.egypro.2018.11.320. [Google Scholar] [CrossRef]
22. Gualtieri, G. (2019). A comprehensive review on wind resource extrapolation models applied in wind energy. Renewable and Sustainable Energy Reviews, 102, 215–233. DOI 10.1016/j.rser.2018.12.015. [Google Scholar] [CrossRef]
23. Ragnarsson, B., Oddsson, G., Unnthorsson, R., Hrafnkelsson, B. (2015). Levelized cost of energy analysis of a wind power generation system at búrfell in Iceland. Energies, 8(9), 9464–9485. DOI 10.3390/en8099464 [Google Scholar] [CrossRef]
24. Mostafaeipour, A., Jadidi, M., Mohammadi, K., Sedaghat, A. (2014). An analysis of wind energy potential and economic evaluation in zahedan, Iran. Renewable and Sustainable Energy Reviews, 30, 641–650. DOI 10.1016/j.rser.2013.11.016. [Google Scholar] [CrossRef]
25. Ohunakin, O. S. S., Adaramola, M. S. S., Oyewola, O. M. M. (2011). Wind energy evaluation for electricity generation using WECS in seven selected locations in Nigeria. Applied Energy, 88(9), 3197–3206. DOI 10.1016/j.apenergy.2011.03.022. [Google Scholar] [CrossRef]
26. Mathew, S., Pandey, K. P. (2000). Modelling the integrated output of mechanical wind pumps. Journal of Solar Energy Engineering, 122(4), 203–206. DOI 10.1115/1.1319498. [Google Scholar] [CrossRef]
27. Mathew, S., Pandey, K. P. (2003). Modelling the integrated output of wind-driven roto-dynamic pumps. Renewable Energy, 28(7), 1143–1155. DOI 10.1016/S0960-1481(02)00185-4. [Google Scholar] [CrossRef]
28. Mathew, S. (2006). Wind energy: Fundamentals, resource analysis and economics. Springer-Verlag, Berlin Heidelberg. DOI 10.1007/3-540-30906-3. [Google Scholar] [CrossRef]
29. Kidmo, K. D., Bachirou, B., Kodji, D., Deli, G. (2020). Seasonal wind characteristics and prospects of wind energy conversion systems for water production in the Far north region of Cameroon. Smart Grid and Renewable Energy, 11, 127–164. DOI 10.4236/sgre.2020.119009. [Google Scholar] [CrossRef]
30. Kengne Signe, E. B., Hamandjoda, O., Nganhou, J., Wegang, L. (2017). Technical and economic feasibility studies of a micro hydropower plant in Cameroon for a sustainable development. Journal of Power and Energy Engineering, 5, 64–73. DOI 10.4236/jpee.2017.59006. [Google Scholar] [CrossRef]
31. Adnan, M., Ahmad, J., Ali, S. F., Imran, M. (2021). A techno-economic analysis for power generation through wind energy: A case study of Pakistan. Energy Reports, 7, 1424–1443. DOI 10.1016/j.egyr.2021.02.068. [Google Scholar] [CrossRef]
32. Kidmo, K. D., Kodji, D., Danwe, R., Doka, Y. S. (2016). Wind energy for electricity generation in the far north region of Cameroon. Energy Procedia, 93, 66–73. DOI 10.1016/j.egypro.2016.07.151. [Google Scholar] [CrossRef]
 | This work is licensed under a Creative Commons Attribution 4.0 International License, which permits unrestricted use, distribution, and reproduction in any medium, provided the original work is properly cited. |