| Energy Engineering |
DOI: 10.32604/EE.2021.014578
ARTICLE
Simulation of Electric Field Distribution along Insulator Surface in Polluted Environments
Department of Energy, Power and Mechanical Engineering, North China Electric Power University, Baoding, 071003, China
*Corresponding Author: Yuechi Wang. Email: wyc15573191184@163.com
Received: 10 October 2020; Accepted: 28 December 2020
Abstract: In recent years, more than 50% of the cities in the inland area of our country have suffered from moderate pollution. It can affect the distribution of electric field along the surface of insulator and the pollution characteristics of its surface area, even endanger the safe operation of transmission lines. This paper takes the XSP-160 porcelain three umbrella insulator under the action of 0–±30 kV DC voltage as the research object, and establishes the physical model of the insulator; uses COMSOL software to simulate the electric field of the insulator. The comparison with the results of the wind tunnel test of North China Electric Power University verifies the rationality of the simulation method. In view of the medium pollution environment which often occurs in the inland area, the force of the polluted particles deposited on the insulator under 110 kV DC voltage was analyzed. The distribution characteristics of the electric field along the surface in the clean and three kinds of pollution environment (light, medium and heavy) were simulated and compared. The results showed that: 1) In the moderate pollution environment, the influence of fluid drag force on the movement of polluted particles is greater at the initial stage (0.28–0.33 s); at the late stage (after 0.33 s), the influence of the electric field force begins to increase, and gradually plays a major role in the process of fouling. 2) In the three different polluted environments, the potential along the surface of each umbrella skirt of the insulator increases non-linearly with the increasing of the pollution concentration, and there are apparent potential inflection points near b and l. 3) The pollution particle concentration has the most obvious influence on the electric field along the low-voltage umbrella skirt, whose potential distortion rate can be up to 220 times in the heavy polluted environment.
Keywords: Porcelain three umbrella insulator; surface potential; distortion rate; contamination concentration
In recent years, more than 50% of the cities in the inland area have suffered from moderate pollution [1]. The pollution particles in the atmosphere have increased yearly, which affects the electric field distribution around the insulator and the pollution accumulation on the insulator surface [2,3]. When the local electric field intensity on the insulator surface reaches 30 kV/cm [4], a local arc or even a flashover on the insulator surface will occur. This will pose a serious threat to the safe operation of the power system. Therefore, it is of great academic importance to study the distribution characteristics of the electric field along the surface of the insulator in the polluted environment, so as to reduce the pollution accumulation on the insulator surface and to improve the reliability of the transmission line in the power system.
For a long time, scholars have explored the distribution characteristics of the electric field along the insulator surface. In 2014, Zhao [5] simulated the electric field distribution characteristics of contact line insulators under the dust weather in Northwest China. The results showed that the dust electric field would change the electric field around the insulator. In 2016, Lv et al. [6,7] and Sun [8], respectively, carried out simulations of surface pollution and electric field distribution of porcelain and catenary insulators in a haze environment. They pointed out that haze particles had an important impact on insulator surface pollution. However, the influence of uncharged haze particles on insulator surface electric field was not significant, while the distortion of charged haze particles on the insulator surface electric field was relatively significant. In 2017, Ma [9] carried out a water spray classification test and an insulator simulation. The results showed that the presence of surface water droplets distorted the electric field on the surface of a composite insulator umbrella skirt and increased the electric field value at the junction of triple media (water, air and silicone rubber).
Bouhaouche et al. [10] compared existing glass and composite insulators in three-phase 400 kV AC dual-circuit lines in northwestern Algeria, and pointed out that composite insulators had a lower charge. Mahmoodi et al. [11] measured the surface charge of polymer insulators under AC and DC voltages through experiments. He found that an increase in the surface voltage amplitude led to an increase in the surface charge density. Pu et al. [12] manufactured a robot that operated on 500 kV insulator strings, and they also developed a UV imager to observe the test results. These tests showed that no corona discharge occurred on the optimized robot, and that it can operate safely and steadily along insulator strings. Aouabed et al. [13] observed the behavior of water droplets placed on the surface of silicone resin in an electric field. They believed that parameters of the water droplets would affect the electric field distribution.
Although our research predecessors conducted many studies on the distribution characteristics of the electric field along the insulator, and made some important findings, there are a few reports on the distribution characteristics of the electric field along the insulator under different degrees of pollution. Therefore, this study aimed to analyze the stress behavior of dirty particles near the XSP-160 porcelain three umbrella insulator under 110 kV DC voltage by using COMSOL for the light, medium and severely polluted environments that often occur in inland areas. Simulation and comparative analysis of the electric fields along the insulator surface, in three polluted environments, were conducted to study the degree of electric field distortion.
2 Mathematical Models and Governing Equations
In order to realistically simulate the distribution of the electric field along the surface of the insulator, a layer of virtual “infinite element domain” [14] with a certain thickness was constructed at the outer boundary of the calculation area as an absorption boundary for electromagnetic wave propagation in space. The AC/DC model was used to simulate the electric field distribution in the space around the insulator.
In this model, the steady-state analysis was adopted in the DC electric field. The governing equation [15,16] is:
where E is the electric field intensity vector, V/m; D is the electric displacement intensity vector, C/m2; V is the electric potential, V; ε0 is the vacuum dielectric constant, F/m; ε'0 is the relative dielectric constant of the material; and ρv is the body charge density, C/m3.
The frequency domain analysis was adopted in the AC electric field. The governing equation [17] is:
where J is the total current density vector, A/m2; Qj is the charge amount, C; σ is the conductivity, S/m; Je is the external current density vector, A/m2.
3 Simulation Method Verification
3.1 Model Establishment and Meshing
Corresponding to the wind tunnel test [18], the Solidworks software was used to establish its physical model. Restricted by the size of the test section of the wind tunnel (10.5 m × 1.5 m × 1 m), three pieces of XSP-160 porcelain three umbrella insulator were selected. The insulator’s main structural parameters are single piece diameter 330 mm, structure height 170 μm, creepage distance 545 μm and total length 0.51 m.
The 3D physical model was imported into COMSOL software for simulation. The physical model and skirt numbers of the insulator are shown in Fig. 1. Through the verification of grid independence, the influence of the two factors of calculation, time and accuracy, could be weighed relatively well when the total number of grids was approximately 700 000.
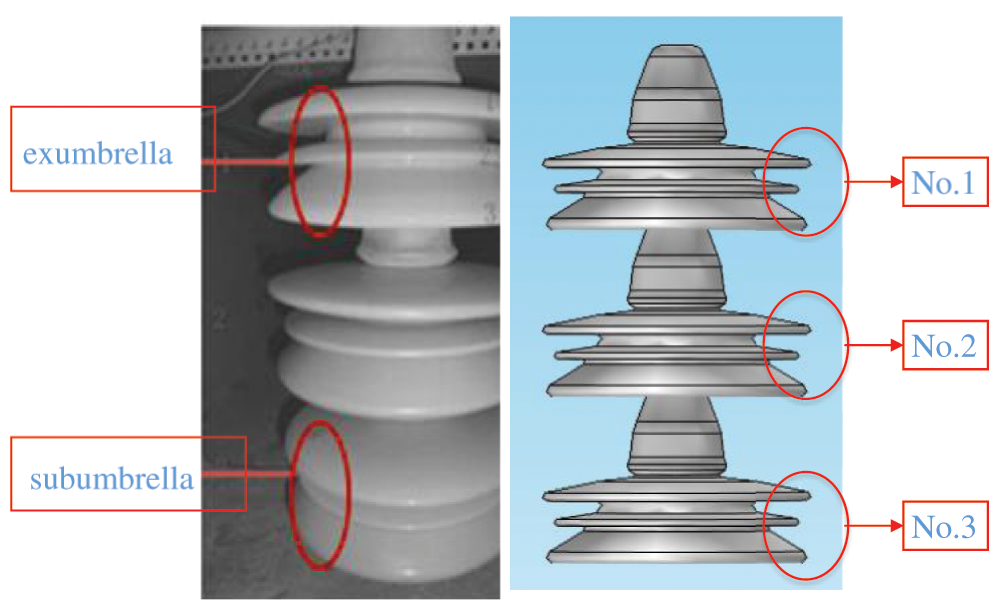
Figure 1: Physical model and skirt numbers of 3 pieces of XSP-160 porcelain umbrella insulator
Representing the actual situation, the fluid in the physics field of the software was set to air, the steel feet and iron cap of the porcelain three umbrella insulator were set to cast iron, and the umbrella group was set to silicone rubber. According to the air pollution conditions in the natural environment of inland areas [19]: When the pollution concentration is 0.15–0.25, 0.25–0.35, 0.35–0.45 mg/m3, the air quality is described as light pollution, moderate pollution and heavy pollution, respectively. For the wind tunnel test, the filthy particulate material was set as diatomite with a size of 50 μm. The wind speed was set at 4 m/s and the pollution concentration was set at 0.26 mg/m3. Nine DC voltages were selected from 0 to ±30 kV. The test duration was set to 15 h, which was the same time as the time required for the porcelain three-umbrella insulator to reach the saturation density.
The distribution characteristics of the electric field along the insulator are influenced by the coupling of three factors in the software: Flow field, electric field and particle field. The boundary conditions of the flow field were set as follows: The front side was a velocity inlet, the rear side was a voltage outlet, and the remaining four sides were set as wall surfaces. The electric field boundary conditions were set as follows: No. 1 umbrella skirt was grounded, No. 3 umbrella skirt was connected to the high-voltage end, and the “infinite element domain” was the electrical insulation boundary. The particle field boundary conditions were set as follows: Particles were released at the entrance, and other boundary condition settings at the entrance and exit were the same as in the flow field. Fig. 2 is a schematic diagram of the boundary conditions of each physical field in the software.
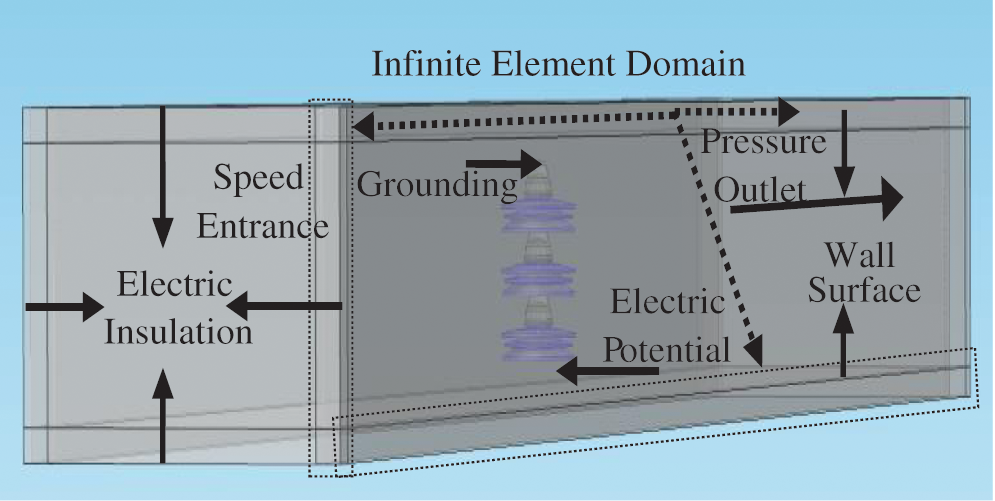
Figure 2: Boundary conditions of physical fields
3.3 Comparison of Wind Tunnel Test Results and Simulation Results
Fig. 3 shows the distribution of equipotential lines and electric field vectors near the insulator.
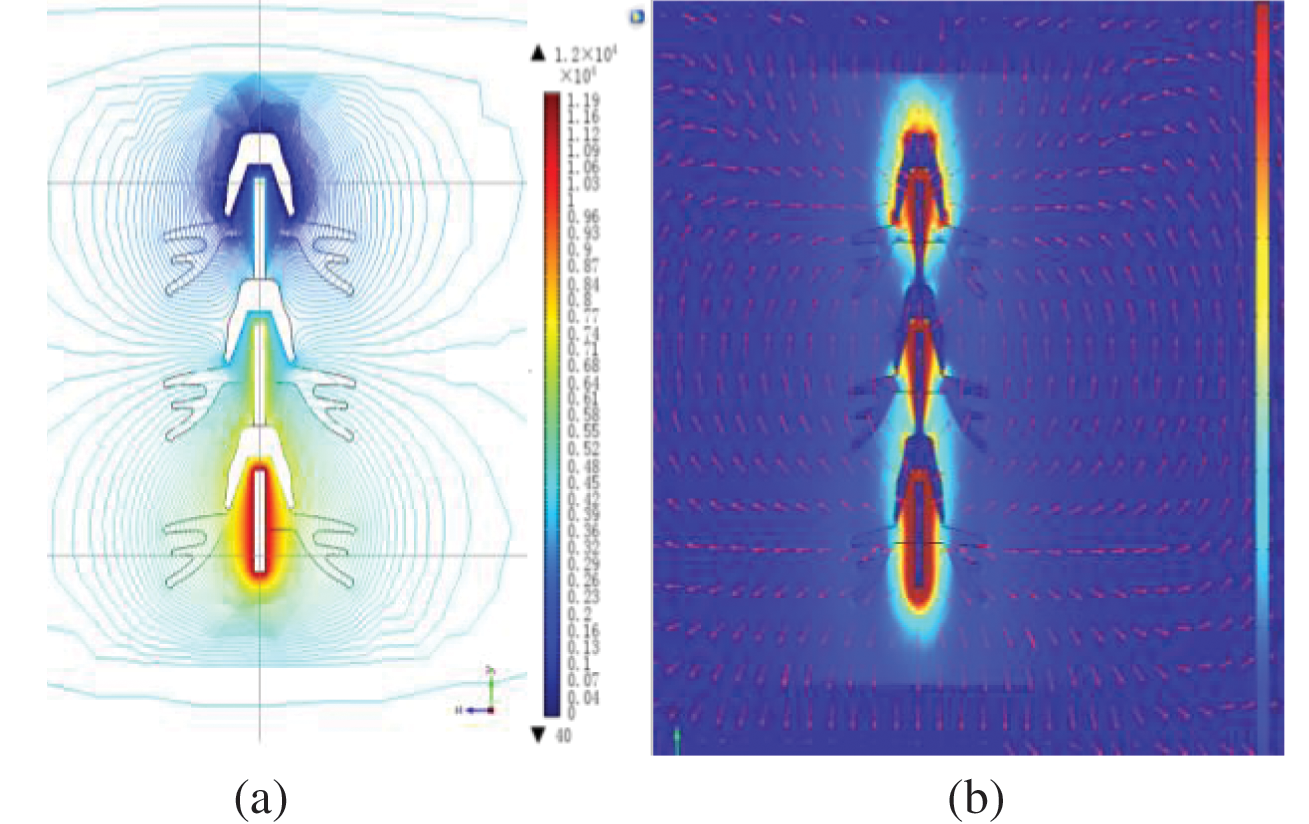
Figure 3: Diagram of equipotential line and electric field vector distribution of insulator in wind tunnel test (a) Equipotential line distribution (b) Vector distribution of field strength
It can be seen from Fig. 3a that the electrical potential near the umbrella skirt of the insulator at the high-voltage end is significantly higher than that at the low-voltage end. The closer to the wall of the insulator, the denser the contour of the electrical potential will be. The electrical potential gradients near the high-voltage terminal and the grounding terminal are large, indicating that the electric field strength is strong. As shown in Fig. 3b, the insulator has a high field strength at both ends, which is in accordance with the principle of electromagnetic field. The two sub-pictures in Fig. 3 can be mutually confirmed. Therefore, the electric field distribution obtained by the simulation method can more accurately reflect the distribution characteristics of the actual electric field along the test insulator in the wind tunnel.
NSDD is defined as the mass of polluted particles deposited on unit surface area of insulator. The calculation formula is:
where n is the total amount of dirty particles deposited (available directly in the software); ξ is the time correction factor; mp is the mass of the particles, kg; ts is the total duration of the test accumulation, s; tp is simulated fouling time, s; S is the total surface area of the umbrella skirt, m2.
Fig. 4 is a comparison diagram of the simulation result and the test result of the pollution accumulation on the surface of the insulator. In the test and simulation, the measurement and simulation were repeated three times for each operating condition and the average value was taken. It can be seen from Fig. 4: The simulation of the amount of fouling is at the same level as the test results. The trend of the change with the voltage is consistent (have a “V” distribution). The average relative error of the test and simulation results is approximately 20%. It can be concluded that the simulation method used is acceptable.
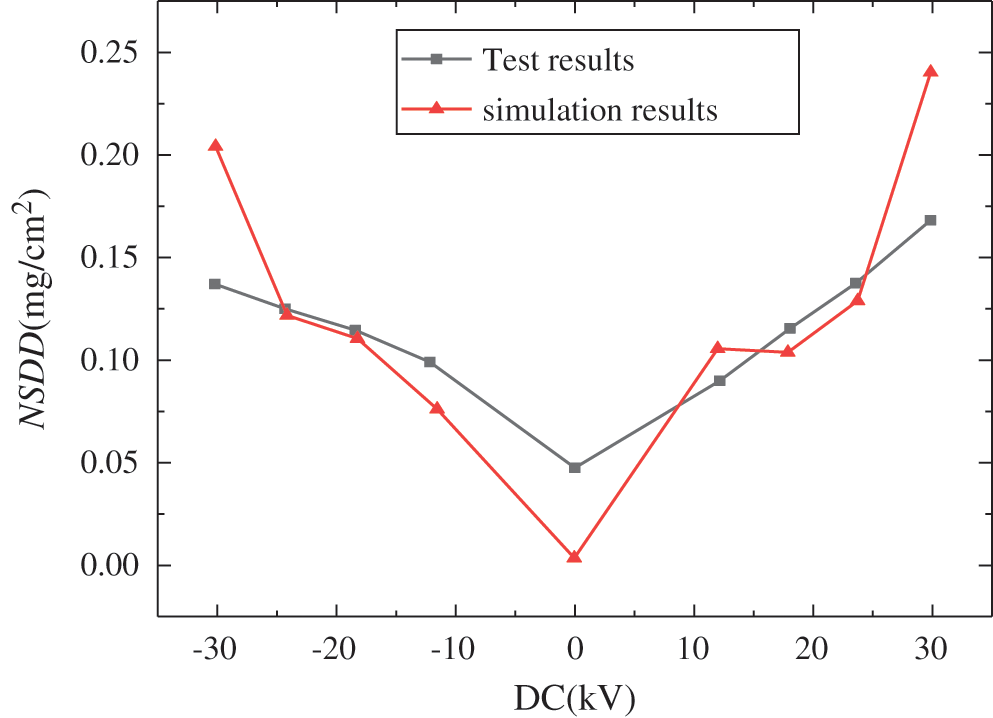
Figure 4: Comparison between simulation and test of the wind test
4 Distribution Characteristics in Electric Field of Insulators in Polluted Environments
The environment with no dirty particles around the insulator is defined as a clean environment, while the environment with dirty particles is defined as a polluted environment. According to the air quality, the pollution concentrations can be set to 0.15, 0.26, and 0.45 mg/m3 for light, medium, and heavy polluted environments, respectively. Selecting the XSP-160 porcelain three umbrella insulator under 110 kV DC voltage as the research object, the stress situation and the distribution characteristics of the electric field along the surface of the insulator in each polluted environment were explored.
4.1 Model Establishment and Meshing
According to the relationship between the voltage level and the number of insulators [20], corresponding to the actual transmission line voltage of 110 kV, seven XSP-160 porcelain three umbrella insulators were selected. The number and boundary conditions of the umbrella skirts of the porcelain three umbrella insulators are shown in Fig. 5. Among them, the highest end of No. 1 umbrella skirt is grounded, and the lowest end of No. 7 umbrella skirt is applied with 110 kV DC voltage. After verification of grid independence, it was finally determined that when the grid number was approximately 820 000, the calculations of accuracy and amount could be better weighed.
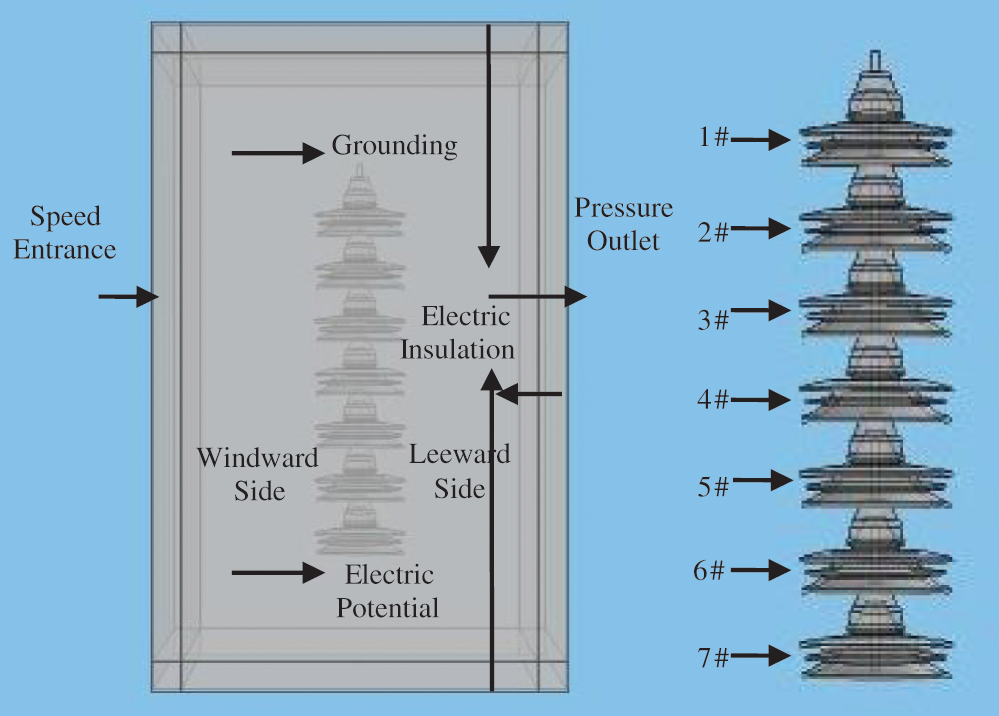
Figure 5: Boundary condition of physical field in clean environment
The distribution of the electric field along the surface of the insulator was studied with the creepage distance. The creepage distance and characteristic inflection point number of the porcelain three umbrella insulator model are shown in Fig. 6. Its creepage distance [21] is “a→b→…g…m→n”.
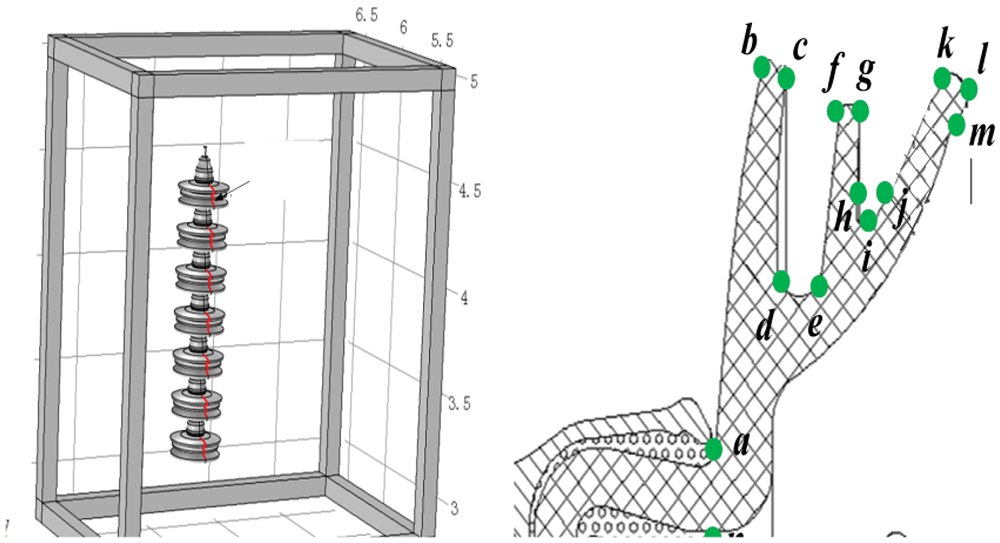
Figure 6: Diagram of insulator creepage distance and characteristic inflection point numbers
The electrostatic field module was selected in the clean environment. In the polluted environment, the electrostatic field module and the charged particle tracking module were selected for two-way coupling, with the wind speed of 3 m/s, particle size of 30 µm, density of 2200 kg/m3, and a charge mass ratio of +1.58 × 10⁻⁴ C/kg [22]. In the two kinds of environments, other conditions were consistent with the wind tunnel simulation conditions.
4.3 Stress Analysis of Dirty Particles
The study of the stress of the polluted particles around the insulator provides the basis for the analysis of the distribution characteristics of the electric field along the surface of the insulator, and lays the foundation for the study of its fouling characteristics. Consider the moderately polluted environment as an example. The right-hand rectangular coordinate system was established, the Z-direction was the direction of incoming flow, and the Y-direction was the direction of the insulator suspension, and opposite to the direction of gravity in the system.
The track of the contaminated particles movement is mainly affected by the electric field force, gravity and fluid drag force [23]. The component and resultant forces of the particles in X, Y and Z directions are shown in Fig. 7, where the horizontal axis is the simulation time.
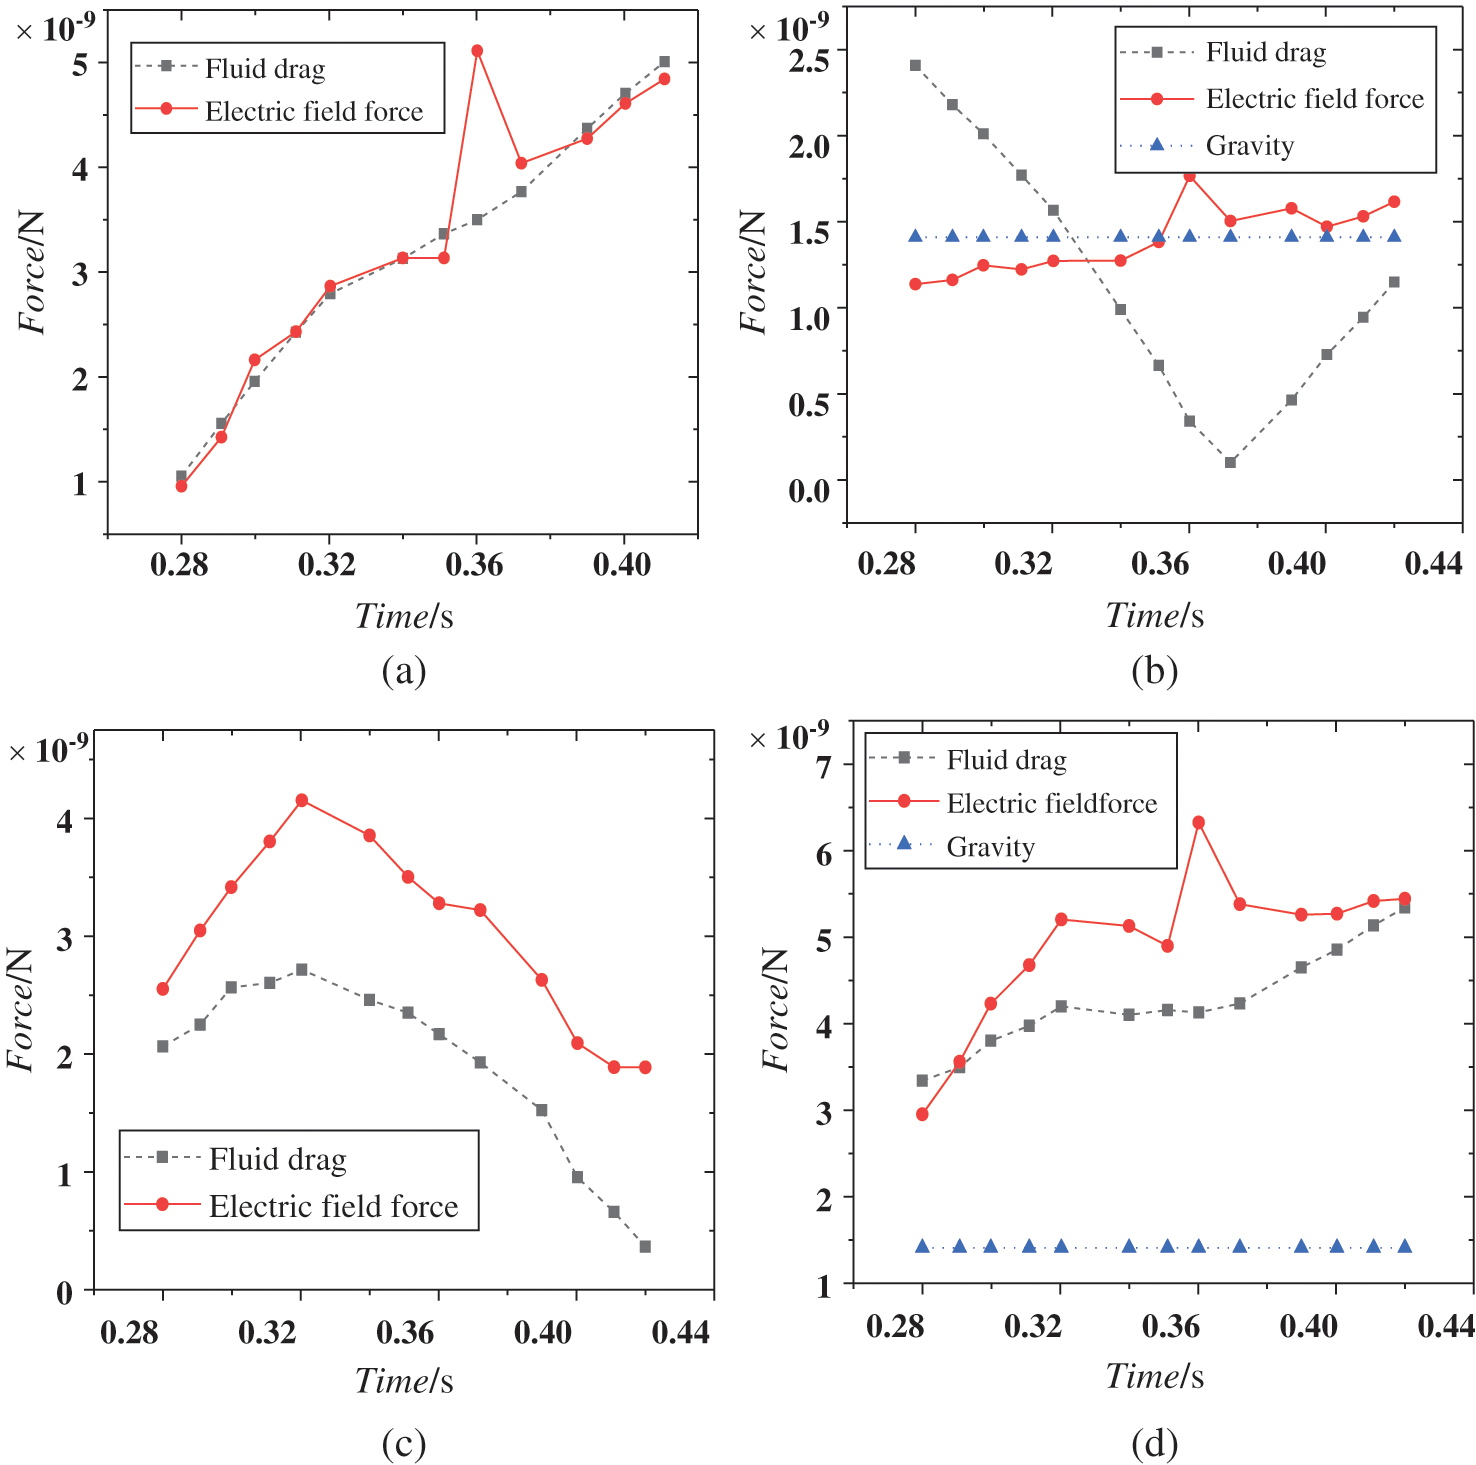
Figure 7: Variation of component force and resultant force in X, Y, Z directions of pollution particles near insulator with time (a) X-direction (b) Y-direction (c) Z-direction (d) Resultant forces
In the X-direction, there is little difference between the fluid drag force and the electric field force. In the Y-direction, the gravity and the electric field force are approximately the same, and the fluid drag force changes greatly with time. In the early stage (0.28–0.33 s), the force condition on the polluted particles is as follows: Fluid drag force > gravity > electric field force. But in the late stage (after 0.33 s), the electric field force plays an important role on the polluted particles. In this late stage the force condition on the polluted particles is as follows: Electric field force > gravity > fluid drag force. In the Z-direction, the force condition on the polluted particles is as follows: Electric field force > fluid drag force.
When the component forces in the three directions are combined into one, the resultant force of the polluted particles is as follows: Electric field force > fluid drag force > gravity.
In conclusion, in the early stage (0.28–0.33 s), the influence of the fluid drag is greater; in the late stage (after 0.33 s), the influence of the electric field force begins to increase, and gradually plays a major role in the process of fouling. It is necessary to study further the distribution characteristics of the electric field along the surface of the insulator because of the distortion of the electric field along the surface caused by the charged particles.
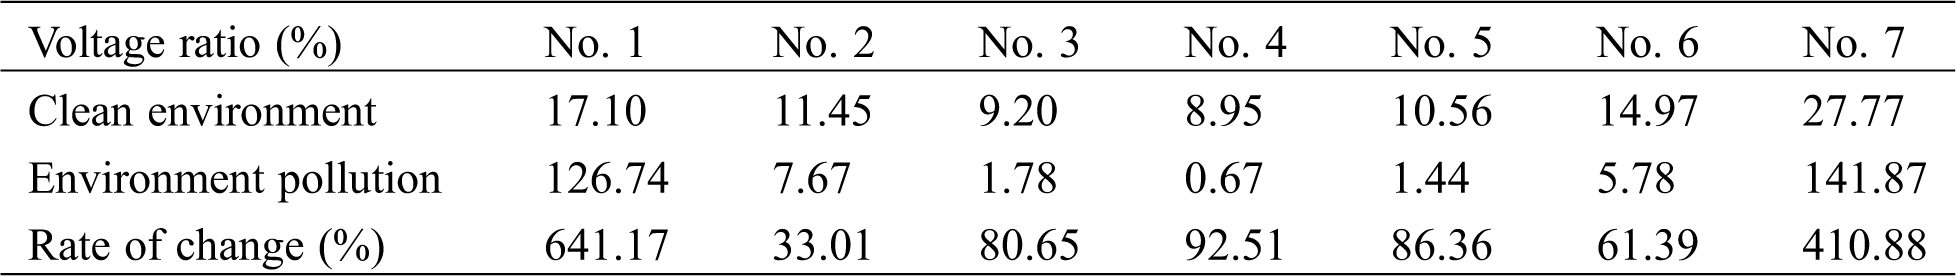
4.4 Distribution of Electric Field along the Surface in Medium Polluted Environment
Based on the electrical surface potential as the evaluation standard, the distribution of the electric field along the surface of each umbrella skirt in clean and polluted environment is shown in Fig. 8. The electric field along the surfaces of Nos. 1–7 umbrella skirts of porcelain three umbrella insulators in clean and polluted environment shows that almost all the inflexion points of the electrical potential curve along the surface of each umbrella skirt correspond to the characteristic inflexion points of the insulator. However, there are still great differences in the surface potential curves between the two environments. In the clean environment, the surface potential curves of Nos. 1–4 umbrella skirts are approximately M-shaped (first increasing and then decreasing), and the surface potential curves of Nos. 5–7 umbrella skirts are approximately W-shaped (first decreasing and then increasing). In the medium polluted environment, the surface potential curves of Nos. 1–4 umbrella skirts generally increase first and then keep flat with small fluctuations, and the trend of the potential curves along the surface of Nos. 5–7 decreases.
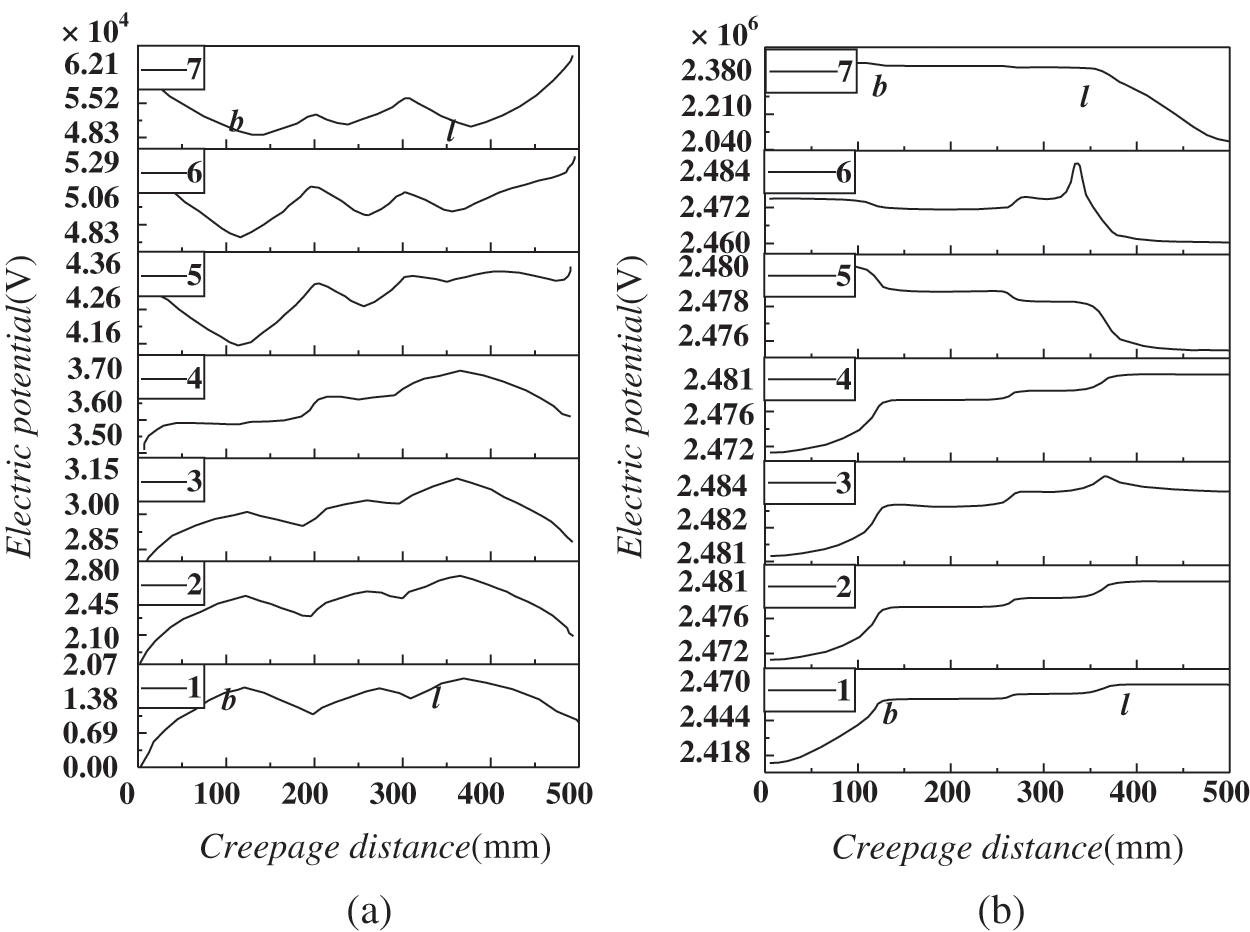
Figure 8: Distribution of electric field along the surface of each umbrella skirt in two environments (a) Clean environment (b) Moderately polluted environment
Comparing Figs. 8a and 8b, it can be found that the polluted particles have a significant effect on the electric field along the low-voltage umbrella skirt. Because of the charged particles, the electrical potential along the surface in the polluted environment is higher than that of the clean environment and fluctuates greatly. Tab. 1 shows the percentage of the withstand voltage (potential difference between the high and low voltage ends) of Nos. 1–7 umbrella skirts in the overall working voltage (potential difference between the high and low voltage ends) of the insulator and its rate of change in the two types of environments. It can be seen from Tab. 1 that the voltage of each umbrella skirt of the insulator in the polluted environment, whose electric field distortion is more serious, is generally more uneven than that in the clean environment and this is most obvious in No. 1 and No. 7 umbrella skirts.
Table 1: Voltage ratio of each umbrella skirt and its rate of change
4.5 Distribution of the Electric Field along the Surface in Light and Heavy Polluted Environments
Fig. 9 presents distributions of the electric field along the surface of each umbrella skirt under light and heavy pollution environments. It can be seen from Fig. 9 that the change trend of the potential with creepage distance in the two polluted environments is similar. The umbrella skirt at the low-voltage end gradually increases and tends to be gentle, but the umbrella skirt at the high-voltage end gradually decreases. Compared with the clean environment, the greater the pollution concentration is, the more obvious the potential distortion will be.
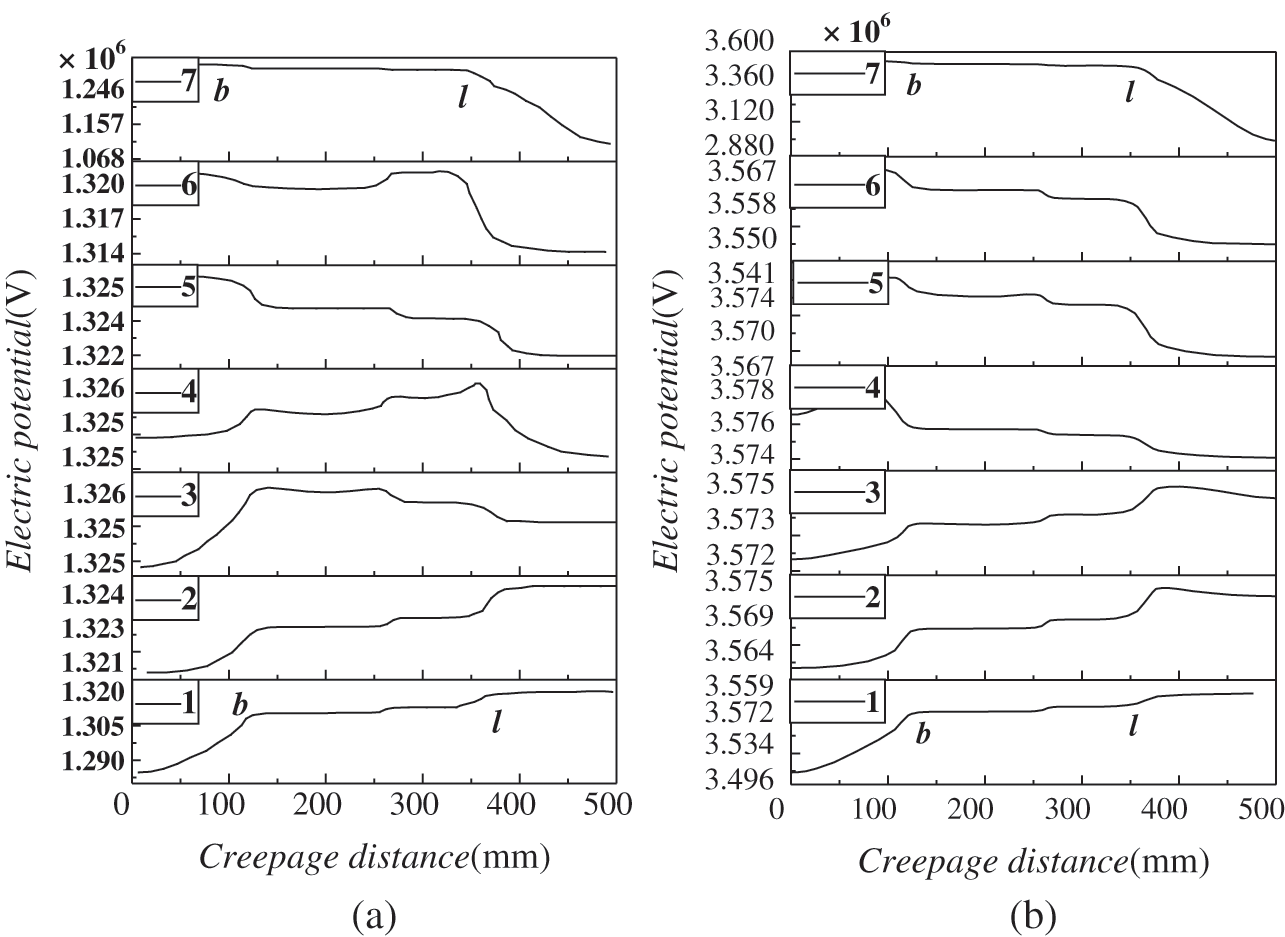
Figure 9: Distribution of electric field along the surface of skirts in light and heavy polluted environment (a) Light polluted environment (b) Heavily polluted environment
Comparing electrical potentials in three different polluted environments, it can be found that the electrical potentials of the umbrella skirts of the insulator increase non-linearly with the increase of the pollution concentration, and there are obvious potential inflection points near b and l. Fig. 10 shows the electrical potential distortion rate, named σ, near the inflection points b and l of each umbrella skirt in clean and in three polluted environments. The expression is:
where V is the electric potential of the insulator in each polluted environment, V; V0 is the electric potential of the insulator in clean environment, V.
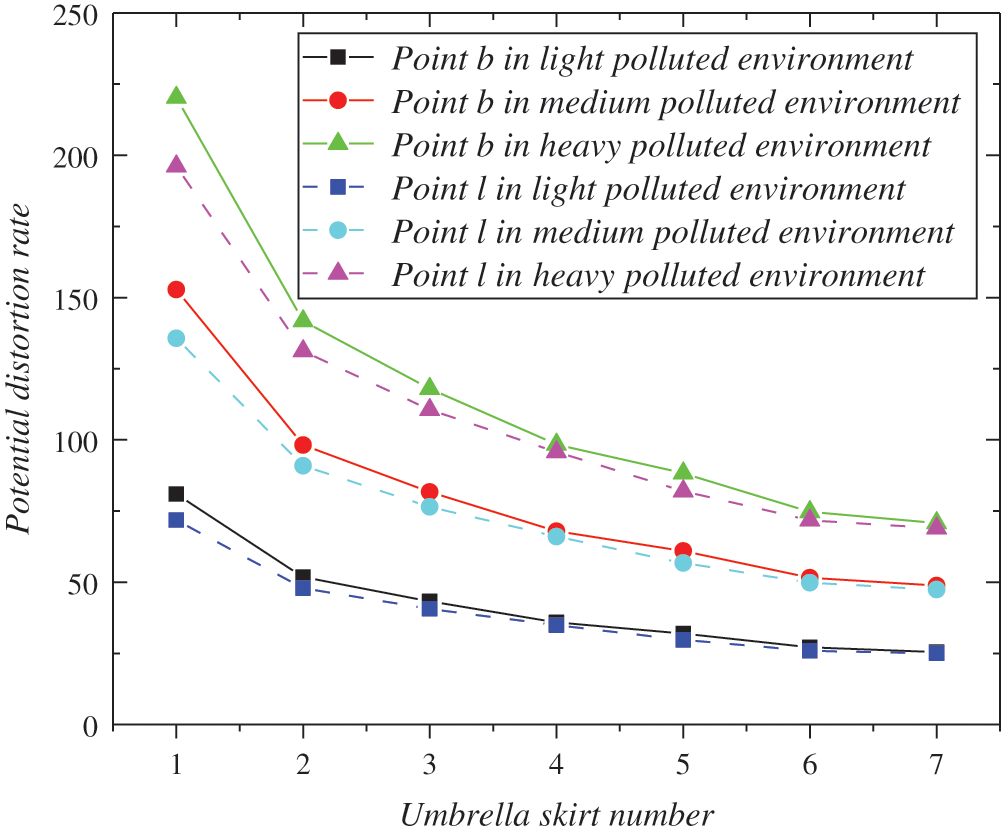
Figure 10: Electric potential around b and l of skirts in clean and three polluted environments
As shown in Fig. 10, it can be seen that the potential distortion of each apron along the surface near the two characteristic points is obvious. The difference between the distortion rates at b and l is small, whose range is 25–80, 48–152, 69–220 in light, medium and heavy pollution environments respectively. In the three polluted environments, the potential of No. 1 umbrella skirt (low-voltage end) is the most affected; in the heavy polluted environment, the distortion rate can reach up to 220 times. This finding conforms to the conclusion in Fig. 8. Therefore, measures can be taken near the low-voltage end to enhance the reliability of the insulator.
1. The influence of fluid drag force on the movement of polluted particles is greater at the initial stage (0.28–0.33 s); at the late stage (after 0.33 s), the influence of the electric field force begins to increase, and gradually plays a major role in the process of fouling.
2. In the polluted environment, the electrical potential of each umbrella skirt is higher than that of the clean environment, and the electric field distortion is serious. The greater the pollution concentration is, the more apparent the potential distortion of the skirts Nos. 3 and 4 will be.
3. In the three different polluted environments, the potential along the surface of each umbrella skirt of the insulator increases non-linearly with the increasing of the pollution concentration, and there are apparent potential inflection points near b and l.
4. The pollution particle concentration has the most obvious influence on the electric field along the low-voltage umbrella skirt, whose potential distortion rate can be up to 220 times in the heavy polluted environment.
Funding Statement: Science and Technology Project of State Grid Corporation (GY7111053) [www.sgcc.com.cn].
Conflicts of Interest: The authors declare that they have no conflicts of interest to report regarding the present study.
1. Li, L. H., Zheng, C. (2014). Development status of stain-resistant self-cleaning coatings in China. Coating Technology and Abstracts, 35(7), 23–28. [Google Scholar]
2. Li, C. R., Lv, Y. Z., Cui, X., Du, X. Z., Cheng, Y. C. et al. (2008). The problems faced by the safe operation of China’s power grid under the conditions of ice and snow disasters, vol. 4, pp. 14–22. Beijing: Power Grid Technology. [Google Scholar]
3. Zhang, Z. J., Qiao, X. H., Yang, S. H., Jiang, X. L. (2018). Non-uniform distribution of contamination on composite insulators in HVDC transmission lines. Applied Sciences, 8(10), 48–55. [Google Scholar]
4. Zhou, H., Yu, Y. H. (2005). Discussion on some important issues in the development of UHV transmission in China. Grid Technology, 12, 1–9. [Google Scholar]
5. Zhao, S. P. (2014). Simulation study on electric field distribution of contact insulators in sand and dust environment. Lanzhou Jiaotong University. [Google Scholar]
6. Lv, Y. K., Li, J. G., Zhang, X. M., Pang, G. L., Liu, Q. (2016). Simulation study on pollution accumulation characteristics of XP13-160 porcelain suspension disc insulators. IEEE Transactions on Dielectrics and Electrical Insulation, 23(4), 2196–2206. DOI 10.1109/TDEI.2016.7556495. [Google Scholar] [CrossRef]
7. Lv, Y. K., Li, J. G., Zhao, W. P. (2017). Model optimization of pollution deposition criterion of insulators based on energy. IEEE Transactions on Dielectrics and Electrical Insulation, 24(5), 2920–2929. DOI 10.1109/TDEI.2017.006666. [Google Scholar] [CrossRef]
8. Sun, C. (2017). Simulation study on the electric field distribution of the contact network insulator in the smog environment. Lanzhou Jiaotong University. [Google Scholar]
9. Ma, H. C. (2017). Study on the effect of surface water beads on the surface discharge of composite insulator strings. Xi’an University of Technology. [Google Scholar]
10. Bouhaouche, M., Mekhaldi, A., Teguar, M. (2017). Improvement of electric field distribution by integrating composite insulators in a 400 kV AC double circuit line in Algeria. IEEE Transactions on Dielectrics and Electrical Insulation, 24(6), 3549–3558. DOI 10.1109/TDEI.2017.006011. [Google Scholar] [CrossRef]
11. Mahmoodi, J., Mirzaie, M., Shayegani-Akmal, A. A. (2019). Surface charge distribution analysis of polymeric insulator under AC and DC voltage based on numerical and experimental tests. International Journal of Electrical Power & Energy Systems, 105, 283–296. DOI 10.1016/j.ijepes.2018.08.006. [Google Scholar] [CrossRef]
12. Pu, Z. H., Xiong, Y. Y., Wang, H. T., Yan, B. W., Wu, T. et al. (2019). Design and construction of a new insulator detection robot for application in 500 kV strings: Electric field analysis and field testing. Electric Power Systems Research, 173(4), 48–55. DOI 10.1016/j.epsr.2019.03.025. [Google Scholar] [CrossRef]
13. Aouabed, F., Bayadi, A., Rahmani, A. E., Boudissa, R. (2018). Finite element modelling of electric field and voltage distribution on a silicone insulating surface covered with water droplets. IEEE Transactions on Dielectrics and Electrical Insulation, 25(2), 413–420. DOI 10.1109/TDEI.2017.006568. [Google Scholar] [CrossRef]
14. Chang, S. (2019). Research on transient electromagnetic response law of mine multi-form water-bearing body based on finite element method. China University of Mining and Technology. [Google Scholar]
15. Wang, J. F., Huang, Z. D., Wang, Y. L., Chen, Z. Y., Pan, K. N. (2012). Dynamic model of coupled arc based on explosive gas flow field. Chinese Journal of Electrical Engineering, 32(7), 154–160. [Google Scholar]
16. Li, J. H., Farquharson, C. G., Hu, X. Y., Zeng, S. H. (2016). Three-dimensional forward modeling of grounded long wire source based on the electric field total field vector finite element method. Journal of Geophysics, 59(4), 1521–1534. [Google Scholar]
17. Yao, J. F., Jiang, Z. P., Zhao, T., Wang, H., Chen, B. et al. (2019). Cell mediated electrophoretic mobility analysis in microfluidic chip with multi electrode array. Analytical Chemistry, 47(2), 221–228. [Google Scholar]
18. Li, J. G. (2017). Simulation study on the fouling characteristics of porcelain insulators under strong wind environment. North China Electric Power University. [Google Scholar]
19. Jia, Q., Ye, C. S. (2019). Typical correlation analysis of construction land structure and air quality in 35 large and medium-sized cities in China. Chinese Agricultural Science Bulletin, 35(25), 84–93. [Google Scholar]
20. Li, R. F., Wu, G. N., Ma, Y. T., Fan, C. L. (2019). Research on the relevant factors of lightning resistance level of UHV AC transmission lines. Electric Porcelain Arrester, 3, 14–17. [Google Scholar]
21. Velasquez, A., Manuel, R., Lara, M., Vanessa, J. (2018). The need of creating a new nominal creepage distance in accordance with heaviest pollution 500 kV overhead line insulators. Engineering Failure Analysis, 86, 21–32. [Google Scholar]
22. Hu, W. W. (2012). Study on the mechanism and charge-to-mass ratio of the sand belt in the wind and sand flow. Lanzhou University. [Google Scholar]
23. Elimelech, M., Gregory, J., Jia, X. (2013). Particle deposition and aggregation: Measurement, modelling and simulation. Butterworth-Heinemann. [Google Scholar]
 | This work is licensed under a Creative Commons Attribution 4.0 International License, which permits unrestricted use, distribution, and reproduction in any medium, provided the original work is properly cited. |