DOI: 10.32604/EE.2021.014178
ARTICLE
Internet of Things Enabled Intelligent Energy Management and Control System for Heavy Equipment Industrial Park and Fuzzy Assessment of Its Schemes
College of Computer Science, Baicheng Normal University, Baicheng, 137000, China
*Corresponding Author: Jia Zhu. Email: zjnc12@21cn.com
Received: 07 September 2020; Accepted: 12 October 2020
Abstract: In order to solve the problems of poor information flow, low energy utilization rate and energy consumption data reuse in the heavy equipment industrial park, the Internet of Things (IoT) technology is applied to construct the intelligent energy management and control system (IEMCS). The application architecture and function module planning are analyzed and designed. Furthermore, the IEMCS scheme is not unique due to the fuzziness of customer demand and the understanding deviation of designer to customer demand in the design stage. Scheme assessment is of great significance for the normal subsequent implementation of the system. A fuzzy assessment method for IEMCS scheme alternatives is proposed to achieve scheme selection. Fuzzy group decision using triangular fuzzy number to express the vague assessment of experts is adopted to determine the index value. TOPSIS is modified by replacing Euclidean distance with contact vector distance in IEMCS scheme alternative assessment. An experiment with eight IEMCS scheme alternatives in a heavy equipment industrial park is given for the validation. The experiment result shows that eight IEMCS scheme alternatives can be assessed. Through the comparisons with other methods, the reliability of the results obtained by the proposed method is discussed.
Keywords: Internet of Things; energy management and control; industrial park; fuzzy group decision
In the 21st century, energy has become the lifeblood of national economic development. Behind the political, economic and military activities all over the world, there is energy shadow [1–3]. China is a big country of energy production and consumption, and the current situation of energy use in China is grim. Among them, industry is the largest energy consumer in China, and its energy consumption accounts for about 70% of the total energy consumption. Moreover, China’s industrial energy consumption structure is still extensive, and enterprises have great potential for energy optimization. Therefore, it is of great significance to guide enterprises to adopt information technology spontaneously, carry out energy-saving technology research and development, and create follow-up capacity for continuous improvement of energy efficiency. In the energy-saving transformation of industrial enterprises, it can be noticed that the traditional equipment energy-saving work has been basically. In order to achieve the requirements of further energy conservation and emission reduction, the overall energy saving of the system must be started [4–7]. Considering that many industrial enterprises have their own energy production and supply system, the system energy saving is not a single energy production system, energy transmission system or energy utilization system, but the whole process integration energy saving from energy production to terminal equipment application. To achieve the whole process integration of energy saving, it is necessary to rise from simple technical energy saving to management energy saving, which is from the management of energy production and transmission to the production energy saving management of terminal energy consuming equipment.
This paper takes an industrial base with the manufacturing capacity of extra large, heavy and over limited equipment as the research object. A variety of energy supply systems have been established in the base to meet different forms of energy demand [6,7]. However, there is much high-power single equipment (especially test equipment) in the base, and the production has the characteristics of discontinuity, which leads to large peak valley difference of energy consumption and low utilization rate of energy supply equipment. In view of this, combined with the industrial Internet of Things (IoT) technology [8,9], through the establishment of intelligent energy management and control platform, the online monitoring of energy, the prediction of energy supply and consumption, the optimization of production process and the optimal scheduling of production plan are realized. Considering the energy management mode of two-way interaction between energy supply and energy consumption, a closed-loop energy management and control system is established. It can improve equipment utilization and reduce energy consumption per unit output value of the base. The system energy saving from energy production to terminal equipment energy consumption is realized, and the intelligent energy management and control system (IEMCS) is designed and developed.
In the design stage of IEMCS, due to the fuzziness of demand and the understanding deviation of designer to demand, the alternative of IEMCS scheme is not unique. The performance of the alternative is directly related to the satisfaction of users [10–13]. It is particularly important to assess multiple alternatives of IEMCS scheme and achieve the assessment decision optimization.
Thus, this research paper seeks answers to the following questions:
• How to analyze and design the application architecture and function module of IoT enabled IEMCS?
• How to effectively assess the potential of the alternatives of IEMCS scheme?
To fill up this gap, this paper attempts to analyze and design the application architecture and functional module planning of IoT enabled IEMCS in industrial park and achieves a closed-loop information management framework. Furthermore, scheme assessment is of great significance to ensure the normal subsequent implementation. Unlike the accurate number-based methods that employ fixed numbers to express the perception of experts, the fuzzy numbers can represent the vague assessment of experts more reasonably. Fuzzy numbers showed good potentiality in collective decision analysis under subjective and vague perceptions of experts.
Since its inception, fuzzy number has gained several potential applications, for example, a fuzzy rough number-based analytic hierarchy process (AHP) and technique for order preference by similarity to an ideal solution (TOPSIS) model [14], an integrated group decision method based on support vector machine (SVM), trapezoidal fuzzy number (TFN), rough sets (RS), AHP and TOPSIS for cloud service supplier selection [15], an evaluation model with linguistic information in terms of three trapezoidal fuzzy numbers [16], an interval-valued fuzzy number method for the evaluation of the key development factors [17], a conjunctive multiple-criteria decision-making approach based on improved TOPSIS [18], an environmental efficiency evaluation method with left-right fuzzy numbers [19], an evaluating model with fuzzy number intuitionistic fuzzy information [20] and a hybrid model based on fuzzy rough-sets AHP, multistage weight synthesis, and PROMETHEE II for green performance evaluation [21].
To the best of our knowledge, there is no systematic framework for the application architecture and functional module planning of IEMCS and the assessment of IEMCS schemes under subjective and vague information. Thus, in this paper, the application architecture and function module of IoT enabled IEMCS are analyzed and designed, and then an assessment technique of IEMCS scheme alternatives based on fuzzy group decision and modified TOPSIS by replacing Euclidean distance with contact vector distance which is a concept in set pair analysis theory [22] is proposed as a solution methodology for the assessment and selection of IEMCS scheme alternatives.
The rest of this work is arranged as follows. Section 2 introduces the research framework of this paper. The application architecture of IoT enabled IEMCS are analyzed in Section 3. Section 4 designs the related function module planning which includes seven modules. In Section 5 a fuzzy assessment of IEMCS scheme alternatives is explored which is based on fuzzy group decision and modified TOPSIS. Case study is given in Section 6 by an application of the assessment of eight IEMCS scheme alternatives of heavy equipment industrial park, while the results and validation of the proposed method is also discussed in this section. Finally, Section 7 summarizes the conclusion.
For the whole process integration of energy saving in heavy equipment industrial park, it is of great significance to establish the intelligent energy management and control platform which is called IEMCS in this paper. By IEMCS, online monitoring of energy, prediction of energy supply and consumption, optimization of production process and optimal scheduling of production plan can be realized. After the overall design of IEMCS, several feasible scheme alternatives will be generated by multi-objective configuration. For the propitious implementation, the feasible schemes should be assessed and selected. This paper focuses on the designing and planning of IEMCS. Its research framework contains two parts: the overall design and subsequent scheme assessment, which is shown in Fig. 1.
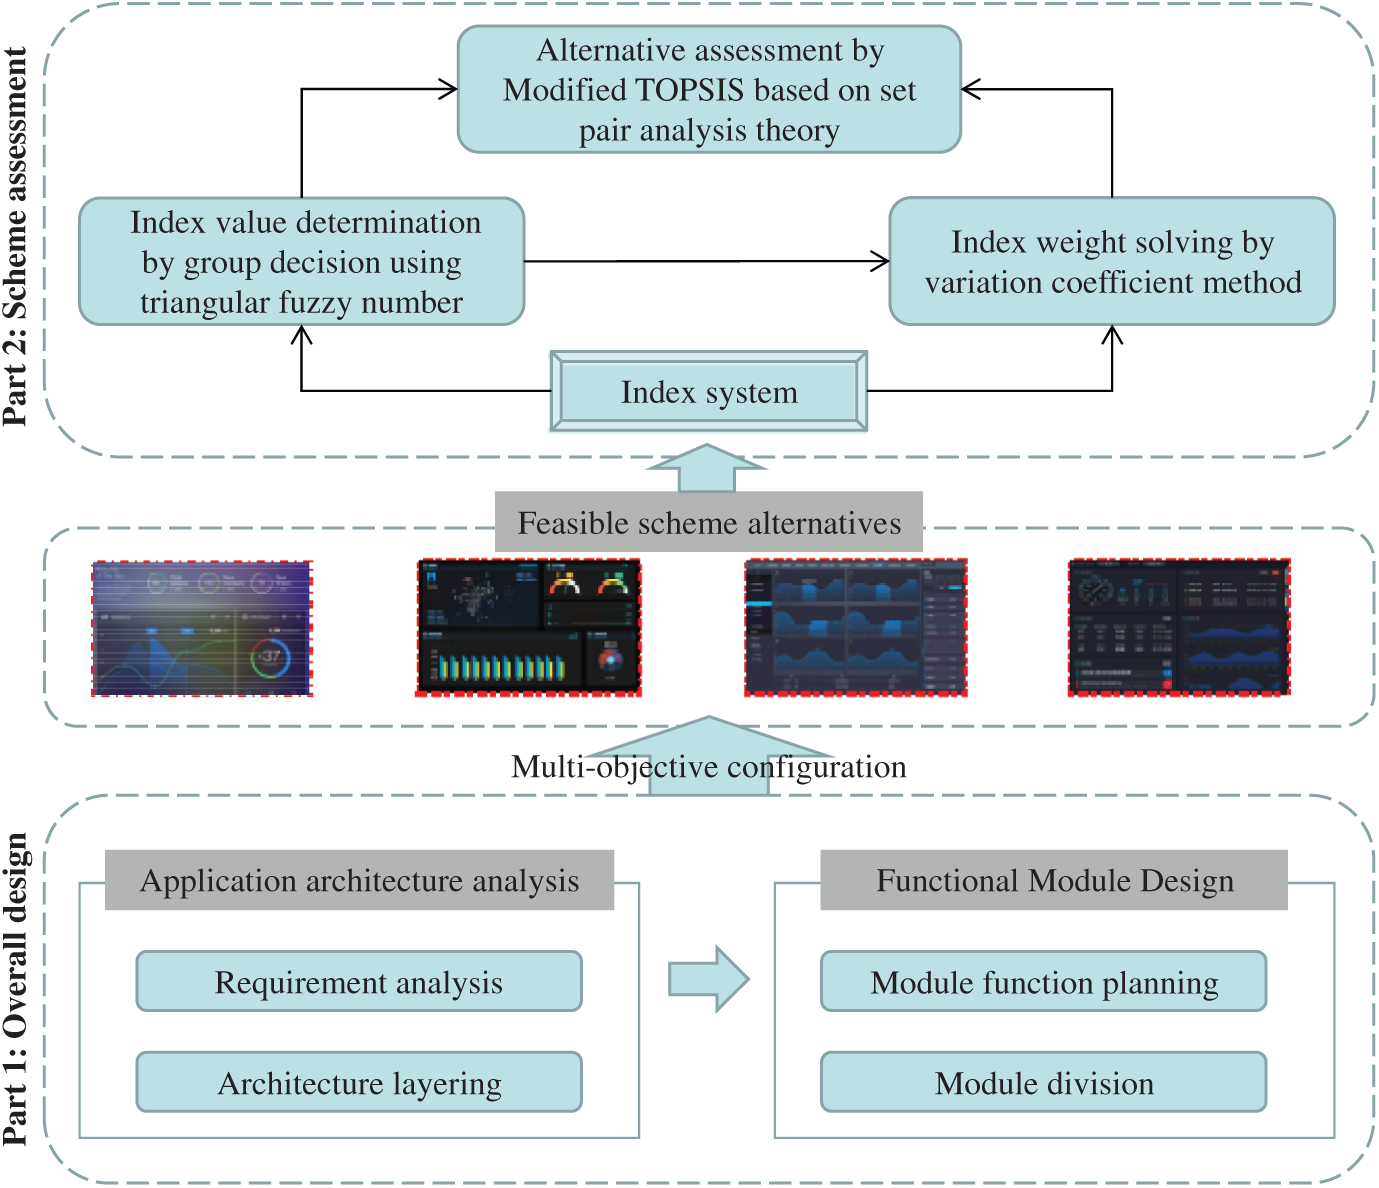
Figure 1: Research framework
In the following of this paper, part 1 contains Sections 3 and 4, while part 2 corresponds to Section 5.
3 Application Architecture Analysis
At present, the energy management of a typical large-scale heavy equipment industrial park is mainly to arrange manual meter reading, summarize the meter reading data and make tables according to the demand. The simple meter reading or power detection system has low efficiency of information collection and weak resource sharing ability, which cannot effectively and timely monitor the energy consumption of functions in real time, and lack the statistics, collation and analysis of massive data, and thus lack the data basis of effective decision-making mechanism. The IoT is considered to be another technological revolution after the Internet wave. Therefore, with the IoT as the technical support, the intelligent energy management and control system can repeatedly play the role of the intelligent monitoring equipment that has been built or will be built, so as to realize the comprehensive IoT of the functional energy environment of the large enterprise park, so as to ensure the timeliness, accuracy and security of the collected data, and provide scientific basis for subsequent comprehensive decision-making. IoT is a kind of network that connects goods with network for information exchange and communication through radio frequency identification (RFID), infrared sensor, global positioning system, laser scanner and other information sensing equipment according to the agreement, so as to realize intelligent identification, positioning, tracking, monitoring and management.
The overall framework of IEMCS can be realized according to the architecture of Internet of things. The IoT includes three layers: perception extension layer, network layer, business and application layer. The overall platform architecture is shown in Fig. 2.
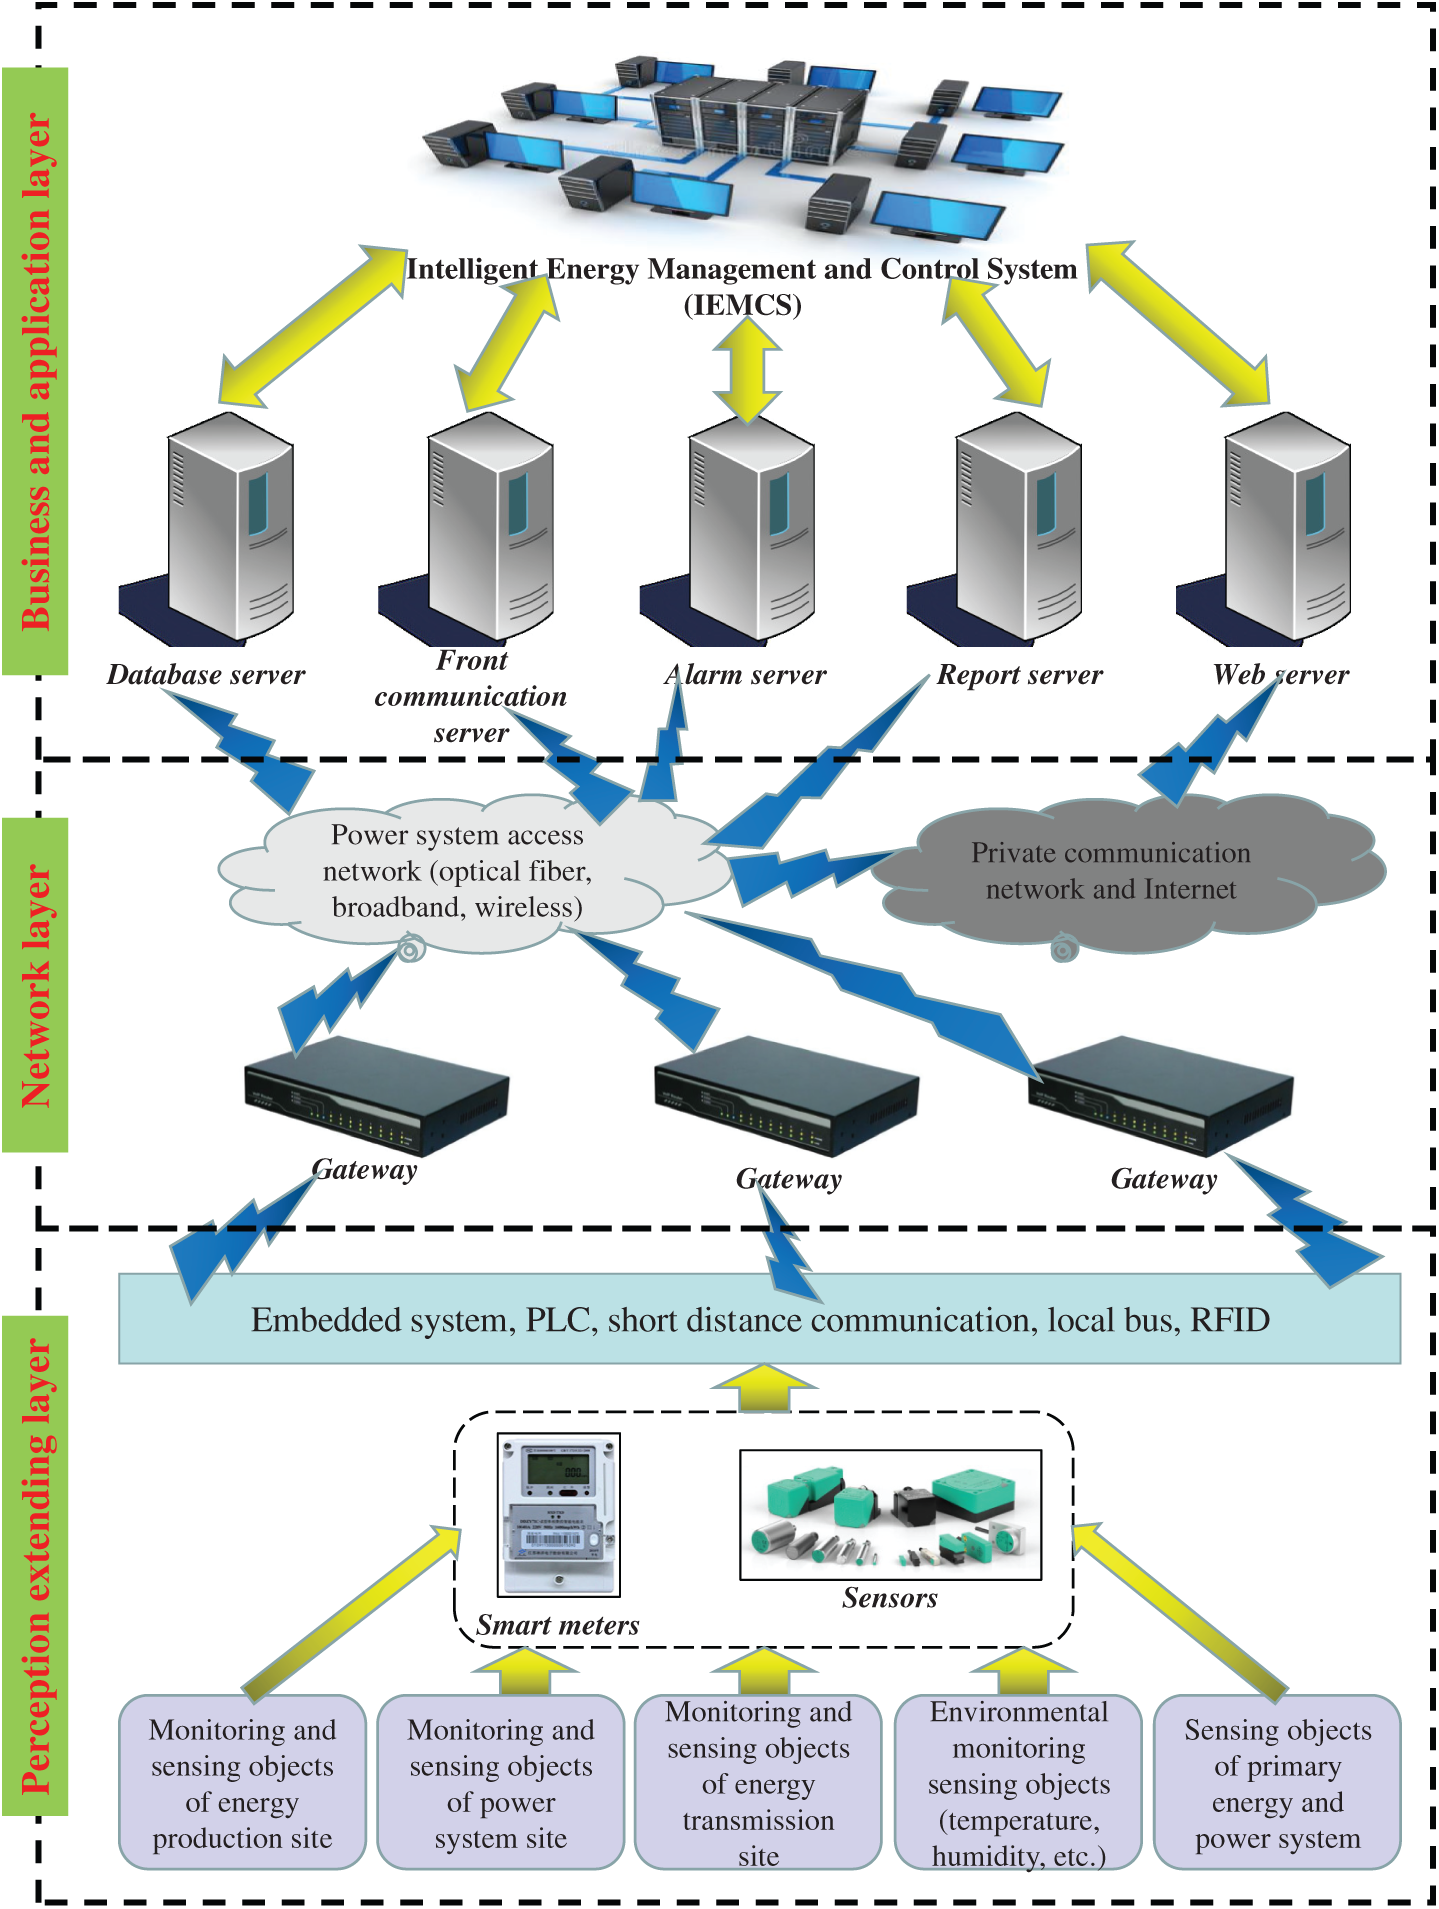
Figure 2: Overall platform architecture of IEMCS
1. Perception extending layer. This layer collects and transforms information, and finally collects the perceived information. The key technologies are sensing technology and short distance networking technology. In the IEMCS, a variety of smart meters, primary energy monitoring sensors, power system equipment monitoring sensors, environmental temperature monitoring sensors, humidity monitoring sensors, ordinary energy consumption monitoring sensors are used in the energy production, scheduling and consumption sites, and the actuators and programmable logic controller (PLC) are used to monitor the energy consumption The control system and embedded control system provide the original input of information and the necessary scheduling execution ability. The industrial gateway product integrated with advanced multi-protocol conversion technology is used to transform the protocol of the short distance communication protocol with different protocols and different transmission rates at the bottom, and simultaneous interpreting the data and transmitting the collected data to the network layer.
2. Network layer. This layer mainly realizes the transmission of information. The data of different protocols in the sensing extension layer are connected to the Internet through the industrial network conversion, so as to realize the long-distance transmission of the monitoring data from the sensor position to the data monitoring center. Large scale industrial parks build local area network (LAN) system by laying optical fiber, transmit the data on the gateway to the data center, and realize the interconnection of information in the whole park by connecting to the Internet.
3. Business and application layer. This layer is mainly to store, analyze and manage the collected data. The IEMCS adopts multi-protocol conversion technology to collect the energy consumption, energy supply and environmental parameters from each workshop in the park, and access the data monitoring network through the data acquisition network to realize the periodic energy data detection and environmental status monitoring functions. All kinds of energy data and production data are analyzed and processed by the monitoring system software, and the results can be queried and scheduled after logging in through the office network, and the interface for expanding the third-party application is reserved. A mass storage system with data recall function is established. These data are used for future modeling and comprehensive optimization model of production process. When the energy consumption of and the work distribution of each equipment in the whole production process are known, the optimization model is established by using the data-based production process scheduling optimization method, and the optimal scheme can be found by using the optimization algorithm.
The IEMCS takes the park energy management and control system as the core, and is divided into park management and enterprise management in structure. In addition to the unification of energy supply and energy consumption data between the two levels, there is also an interactive coordination plate between Park energy supply and enterprise energy consumption. At the enterprise level, the established online monitoring and statistical reports are aimed at the energy consumption system. At the same time, the energy consumption of the enterprise is determined according to the production plan, and the enterprise energy consumption is reported to the park. In addition, in order to reduce the maximum power consumption as much as possible, the optimization algorithm is used to optimize and adjust the production plan. At the park level, the established online monitoring and statistical reports are aimed at the energy supply system. The maximum total energy consumption cannot exceed the maximum capacity of energy supply to dispatch the enterprise energy consumption. At the same time, the maximum power consumption is reduced as much as possible to reduce the declared capacity to the grid and improve the utilization rate of equipment. In addition, the park energy management system also monitors the status of energy supply equipment. According to the above requirements, the system can be divided into the following seven functional modules as shown in Fig. 3.
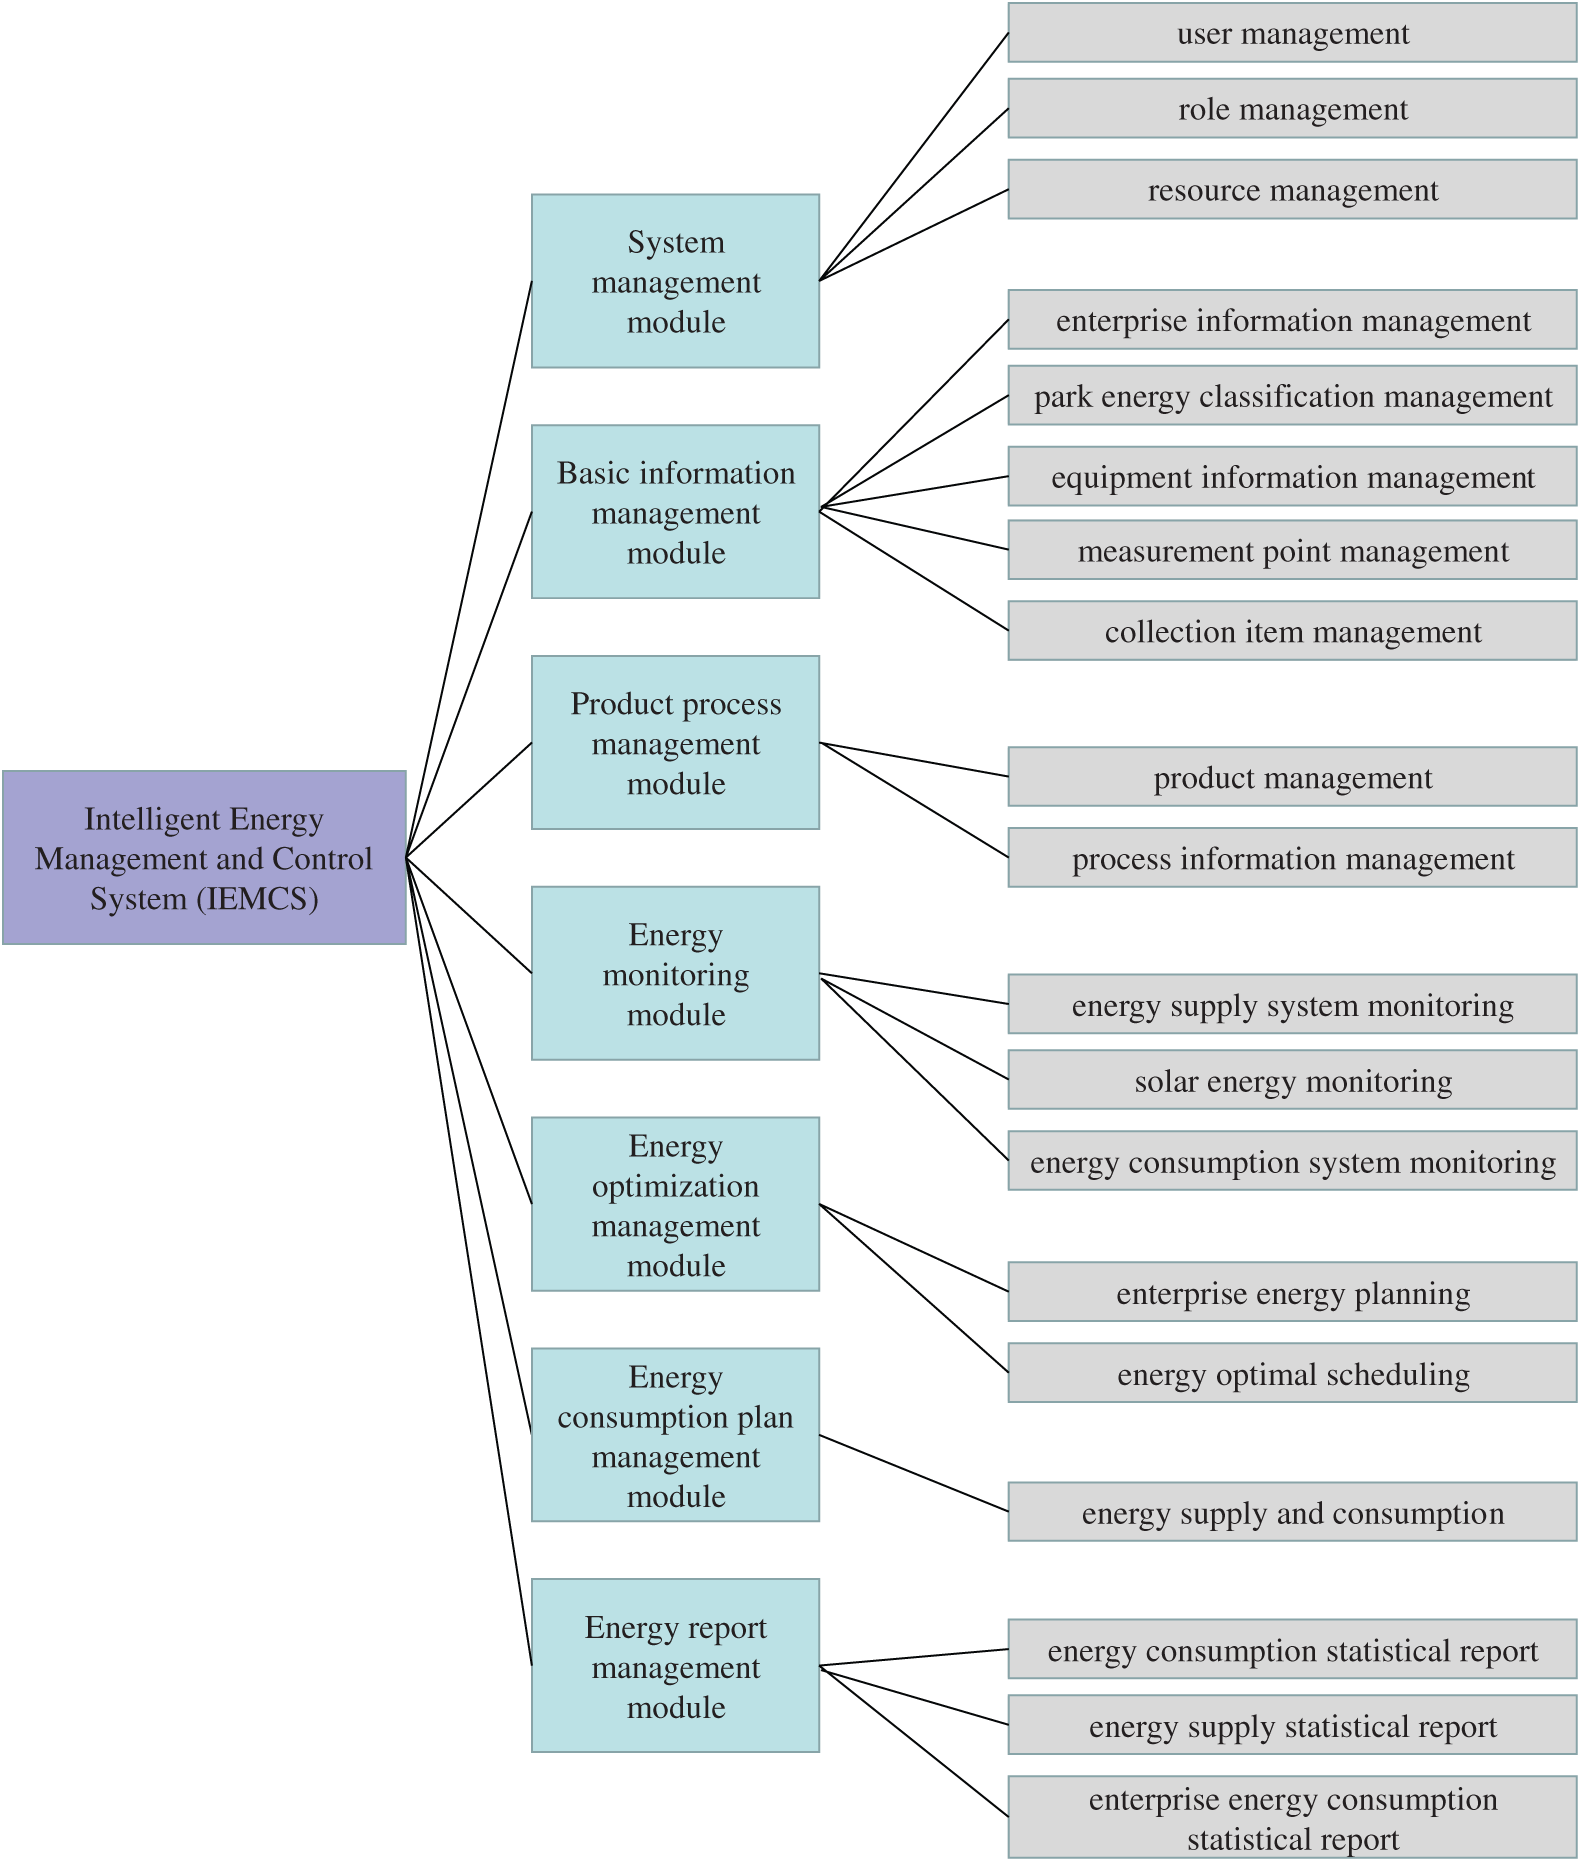
Figure 3: Functional modules
1. System management module. This module includes three sub modules: user management, role management and resource management. It provides different roles for different users, and then assigns different resource permissions. It is a typical user role authority management system, which ensures the security and reliability of the system.
2. Basic information management module. This module includes five sub modules: enterprise information management, park energy classification management, equipment information management, measurement point management and collection item management. The administrator of the enterprise maintains the basic information of the equipment according to the equipment update of the enterprise. The enterprise basic information management can be carried out according to the enterprises stationed in the park. At the same time, due to the diversity of energy supply system in the park, including solar power generation, power grid power supply, thermal power generation and other energy sources, energy classification management must be carried out. The management of measurement points and acquisition items can easily realize the management of bottom sensors and the selection of collected data items, and provide corresponding data for different function blocks on the upper layer.
3. Product process management module. This module includes two sub modules: product management and process information management. Each product of an equipment enterprise is composed of several parts, and the processing process of each part is divided into several steps, and each step is divided into several main processes. The processing process is the most basic link of production, which needs to be completed within the specified time through the standard production process with certain processing equipment. The production energy consumption depends on the power of the production equipment and the standard production time. In this way, when the production process of a component is determined, a standard value of production energy consumption can be determined, and the actual production energy consumption (excluding environmental energy consumption) will not exceed the standard value. Combined with the specific production plan, the daily production energy consumption in the plan can be obtained, thus the monthly production and processing energy consumption of the enterprise can be predicted; according to the historical environmental energy consumption data, the appropriate environmental energy consumption prediction model is established to predict the production environment energy consumption, and then the enterprise energy consumption is the sum of the production and processing energy consumption and the production environment energy consumption.
4. Energy monitoring module. The module includes three sub modules: energy supply system monitoring, solar energy monitoring and energy consumption system monitoring. According to the energy source of the park, real-time monitoring of the energy supply situation of the park and the energy consumption of each enterprise are carried out, and the data are recorded to provide data support for the energy supply prediction of the park. In the enterprise, the real-time energy consumption of equipment can be monitored and recorded to provide data support for process optimization and production scheduling.
5. Energy optimization management module. The module includes two sub modules: enterprise energy planning and energy optimal scheduling. According to the order and market forecast, the enterprise carries out production scheduling, and makes the production plan manually. The system forecasts the enterprise energy consumption plan according to the production tasks in the production plan, combined with the corresponding production product process and production equipment information in the process library. At the same time, the enterprise can submit the manual production plan through the energy optimization scheduling module. The system optimizes the production process according to the historical data of the system, and intelligently adjusts the production plan under the condition of ensuring the construction period in combination with all the enterprise energy utilization plans issued by the park, so as to obtain the optimization scheme of the enterprise energy utilization plan. The enterprise takes the scheme as a reference and formulates the final plan.
6. Energy consumption plan management module. The module includes a sub module of energy supply and consumption. The system will provide a long-term and continuous energy management platform to transform energy management from a current short-term behavior to a long-term behavior related to plant management supported by systematic data. Users can set the energy consumption baseline of all management equipment and process. If the actual energy consumption exceeds the energy consumption baseline, the system will provide an alarm. The park managers can determine the maximum power of the park’s electric load according to the production energy declaration of each enterprise in the park, and then coordinate with the enterprise to control the maximum power below the energy consumption baseline.
7. Energy report management module. The module includes three sub modules: energy consumption statistical report, energy supply statistical report and enterprise energy consumption statistical report. Based on the historical data of the system, on the one hand, it produces various forms of reports according to the needs of users to provide users with the most direct and vivid report services; on the other hand, it collects and analyzes a large number of historical data, which provides basis for the optimization of enterprise product process, adjustment of production plan and prediction of energy supply and consumption in the park.
5 Fuzzy Assessment of IEMCS Scheme Alternatives
IEMCS scheme alternative assessment is realized by assessing multiple IEMCS scheme alternatives. Index system and index value are two elements of evaluation decision-making. Index system can be divided into the following three types: single level index system, tree-shape multi-level index system and non-tree-shape multi-level index system. Index value refers to the performance of each evaluation alternative on each index, which is generally expressed by a number. According to the requirements of the research purpose and the characteristics of the research object, several objectively related indexes are classified and combined to construct the index system.
At present, the common index system for scheme alternative assessment of similar management system is mainly for some specific industries, with poor universality and less consideration of environmental factors [23–25]. Therefore, based on the previous research results [1–9,23–25], this paper adds the environmental index of green connotation into the index system of IEMCS scheme alternative assessment. Starting from multiple stakeholder aspects (customer, enterprise, society, supplier and environment) involved in the IEMCS scheme design, the influencing factors are summarized, and a macro and comprehensive index system of PSS scheme assessment is constructed, without considering the detailed and complicated index factors. The index system of IEMCS scheme alternative assessment is composed of multiple stakeholders, and the influencing factors of each interest index are shown in Fig. 4.
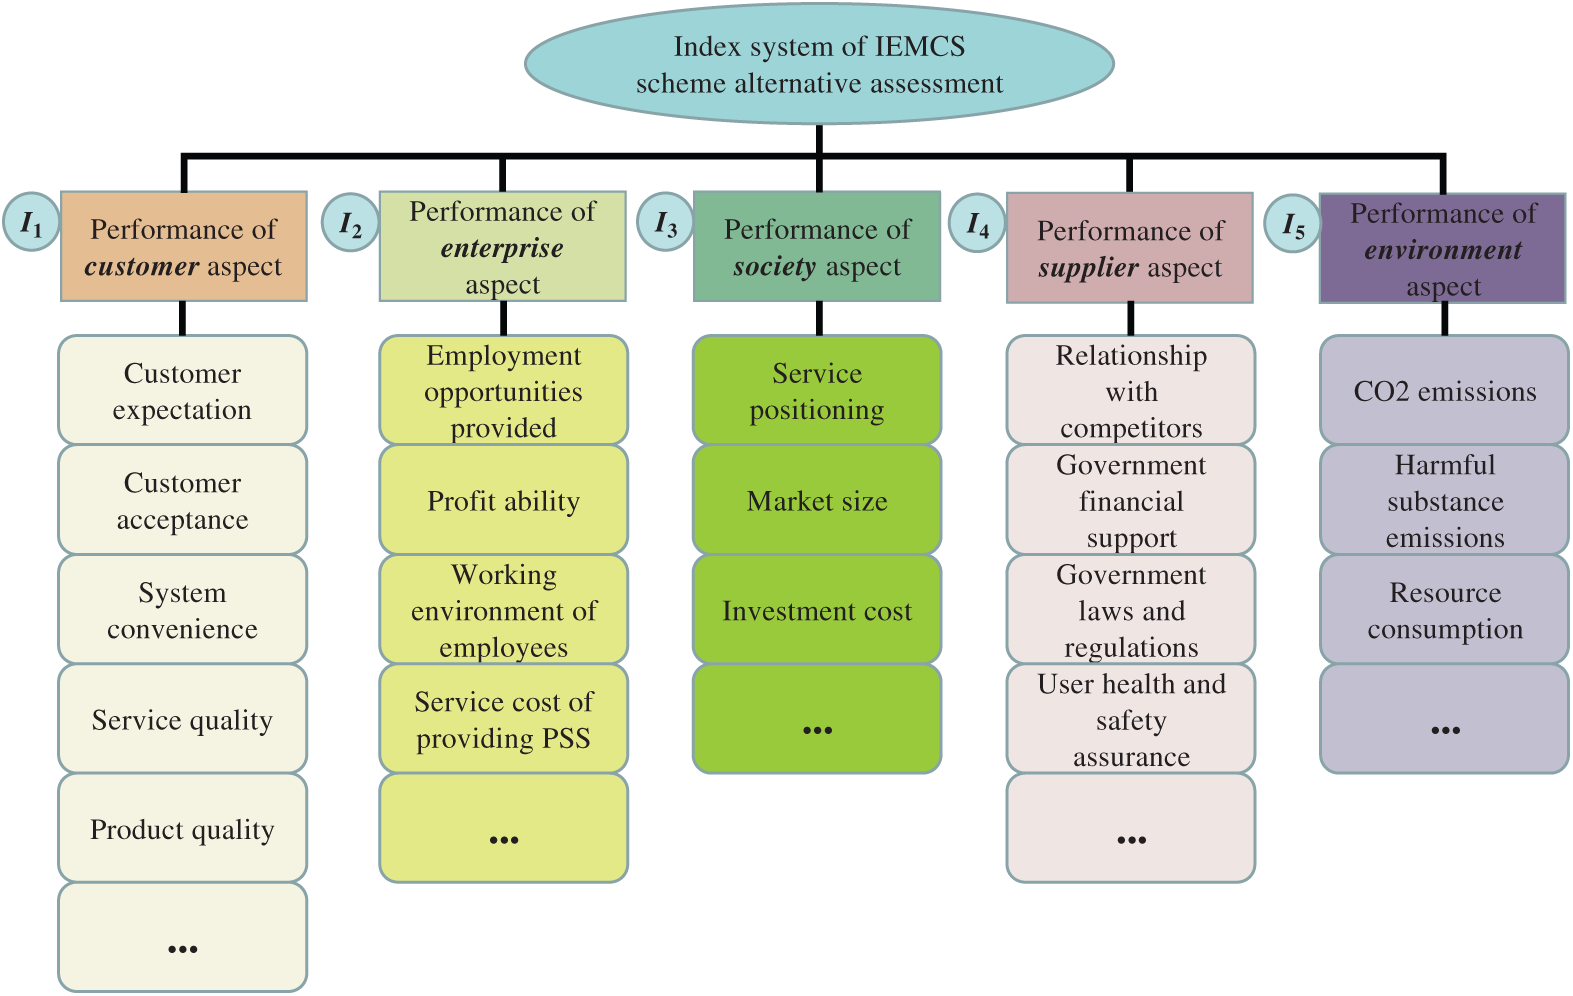
Figure 4: Index system of IEMCS scheme alternative assessment
According to Fig. 4, the index set of IEMCS scheme alternative assessment is constructed as I = {I1, I2,…, In}, here N = 5. All indexes are qualitative. Based on the index system proposed in Fig. 4, a quantitative integrated approach is designed for IEMCS scheme alternative assessment and its detailed steps are as follow.
Triangular fuzzy number [14–18] is applied in this paper to express the vague assessment of experts on the index value of IEMCS scheme alternatives. A triangular fuzzy number  is defined as follows.

Its membership function 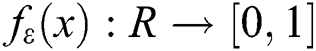 is defined as follows:
In Eq. (2),  ,
, 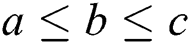 , a and c are the lower bound and upper bound of
  , respectively. When x < a or x > c,
  = 0. When
  ,
,  equals to the real number a.
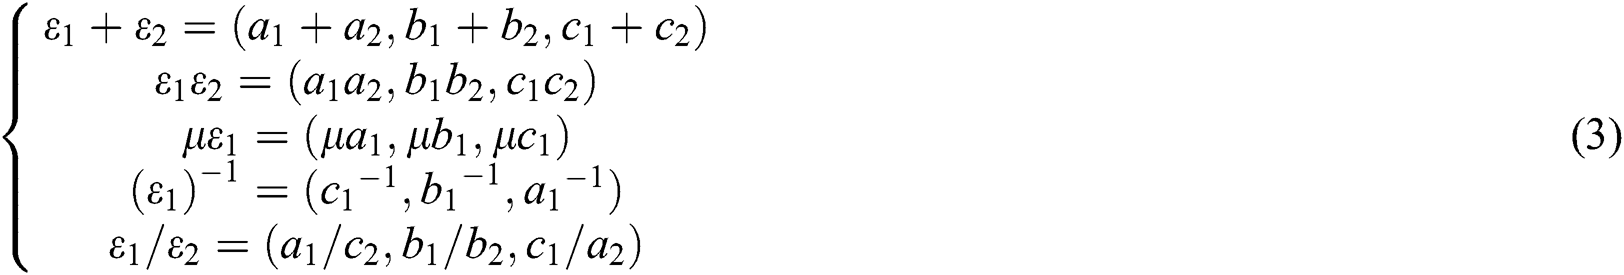
Triangular fuzzy number is characterized by specific arithmetic operations that differ from those dealing with typical real numbers. The arithmetic operations between two triangular fuzzy numbers  and
and  (
(
 ,
,  > 0) are carried out as follows:
The corresponding non-fuzzy number of  is defined as e.

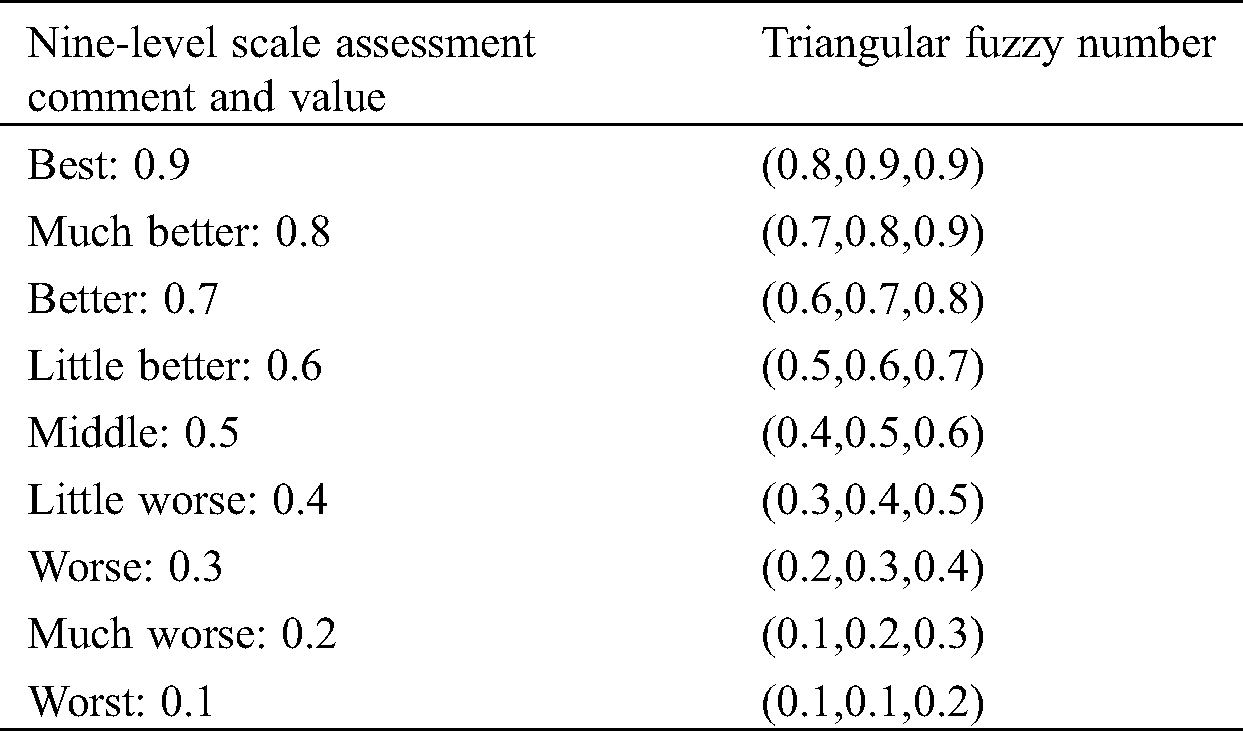
On the basis of the membership function of triangular fuzzy number, the commonly used nine-level scale assessment comments and values are converted to the corresponding triangular fuzzy number as shown in Tab. 1.
Table 1: The corresponding relationship between nine-level scale assessments to triangular fuzzy numbers
It is assumed that there are m IEMCS scheme alternatives and p experts. According to Tab. 2, the triangular fuzzy number assessment value of alternative i (1 ≤ i ≤ m) given by expert r (1 ≤ r ≤ p) on index Ij is  , which is a triangular fuzzy number belonging to Tab. 1. Using the arithmetic average method shown by Eq. (3) the group decision assessment value is calculated as follows.
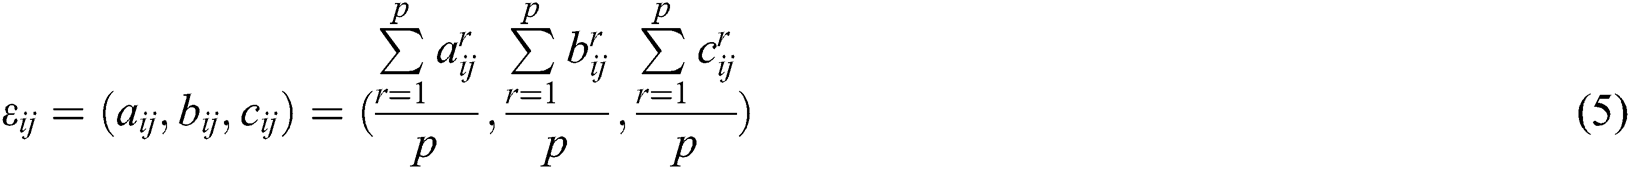
Through Eq. (4), the group decision assessment value is converted into the real number form as follows:

In Eq. (6),  is the index value of alternative i on index Ij. After calculating the index values of all IEMCS scheme alternatives on each index, the index value matrix is obtained as
  .
.
5.2 Alternative Assessment by Modified TOPSIS
A modified TOPSIS by replacing Euclidean distance with contact vector distance is proposed based on set pair analysis theory [22]. The principles of using proposed modified TOPSIS to realize the assessment of IEMCS scheme alternatives are as follows.
• An assessment object (i.e., an IEMCS scheme alternative) and an ideal solutions (i.e., positive or negative ideal solution) constitute a set pairs.
• The set pair is then decomposed into multiple element pairs.
• For each element pair, the sameness, contrariety and difference relationships are analyzed to obtain the relationship between assessment object and ideal solution. Then the contact vector distance from assessment object to ideal solution is obtained.
• Based on the ranking rule of traditional TOPSIS, the closeness of assessment object is calculated based on its contact vector distances from assessment object to positive and negative ideal solutions. Finally, all assessment objects are ranked according to their closeness values.
Variation coefficient method is to directly use the information contained in each index to get the weight of the index through calculation. The basic principle of this method is as follows. In the assessment index system, the index with larger difference in index value is the index that is more difficult to realize. Such indexes can better reflect the gap between the assessment objects and should be given greater weight value. According to index value matrix  , the average value of index Ij is as follows.

The standard deviation of index Ij is as follows:
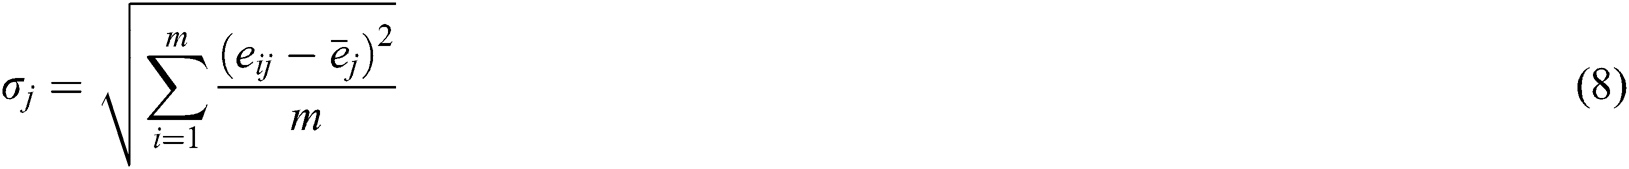
Hence the variation coefficient of index Ij is as follows:

Then the weight of index Ij is obtained as follows:
Finally, the weighted index value matrix  is obtained. Here,
  . Therefore, the positive ideal point and the negative ideal point are as follows:

In Eq. (11),  and
and  .
.
In fact,  represents the IEMCS scheme alternative i. Based on set pair analysis theory [22],
  and
and  form a set pair which is expressed by
  , and
, and  and
and  form a set pair which is expressed by
  .
.
In set pair  there are n element pairs
  . Among these element pairs,
  is consist of
  and
and  . Further, in
  element pairs the two elements have tiny difference, in other words the two elements in
  element pairs have sameness relationship; in
  element pairs the two elements have huge difference, in other words the two elements in
  element pairs have contrariety relationship; in
  element pairs the two elements have not very obvious difference, in other words the two elements in
  element pairs have difference relationship.
  ,
,  and
and  satisfy:

For element pair  , its contact degree can be defined as follows:
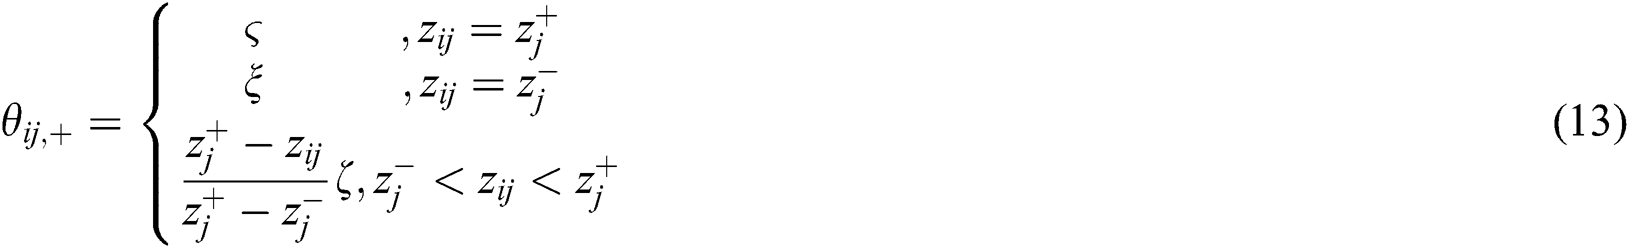
In Eq. (13),  ,
,  and
and  represent the sameness, contrariety and difference relationships respectively.
Therefore, the contact degree of set pair  , which characterizes the uncertain quantitative relationship between
  and
and  , is defined as follows:

In Eq. (14),  ,
,  and
and  represent the sameness, contrariety and difference coefficients respectively.
According to Eq. (13), contact degree  can be further obtained as follows:

Then the contact vector of set pair  is obtained as follows:

By same way, for element pair 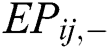 in set pair
  , its contact degree can be defined as follows:
Lastly the contact vector of set pair  is obtained as follows:

Besides,  and
and  can form a set pair
  . Because a set is same as itself, the contact degree of set pair
  is
is  . Therefore, its contact vector is as follows:

According to the contact vectors (Eq. (16) and Eq (19)) of set pairs  and
and  , the contact vector distance between
  and
and  and the contact vector distance between
  and
and  are obtained as follows:
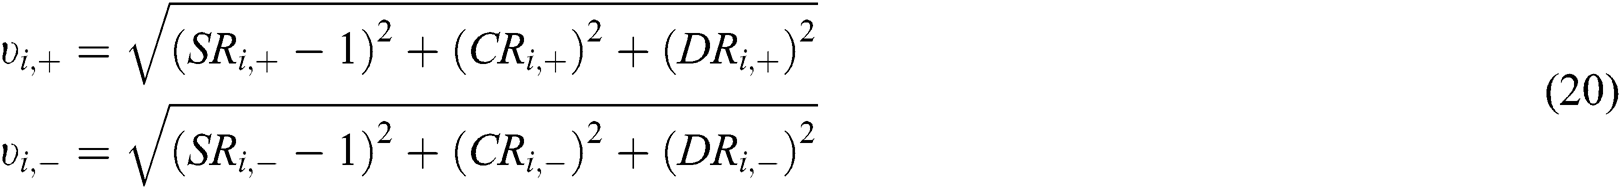
Through replacing the Euclidean distance with the contact vector distance, TOPSIS is modified. Based on the contact vector distances shown in Eq. (20) the closeness of  to positive ideal solution is obtained as follows:

According to the ranking rule of TOPSIS, all assessment objects are ranked according to their closeness values to positive ideal solution. The IEMCS scheme alternative with the biggest closeness value is the best one.
6 Case Study of Fuzzy Assessment
With the help of Internet of things, cloud computing and mobile Internet technology, an equipment manufacturing industrial park develops an IEMCS through various sensor systems according to the overall platform architecture (Fig. 2) and the functional modules (Fig. 3). In the design stage, the equipment manufacturing industrial park wants to assess several feasible IEMCS scheme alternatives, so as to concentrate multiple resources to ensure the effective implementation. The configuration objectives mainly conclude response speed, business extent, economic cost and user interface. Here, each objective has three levels while level 1 is the highest and level 3 is the lowest. After multi-objective configuration optimization, eight IEMCS scheme alternatives (A1, A2, A3, A4, A5, A6, A7 and A8) are generated as follows:
• A1: response speed: level 1, business extent: level 2, economic cost: level 1, user interface: level 2.
• A2: response speed: level 2, business extent: level 1, economic cost: level 2, user interface: level 3.
• A3: response speed: level 1, business extent: level 3, economic cost: level 2, user interface: level 3.
• A4: response speed: level 3, business extent: level 2, economic cost: level 2, user interface: level 2.
• A5: response speed: level 2, business extent: level 3, economic cost: level 2, user interface: level 1.
• A6: response speed: level 3, business extent: level 1, economic cost: level 1, user interface: level 2.
• A7: response speed: level 2, business extent: level 1, economic cost: level 3, user interface: level 2.
• A8: response speed: level 1, business extent: level 2, economic cost: level 3, user interface: level 2.
There are seventy experts that carry out vague assessment on the eight IEMCS scheme alternatives. They use triangular fuzzy number to express their assessment opinions on the index value.
Taking A1 for an example, on index I1 the assessment opinions are shown by 1st column of Tab. 2 as follows. Best: 13 experts; Much better: 15 experts; Better: 2 experts; Little better: 1 expert; Middle: 0 experts; Little worse: 9 experts; Worse: 12 experts; Much worse: 0 experts; Worst: 18 experts.
Table 2: The statistics of the assessment opinion of seventy experts about A1
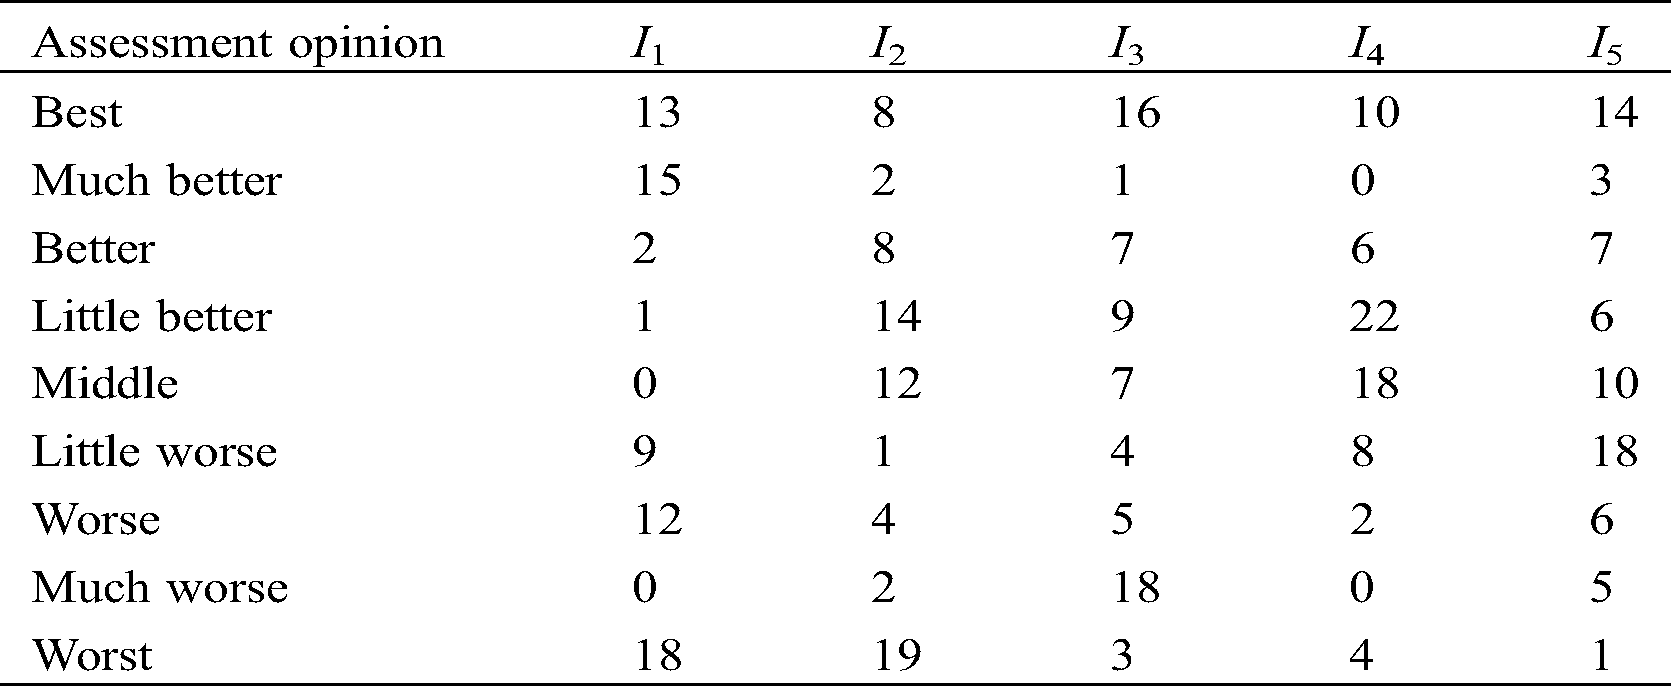
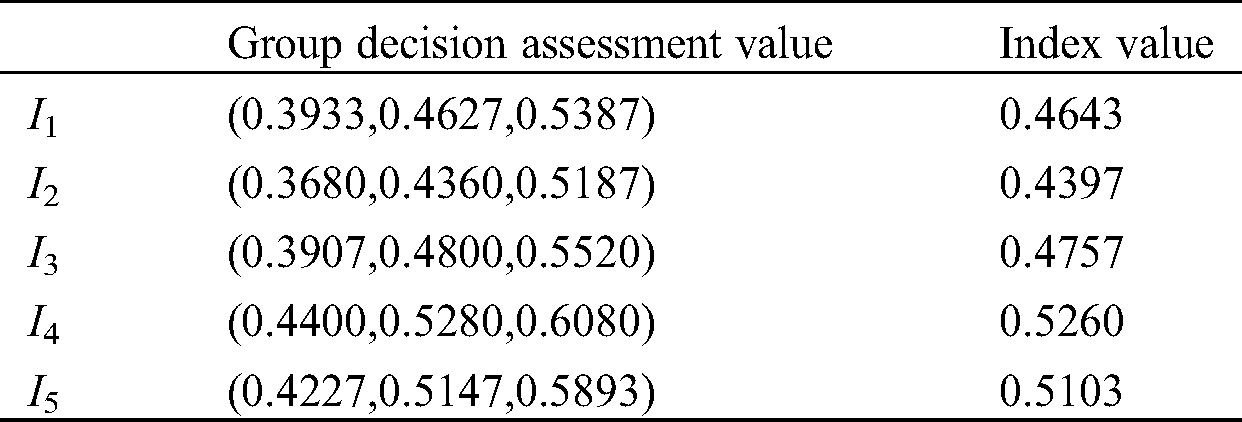
The assessment opinions of A1 from the experts are shown in Tab. 2. According to Eq. (5) the group decision assessment value of A1 on index I1 is obtained as a triangular fuzzy number  = (0.3933,0.4627,0.5387). Then according to Eq. (6) it be converted into real number form as
  = 0.4643 which is the index value of A1 on index I1. By same way, other index values of A1 are obtained as shown in Tab. 3.
Table 3: The group decision assessment value and index value of A1
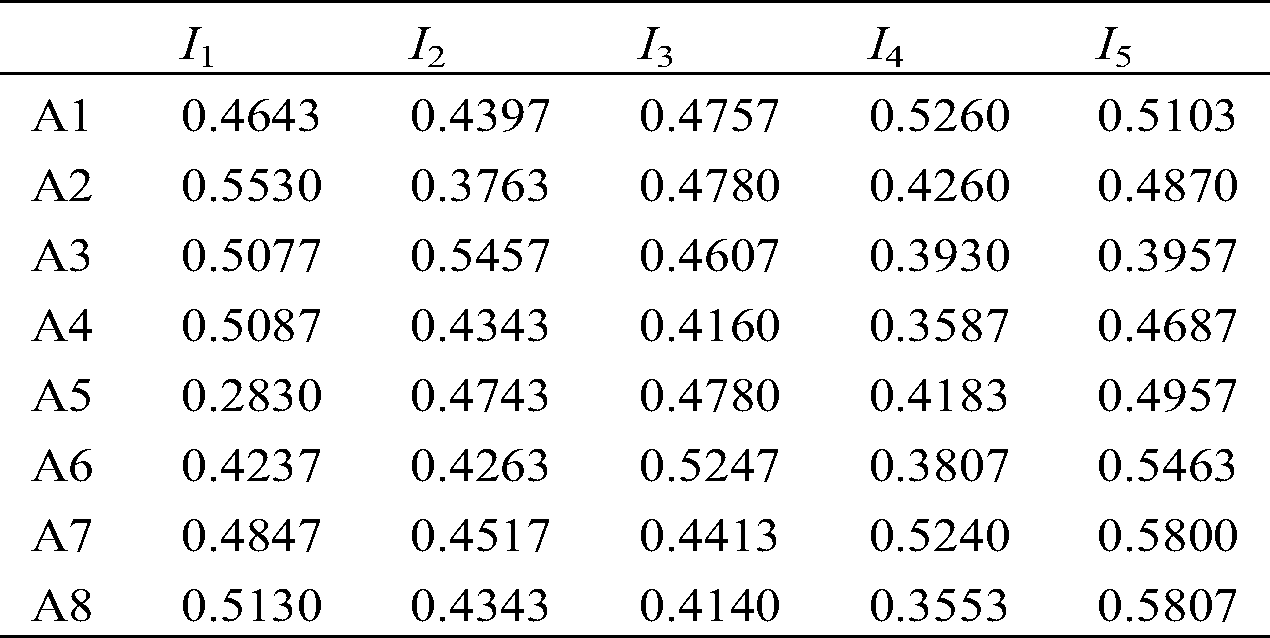
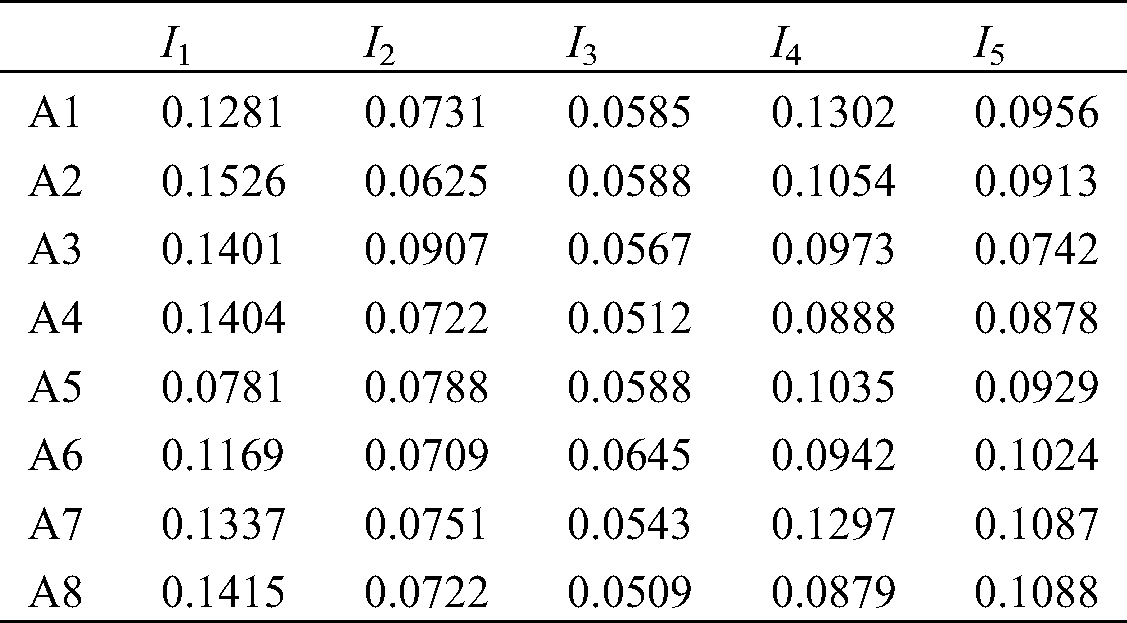
After calculating the index values of all IEMCS scheme alternatives (A1 to A8) on all indexes (I1 to I5), the index value matrix is obtained as shown in Tab. 4.
Table 4: The index value matrix 
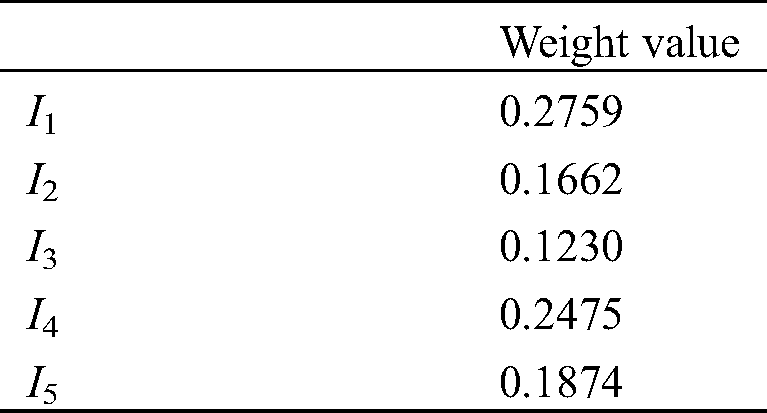
Based on Eqs. (7)–(9), the weight of the index is obtained by variation coefficient method as shown in Tab. 5.
Table 5: The weight of the index obtained by variation coefficient method
As shown in Tab. 6, we obtain the weighted index value matrix 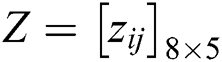 where
where  .
.
Table 6: The weighted index value matrix 
Therefore, the positive ideal point Z+ and the negative ideal point Z− are obtained as shown in Tab. 7.
Table 7: The positive ideal point and the negative ideal point
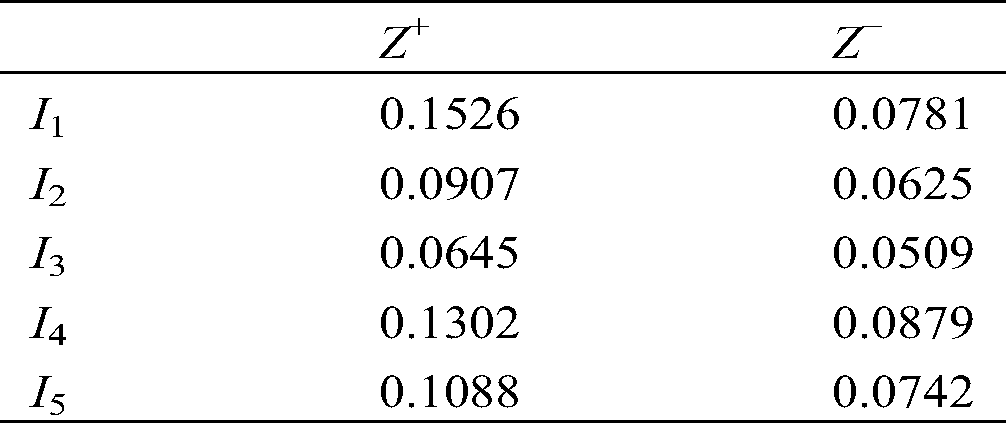
For example, Z8 (8th row of Tab. 6, represents A8) and Z+ form a set pair which is expressed by SP8,+, while Z8 and Z− form a set pair which is expressed by SP8−.
Set pair SP8,+ consists of five element pairs EP81,+, EP82,+, EP83,+, EP84,+ and EP85,+. For element pairs EP81,+, z81 = 0.1415,  = 0.1526 and
  = 0.0781. Because
  , the contact degree of EP81,+ is obtained as
  . The contact degrees of other element pairs in SP8,+ can be obtained similarly. Then, the contact degree of SP8,+ is obtained as
  , and the contact vector of set pair SP8,+ is obtained as
  = [0.2000,0.4000,0.2388]T. By same way, the contact vector of set pair SP8,− is obtained as
  = [0.4000,0.2000,0.1612]T.
Then a set pair SP8,8 formed by Z8 and itself is constructed, and its contact vector is  = [1,0,0]T. Based on the contact vectors of SP8,+, SP8,− and SP8,8, according to Eq. (20) the contact vector distance from Z8 to Z+ is obtained as
  = 0.9258 and the contact vector distance from Z8 to Z− is
  = 0.6527. Therefore, the closeness of Z8 to positive ideal point is calculated as
  = 0.4135. Similarly, the closeness values of other assessment objects (A1 to A7) to positive ideal solution are calculated as shown in Tab. 8.
Table 8: The contact vector distance and closeness of eight IEMCS scheme alternatives (A1 to A8)
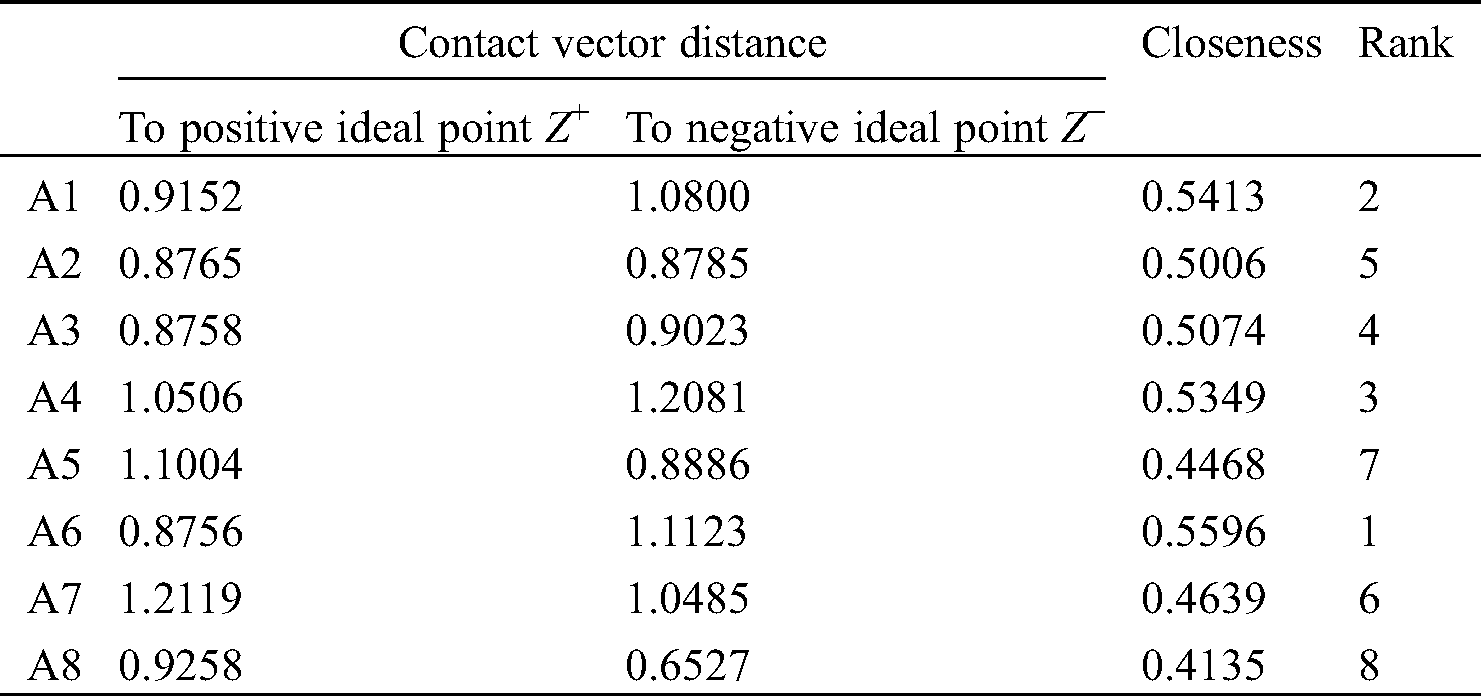
According to the ranking rule of TOPSIS, eight IEMCS scheme alternatives (A1 to A8) are ranked as shown in the last column of Tab. 8. Judging from the assessment result in Tab. 8, A6 is the best IEMCS scheme and should be selected. From the index value shown in Tab. 6, it can be seen that A6 has a higher index value than most other schemes in a number of indexes index and does not rank at the bottom on all indexes. This reflects that A6 has a great advantage over other schemes from the perspective of index value. In conclusion, A6 is the most appropriate scheme in the current situation and it can verify the effectiveness of the proposed IEMCS scheme assessment method.
A comparison of the ranking results of modified TOPSIS proposed in this paper, traditional TOPSIS [14,15,18], modified TOPSIS 1 [26] and modified TOPSIS 2 [27] is shown in Tab. 9 and Fig. 4.
Table 9: The ranking results of proposed modified TOPSIS, traditional TOPSIS, modified TOPSIS 1 and modified TOPSIS 2
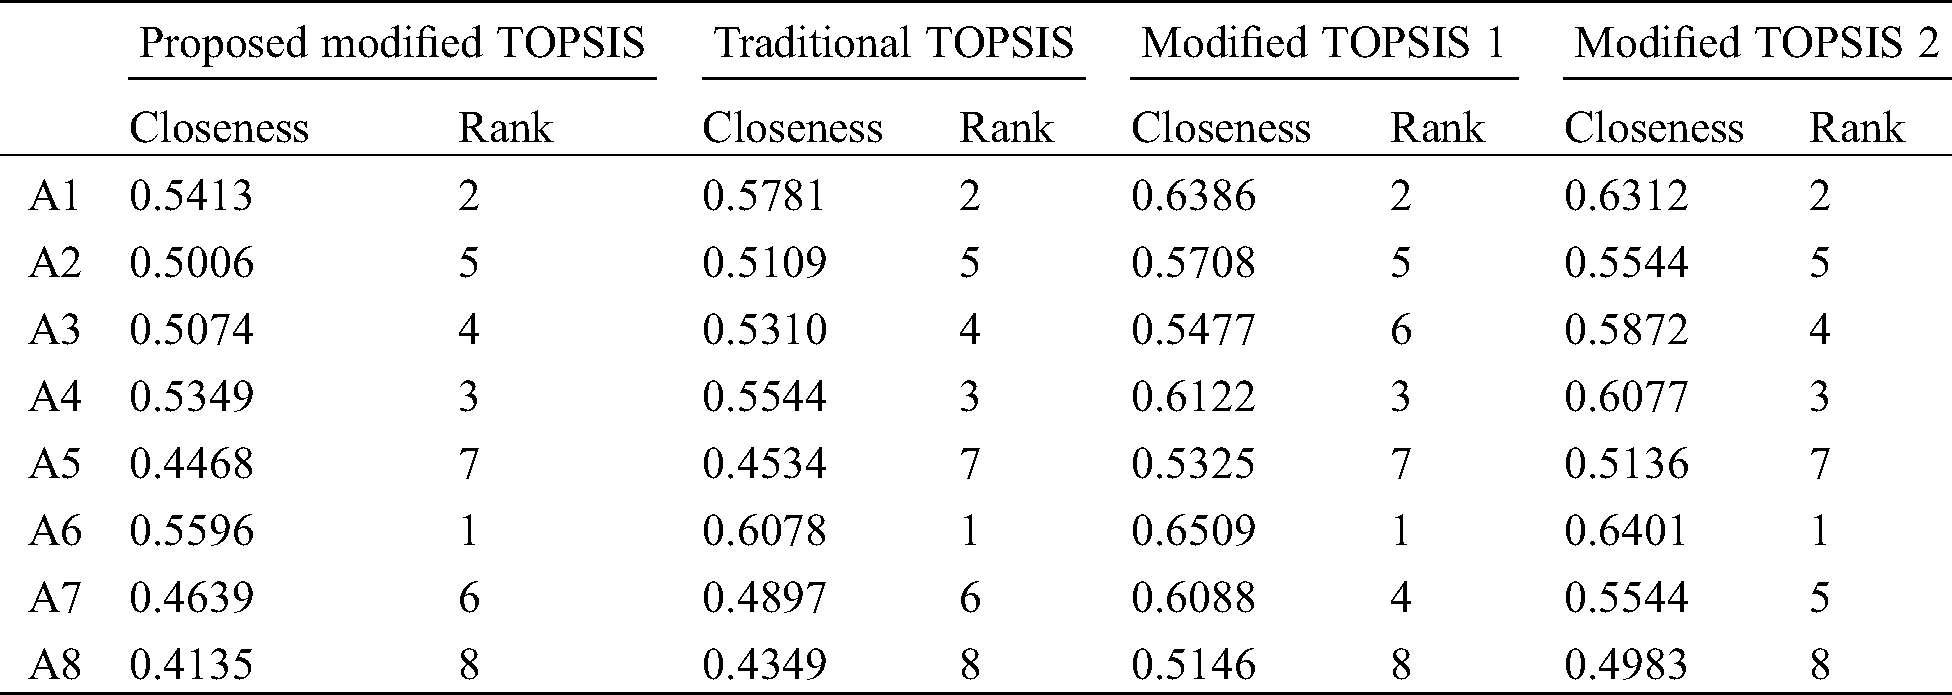
As shown in Tab. 9 and Fig. 5, the ranking results of the proposed modified TOPSIS and traditional TOPSIS are same, which can prove the correctness of the proposed approach. Because traditional TOPSIS has been proved that it has obvious shortcomings, it is not advisable. The overall ranking trend of the four approaches is generally consistent, and A6, A1 and A4 hold the top three alternatives while A5 and A8 hold the last two alternatives.
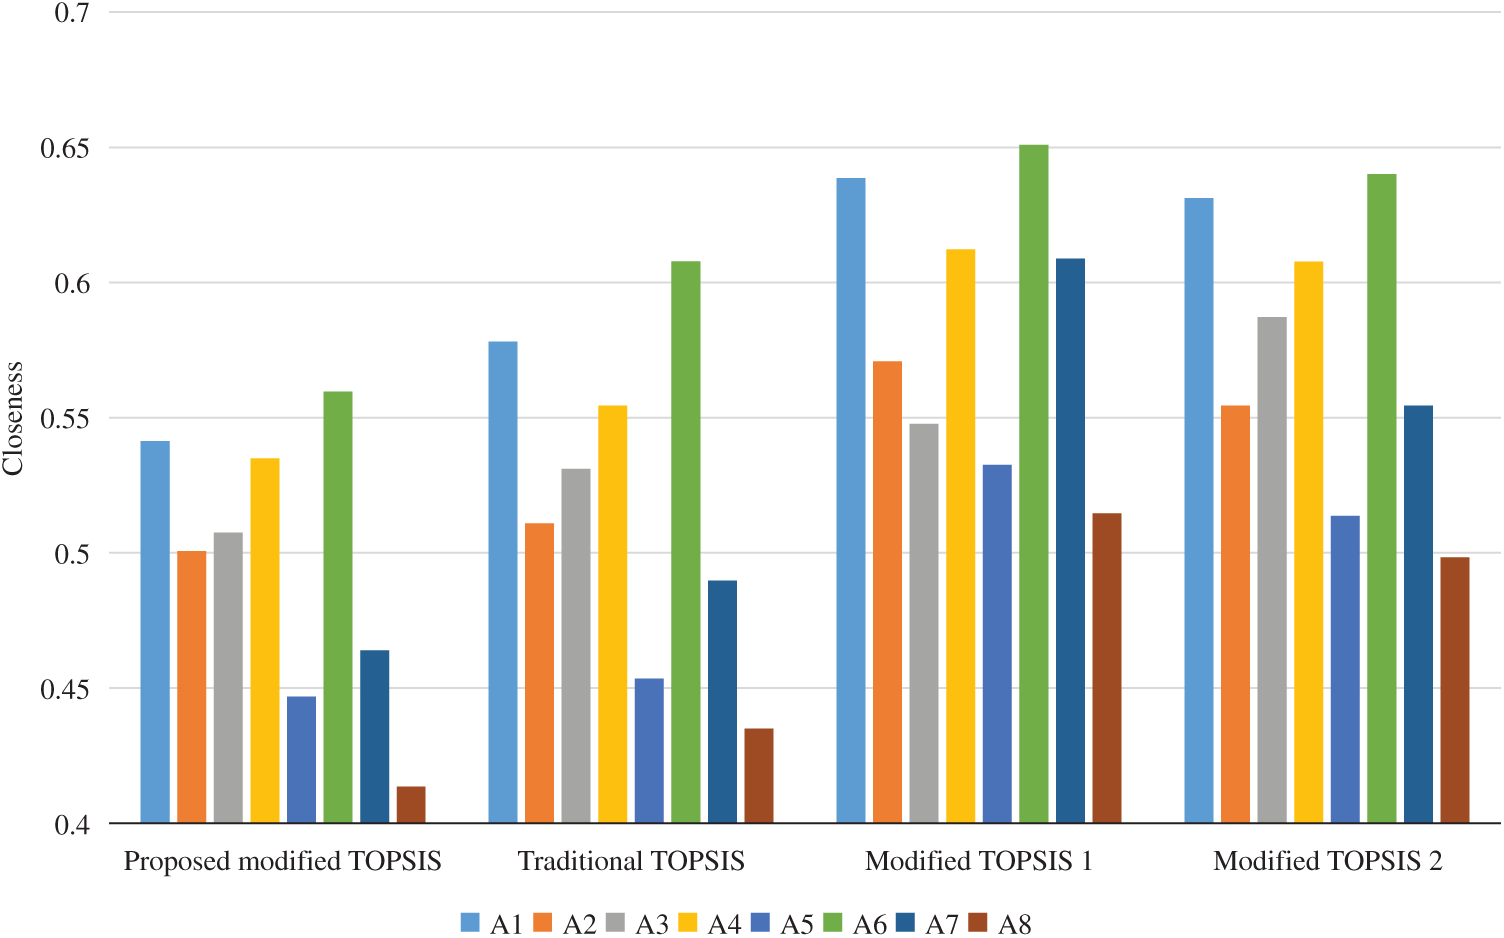
Figure 5: A comparison of the ranking results
However, by modified TOPSIS 1 the ranking of A3 and A7 is obviously different from other three approaches, and the opposite sort result appears. By modified TOPSIS 2 the closeness of A2 and A7 are equal and the ranking of them cannot be carried out. As can be seen, modified TOPSIS 1and 2 cannot satisfy the sorting requirements in some special cases. According to Tab. 9 and Fig. 5, the proposed modified TOSIS by replacing Euclidean distance with contact vector distance can overcome the shortcomings of the modified TOPSIS 1 and 2.
In this paper, the Internet of things technology is applied to the information construction of heavy equipment park with the characteristics of discrete and reciprocating processing, which improves the efficiency of information collection, enhances the sharing ability of information resources, and provides accurate and reliable data source for the upper application. The main novelty and contribution of this paper are as follows:
• In terms of energy management, information technology and IoT methods are applied to analyze and design a closed-loop IEMCS for energy supply and energy consumption interaction.
• As a key stage to ensure the normal subsequent implementation, scheme assessment is of great significance for the selection of IEMCS schemes. In this paper, an assessment technique of IEMCS scheme alternatives based on fuzzy group decision and modified TOPSIS is explored and the detailed steps are proposed.
In a heavy equipment industrial park case eight IEMCS scheme alternatives generated by multi-objective configuration optimization are assessed and the most appropriate one is selected. Through analysis, the assessment technique of IEMCS scheme alternatives explored in this paper can overcome the shortcomings of the existing methods and accurately select the best IEMCS scheme. Therefore, it provides a practical tool for IEMCS scheme assessment. Because the indexes of IEMCS scheme assessment are not completely independent but related, complex networks theory or analytic network process (ANP) will be adopted for reference to determine the index weight in future research.
Funding Statement: The author(s) received no specific funding for this study.
Conflicts of Interest: The authors declare that they have no conflicts of interest to report regarding the present study.
1. Rezaei, E., Dagdougui, H. (2020). Optimal real-time energy management in apartment building integrating microgrid with multizone HVAC control. IEEE Transactions on Industrial Informatics, 16(11), 6848–6856. DOI 10.1109/TII.2020.2972803. [Google Scholar] [CrossRef]
2. Zhu, X., Yang, J., Pan, X. L., Li, G. J. J., Rao, Y. Q. (2020). Regional integrated energy system energy management in an industrial park considering energy stepped utilization. Energy, 201, 117589. DOI 10.1016/j.energy.2020.117589.
3. Guo, W., Wenning, T., Nimbalkar, S., Thirumaran, K. (2019). Armstrong, Kristina; Levine, Eli a new methodology for calculating the energy performance of manufacturing facilities. Energy Engineering: Journal of the Association of Energy Engineering, 116(2), 7–21. [Google Scholar]
4. Bai, L., Li, F., Cui, H. (2016). Interval optimization based operating strategy for gas-electricity integrated energy systems considering demand response and wind uncertainty. Applied Energy, 167, 270–279. DOI 10.1016/j.apenergy.2015.10.119. [Google Scholar] [CrossRef]
5. Bracco, S., Dentici, G., Siri, S. (2013). Economic and environmental optimization model for the design and the operation of a combined heat and power distributed generation system in an urban area. Energy, 55, 1014–1024. DOI 10.1016/j.energy.2013.04.004.
6. Choobineh, M., Silva-Ortiz, D., Mohagheghi, S. (2018). An automation scheme for emergency operation of a multi-microgrid industrial park. IEEE Transactions on Industry Applications, 54(6), 6450–6459. DOI 10.1109/TIA.2018.2851210. [Google Scholar] [CrossRef]
7. Jahan, M., Kramer, R. (2018). Building energy efficiency analysis tool utilizing a segmented analytic approach. Energy Engineering: Journal of the Association of Energy Engineering, 115(2), 9–22. [Google Scholar]
8. Atzori, L., Iera, A., Morabito, G. (2010). The internet of things: A survey. Computer Networks, 54(15), 2787–2805. DOI 10.1016/j.comnet.2010.05.010. [Google Scholar] [CrossRef]
9. Al-Fuqaha, A., Guizani, M., Mohammadi, M. (2015). Internet of things: A survey on enabling technologies, protocols, and applications. IEEE Communications Surveys and Tutorials, 17(4), 2347–2376. DOI 10.1109/COMST.2015.2444095. [Google Scholar] [CrossRef]
10. Cho, H., Mago, P., Luck, R. (2009). Evaluation of CCHP systems performance based on operational cost, primary energy consumption, and carbon dioxide emission by utilizing an optimal operation scheme. Applied Energy, 86(12), 2540–2549. DOI 10.1016/j.apenergy.2009.04.012. [Google Scholar] [CrossRef]
11. Aghamolaei, R. (2019). Evaluation of supply and demand in building energy performance: Application of retrofit scenarios in residential building. Energy Engineering: Journal of the Association of Energy Engineering, 116(1), 60–79.
12. Choobineh, M., Mohagheghi, S. (2016). Optimal energy management in an industrial plant using on-site generation and demand scheduling. IEEE Transactions on Industry Applications, 52(3), 1945–1952. DOI 10.1109/TIA.2015.2511094.
13. Choudhary, D., Shankar, R. (2012). An STEEP-fuzzy AHP-TOPSIS framework for evaluation and selection of thermal power plant location: A case study from India. Energy, 42(1), 510–521. DOI 10.1016/j.energy.2012.03.010. [Google Scholar] [CrossRef]
14. Zhu, G., Hu, J., Ren, H. (2020). A fuzzy rough number-based AHP-TOPSIS for design concept evaluation under uncertain environments. Applied Soft Computing, 91, 106228. DOI 10.1016/j.asoc.2020.106228. [Google Scholar] [CrossRef]
15. Li, L., Hang, J., Gao, Y. (2017). Using an integrated group decision method based on SVM, TFN-RS-AHP, and TOPSIS-CD for cloud service supplier selection. Mathematical Problems In Engineering, 2017, 3143502. [Google Scholar]
16. Touqeer, M., Shaheen, K., Irfan, R. (2020). Evaluation model for manufacturing plants with linguistic information in terms of three trapezoidal fuzzy numbers. Journal of Intelligent & Fuzzy Systems, 38(5), 5969–5978. DOI 10.3233/JIFS-179683. [Google Scholar] [CrossRef]
17. Wang, Q., Lee, H., Shi, J. (2018). Evaluation of the key development factors for the Shanghai Cruise tourism industry using an interval-valued fuzzy number method. Journal of Marine Science and Technology-Taiwan, 26(4), 508–517. [Google Scholar]
18. Li, L., Hang, J., Sun, H. (2017). A conjunctive multiple-criteria decision-making approach for cloud service supplier selection of manufacturing enterprise. Advances in Mechanical Engineering, 9(3), 1687814016686264. [Google Scholar]
19. Song, M., Zhou, Y., Zhang, R. (2017). Environmental efficiency evaluation with left-right fuzzy numbers. Operational Research, 17(3), 697–714. DOI 10.1007/s12351-015-0202-0. [Google Scholar] [CrossRef]
20. Lu, Z. (2015). Model for evaluating the international competitiveness of financial system with fuzzy number intuitionistic fuzzy information. Journal of Intelligent & Fuzzy Systems, 33(6), 3191–3199. DOI 10.3233/JIFS-161059. [Google Scholar] [CrossRef]
21. Li, L., Mao, C., Sun, H. (2020). Digital twin driven green performance evaluation methodology of intelligent manufacturing: Hybrid model based on fuzzy rough-sets AHP, multistage weight synthesis, and PROMETHEE II. Complexity, 2020, 3853925. [Google Scholar]
22. Harish, G., Kama, L. (2018). An advanced study on the similarity measures of intuitionistic fuzzy sets based on the set pair analysis theory and their application in decision making. Soft Computing, 22(15), 4959–4970. DOI 10.1007/s00500-018-3202-1. [Google Scholar] [CrossRef]
23. Kachi, M., Yoshimoto, Y., Kitagami, S. (2014). Factory energy management system in collaboration with production information and its evaluation by implementation. Transactions of the Society of Instrument and Control Engineers, 50(4), 319–327. DOI 10.9746/sicetr.50.319. [Google Scholar] [CrossRef]
24. Su, W., Chow, M. Y. (2011). Evaluation on intelligent energy management system for PHEVs/PEVs using Monte Carlo method. International Conference on Electric Utility Deregulation & Restructuring & Power Technologies, Weihai, China, 2011, 22–29.
25. Clemmer, T., Xu, H., Dougal, R. (2013). Design and evaluation of a next generation residential energy management system. IEEE International Symposium on Power Electronics for Distributed Generation Systems, Rogers, USA, 2013, 154–161. [Google Scholar]
26. Liu, S., Qiu, W. (1996). The TOPSIS angle measure evaluation method for MADM. System Engineering-Theory & Practice, 16(7), 12–17. [Google Scholar]
27. Hua, X., Tan, J. (2004). Revised TOPSIS method based on vertical projection distance-vertical projection method. System Engineering-Theory & Practice, 24(1), 114–119. [Google Scholar]
 | This work is licensed under a Creative Commons Attribution 4.0 International License, which permits unrestricted use, distribution, and reproduction in any medium, provided the original work is properly cited. |