
 Submit a Paper
 Propose a Special lssue
 Open Access
ARTICLE
Cloud-Based Deep Learning for Real-Time URL Anomaly Detection: LSTM/GRU and CNN/LSTM Models
Department of Computer Science, College of Computer Science and Engineering, Taibah University, Madinah, 42353, Saudi Arabia
* Corresponding Author: Ayman Noor. Email:
Computer Systems Science and Engineering 2025, 49, 259-286. https://doi.org/10.32604/csse.2025.060387
Received 31 October 2024; Accepted 08 January 2025; Issue published 21 February 2025
 View Full Text
 Download PDF
Abstract
Precisely forecasting the performance of Deep Learning (DL) models, particularly in critical areas such as Uniform Resource Locator (URL)-based threat detection, aids in improving systems developed for difficult tasks. In cybersecurity, recognizing harmful URLs is vital to lowering risks associated with phishing, malware, and other online-based attacks. Since it directly affects the model’s capacity to differentiate between benign and harmful URLs, finding the optimum mix of hyperparameters in DL models is a significant difficulty. Two commonly used architectures for sequential and spatial data processing, Long Short-Term Memory (LSTM)/Gated Recurrent Unit (GRU) and Convolutional Neural Network (CNN)/Long Short-Term Memory (LSTM) models are targeted in this study to have higher predictive capacity by modifying crucial hyperparameters such as learning rate, batch size, and dropout rate using cloud capability. Research finds the best settings for the models by testing 50 dropout rates (between 0.1 and 0.5) with different learning rates and batch sizes. Performances were measured in the form of accuracy, precision, recall, F1-score, and errors such as Mean Absolute Error (MAE), Mean Squared Error (MSE), Root Mean Squared Error (RMSE) and Mean Absolute Percent Error (MAPE). In our results, CNN/LSTM performed better often than LSTM/GRU, with up to 10% better F1-score and much lower MAPE when the learning rate was 0.001 and the dropout rate was 0.2. These results show the value of fine-tuning hyperparameters to increase model performance and reduce errors. Higher on many of the parameters, CNN/LSTM architecture became obvious as the more trustworthy one. It also discussed the importance of DL in enhancing URL attack detection mechanisms to provide increased accuracy and precision for real-world cybersecurity.Keywords
In the digital age, the exponential growth in data traffic created an imperative for intelligent infrastructure monitoring and storage. Detours from the routine can indicate system issues, fraud, or security issues. These anomalies must be identified early on to maintain the integrity of systems, particularly in critical areas such as cybersecurity, healthcare, and finance. However, anomaly detection remains challenging as these events are so rare and unpredictable, especially at large scale and in real-time.
Although anomaly detection is critical in many areas, it is more important in cybersecurity. Identifying threats like internet attacks and Distributed Denial-of-Service (DDoS) attacks is important for eliminating breaches, and loss of revenue and reputation. A single discovered anomaly could have catastrophic consequences for companies everywhere. Therefore, robust, accurate anomaly detectors are crucial to spot unexpected trends at a glance, so they can correct them immediately [1].
Recently, Deep Learning (DL) and Machine Learning (ML) models have become common tools for anomaly detection automation. They are also good at finding complex patterns across huge datasets and thus suitable for picking up on small lapses that might confuse conventional rules-based systems. Long Short-Term Memory (LSTM) networks and Gated Recurrent Units (GRU), for example, are particularly effective at discriminating between consecutive irregularities because they retain temporal connections. In the same way, Convolutional Neural Network (CNN) has shown a lot of promise when learning spatial patterning, an important aspect of image-based anomaly detection [2,3].
However successful these models are, anomaly detection poses great difficulties. The most important challenge is data inequity. In real life, normal data are often vastly superior to anomalous data, generating extremely skewed statistics. DL models, normally optimized through cross-entropy reductions on a binary basis, are particularly unbalanced. They are more inclined to the majority group (i.e., normal data) and hence accurate but less accurate and reliable, and therefore the minority group (i.e., anomalous data) which is very important for anomaly detection has an inaccurate accuracy but bad recall and precision.
The imbalanced data problem is compounded by the abundance and diversity of abnormalities [4]. Such deviations are usually against expected norms, which makes them harder for computers to distinguish reliably. Non-built models are liable to miss or misclassify anomalous but critical events. This trade-off between general precision and the presence of minority class anomalies has emphasized the need for advanced techniques in the field [2].
Recent work has studied strategies such as threshold tuning, oversampling the minority class, and changing class weights to overcome these issues. Such cures try to counter the opportunistic tendencies of the ruling elite, but they are not without their risks. For instance, while class weighting makes the minority class more valuable in training, it doesn’t completely solve the precision-recall trade-off, because models still don’t correctly categorize rare events. In addition, threshold tuning might change the decision threshold at which anomalies are labeled, which might improve accuracy but reduce recall, or vice versa. Hence a single answer for anomaly detection, which balances accuracy and memory, remains a lifetime goal.
Fig. 1 depicts the flow of genuine and malicious traffic directed towards a designated server. The illustration demonstrates how normal traffic from genuine users and malicious traffic from an attacker merge over the Internet before reaching the targeted server. As the volume of traffic increases, primarily due to the malicious influx, the server becomes overwhelmed and eventually shuts down, preventing access for genuine users. This visual representation highlights how malicious traffic can disrupt server functionality, a frequent consequence of DDoS attacks.
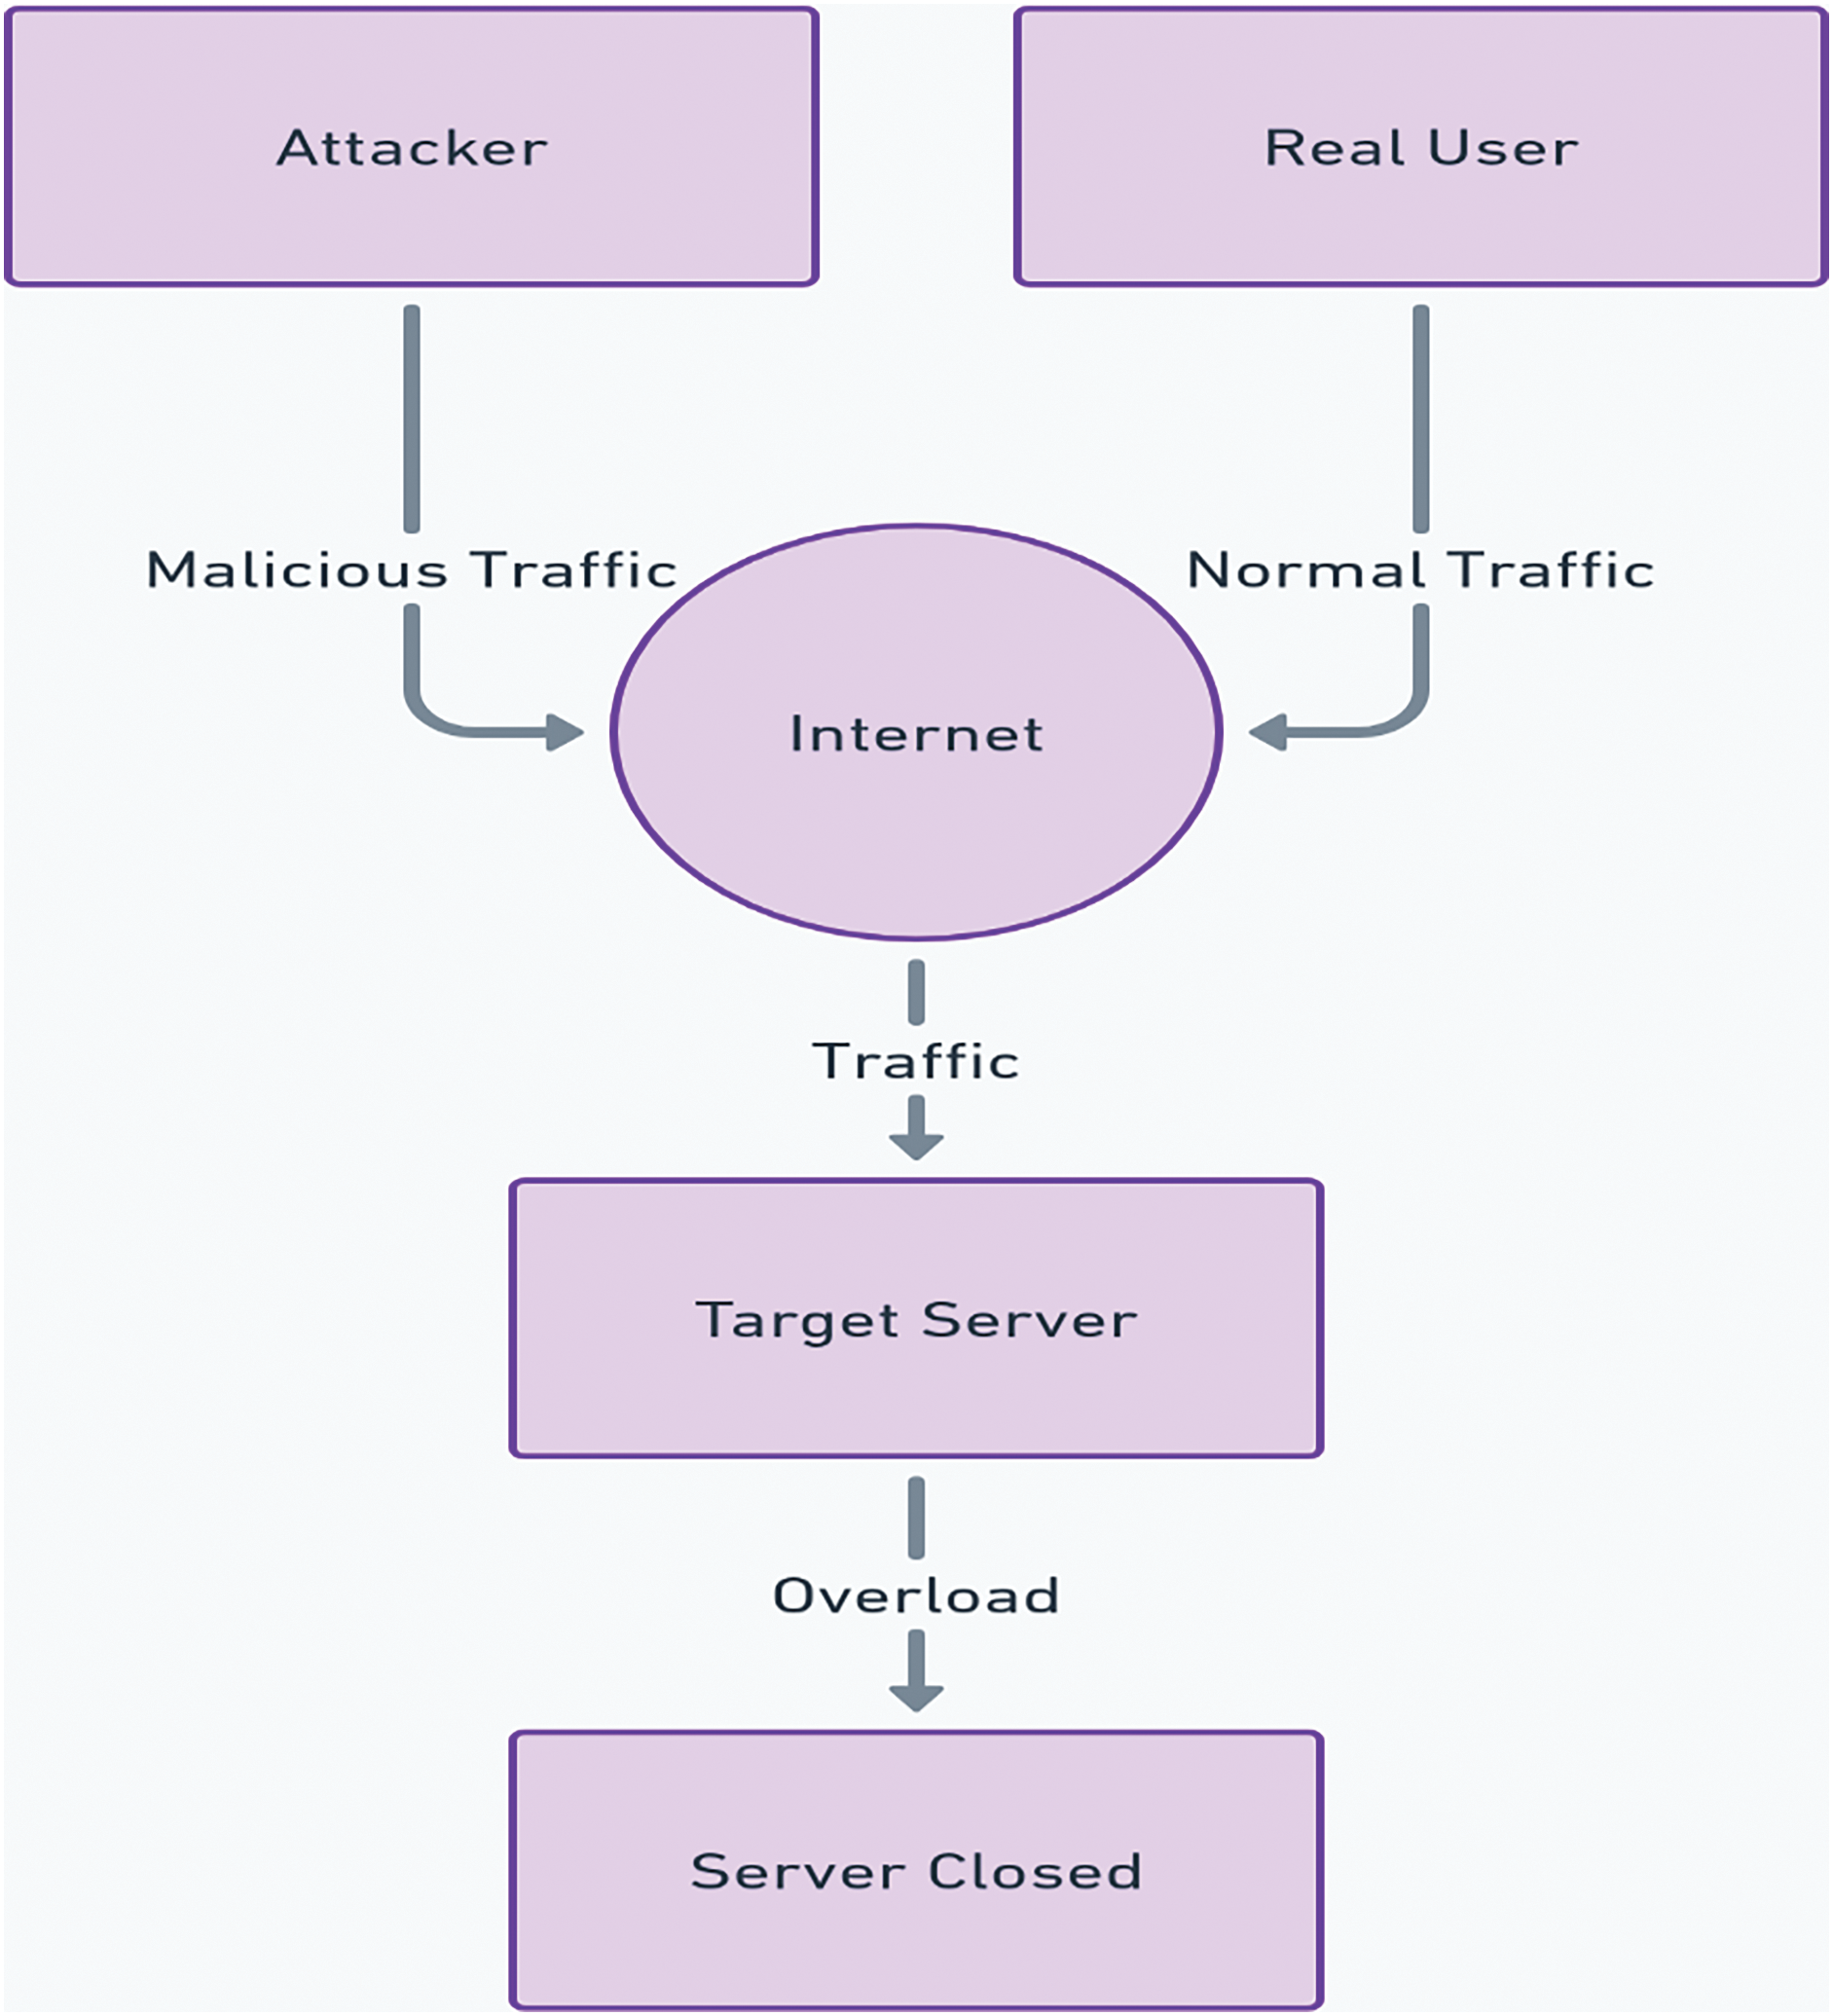
Figure 1: Traffic flow targeting a server
To overcome the limitations of current anomaly detection models, we describe a novel method that combines LSTM/GRU and CNN/LSTM architectures with advanced methodologies such as class weighting, Focal Loss, and dynamic threshold change. Originally proposed inside the framework of object detection tasks, focal loss controls the loss contribution of simple samples by concentrating on hard-to-classify events. By adding Focal Loss to anomaly detection tasks, we want to address the class imbalance problem more effectively so enabling the model to concentrate on identifying the minority class (anomalies) free from performance impact on the majority class [5].
Additionally, we provide a systematic study of decision threshold tuning that allows us to strike a compromise between accuracy and recall. By constantly altering the judgment threshold, we want to maximize the discovery of anomalies and reduce false positives [6]. This technique yields a massive solution to class imbalance issues in anomaly detection in combination with Focal Loss.
The contributions of this paper are threefold:
• We propose a novel use case of Focal Loss for LSTM/GRU and CNN/LSTM models to enhance anomaly detection on highly imbalanced datasets by exploiting the cloud. This allows the models to target difficult-to-classify instances, thus increasing accuracy and recall.
• This paper presents a detailed discussion of threshold tuning and the precision-recall trade-off in anomaly detection. This experiment provides valuable data on how various threshold selections could affect model performance in discriminating anomalies.
• We evaluate the proposed method using a real-world dataset (i.e., a combination of Payload and CSIC Datasets) achieving massive anomalous detection performance improvements. These results indicate that combined LSTM/GRU and CNN/LSTM architectures with Focal Loss and threshold tuning led to better accuracy and recall than standard binary cross-entropy models.
This paper advances more credible and affordable DL models for real-time aberration detection under the most dynamic conditions by pushing past class imbalance and precision-recall trade-offs for anomaly detection [7]. The results of this study are broadly applicable to industries where anomaly detection early can avert operational loss, financial damage, and breaches. In addition, this work tries to overcome real-time Uniform Resource Locator (URL) anomaly detection problems by using new hybrid architectures such as CNN/LSTM and LSTM/GRU. Specially trained to account for rich temporal and spatial variations in network data, these models were enhanced with tricks such as automated feature extraction and threshold-tuning. This paper shows that it takes intensive preprocessing and fine-tuning to improve generalizing performance and detection rate compared to the previous approaches.
The rest of this work is structured as follows. Section 2 gives a short description of relevant research, emphasizing the difficulties encountered in anomaly detection and the many strategies offered to tackle these challenges. Section 3 discusses the architecture of the models utilized in this work and contains a full discussion of the technique, including the implementation of Focal Loss and dynamic threshold tweaking to boost anomaly detection. Section 4 covers the system implementation, the dataset description, and the models’ configuration. Section 5 offers the experimental results, presenting a comparison study between the proposed technique and standard models, followed by a discussion of the findings. Lastly, Section 6 finishes the study with an appraisal of the contributions and gives insights into possible future research domains.
Anomaly detection is a major area of research in enterprises such as cybersecurity, banking, and network monitoring, where spotting strange but significant events is critical. The extensive application of machine learning and DL algorithms has substantially improved the performance of anomaly detection systems, especially when traditional rule-based methods fall short. While numerous deep learning architectures for anomaly detection have been studied in the past, few have featured hybrid models that can successfully handle both sequential dependencies and spatial patterns. Using their combined skills, the recommended LSTM/GRU and CNN/LSTM models reduce this gap and give a unique solution for URL anomaly detection. By use of rigorous preprocessing and threshold-tuning approaches, this work solves limits in scalability and real-world application, therefore further distancing itself. This section comprises the most notable research on anomaly detection, DL models, and ways to manage the class imbalance problem.
2.1 Machine Learning and Deep Learning Models in Anomaly Detection
Traditional machine learning techniques like Support Vector Machines (SVMs), Decision Trees (DTs), and clustering algorithms were among the earliest methods used for anomaly detection. Ref. [8] introduced a one-class SVM approach that performed well on moderately imbalanced datasets but struggled in highly skewed environments. Similarly, decision trees such as Random Forests (RFs) have been used to identify anomalies because they are good at deciding feature importance and handling different data. Yet such models tend to lack scalability and require extensive feature engineering to detect complex patterns on large data sets. As DL was emerging, scientists looked to neural network-based techniques that automatically extract hierarchical structures from data. LSTM networks and GRUs have been especially popular for sequential data anomaly detection as they capture temporal dependencies and variation. Ref. [9] was the first to use LSTMs for time series anomaly detection, with large performance enhancement over classical models. However, although effective in learning sequential patterns, LSTMs and GRUs remain hampered by data imbalance and are not always accurate and rememberable across minority classes. CNNs have been well accepted in applications where spatial features are relevant, like image or video anomaly detection. Ref. [10], for instance, created a full convolutional neural network that automatically identifies and picks up rare events in video data. CNNs are good at detecting spatial anomalies but they can only be used for time-series data such as network traffic like LSTMs and GRUs.
2.2 Tackling the Class Imbalance Issue
The class imbalance issue is common for anomaly detection because normal data outnumber abnormal data by a large margin. Such an imbalance can render models more biased towards the majority class, which can lead to poor overall accuracy and make anomaly detection more difficult. Various approaches have been conceived to solve this problem at the data and algorithm level. At the data level, techniques like undersampling the majority class or oversampling the minority class are common. Ref. [11] introduced the Synthetic Minority Over-sampling Technique (SMOTE), which generates synthetic minority samples to balance the class distribution. While useful in some cases, oversampling methods can introduce overfitting and noise, especially in high-dimensional data.
At the algorithm level, methods such as cost-sensitive learning, class weighting, and modified loss functions have been proposed to achieve balance. Class weighting assigns more importance to the minority class during training, encouraging the model to focus on minority class examples. Studies, notably by [12], have demonstrated that adjusting class weights in SVMs and neural networks can significantly improve the detection of the minority class. However, class weighting alone may be inadequate in severely imbalanced scenarios, as models may still struggle to generalize. More recently, Ref. [13] proposed Focal Loss, a modified loss function that emphasizes hard-to-classify instances by reducing the loss contribution of easily classified cases. Focal Loss has been widely adopted in object recognition tasks, including those utilizing [14] faster Region-based Convolutional Neural Network (R-CNN) architecture. However, its application in anomaly detection remains underexplored, particularly in time-series data where class imbalance is most pronounced.
2.3 The Role of Threshold Tuning in Precision-Recall Trade-offs
Threshold tuning is another critical aspect of anomaly detection, especially when balancing recall and precision is necessary. Traditional binary classification systems typically use a fixed decision threshold, often set at 0.5, to classify instances as positive or negative. However, in imbalanced datasets, this threshold can significantly affect model performance in terms of recall and precision. Ref. [15] demonstrated that adjusting the decision threshold can enhance minority class detection, albeit at the cost of increasing false positives.
The trade-off between precision and recall has been explored recently using dynamic threshold tuning. Ref. [5] developed an autoencoder-based anomaly detection approach where the reconstruction error is a dynamic threshold to detect anomalies. This adaptable decision boundary enhanced anomaly detection and remained accurate. Ref. [16,17] highlighted the need to adjust thresholds in network intrusion detection to maximize accuracy and memory according to detected anomalies severity.
Despite its benefits, it relies on the application and the data properties. There is still a difficult decision to get to the right threshold with advanced tools such as Focal Loss and class weighting. However, threshold adjustment has been successful at increasing recall and accuracy.
2.4 Comparison with Related Work
We have reviewed a range of ML and DL models to establish a comprehensive understanding of the field. This review encapsulates both traditional ML techniques, such as SVM, DTs, and RFs, as well as advanced DL approaches including LSTMs, GRUs, CNNs, and hybrid models combining these architectures. Table 1 provides a structured comparison of the performance and error parameters from various research studies, highlighting how each model is evaluated against these metrics. This detailed comparison not only underscores the diverse strategies employed in anomaly detection but also illustrates the evolutionary path from simpler ML techniques to more complex DL models, paving the way for more sophisticated and accurate anomaly detection systems in Uniform Resource Locator (URL) security and beyond.
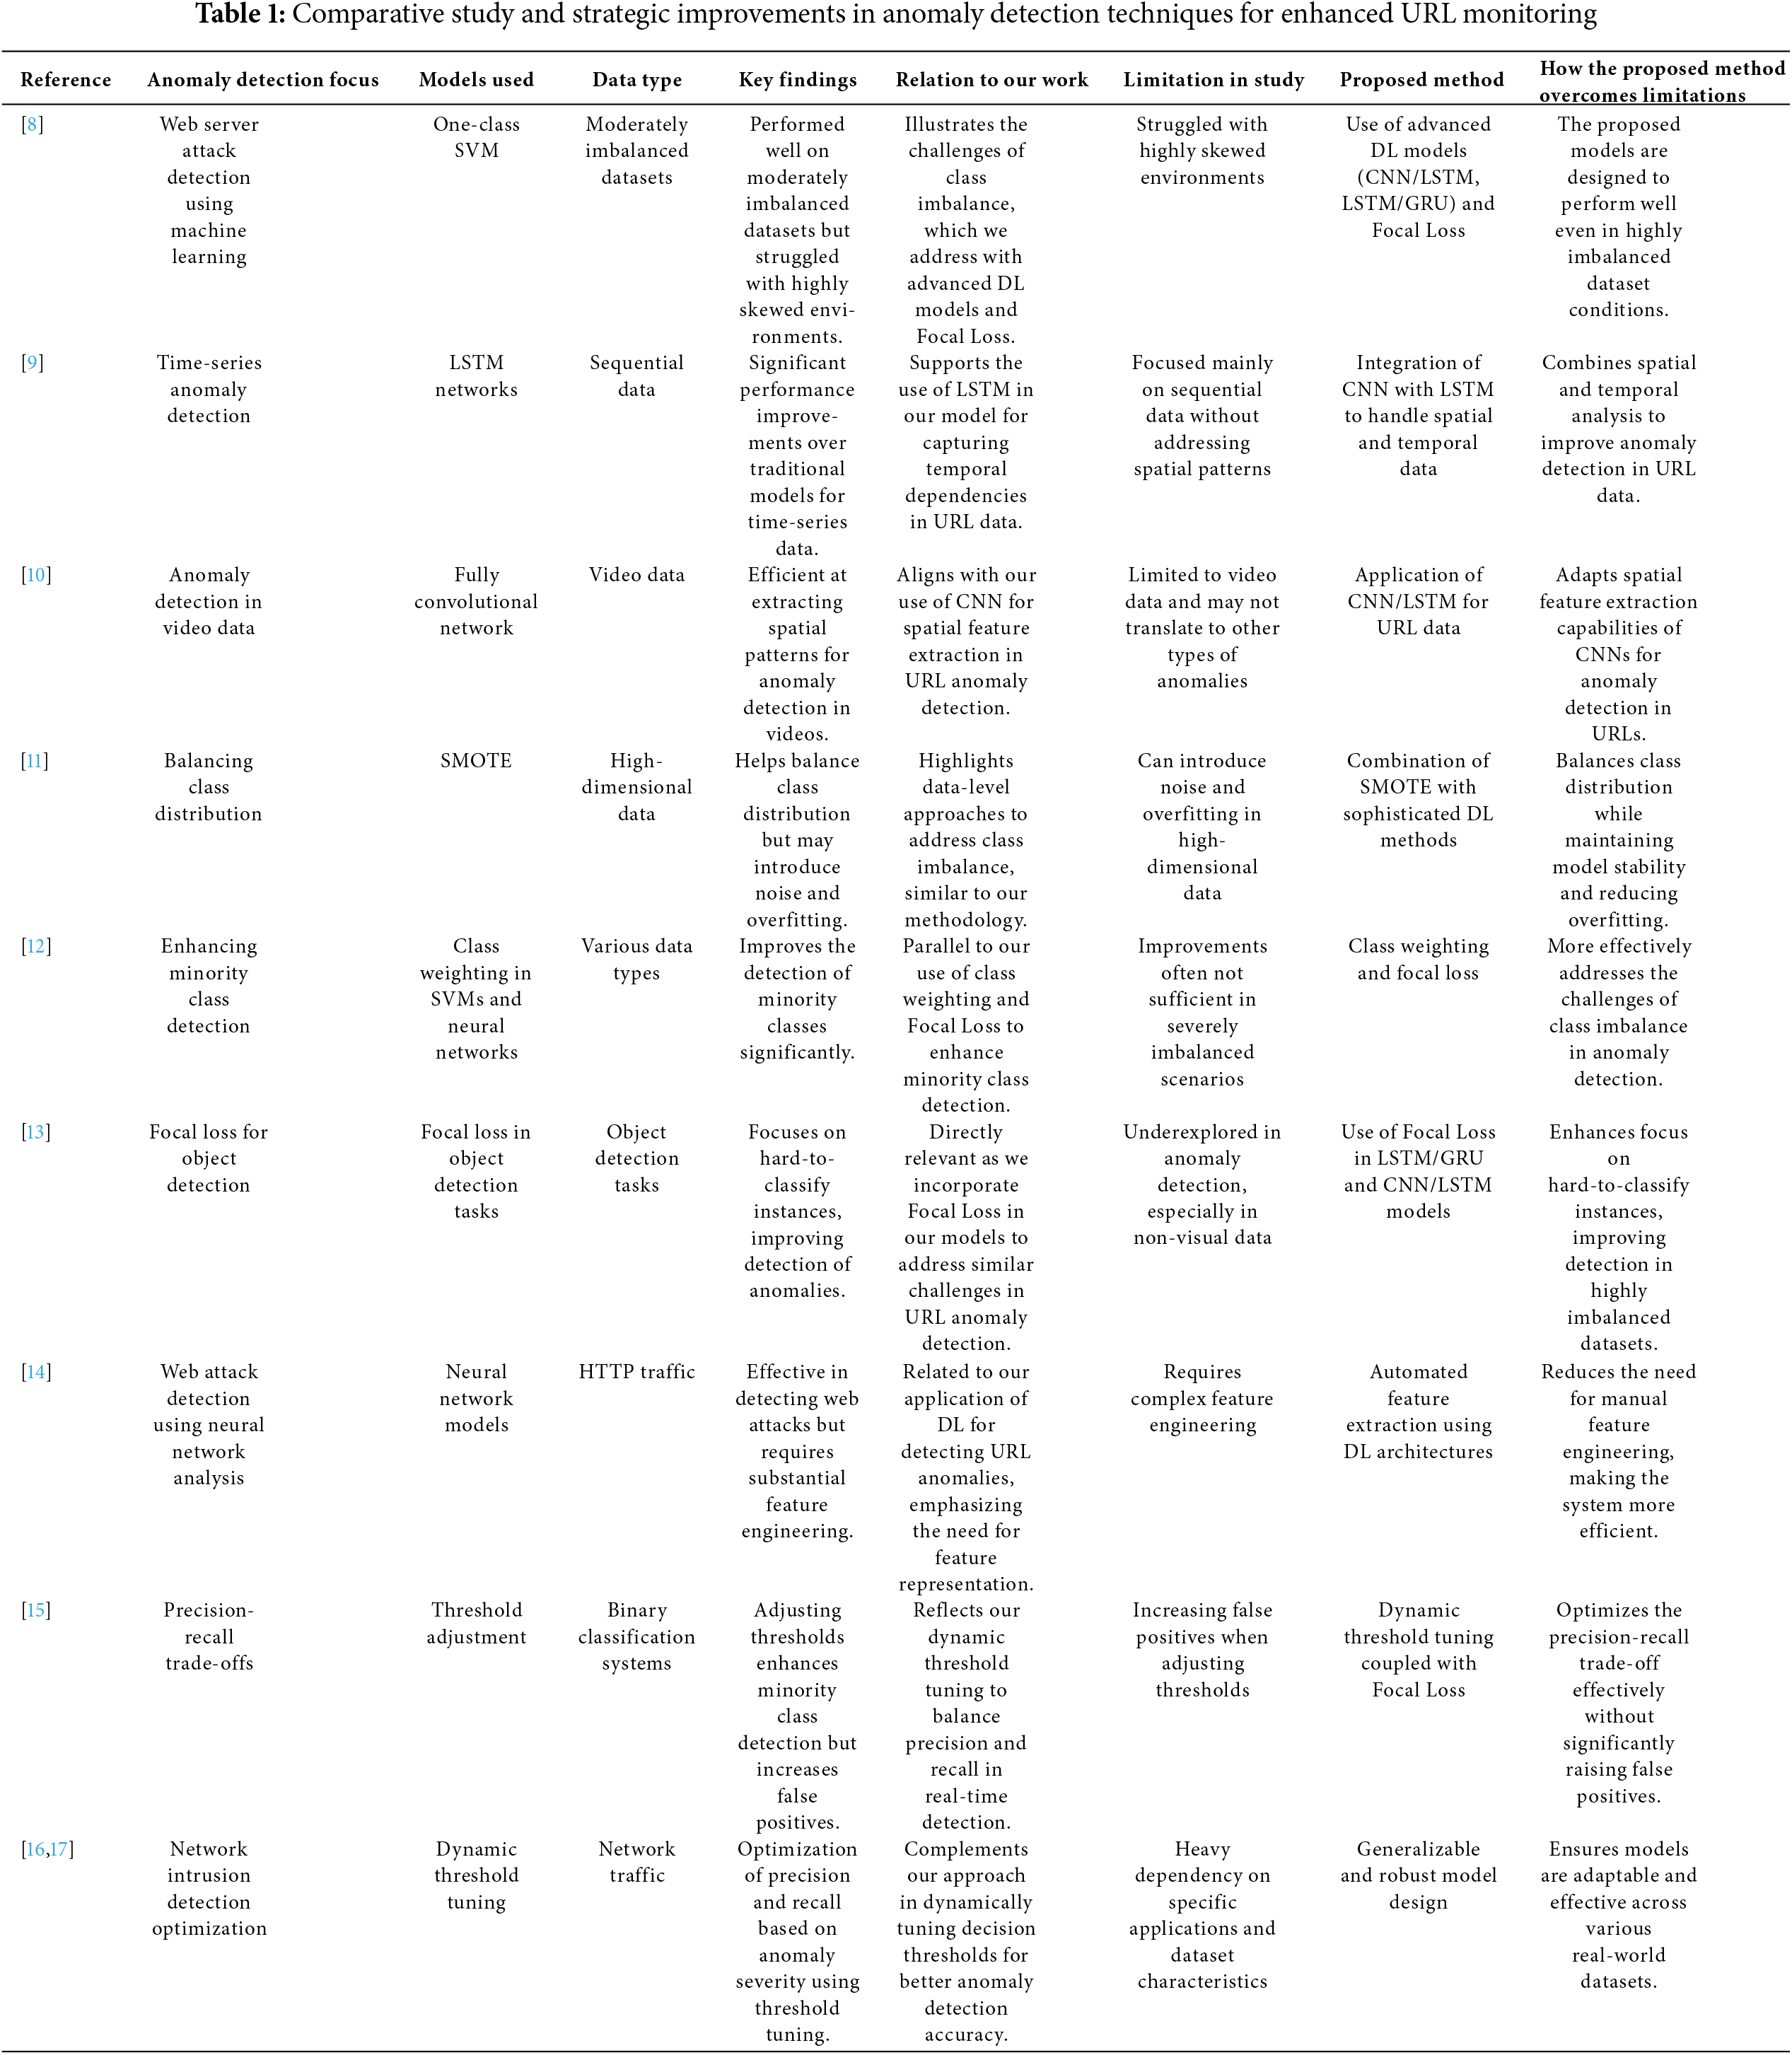
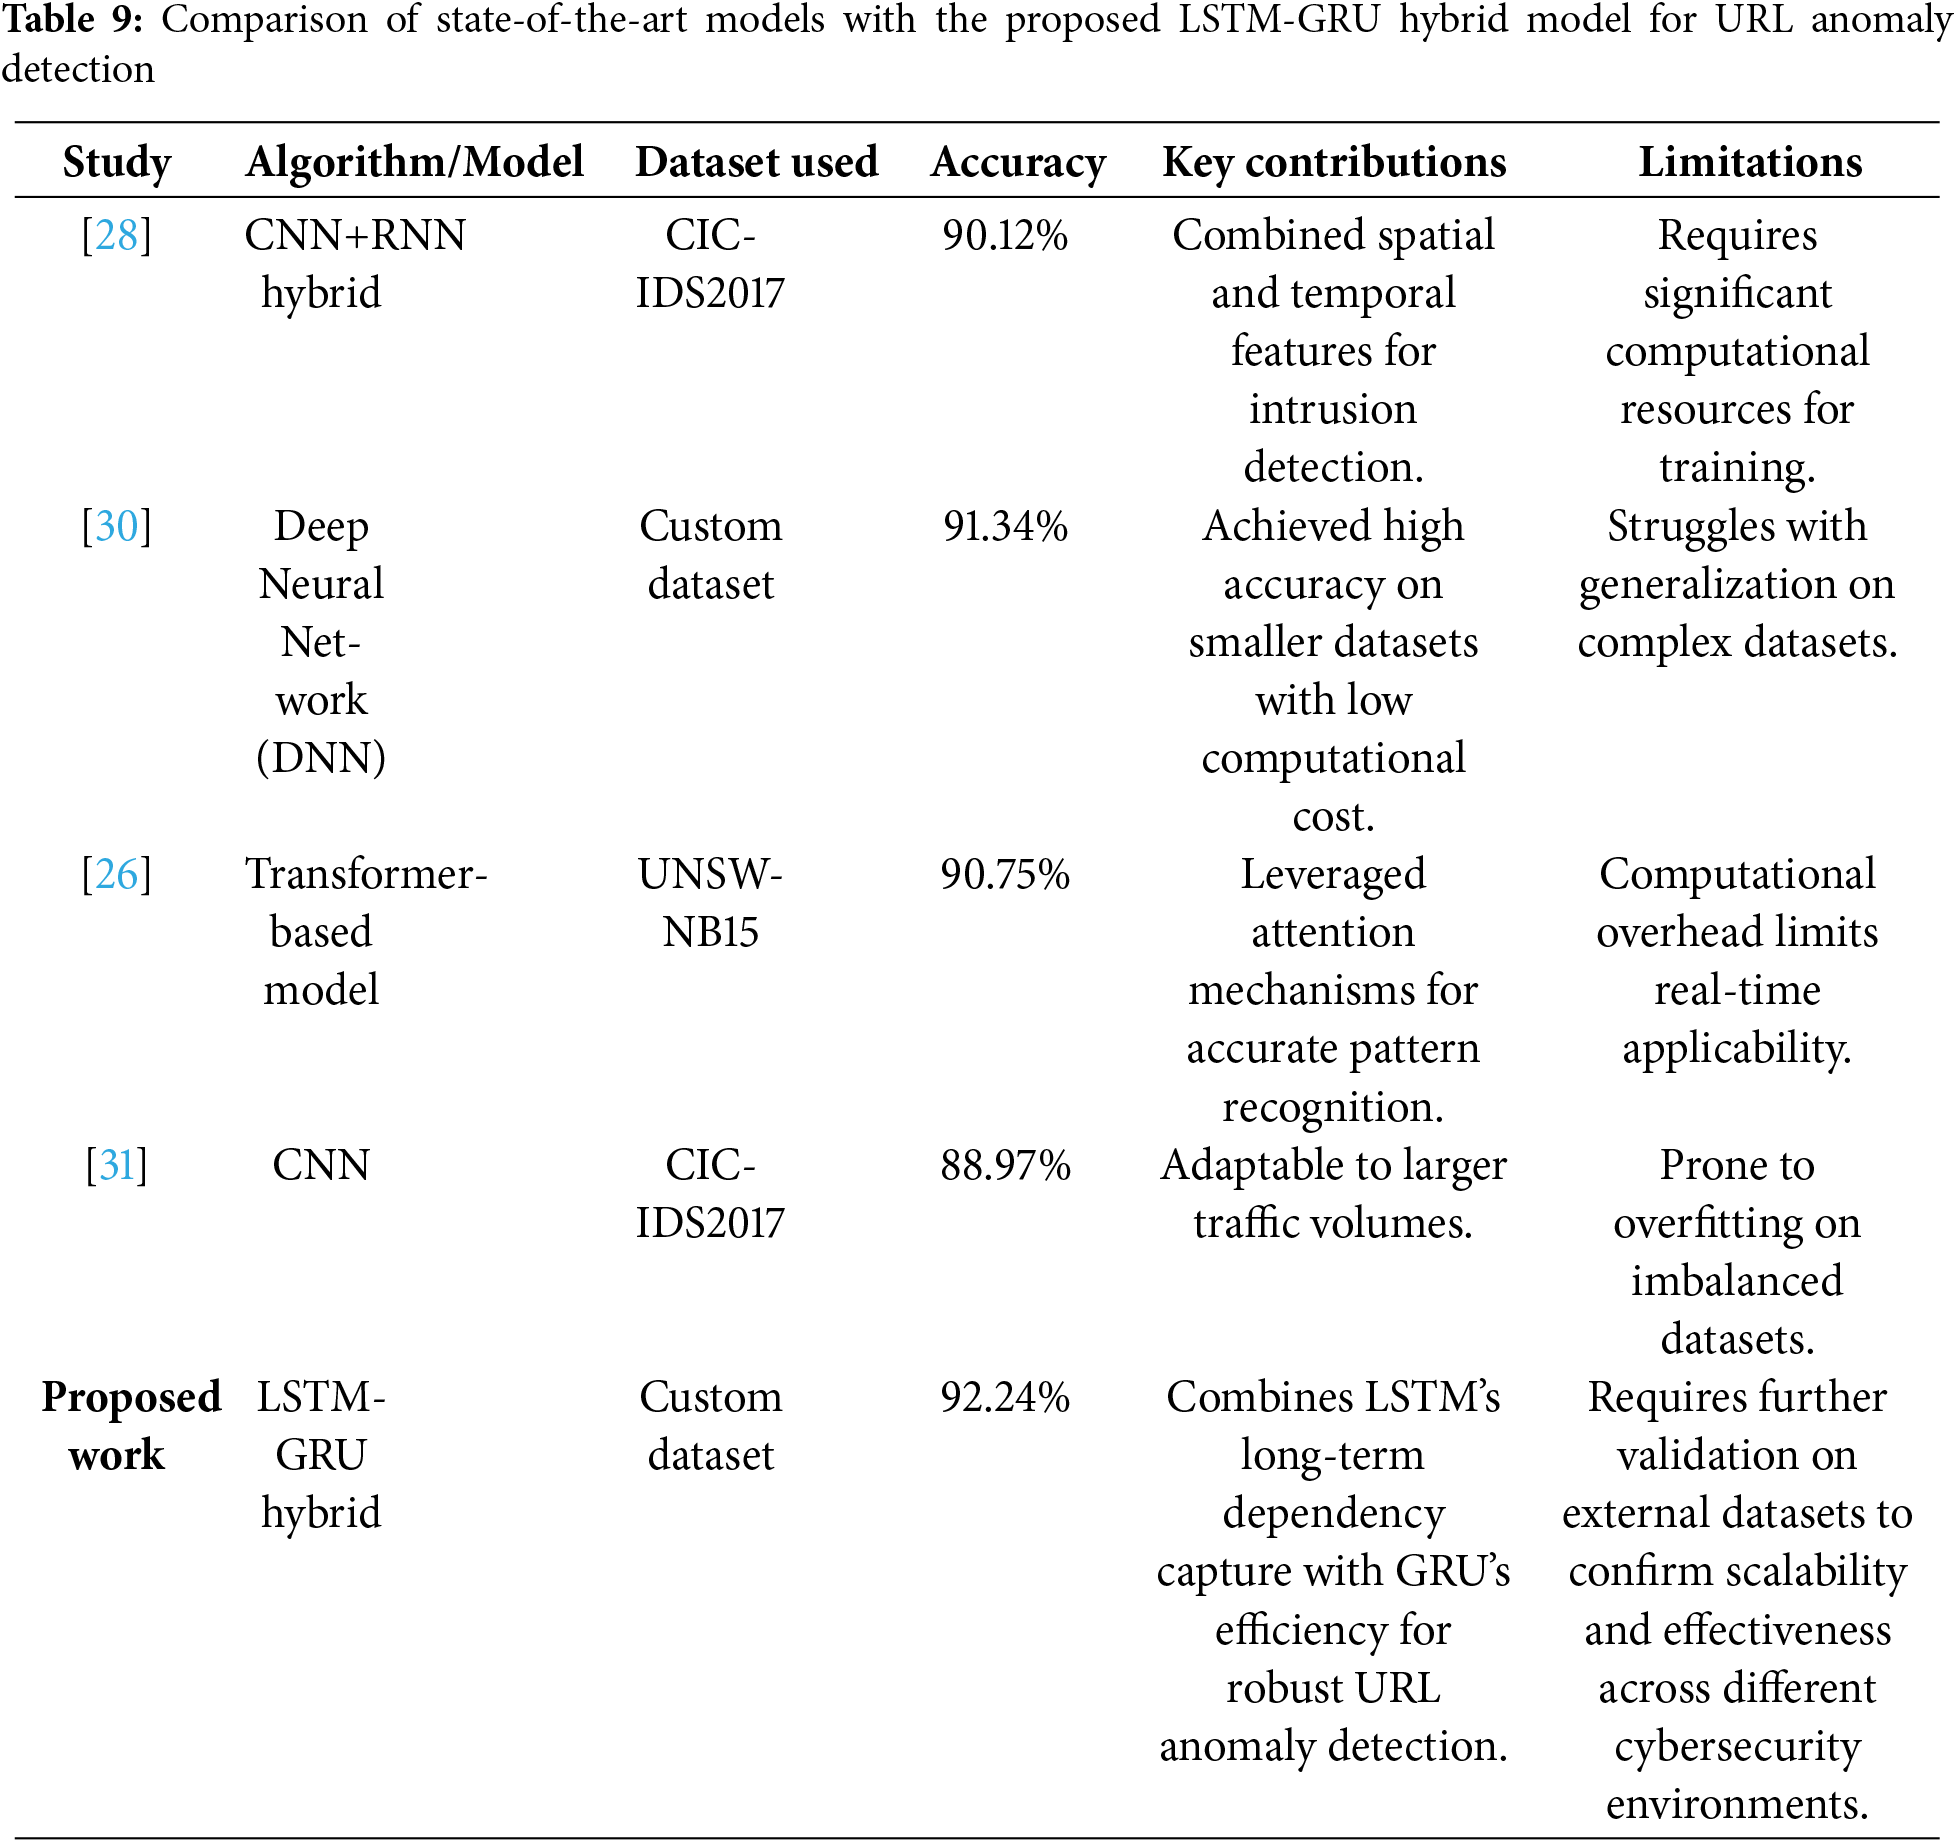
Table 1 gives a comparative review of current studies in URL anomaly detection. While earlier research has investigated varied models such as CNN, RNN, and hybrid techniques, they frequently struggle with real-time application owing to computational price or lack of adjustment to new threats. The proposed LSTM-GRU hybrid model handles these difficulties by combining the properties of LSTM for long-term temporal connections with GRU for computational efficiency. Additionally, the incorporation of automated feature extraction and dynamic threshold-tuning boosts the model’s ability to adapt to different network traffic patterns, providing robust and scalable detection in real-world settings. This work moreover employs a novel dataset combination, offering a full assessment that is lacking in prior studies. However alternate architectures for anomaly detection, such as Transformer-based models or DNNs, have shown potential, they often need significant computer resources and may not focus on mixed spatial-temporal processing. The CNN/LSTM and LSTM/GRU models were picked for their demonstrated effectiveness in sequential data tasks, reinforced by their adaptability to the idiosyncrasies of the dataset utilized in this study.
3 System Architecture and Proposed Models
This section describes our system architecture, the proposed model, and a full discussion on class imbalance resolution methods (Focal Loss, dynamic threshold adjustment to increase anomaly detection, etc.).
The system’s design ingests URL calls and takes care of subtle issues of class mismatch in anomaly detection by harnessing the cloud data center infrastructure to execute the combination of LSTM, GRU, and a hybrid CNN/LSTM models as depicted in Fig. 2. LSTM-GRU hybrid model should capture long-term dependencies in network traffic data, while CNN/LSTM model is designed to recover spatial features before parsing discrete data. These are architectures that were chosen because they are mutually exclusive for evaluating difficult URL patterns. A dynamic threshold-tuning algorithm was also used to fine-tune classification based on different patterns of traffic, making the models more adaptive and accurate. For better minority class anomaly detection, we pair class weighting and Focal Loss [18]. Class weighting changes the role of each class in the training process so that the dominant class doesn’t overpower the minority class. Focal Loss, on the other hand, focuses the model on the difficult-to-categorize cases thus increasing the stability of anomaly detection in highly unbalanced datasets.
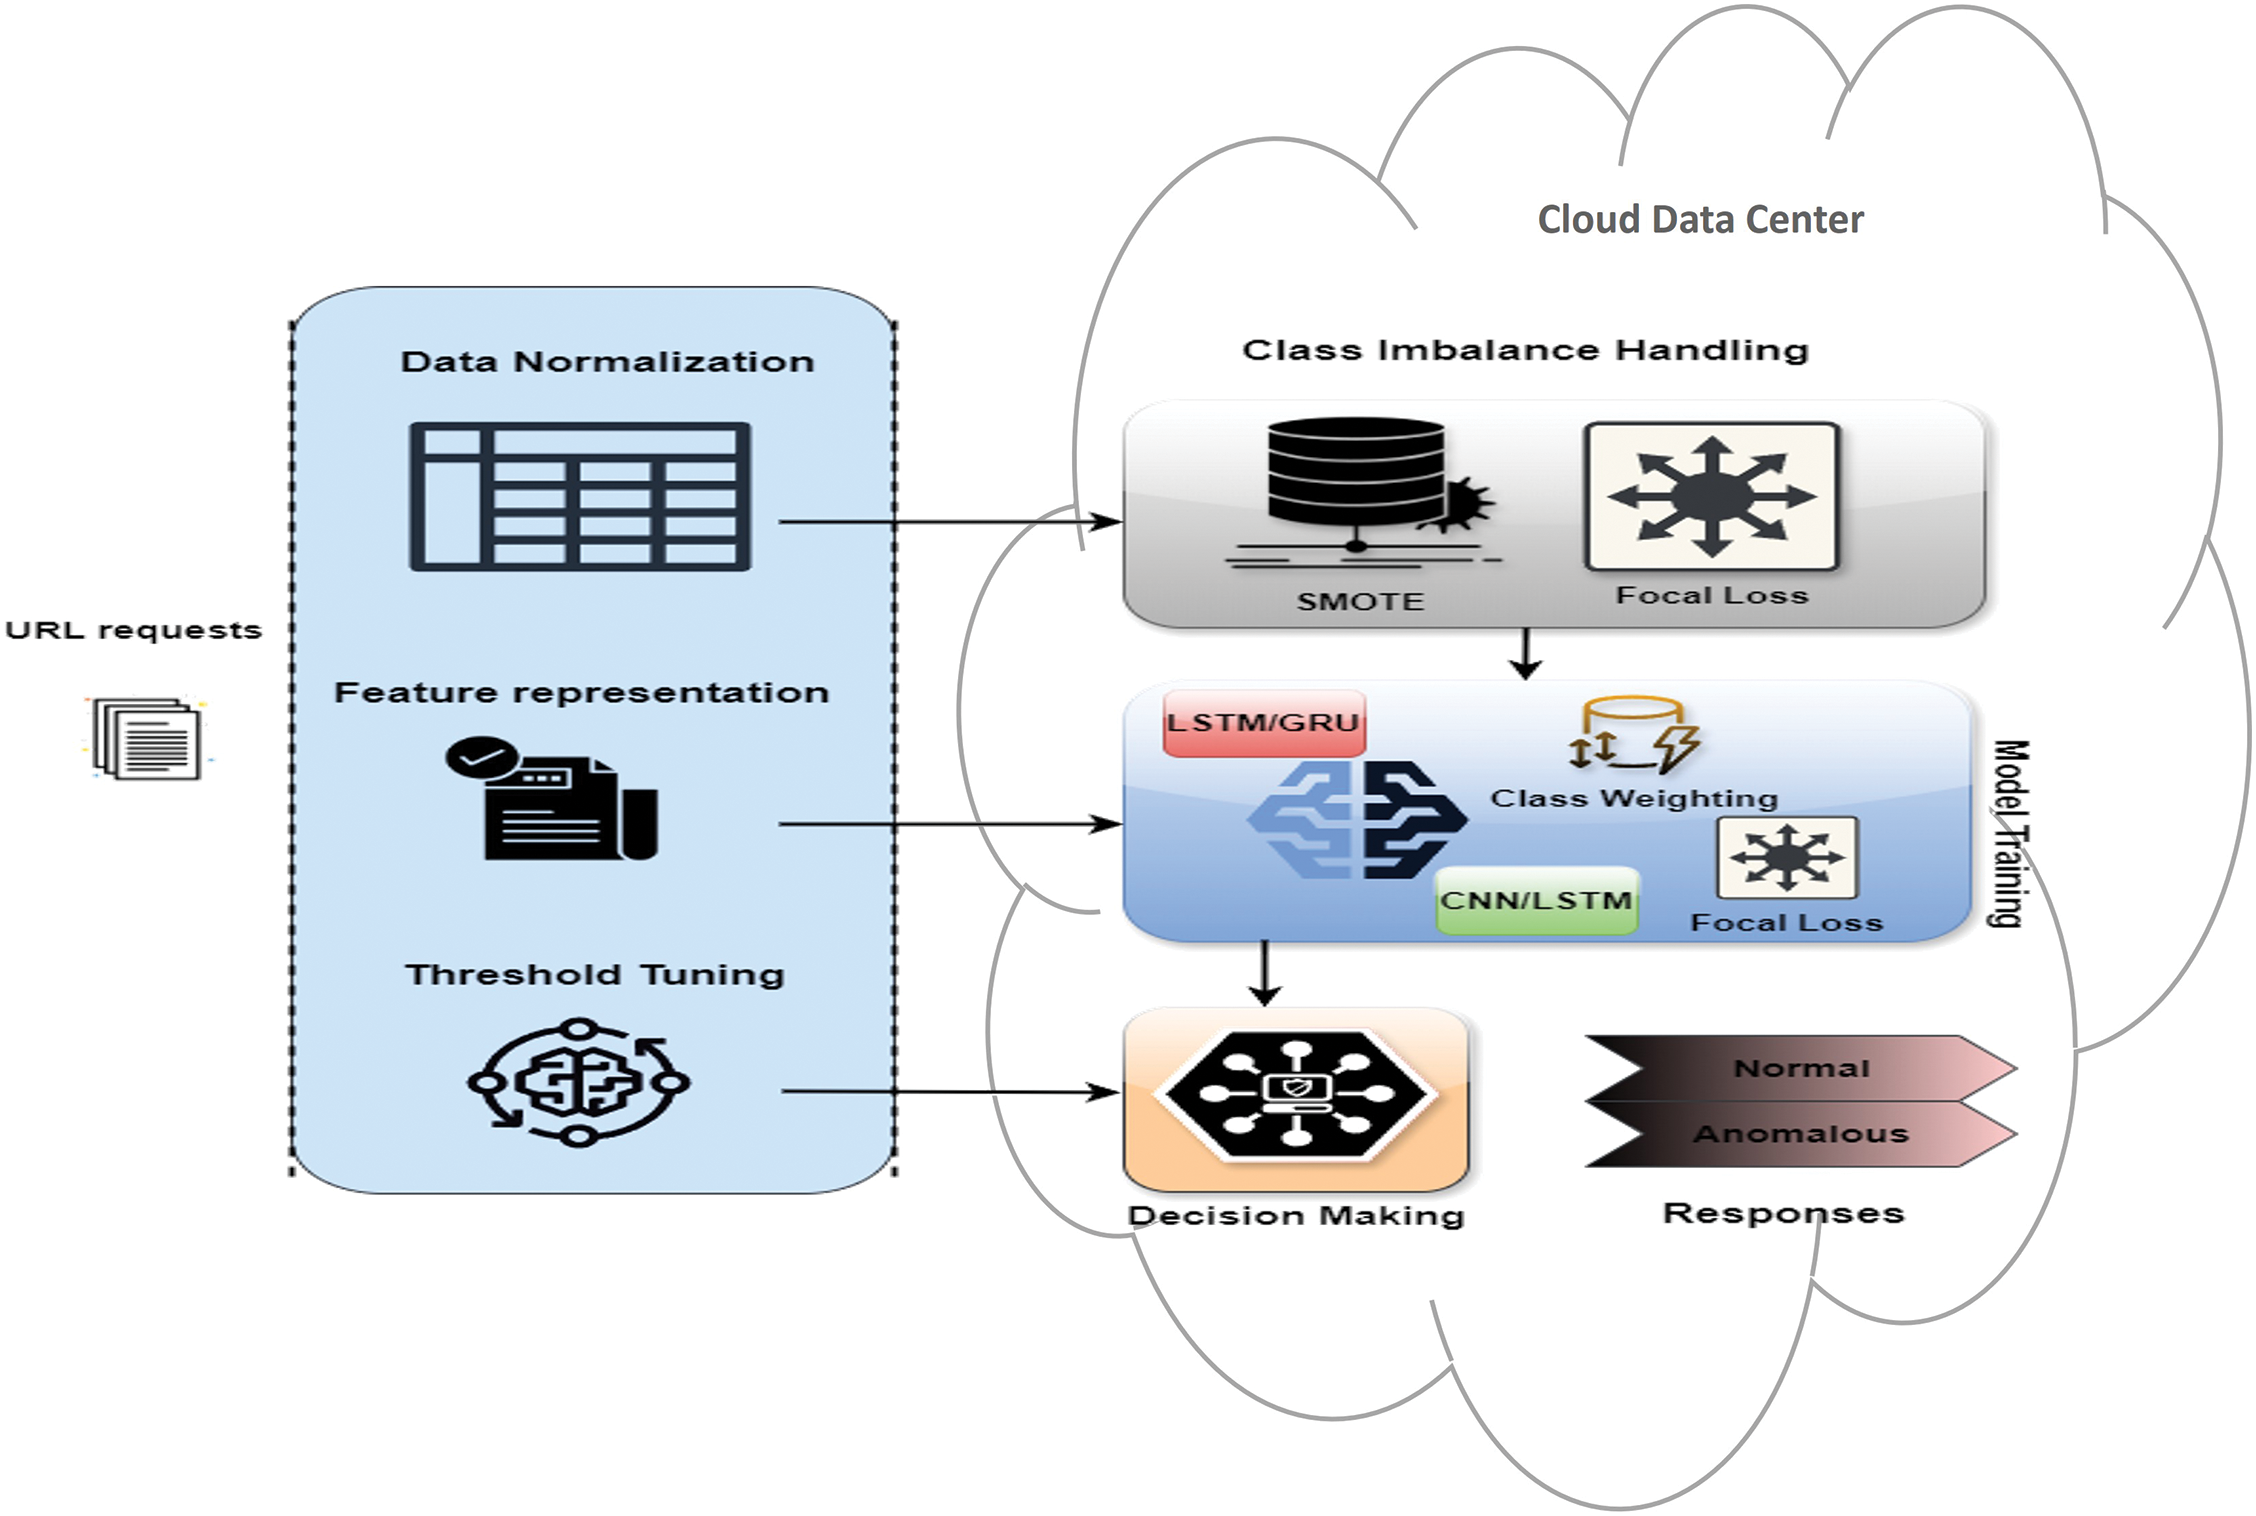
Figure 2: Workflow for URL classification
We chose the CNN/LSTM hybrid model because it allows spatial and temporal analysis to be fused, important in URL anomaly detection. CNN layers are robust in extracting the geography, looking for patterns in the URL chain and LSTM layers parse the same information in sequence finding long-term correlation. Likewise, the LSTM/GRU hybrid model was chosen because it’s complementary, since LSTM encodes long-term temporal correlations, and GRU can make shorter sequences computationally efficient. All this allows the model to get accurate and low-power use of resources which is sufficient for real-time URL threat detection.
Data normalization refers to normalizing numeric column values within a dataset to a uniform scale so that there is no distortion of ranges, and no data is lost [19]. This approach is particularly useful when data are on many scales, and when algorithms make presumptions about the distribution of the data, for example, neural networks [20]. Common methods of normalization include:
• Min-Max Scaling: This technique re-scales the feature to a fixed range of 0 to 1, by subtracting the minimum value of the feature and then dividing it by the range of the feature. The formula is given by:
• Z-score Normalization (Standardization): This method involves re-scaling the feature so that it has a mean of 0 and a standard deviation of 1. The formula used is:
where
Feature representation involves transforming raw data into a format that is better understandable and processable by machine learning algorithms. Techniques for feature representation include:
• One-Hot Encoding: Used for categorical data, where distinct categories are represented as a binary vector with all zeros except the point identifying the category, which is set to one.
• Embedding: Useful for handling massive category variables like words in Natural Language Processing (NLP). Embeddings connect these categories to high-dimensional vectors, where comparable categories are closer together in that space, resulting in a meaningful representation of the data.
• Feature Engineering: Involves creating new features from existing ones to better explain the underlying problem to the prediction models. For example, synthesizing polynomial characteristics from linear ones in regression scenarios.
Threshold tuning is a critical step in optimizing the performance of anomaly detection models, particularly for imbalanced datasets where a default decision threshold of 0.5 may not effectively balance precision and recall. In this study, developers dynamically adjusted the decision threshold to enhance the classification of anomalies while minimizing false positives. The threshold, denoted T, is where the request is considered anomalous or benign [21]. The tuning algorithm was guided by the best possible F1-score, a score that balances recall (i.e., the capacity to detect anomalies) and precision (i.e., accuracy of anomaly detection). In place of using a predetermined threshold, several threshold levels were attempted to fit the particular nature of the data [22]. The higher threshold was used to increase recall by registering more anomalies (i.e., especially when the number of anomalies was relatively small in the dataset).
Mathematically, the classification decision is given by:
where
We used the Receiver Operating Characteristic (ROC) curve to find the right threshold. To get the maximum True Positive Rate (TPR) at a lower False Positive Rate (FPR), the location that was the furthest from the top-left corner of the ROC curve was chosen. Adjustments were dynamically made according to the model’s belief in the abnormal degree so that when we reduced the threshold, there were not too many false positives. Changing the decision boundary in this way led to the model getting a better match between accuracy and recall and is therefore suitable for real-world anomaly detection tasks.
3.1.4 Management of Class Imbalance
A key problem in anomaly detection is that the normalities of aberrant events are mismatched with the rarities of occurrences. The standard training approaches generally take precedence on the relatively typical “normal” data instead of accurately detecting these rare exceptions [23]. To overcome this, the researchers use a combination of data- and algorithm-level methods as well as adjustments to the classification threshold in order to improve the recall and accuracy of anomaly detection.
Class weighting is a way to keep class unbalanced during practice. This method adds a lot of weight to the minority class, which are the oddities, so the model has to give more attention to detecting the oddities. These weights become especially relevant when computing the binary cross-entropy loss where misidentifications of minority class are more severe, hence strengthening the memory and detection of anomalies [18,24].
Additionally, Focal Loss is integrated as a specialized loss function that focuses on hard-to-classify instances, further addressing class imbalance. This function modifies the standard cross-entropy loss by introducing a scaling factor that diminishes the impact of well-classified samples and amplifies the loss associated with challenging or misclassified instances. The Focal Loss equation is:
where
Beyond modifying the loss function, researchers also adjust the decision threshold, which is generally set at 0.5. For imbalanced datasets, this standard threshold would not be beneficial; accordingly, lower thresholds are examined to improve the detection of irregularities. By testing with various thresholds, the goal is to establish a balance that optimizes the F1-score, effectively balancing recall and precision. Dynamic threshold adjustments allow the model to better fit the specific qualities of the data, increasing recall without unnecessarily boosting false positives. This flexibility in the decision border permits a more sophisticated categorization of aberrant events.
For anomaly detection and datasets with high-class imbalance, two advanced LSTM/GRU Hybrid Models and CNN/LSTM Model are introduced that allow us to identify the rare anomalous events better without the intrusion of the encroaching class.
The LSTM/GRU Hybrid Model takes the strengths of LSTM units and GRU and combines them to operate on different elements of sequence data. LSTM is essential to identify the relationship over time, so patterns that reveal anomalies over a long period will be detected. At the same time, the GRU component improves processing speed which is useful especially when anomalies are subtle and emerge in a short time. It’s a well-suited paradigm to handle time-series data from most fields like network traffic, bank transactions, or industrial machine sensor data, where anomalies typically include changes in prior patterns over time [25].
In contrast, the CNN/LSTM Model is a combination of CNN’s spatial feature extraction ability and LSTM layers’ sequential data processing abilities. The CNN layers first extract the geographical data from the input data and later the LSTM layers search for temporal anomalies. This double method works best for cases in which anomalies are characterized not only by how they manifest in data streams but also by the way that these forms change over time. The use cases for video surveillance of abnormal activities or defect detection in the production process whose records are sequences of images can benefit enormously from this technology [26].
Features of CNN are flattened to a vector with one dimension and passed to the LSTM layer. The LSTM looks at these ordered vectors and records the correlations in time and the longer-term history of the data [26]. Mathematically, this change may be expressed as:
where the CNN weights and biases are
Both strategies involve significant data preprocessing to ensure excellent performance. This encompasses normalization and complicated feature encoding to prepare the data appropriately for these advanced neural architectures. Additionally, managing the class imbalance is vital and is addressed by strategies like class weighing and the installation of Focal Loss. The latter modifies the attention on difficult-to-classify examples by altering the conventional cross-entropy loss, so reducing the imbalance between the minority (anomalies) and the majority (regular events) [27].
Furthermore, these models utilize dynamic threshold adjustment to accurately balance the precision-recall trade-off. This is crucial in cases when a typical judgment criterion (generally 0.5) is inadequate due to the skewed nature of the data. By experimenting with different threshold settings to optimize the F1-score and adjusting the threshold based on the model’s confidence in the anomaly degree, these models improve recall without significantly increasing false positives, resulting in a more nuanced and effective anomaly detection capability. Fig. 3 illustrates a sophisticated DL architecture that integrates several neural network types, including LSTM, GRU, and CNN, to process URL data inputs. It also tackles class imbalance using SMOT and Focal Loss.
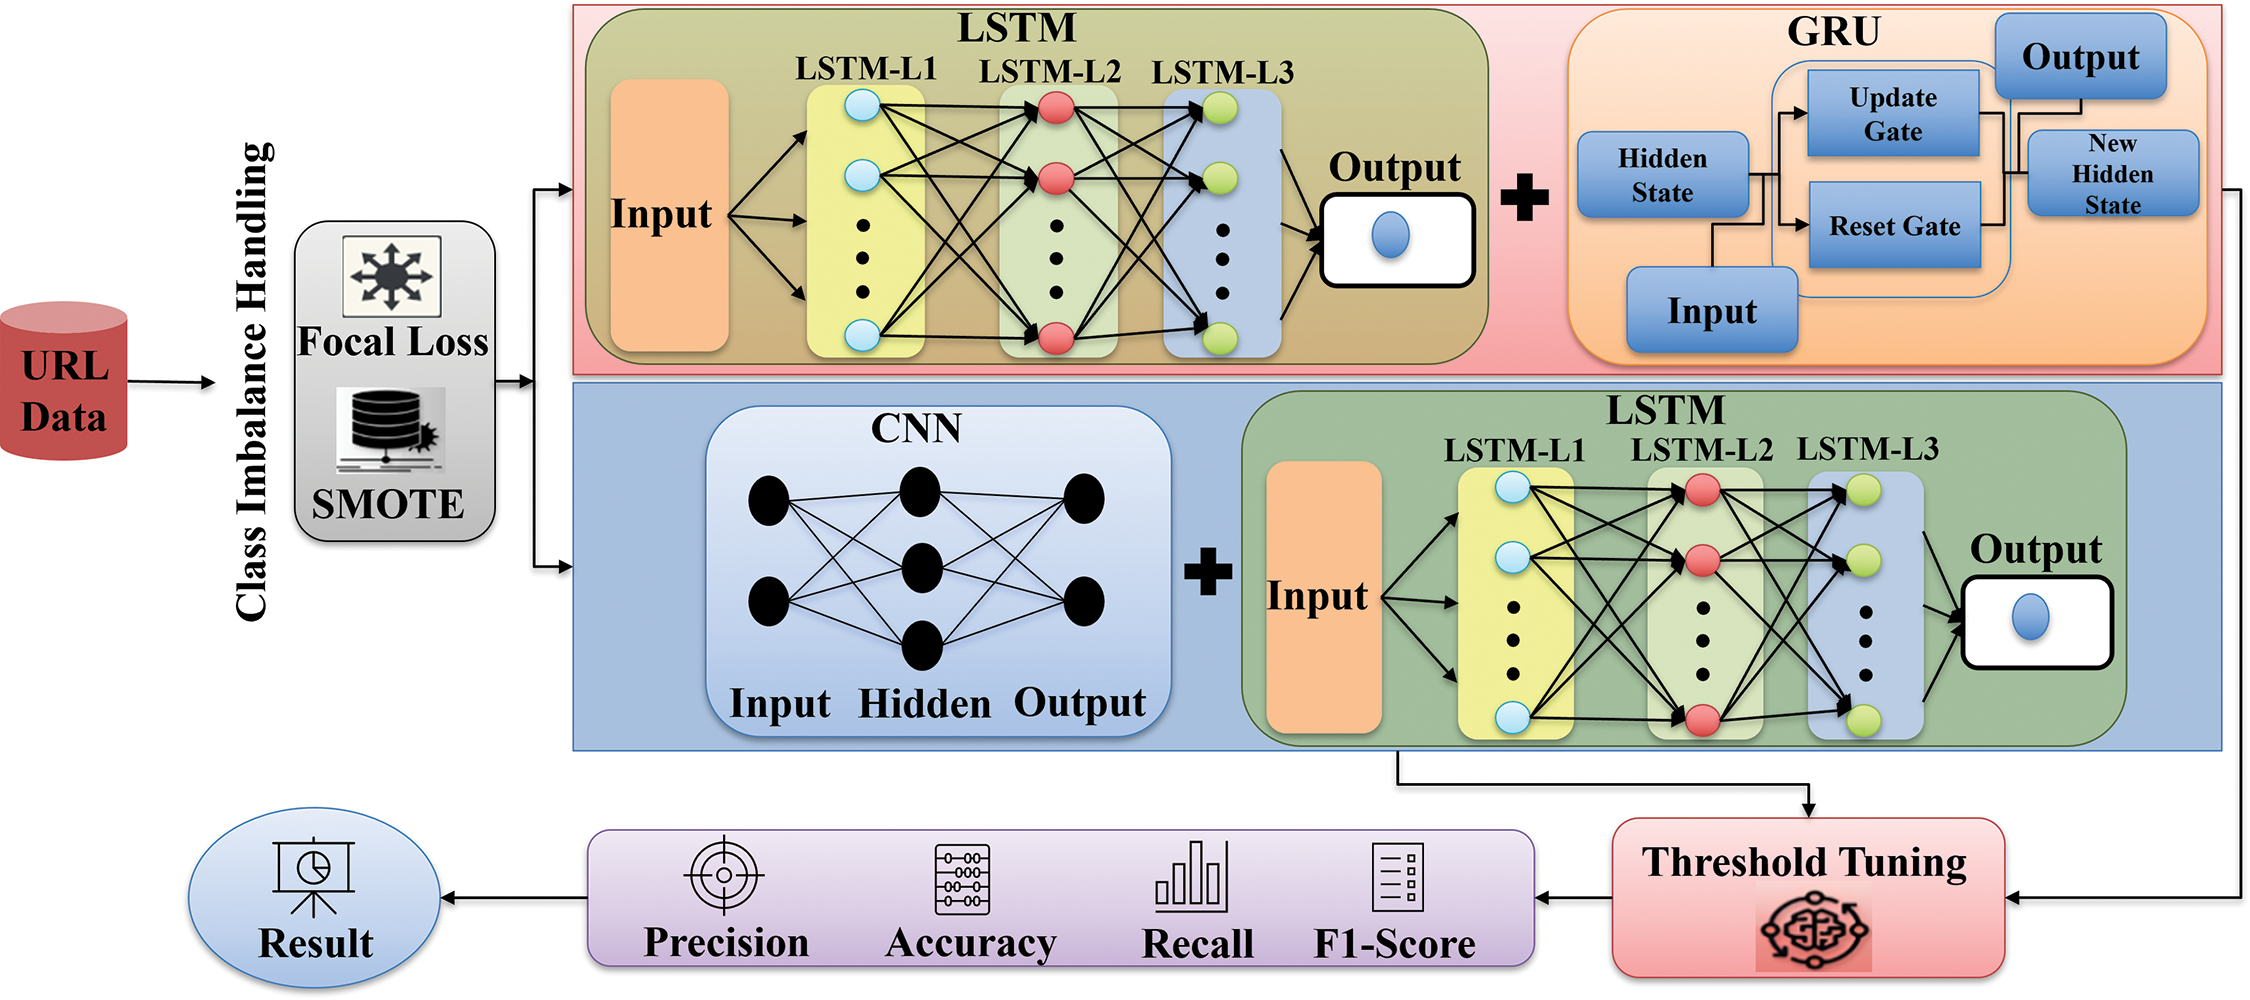
Figure 3: Model architecture
4 Implementation and Models Configuration
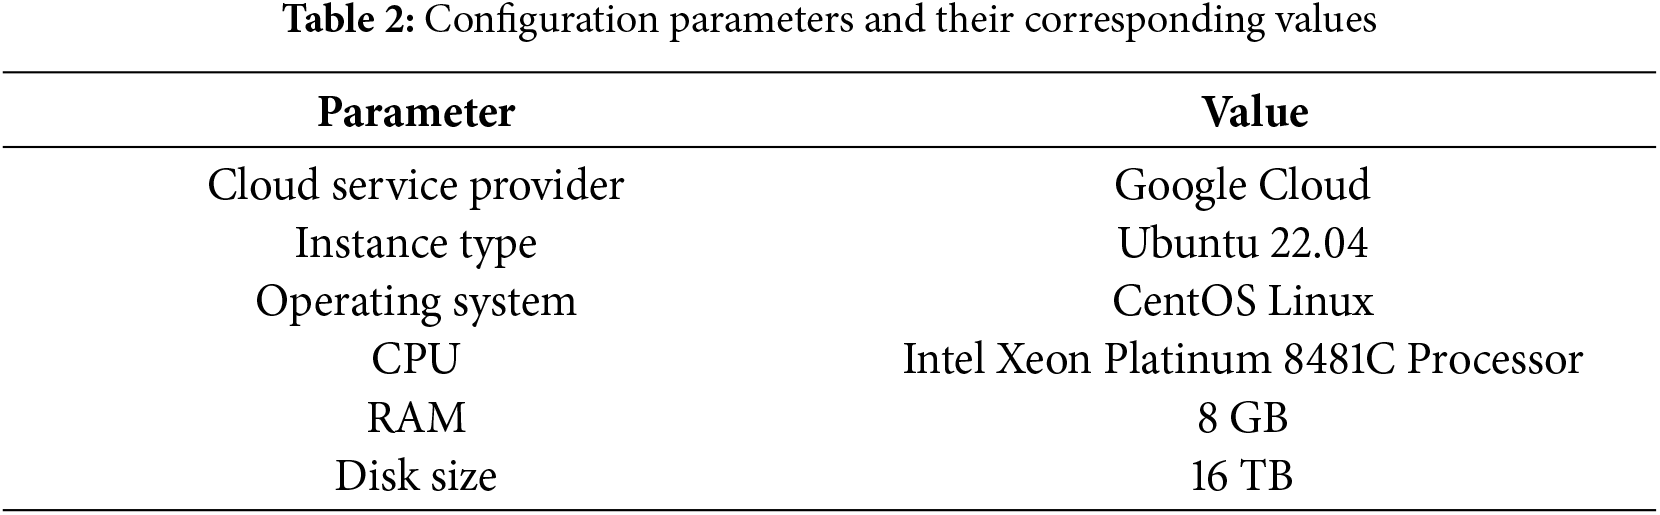
To carry out the implementation, we made use of Google Cloud Computing Services (Google Cloud) (https://cloud.google.com/, accessed on 01 September 2024). In this framework, we deployed virtual machines that ran the Ubuntu Operating System version 22.04, sourced from the Ubuntu OS Cloud Marketplace (https://console.cloud.google.com/marketplace/product/ubuntu-os-cloud/ubuntu-jammy?hl=en-GB, accessed on 03 September 2024). These virtual machines were set up with the Docker platform (https://cloud.google.com/compute/docs/containers, accessed on 10 September 2024) to run the application container. Specifically, we employed the standard c3d-Standard-8 configuration on Google Cloud, with each virtual machine having 8 VCPUs and 32 gigabytes (GB) of memory. Our system architecture consisted of two Virtual Machines (VMs), each assigned a distinct model including the LSTM/GRU Hybrid Model and the CNN/LSTM Model. The specifics of the configuration parameters and corresponding values chosen for setting up and managing our system architecture on Google Cloud are outlined in Table 2.
For the software, we have used TensorFlow 1.8.0 from Google and Python 3.6.3-64-bit. In the following subsection, we will present a summary of the datasets applied in our research and evaluation.
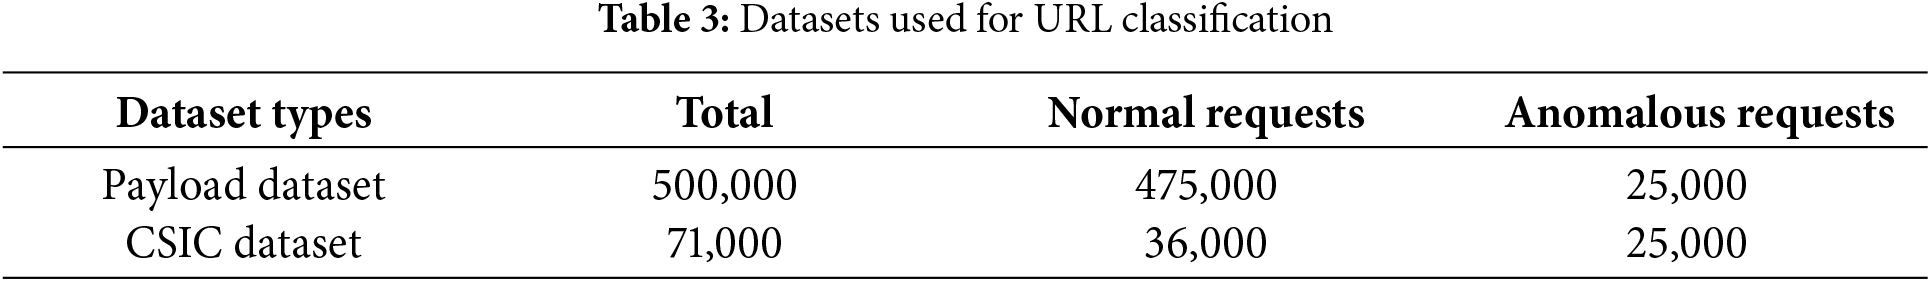
Using two main datasets, the Payload Dataset and the CSIC 2010 Dataset the research searches for irregularities. The Payload Dataset comprises 500,000 HTTP request payloads [28]; 25,000 odd and 475,000 normal requests contribute to this total. With just 5% of the searches unique, this dataset depicts real class imbalance and highlights web request payloads [29]. It checks if the algorithms can discover minute changes in ordinary traffic. 25,000 are unique and 36,000 are normal out of the 71,000 searches in the CSIC Dataset. Mostly used for online attack detection, this dataset starts different attacks like Structured Query Language (SQL) injection, buffer overflow, and cross-site scripting [30]. It assesses the models’ abilities to manage multiple attack circumstances, hence presenting a fair challenge. Table 3 details the datasets’ specifications. These datasets are essential for testing and validating the proposed LSTM/GRU and CNN/LSTM models under class imbalance conditions.
The proposed anomaly detection system integrates LSTM/GRU and CNN/LSTM models to effectively manage class imbalance, a significant challenge in detecting anomalies within large datasets [26]. These models leverage both spatial and temporal data and are supplemented with class weighting and Focal Loss to enhance minority class detection. Data normalization and feature representation give optimal input quality and applying methodologies like Min-Max scaling to retain feature uniformity essential for DL. To address the class imbalance, we mix data-level adjustments such as SMOTE with algorithm-level adjustments such as dynamic threshold adjusting to strike the right balance between recall and accuracy [31,32]. The architecture of the system (i.e., training and validation) utilizes early stopping to minimize overfitting, while regular performance monitoring drives hyperparameter changes and thresholds so that the models are detectable and overall effective.
4.2 Model Configurations, Training, Validation, and Tuning
The LSTM/GRU and CNN/LSTM models are well-configured for training and validation. It handles the training process extremely carefully by, for example, phasing it out early to avoid overfitting and training the models in a way that they generalize to unseen data. Validation is the process of running the model over and over again against a different validation set to check performance (accuracy, precision, recall, etc.). The hyperparameters and configurations of the models are tinkered with according to these observations to continuously enhance performance [33]. Regularization like dropout layers to avoid overfitting were used for model improvement and parameter values such as learning rate and batch size were optimized. Dynamic threshold-tuning is used that allows the models to update classification threshold dynamically, enabling robustness against traffic fluctuations. These reforms made great advances in precision and generalization.
4.2.1 Hyperparameters of Hybrid Model
CNN/LSTM and LSTM/GRU hybrid models were trained on carefully selected hyperparameters for performance. They were discovered by human tinkering and cross-validation to strike the right chord between precision and computational cost. Table 4 outlines the important hyperparameters utilized for both models.
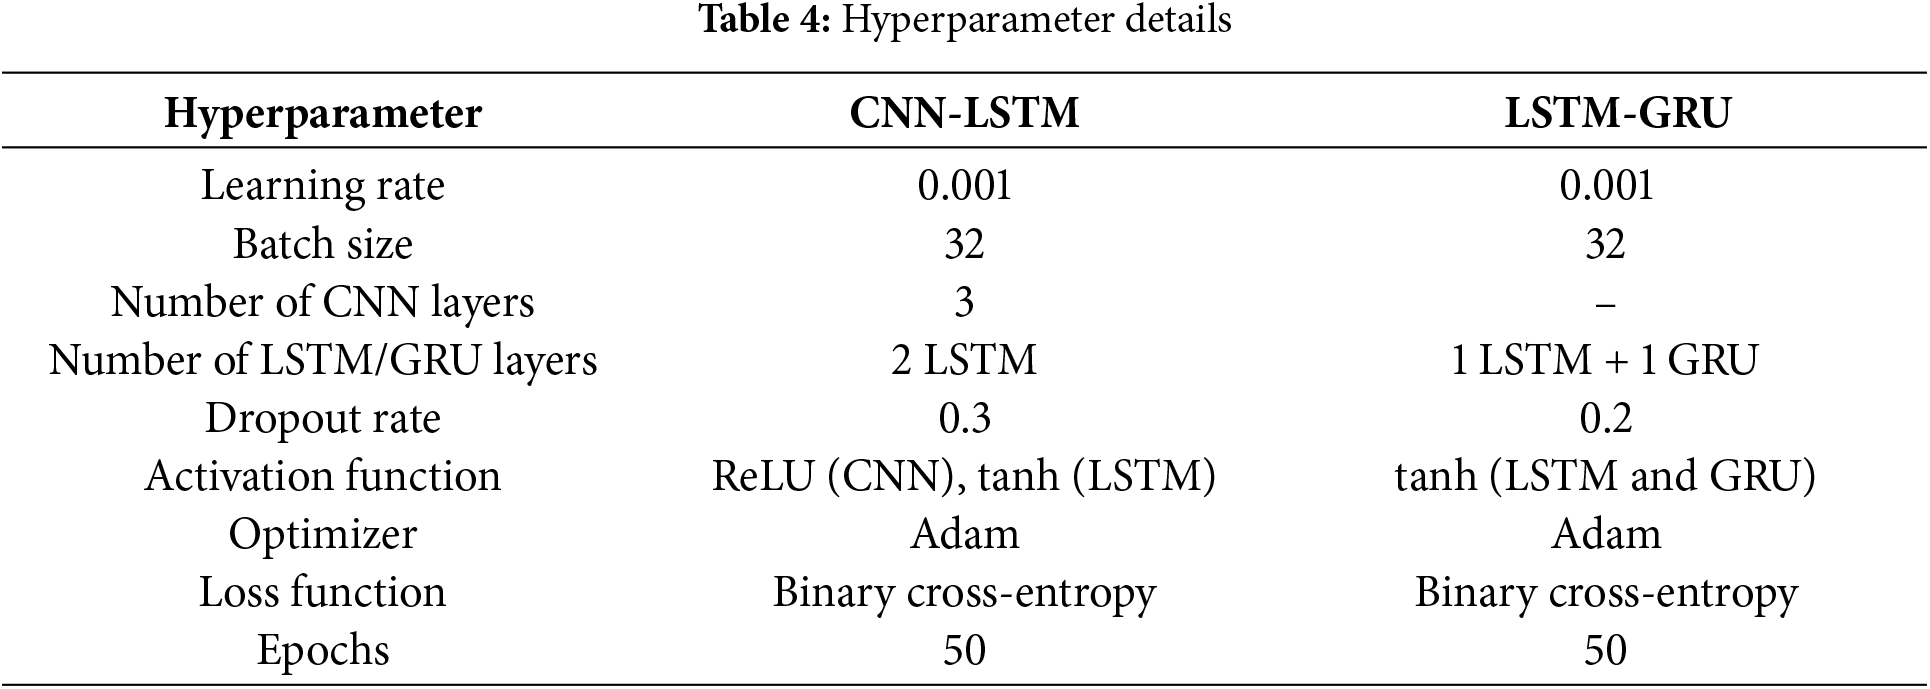
The learning rate was 0.001 to ensure stable convergence through training and we used dropout rates to prevent overfitting. To extract non-linear relationships in the data we used activation functions like ReLU and tanh. These models were augmented by Adam optimizer, a gradient descent algorithm that is both fast and precise.
5 Experiment and Results Analysis
This section presents the outputs for 2 DL models (LSTM/GRU and CNN/LSTM) on the anomaly detection task with the provided datasets. The data in this work contains both benign and malicious URL traffic patterns that provide a broad view of how well the models generalize. On the other hand, actual network infrastructures are alive and thriving. Test accuracy and F1-score show the current generalisability of the models, and the LSTM/GRU hybrid delivers very good performance under a variety of traffic conditions.
The evaluation is primarily on accuracy, precision, recall, F1-score, and error ratios like Mean Squared Error (MSE) and Root Mean Squared Error (RMSE) [34]. These scores were gathered to evaluate whether the models can pick up anomalies in imbalanced datasets when most requests are normal, and few are abnormal [35]. To minimize the excess number of repetitive requests and unregular requests, we employed class imbalance control methods like SMOTE and Focal Loss which reduces the model bias towards the dominant class [36]. The results of this experiment, which highlights the differences in performance of both models, are presented in the next subsections.
The CNN/LSTM and LSTMGRU models were benchmarked against current approaches published in the literature, including DenseNets and Transformer-based models. The suggested LSTM/GRU hybrid achieved a testing accuracy of 92.24%, beating the stated performance of most state-of-the-art models, notably in terms of computational efficiency and flexibility to URL anomaly detection. While Transformer-based models promise promising results, their computational complexity makes them problematic for real-time implementation in resource-constrained contexts.
5.1 Model Performances and Error Comparison
The general performance of the LSTM/GRU, and CNN/LSTM, models was evaluated using typical classification criteria accuracy, precision, recall, and F1-score. The CNN/LSTM model shows the best results in terms of all the performance metrics. Table 5 displays performance metrics for models under different settings of learning rate, batch size, and dropout rate. The models perform best with a learning rate of 0.001 and a batch size of 128, showing improved accuracy and F1-score. This data highlights the importance of parameter tuning in enhancing model effectiveness.
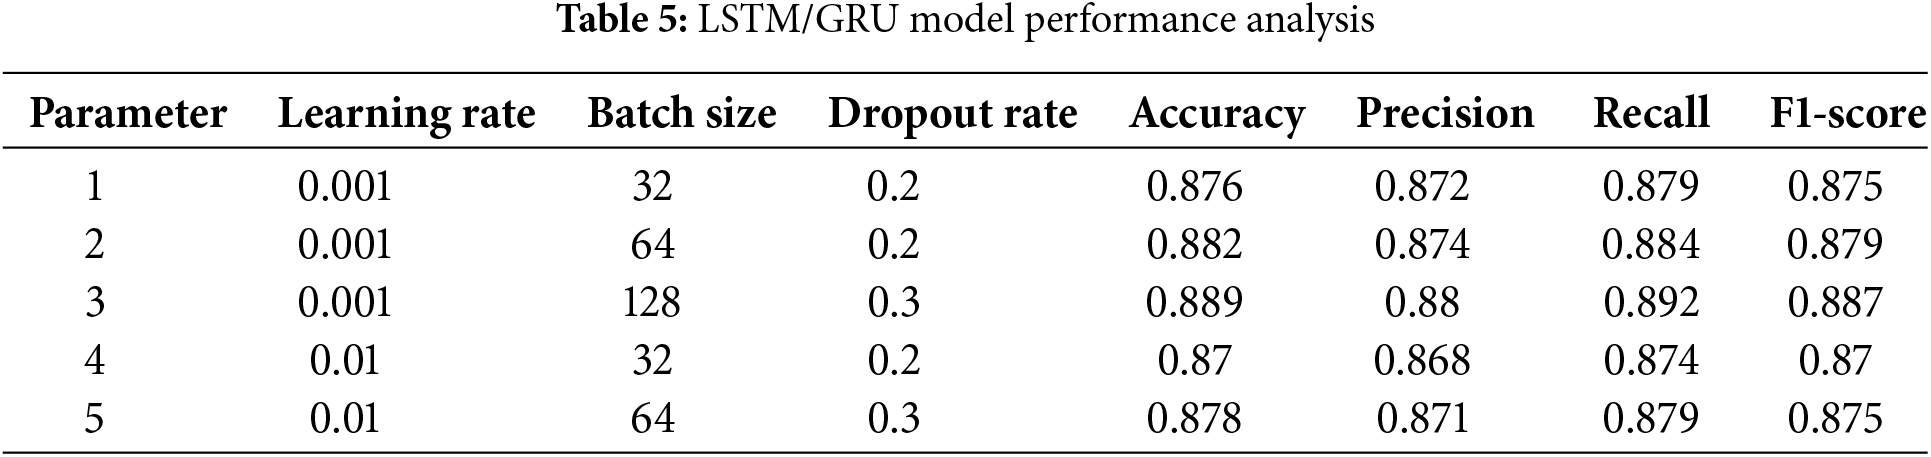
Fig. 4 illustrates the performance of different hyperparameter configurations on key metrics such as Accuracy, Precision, Recall, and F1-score. The model achieves the highest performance with a learning rate of 0.001, batch size of 128, and a dropout rate of 0.3, as indicated by the peak in all metrics.
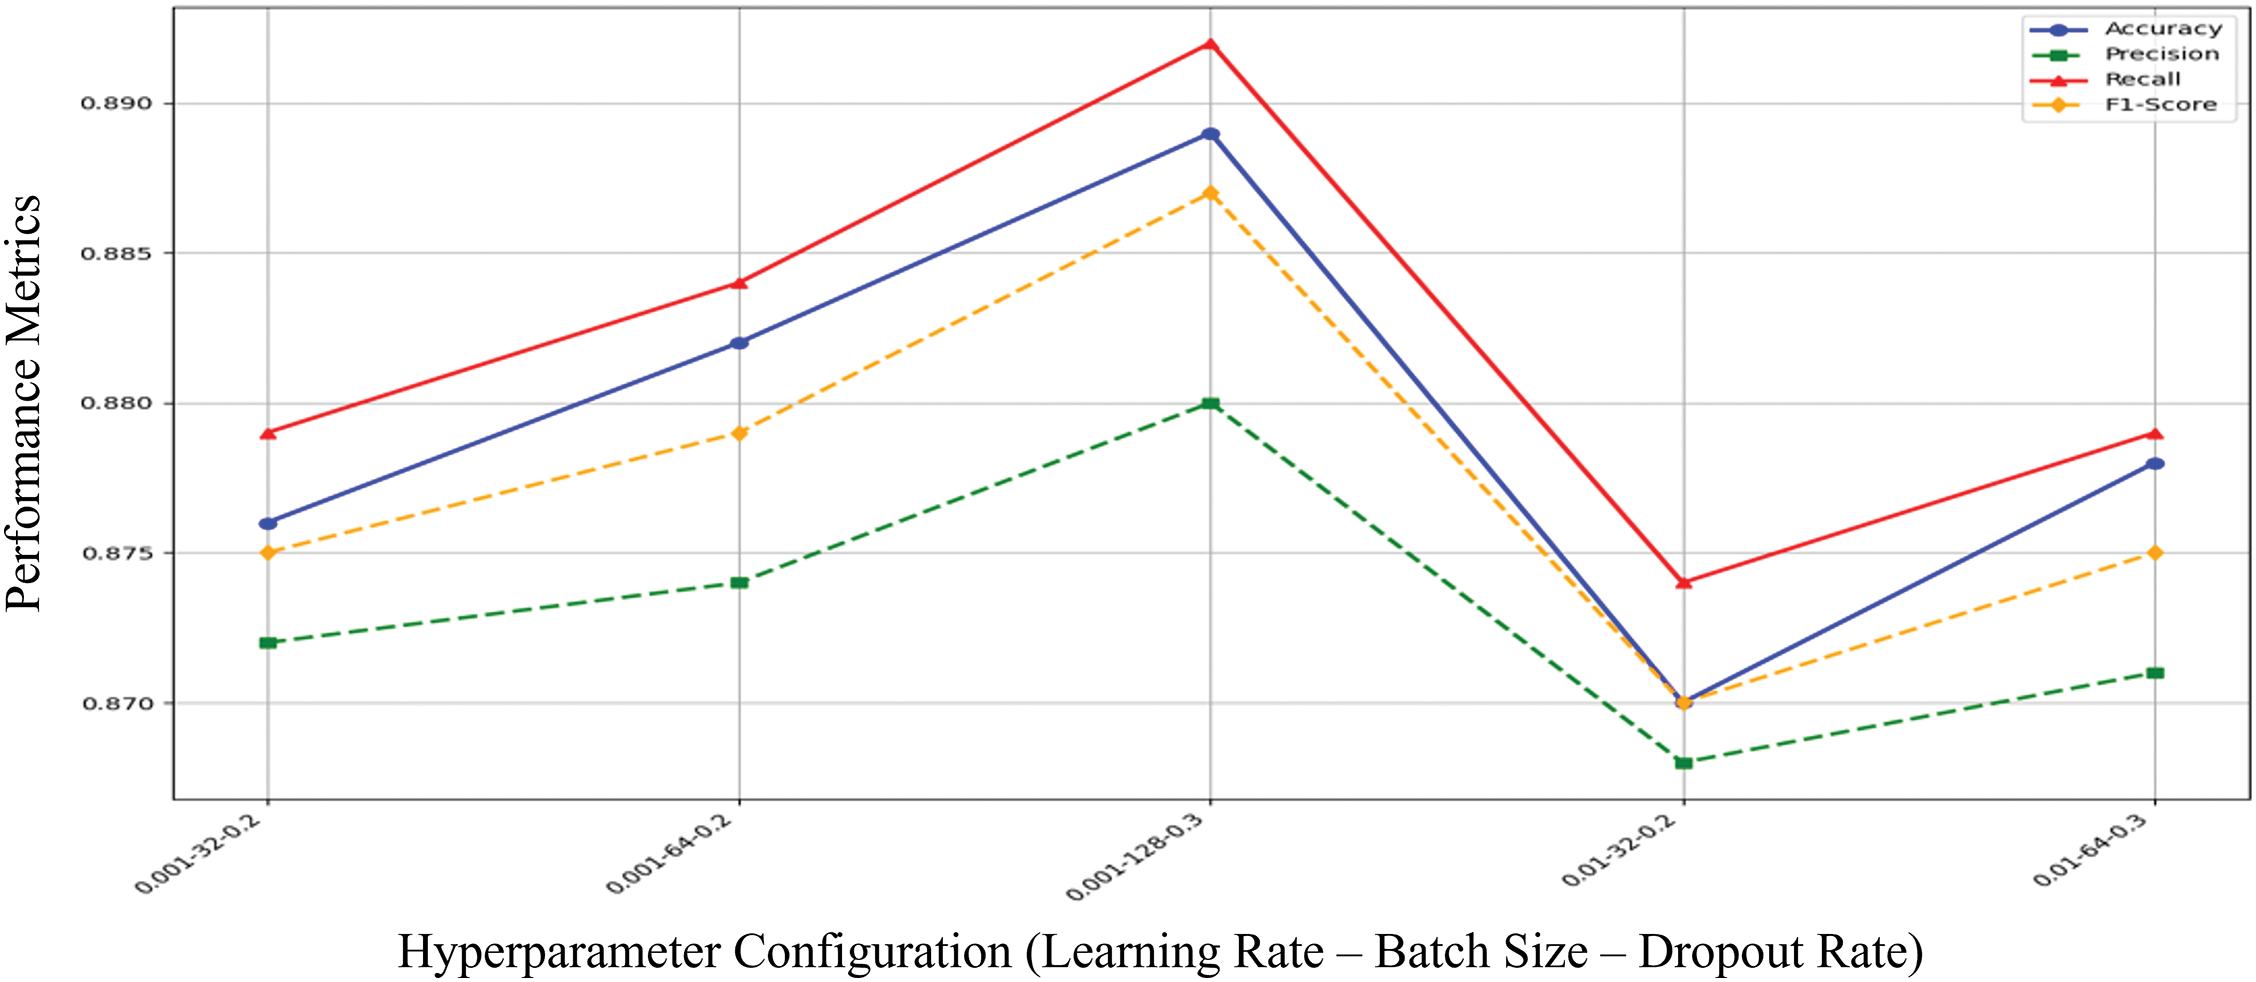
Figure 4: LSTM/GRU performances matrices across different hyperparameters
Table 6 details the model’s performance across various hyperparameter settings. The best results, with the highest accuracy and F1-score, are achieved using a learning rate of 0.001, batch size of 128, and a dropout rate of 0.3, highlighting the impact of hyperparameter tuning.
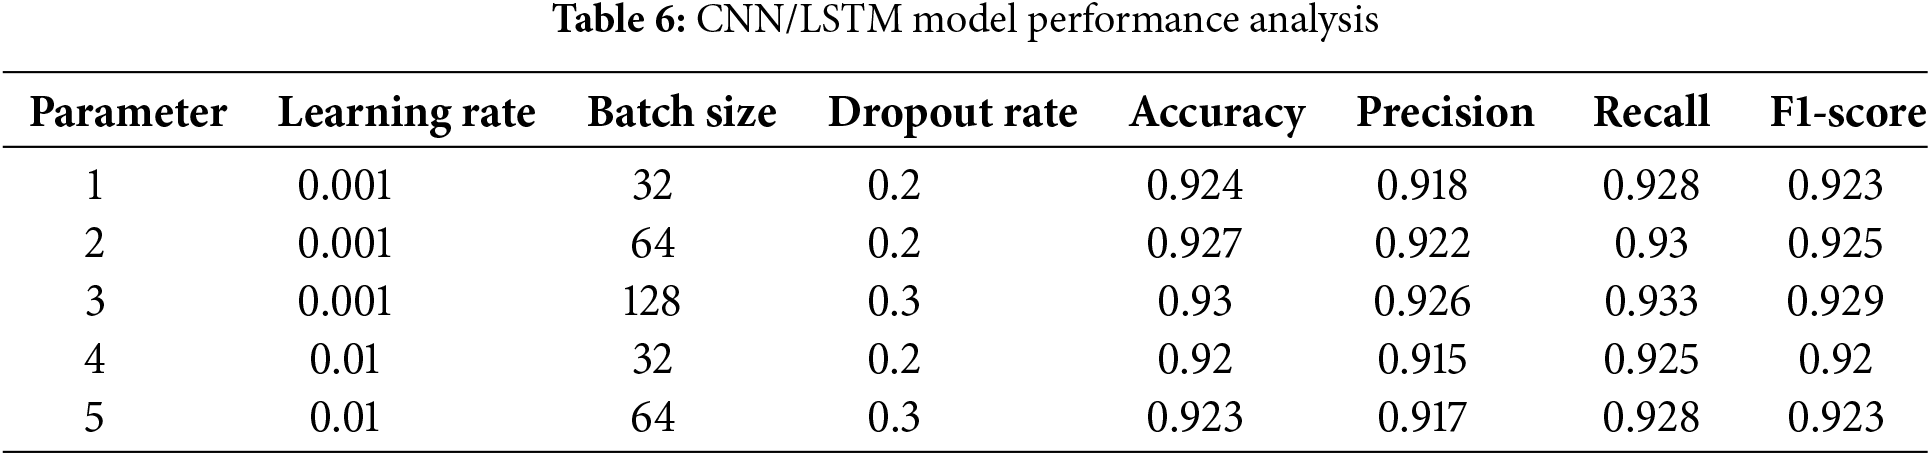
Fig. 5, illustrates how performance metrics, including accuracy, precision, recall, and F1-score, vary across different hyperparameter settings. The highest performance is observed with a learning rate of 0.001, batch size of 128, and a dropout rate of 0.3, particularly enhancing recall and accuracy.
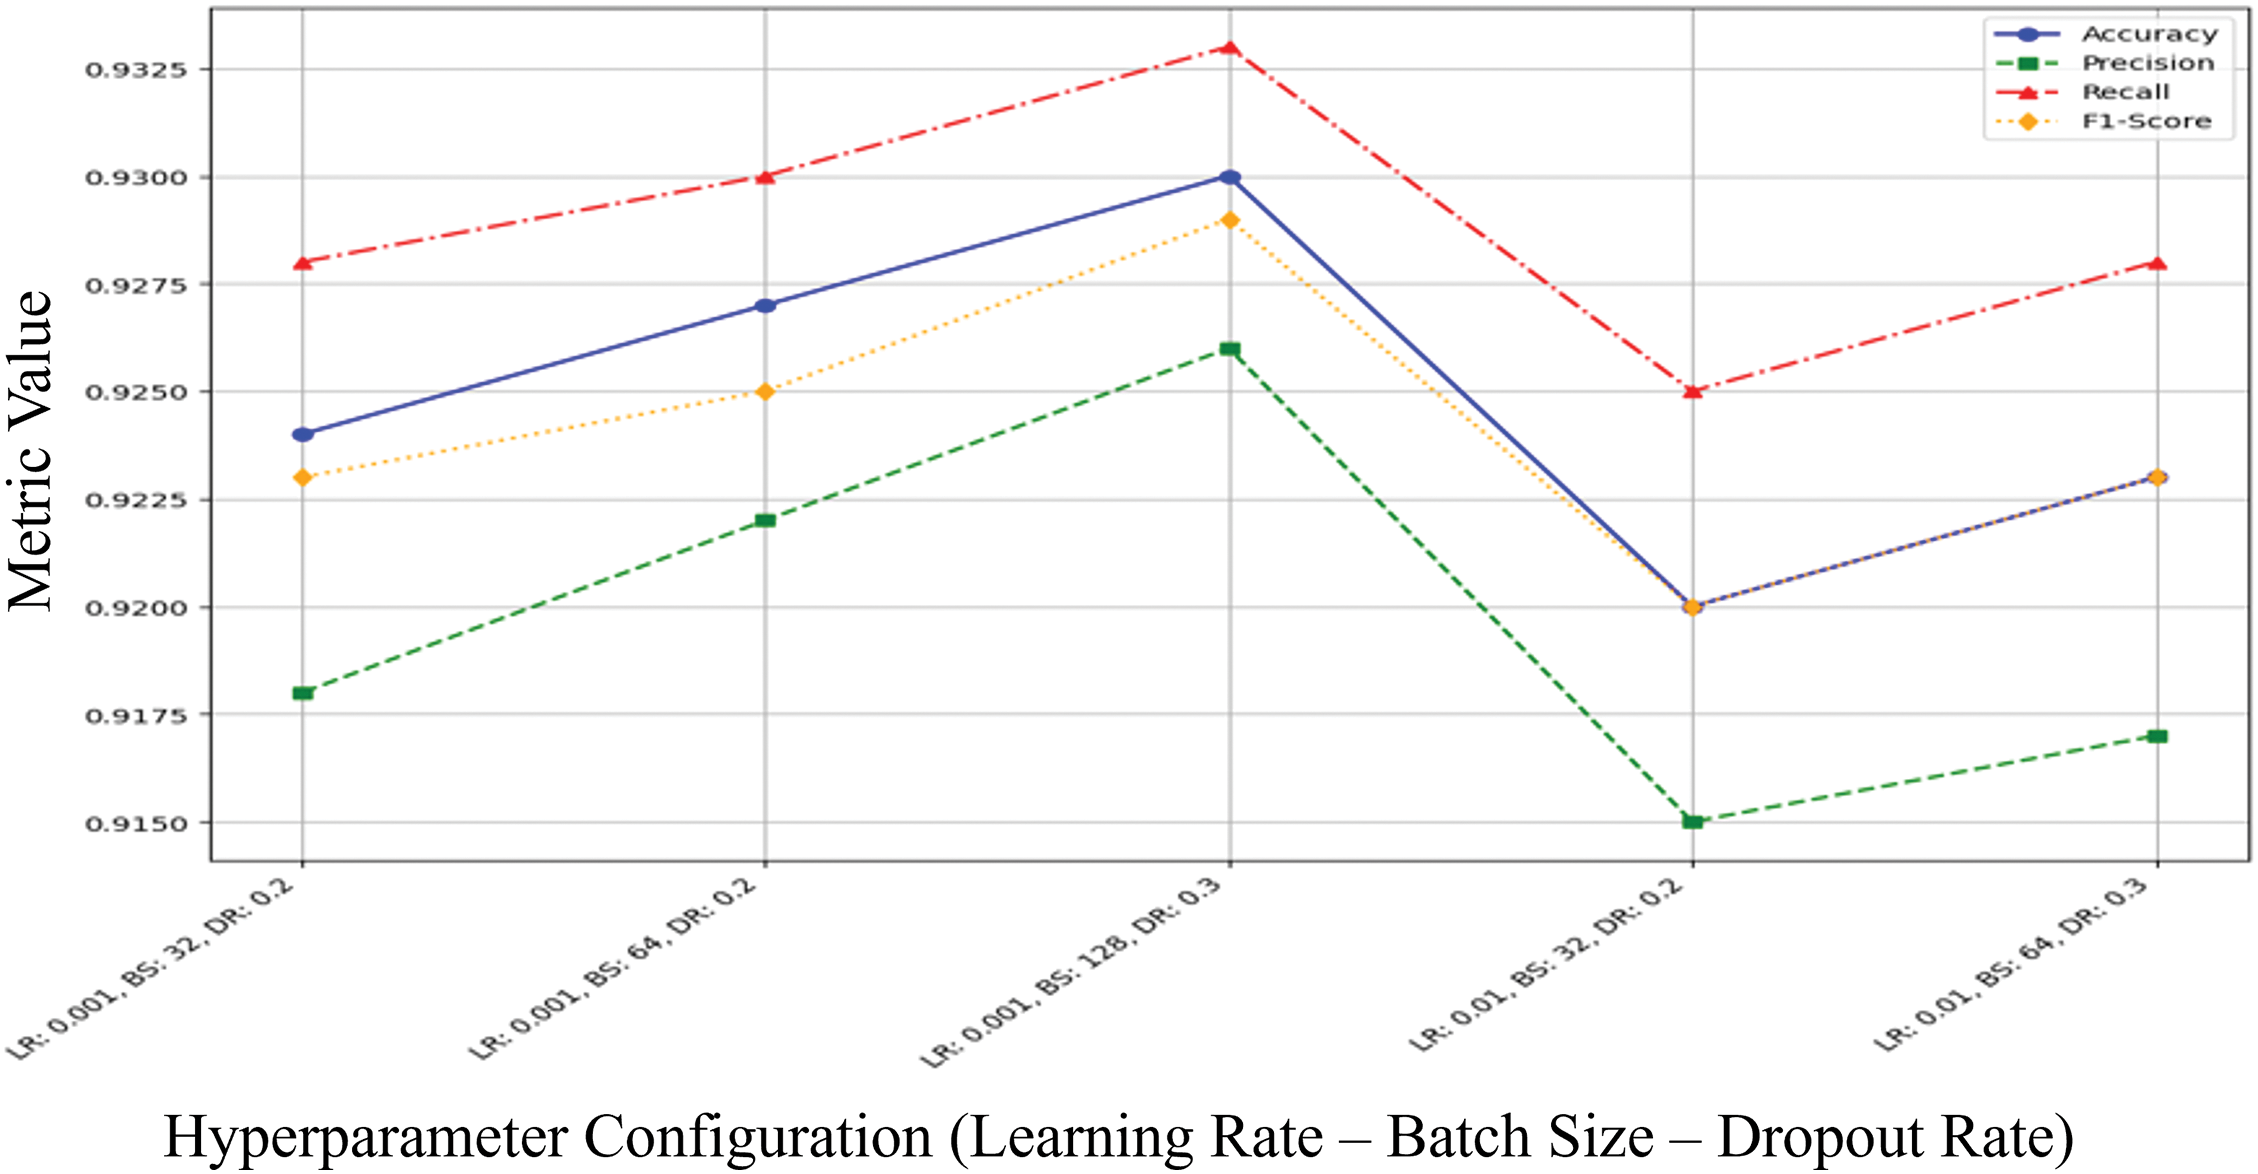
Figure 5: CNN/LSTM performances matrices across different hyperparameters
For all combinations of hyperparameters, error metrics (i.e., MAE, MSE, RMSE) are shown in Table 7. The model has the smallest errors (i.e., MAE and MSE in particular) with a learning rate of 0.001 and batch size of 128, which is also better in performance.
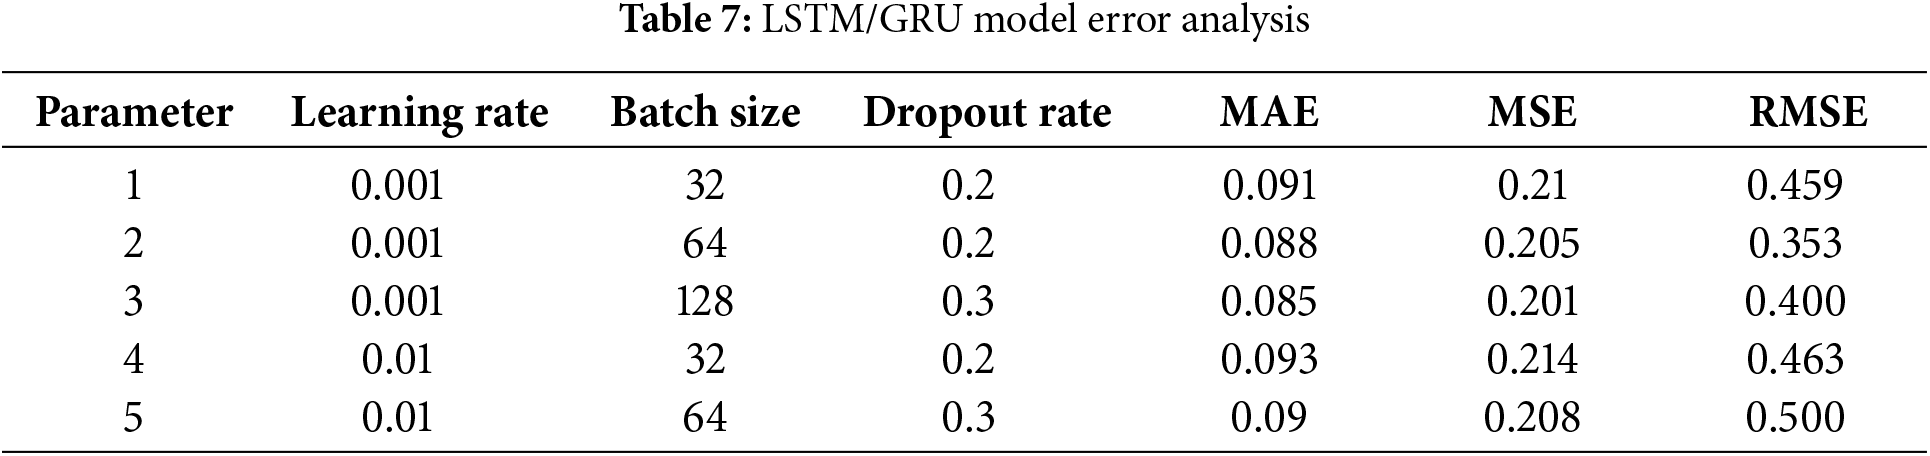
Fig. 6 compares the error metrics (MAE, MSE, RMSE) across different hyperparameter configurations. The model with a learning rate of 0.001 and batch size of 64 achieves the lowest RMSE, indicating better prediction accuracy in this setting.
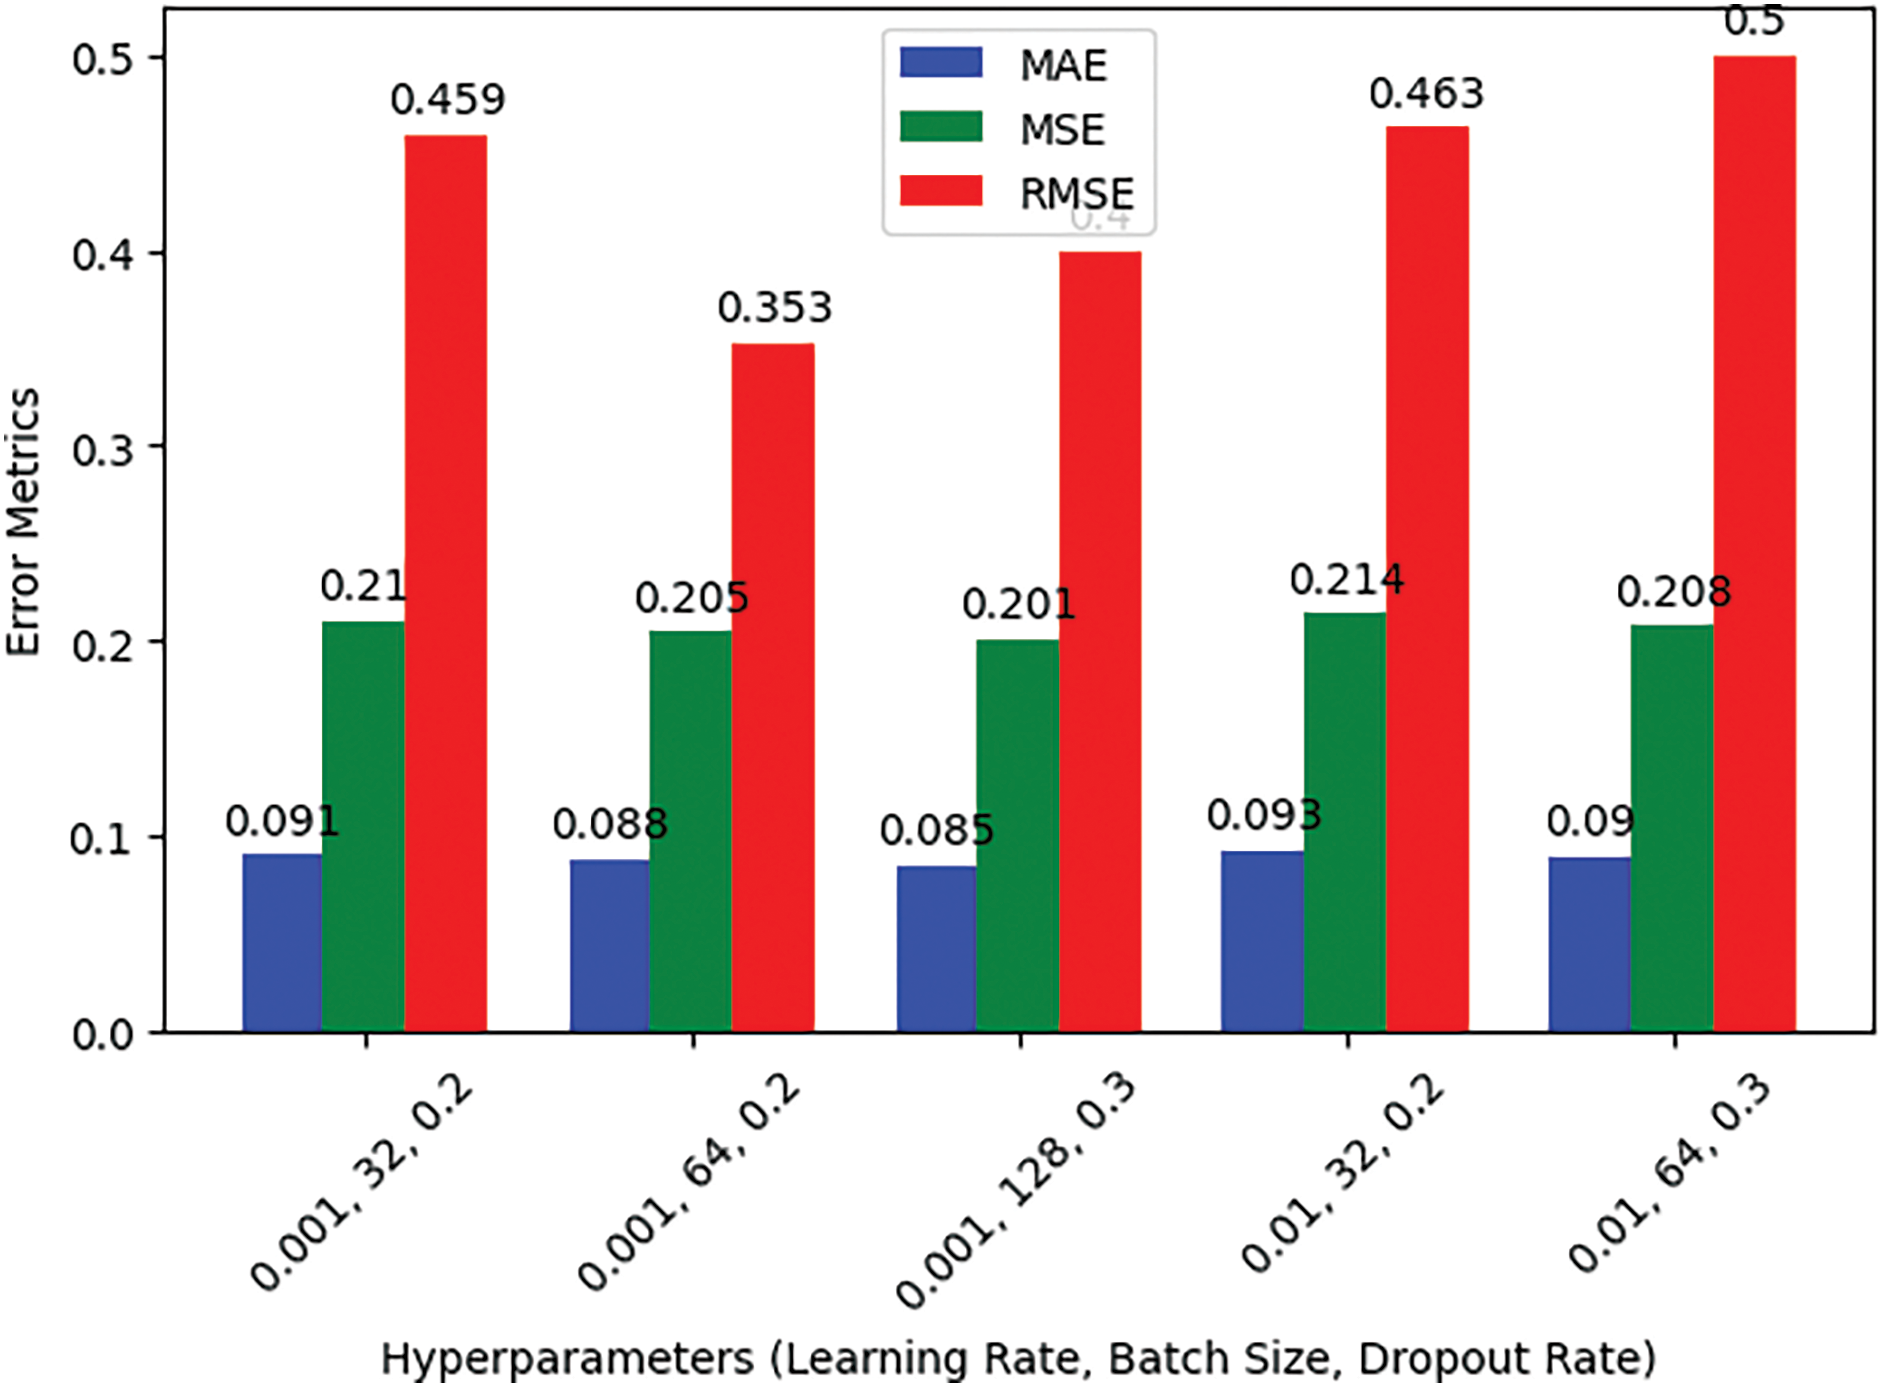
Figure 6: LSTM/GRU error matrices across different hyperparameters
Table 8 shows the error metric (i.e., MAE, MSE, RMSE) for different hyperparameter values. The lowest error rates are observed with a learning rate of 0.001 and batch size of 128, meaning that it is the best model configuration for this configuration.
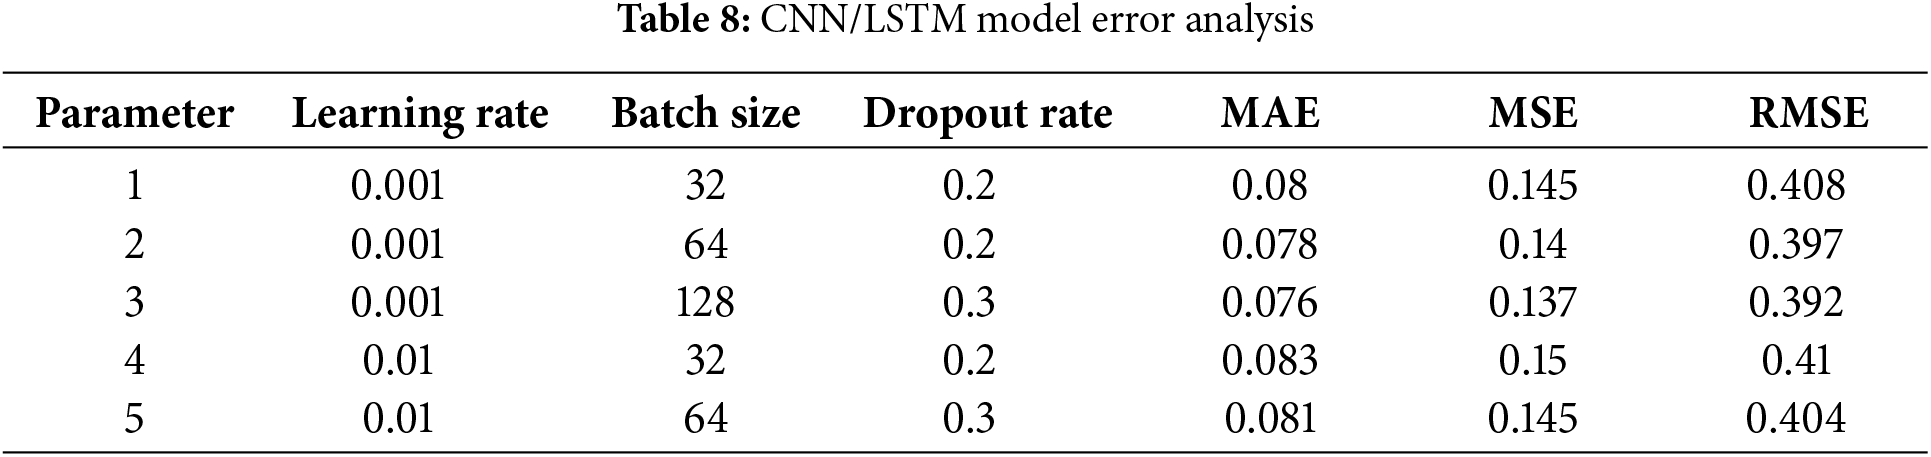
Fig. 7 illustrates error metrics (MAE, MSE, RMSE) across different hyperparameter settings. The lowest RMSE is achieved with a learning rate of 0.001 and a batch size of 128, indicating the best performance for this configuration.
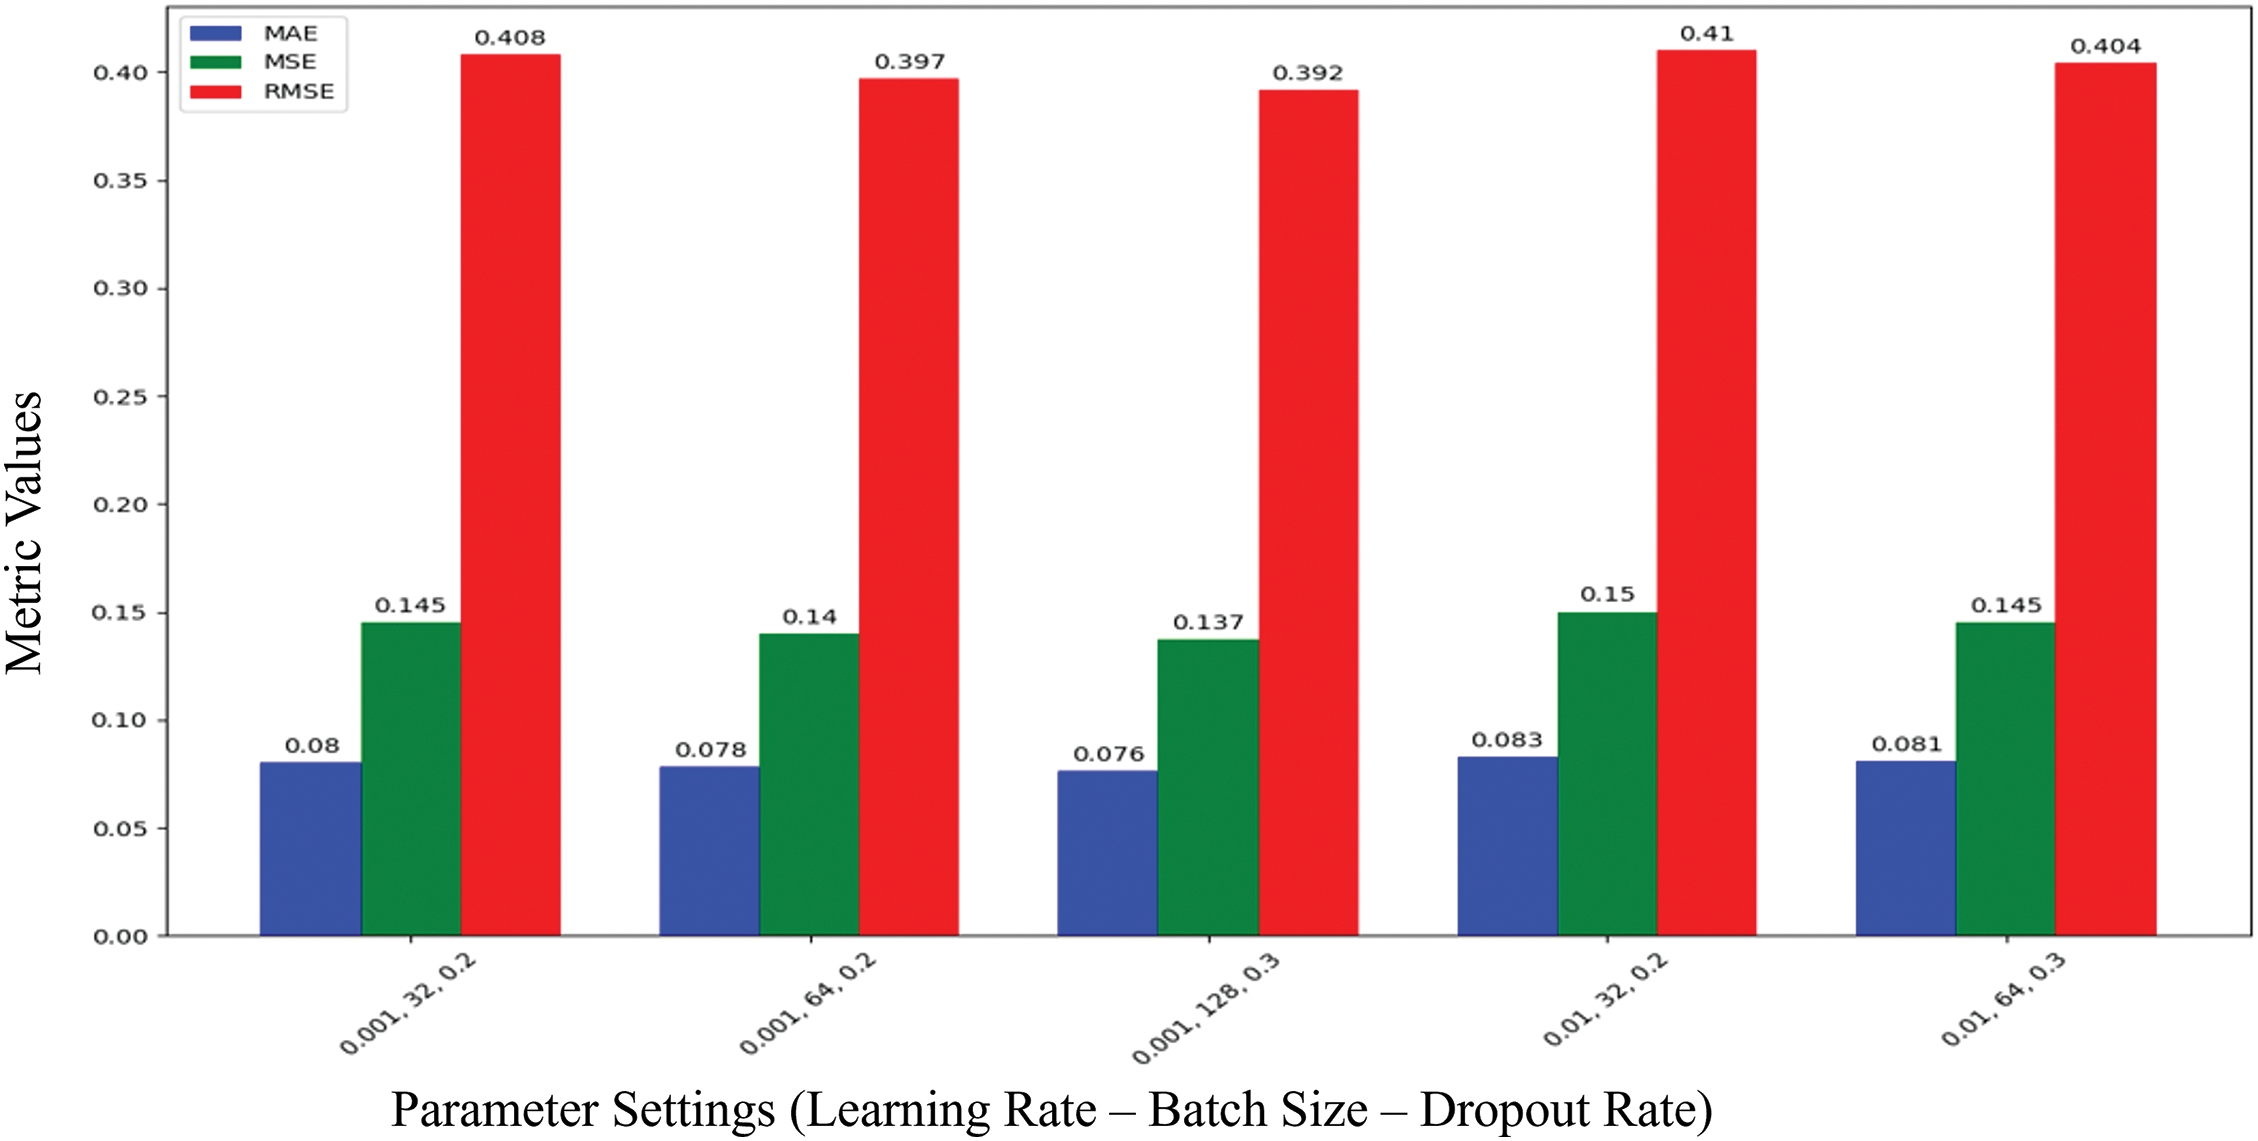
Figure 7: CNN/LSTM error matrices across different hyperparameters
5.2 Impact of Learning Rate on Performance and Error Matrices on Models
The evaluation of the LSTM/GRU and CNN/LSTM models was done under several hyperparameters, such as learning rate, batch size, and dropout rate, to gauge their impact on performance metrics including accuracy, precision, recall, and F1-score as illustrated in Fig. 8. Lowering the learning rate to 0.001 considerably enhances the performance of both models, particularly boosting accuracy and F1-score. Higher learning rates, such as 0.1, generated early convergence, adversely lowering the models’ performance. Its CNN/LSTM model achieved optimal performance with a batch size of 128, suggesting that greater batch sizes can boost precision and accuracy. Conversely, smaller batch sizes like 32 introduced more noise during training, which marginally decreased the model’s efficiency. Regarding regularization, a dropout rate of 0.2 was discovered to be ideal, limiting overfitting while preserving high levels of precision and recall. In contrast, a greater dropout rate of 0.5 degraded performance, especially for the LSTM/GRU model, by limiting its ability to store essential information.
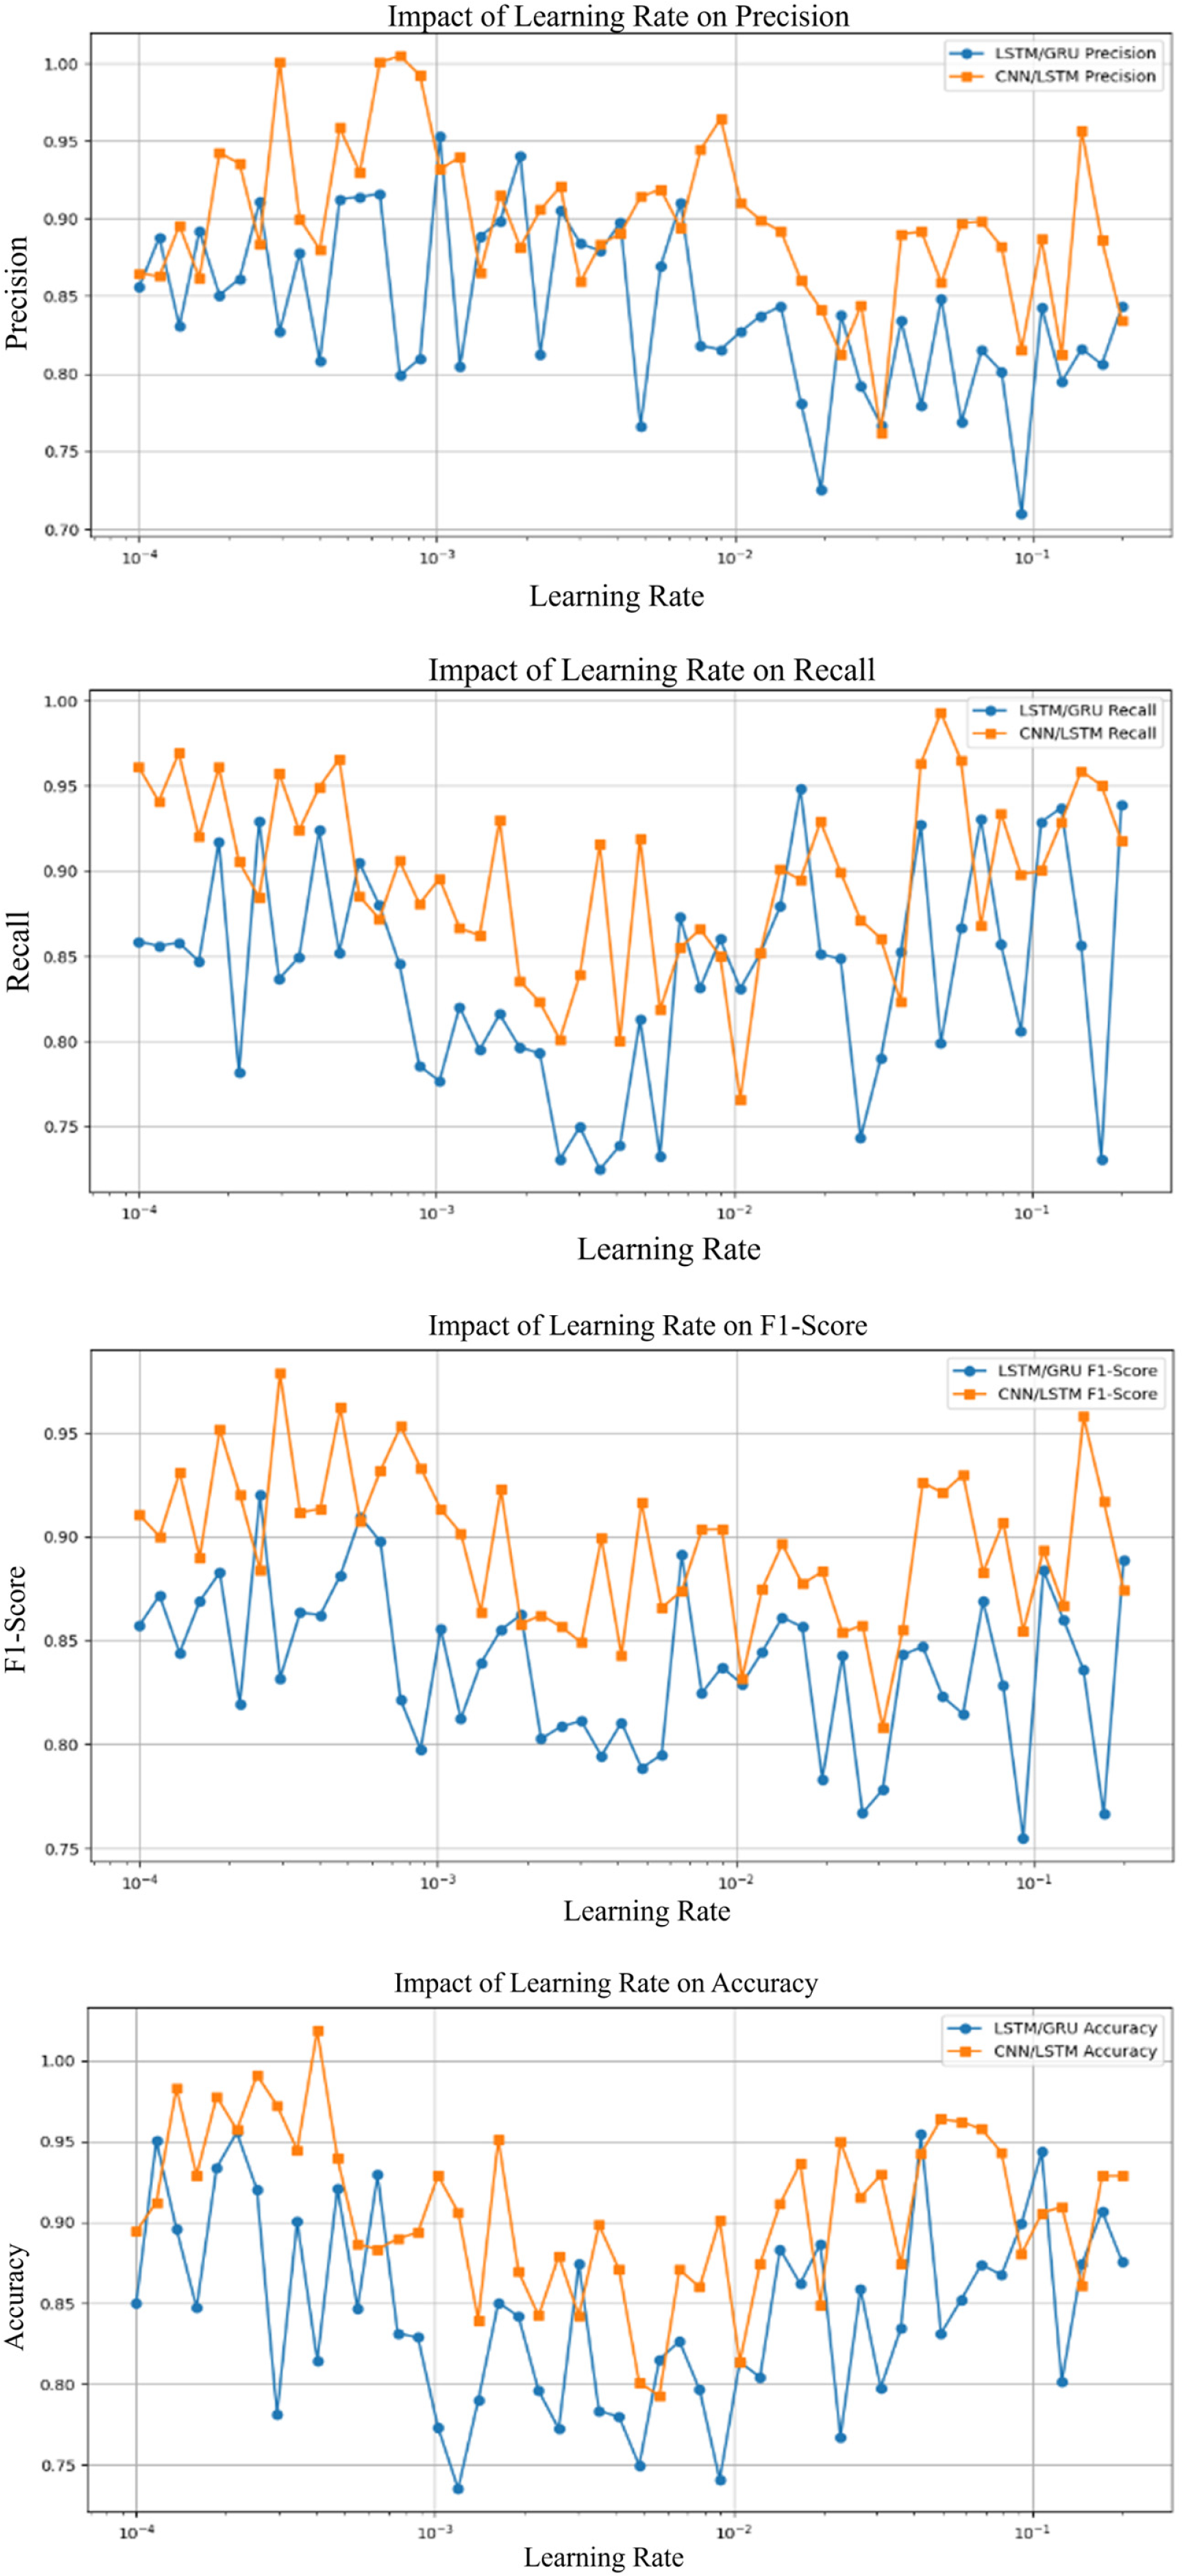
Figure 8: Performances matrices of learning rate
The learning rate greatly influences the error metrics, including MAE, MSE, and RMSE as shown in Fig. 9. A lower learning rate of 0.001 consistently resulted in the lowest error values for both LSTM/GRU and CNN/LSTM models. Increasing the learning rate to 0.1 generated a substantial surge in error values, indicating less stable learning and probably overfitting. Across all learning rates, the CNN/LSTM model preserved fewer errors, demonstrating higher performance at reduced learning rates compared to LSTM/GRU.
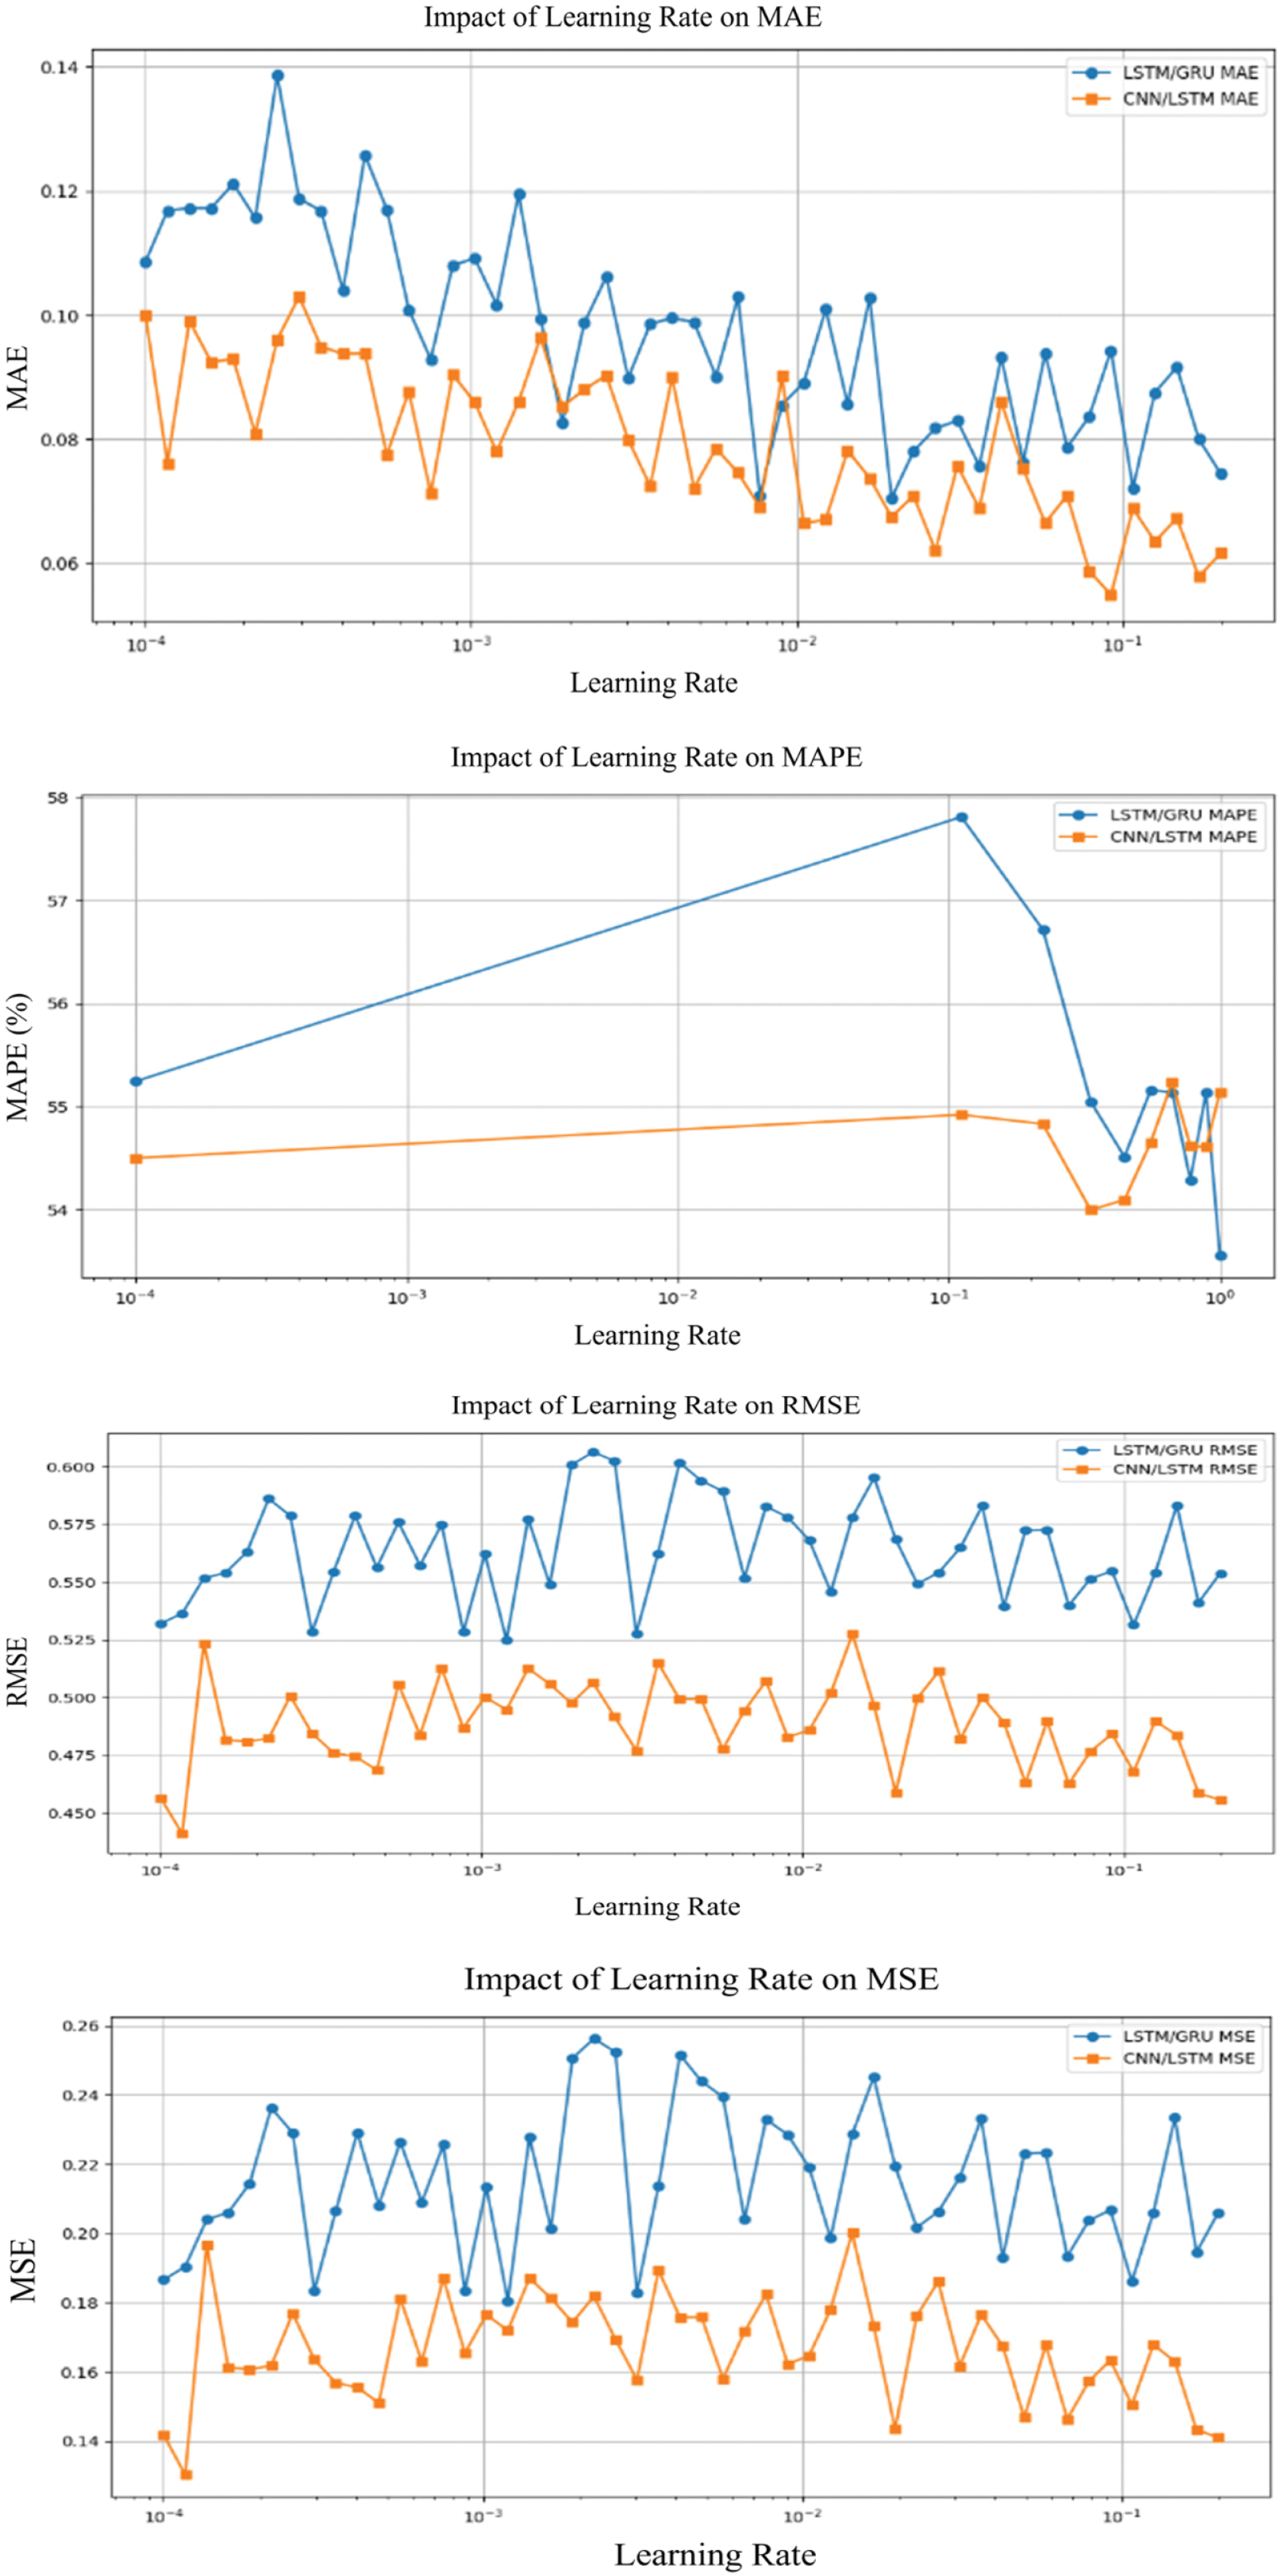
Figure 9: Error matrices of learning rate
5.3 Impact of Batch Size on Performance and Error Matrices on Models
Fig. 10 illustrates how different batch sizes affect the performance of LSTM/GRU and CNN/LSTM. Larger batch sizes, particularly 128, result in improved Accuracy and F1-score for both models, with CNN/LSTM displaying more consistent performance across varying batch sizes. We can observe that CNN/LSTM consistently outperforms LSTM/GRU across different batch sizes. CNN/LSTM achieves higher precision, recall, accuracy, and F1-score, especially with larger batch sizes. Its performance remains more stable, highlighting better classification, true positive capture, and overall effectiveness compared to LSTM/GRU.
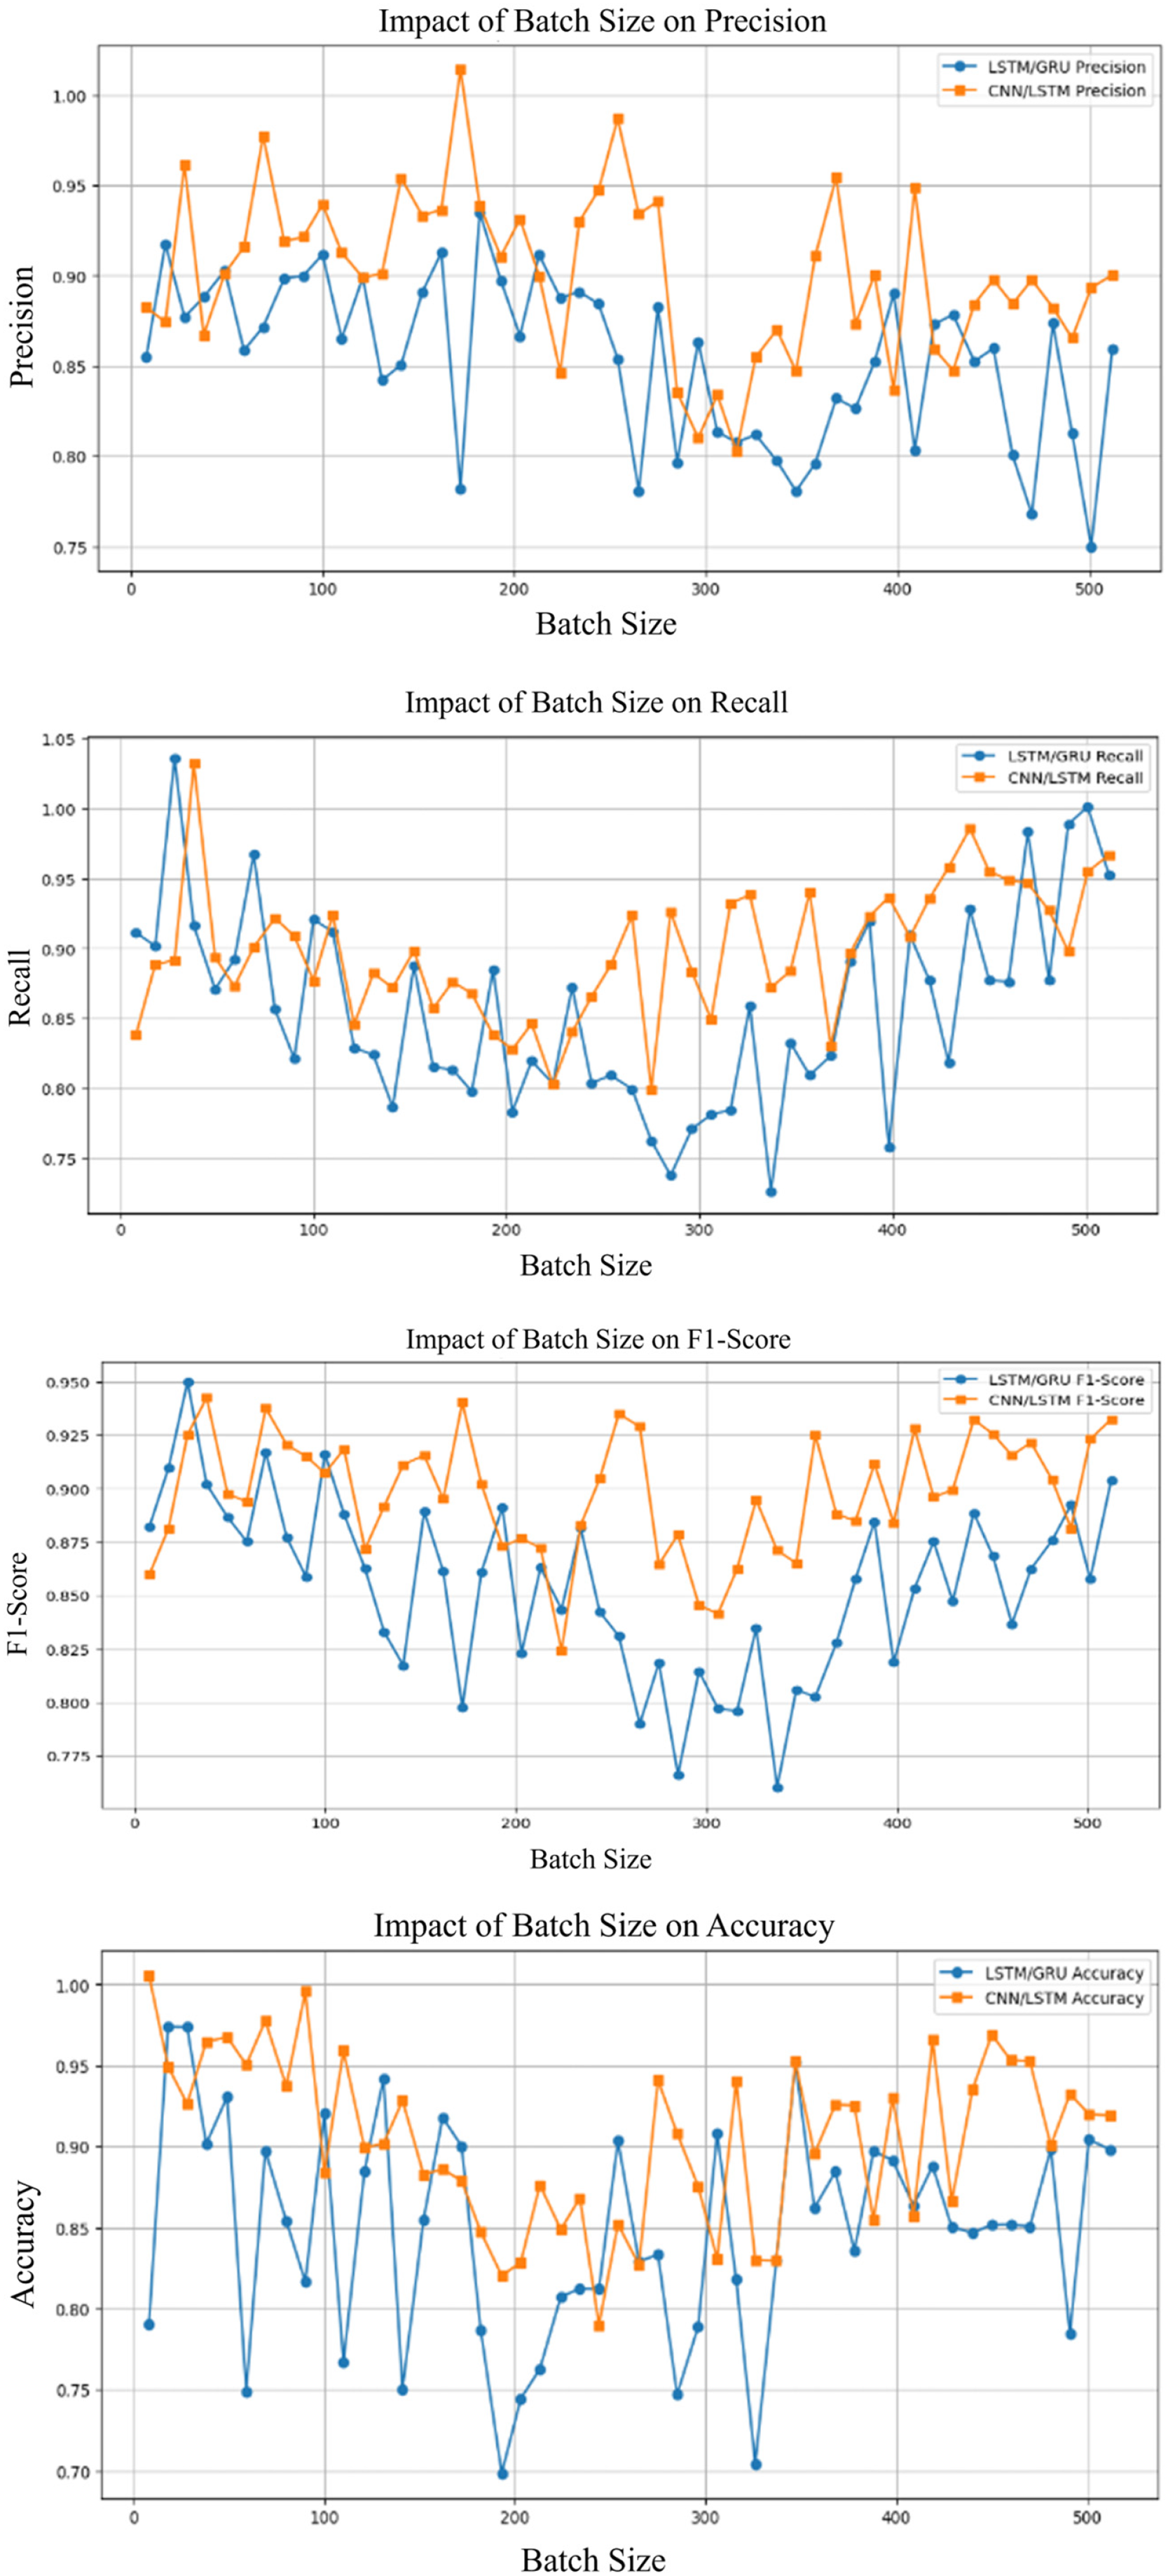
Figure 10: Performances matrices of batch size
Batch size considerably influences error metrics such as MAE, MSE, and RMSE as shown in Fig. 11. Larger batch sizes, such as 128, lead to lower error values for both models, particularly CNN/LSTM, due to more consistent updates. In contrast, smaller batch sizes, like 32, contribute to more mistakes because of noisier weight updates during training, which impairs model stability and accuracy.
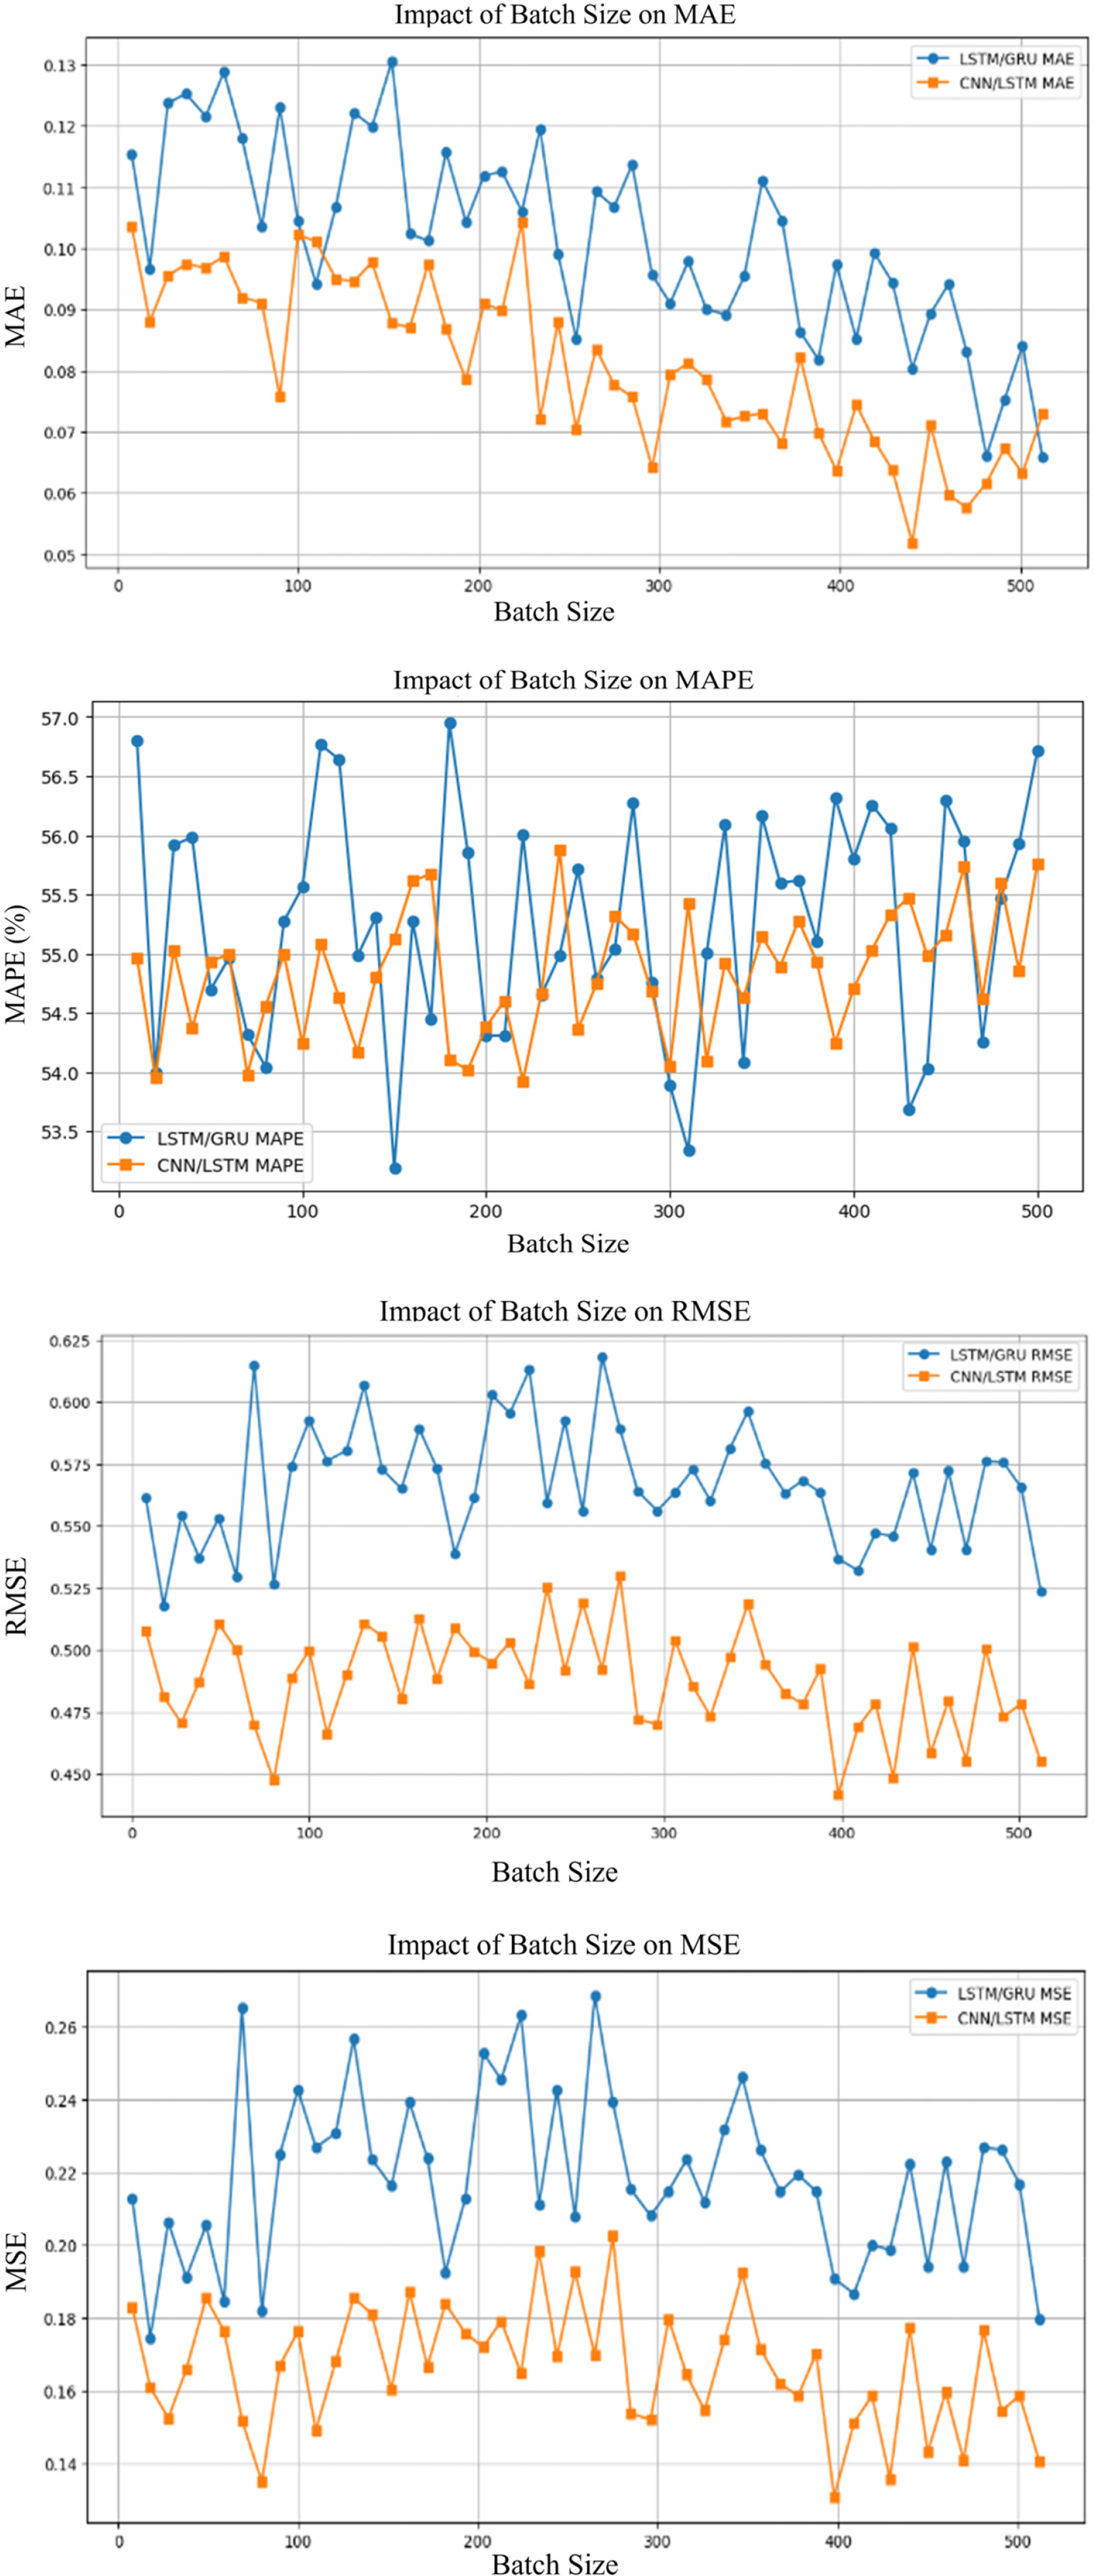
Figure 11: Error matrices of batch size
5.4 Impact of Dropout Rate on Performance and Error Matrices on Models
Fig. 12 demonstrates the impact of various dropout rates on LSTM/GRU and CNN/LSTM models. A 0.2 dropout rate delivers the best performance concerning Accuracy and F1-score, with bigger dropout rates, like 0.5, showing a reduction in both models’ performance. The effect of varying dropout rates on the efficiency of LSTM/GRU and CNN/LSTM models exhibits diverse patterns. CNN/LSTM displays more variability in precision, recall, accuracy, and F1-score compared to LSTM/GRU [37]. For precision, CNN/LSTM peaks around 70%, while LSTM/GRU remains constantly lower around 50%. In terms of memory, both models oscillate, while CNN/LSTM shows more severe increases. Accuracy and F1-score for CNN/LSTM rapidly increase for dropout rates of 0.20 and 0.50 and these results suggest that CNN/LSTM is more responsive to changes in dropout rates than LSTM/GRU, especially benefiting from specific dropout settings.
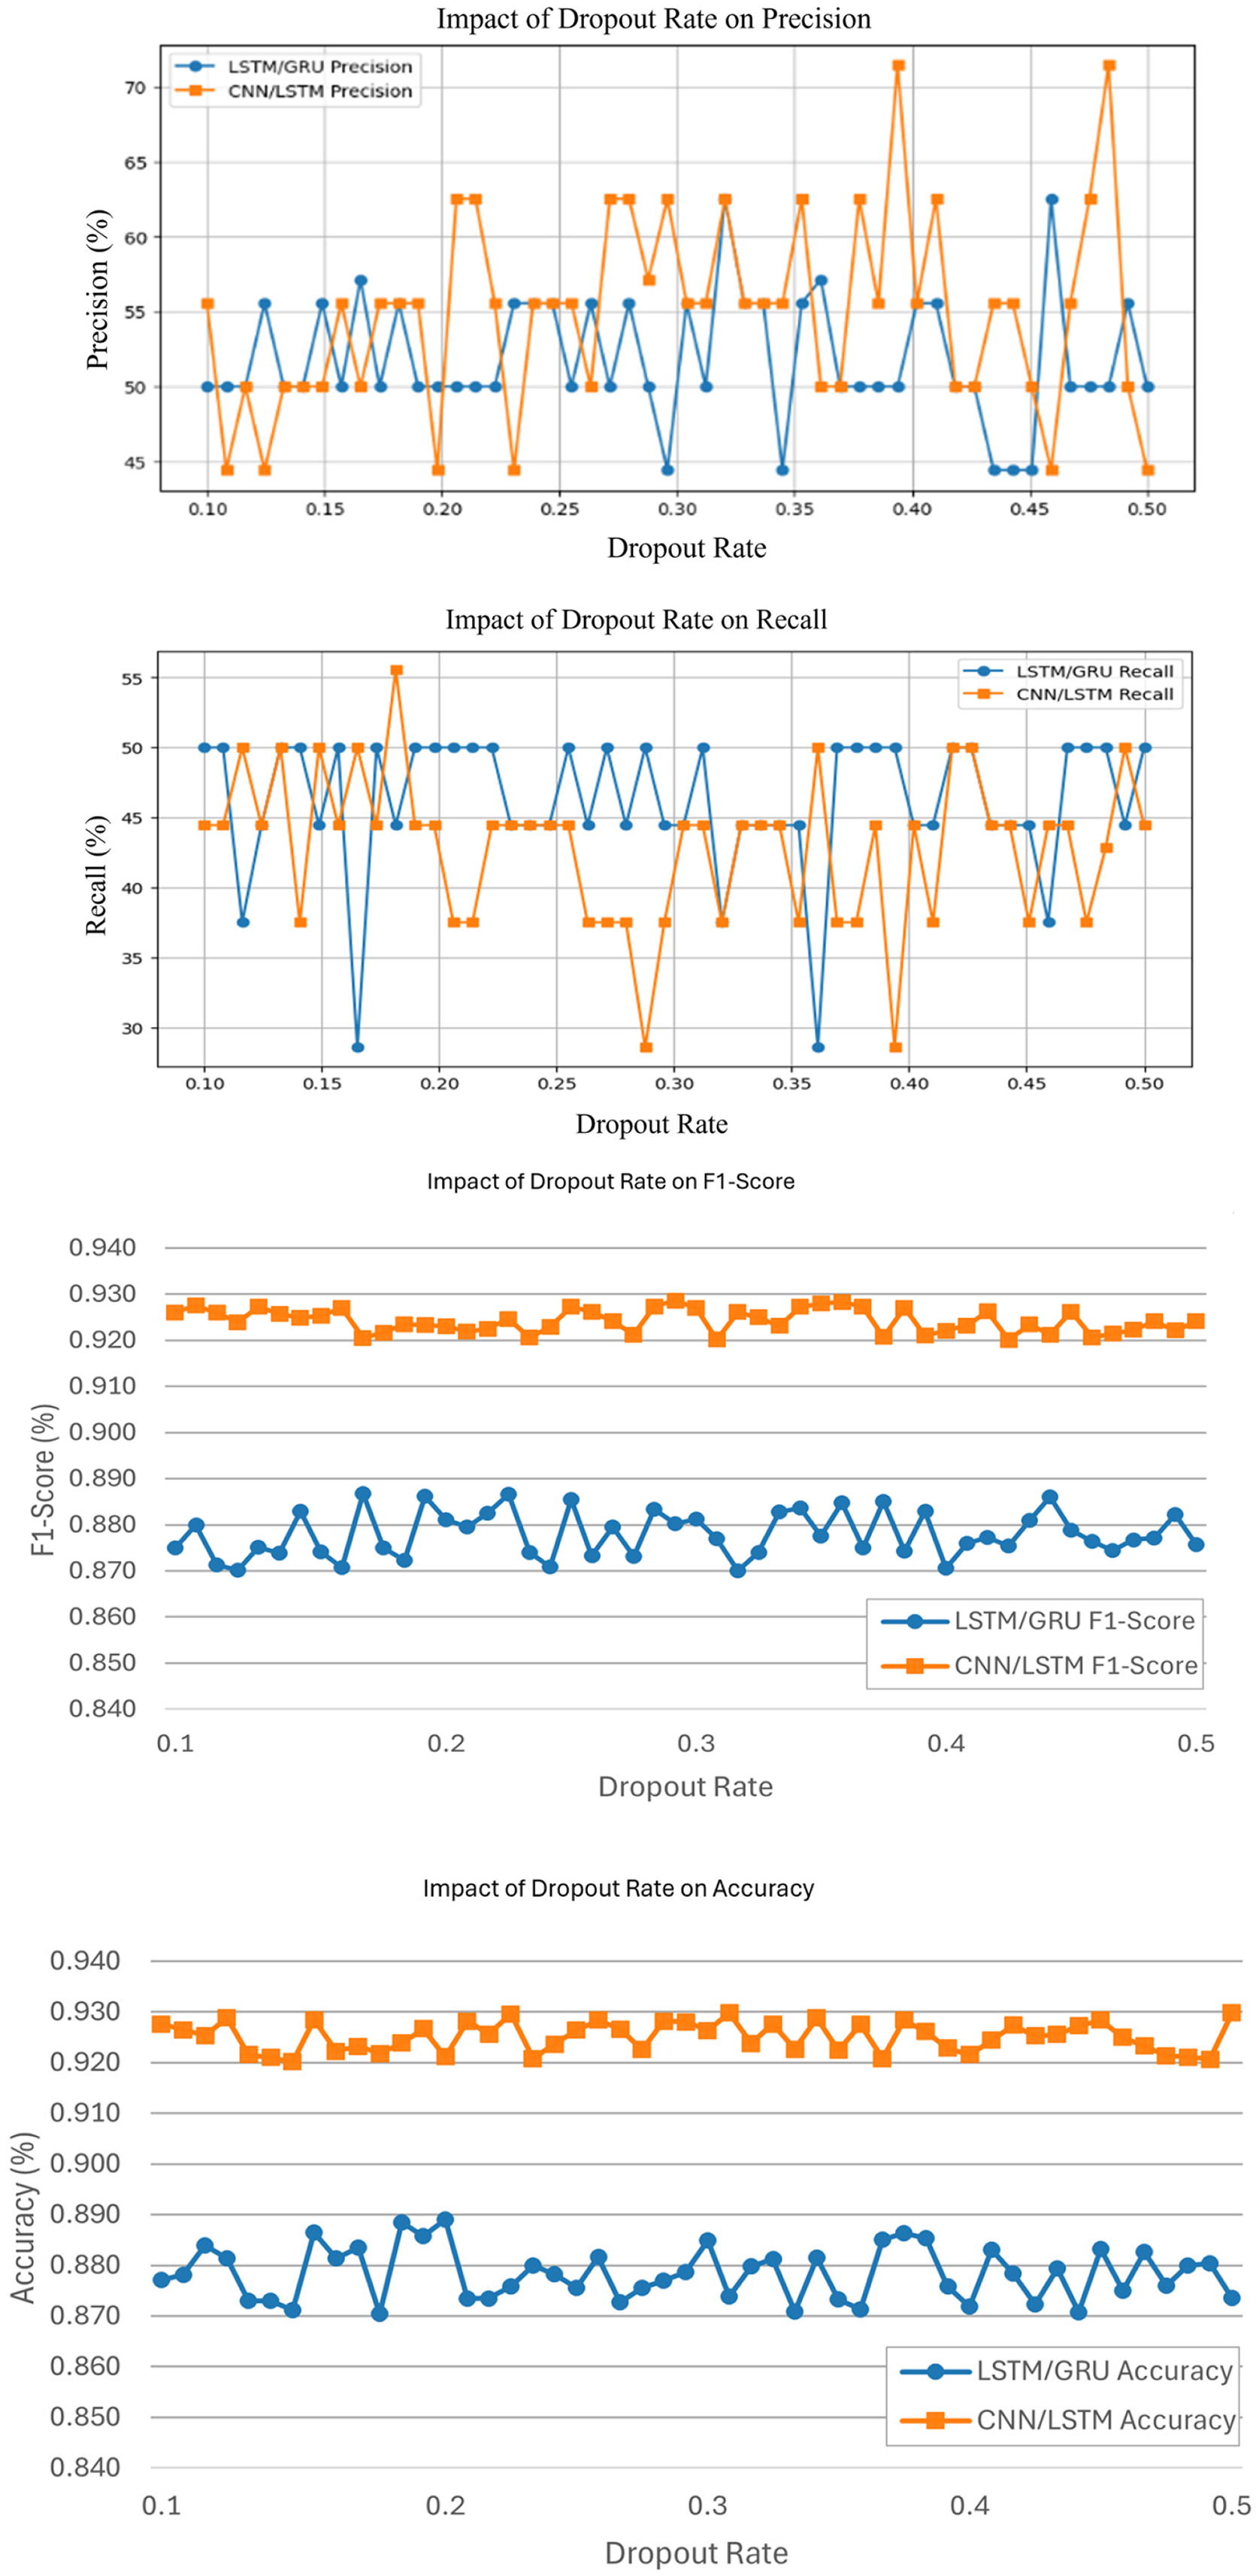
Figure 12: Performances matrices of dropout rate
As illustrated in Fig. 13, a 0.2 dropout rate minimized errors in both LSTM/GRU and CNN/LSTM models, combining regularization and learning. More dropout rates, like 0.5, increased MAE, MSE, and RMSE, resulting in more errors due to excessive regularization.
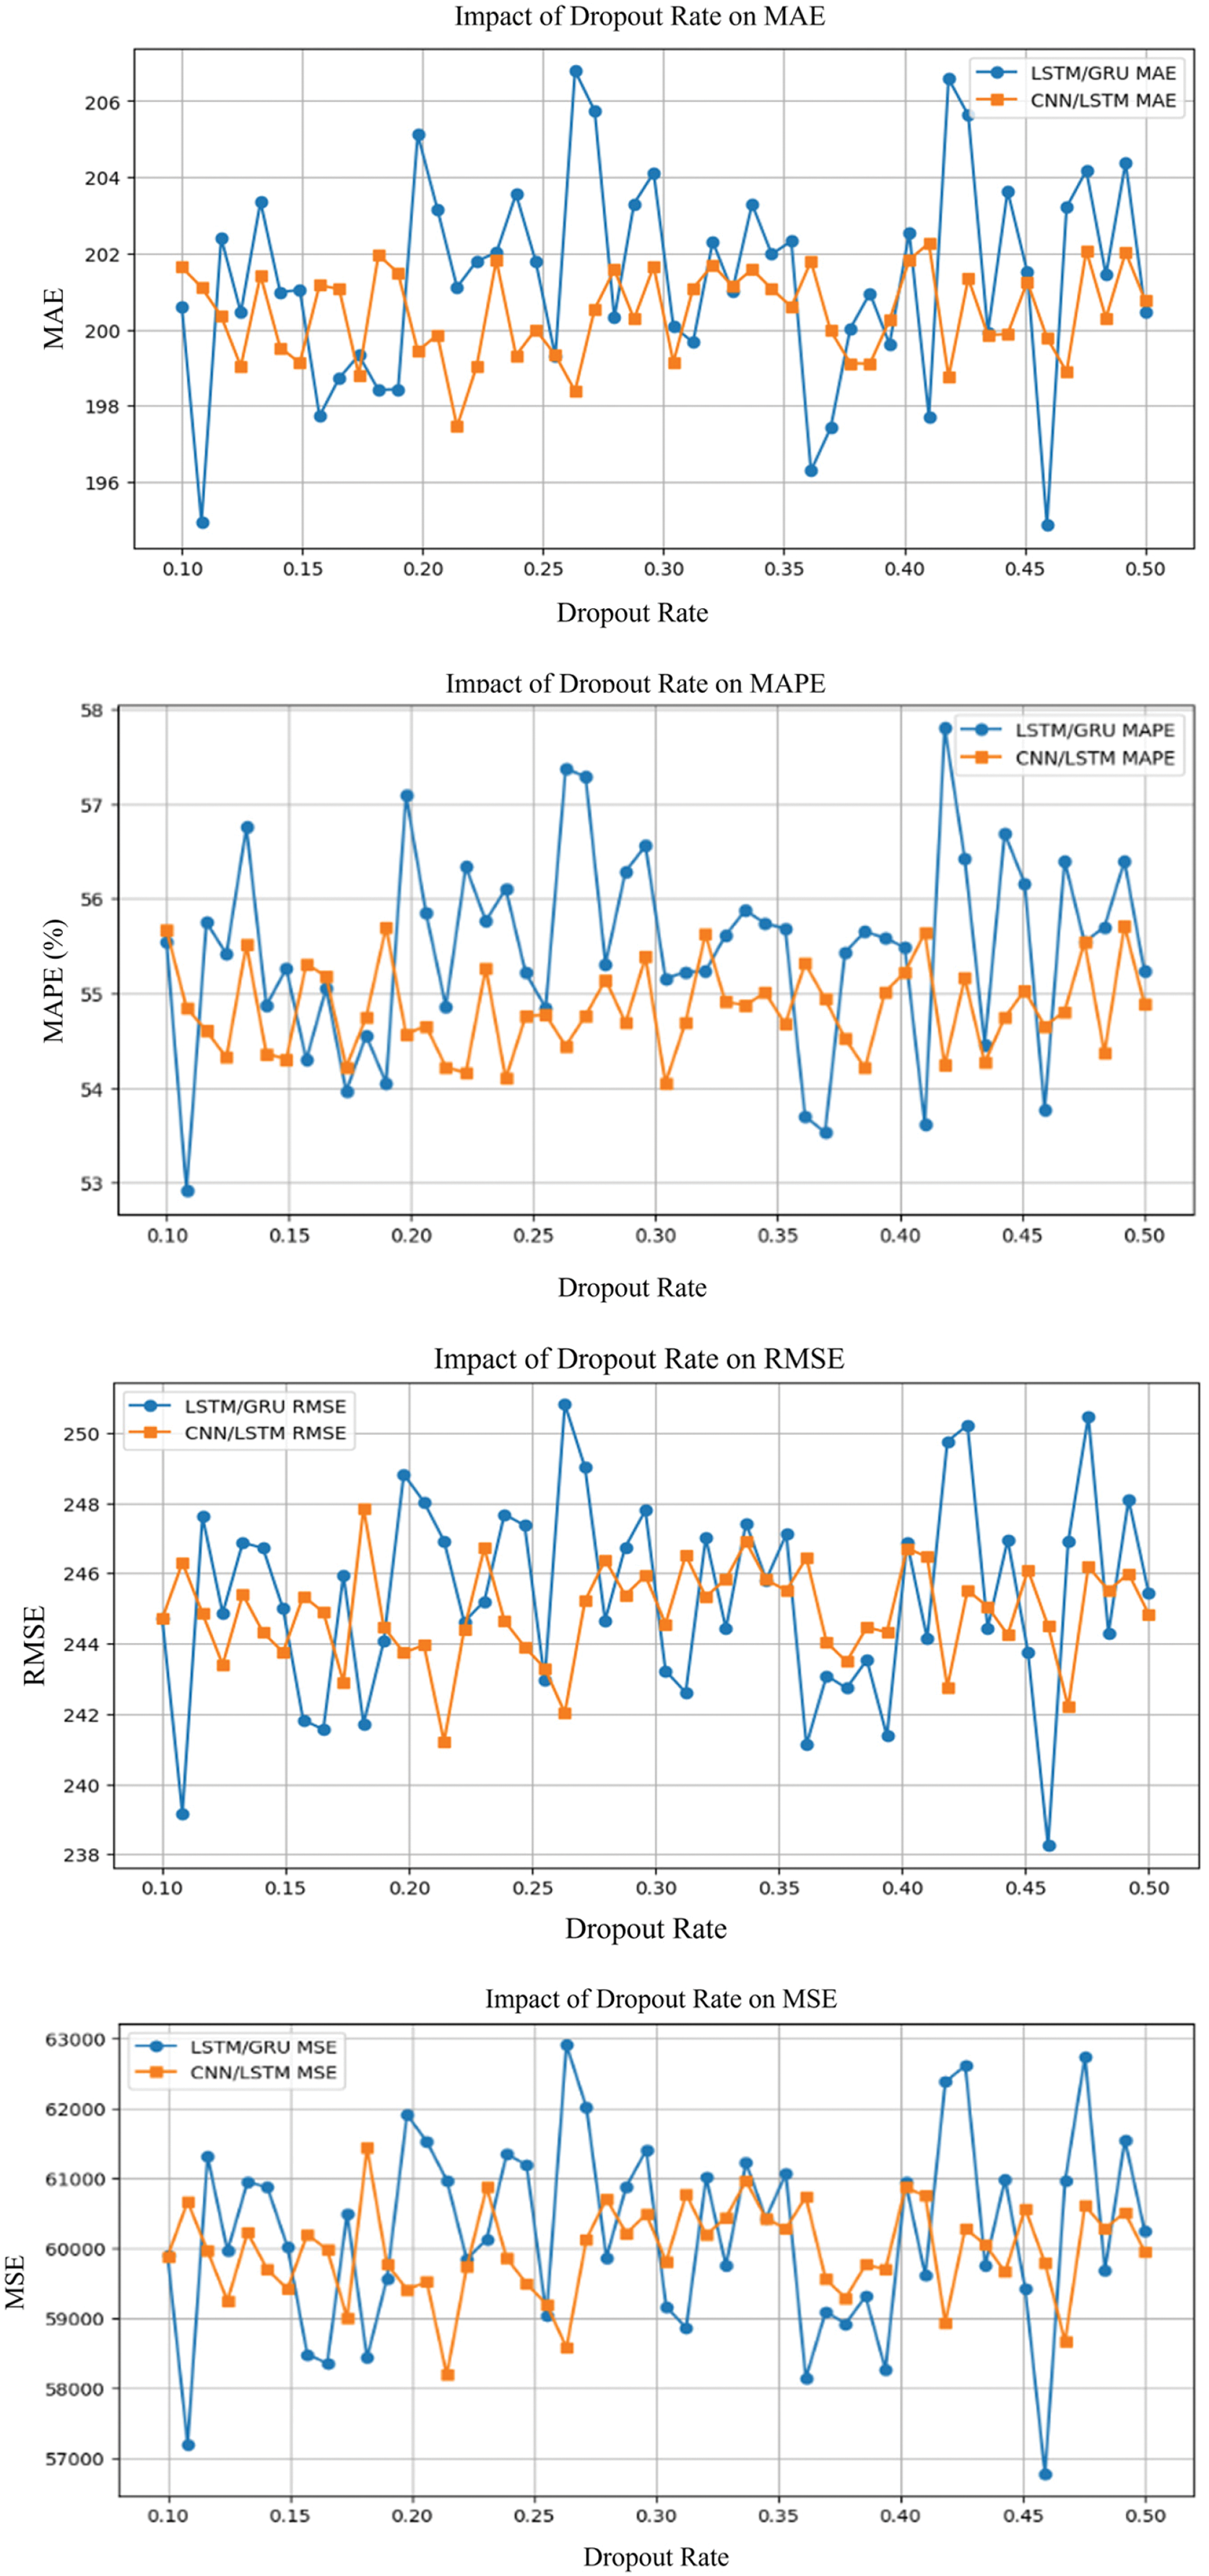
Figure 13: Error matrices of dropout rate
The comparison of the LSTM/GRU and CNN/LSTM model shows that CNN/LSTM has frequently over-performed LSTM/GRU in important performance areas including accuracy, precision, recall, and F1-score as shown in Table 9. This higher performance could be attributable to the CNN component’s excellent spatial feature extraction in part. Because it allows the later LSTM layers to perceive temporal dynamics more accurately. When false positives and false negatives elimination becomes crucial, the CNN/LSTM model is reliable and robust. Although LSTM/GRU has a high recall, in accuracy and error (MSE and RMSE) measurements it doesn’t quite match, implying that further improvements are needed when accuracy is of prime importance. This research also shows that selecting the right model architecture and tuning hyperparameters according to the requirements of the application environment is important. This is especially important in processes where dependability and accuracy are key.
The results of this detailed analysis demonstrate the efficiency of merging LSTM/GRU and CNN/LSTM architectures for anomaly detection with cloud functionality, in particular URL threats. This research points to the significance of hyperparameter tuning to improve the performance of DL models in removing class imbalances in cybersecurity. The experimental results demonstrably indicate that CNN/LSTM is superior to the LSTM/GRU model in terms of precision, recall, and F1-score based on its robustness to work with both spatial and sequential data. Crucially, the study describes and demonstrates the effectiveness of Focal Loss and class weighting to handle skewed distributions. Such methods are narrowly targeted at the minority class, hence enhancing anomaly detection and overfitting. Dynamic threshold tuning has also been found to optimize the correct ratio of precision and recall, a crucial parameter in real-time anomaly detection to detect false positives as effectively as possible. The analysis also provides insight into the optimal combination of the learning rate, batch size, and dropout rates where low learning rate and batch size are considered to stabilize training and increase generalization, while effective dropouts minimize overfitting risks.
This research work indicates the importance of more sophisticated DL strategies for enhancing cybersecurity defenses and points to future research areas like generalizing these models to other cyberattacks, integrating them with real-time data streaming services, and exploring new DL structures to improve anomaly detection performance. These models are promising but testing them on more real-world datasets or real network conditions will further test generalization capabilities. The next research should focus on adapting the models to new types of threats and adaptive learning techniques for changing attack trends. In summary, the paper significantly enriches our understanding of how DL can be customized to tackle specific challenges in cybersecurity, with a particular focus on detecting URL-based anomalies. These insights lay the groundwork for future studies and practical applications aimed at strengthening security measures critical for safeguarding digital infrastructures against sophisticated cyber threats. Our future research will focus on testing the recommended hybrid models on external datasets such as CIC-IDS2018 and UNSW-NB15 to analyze their flexibility in unanticipated traffic situations.
Acknowledgement: I express my gratitude to the anonymous reviewers for their comments and suggestions which have greatly helped me to improve the content, quality, organization, and presentation of this work.
Funding Statement: There is no funding support for this work.
Availability of Data and Materials: The data that support the findings of this study are available from the corresponding author, A.N., upon reasonable request.
Ethics Approval: Not applicable.
Conflicts of Interest: The author declares no conflicts of interest to report regarding the present study.
References
1. Christy Eunaicy JI, Suguna S. Web attack detection using deep learning models. Mater Today Proc. 2022;62(2):4806–13. doi:10.1016/j.matpr.2022.03.348. [Google Scholar] [CrossRef]
2. Ren S, He K, Girshick R, Sun J. Faster R-CNN: towards real-time object detection with region proposal networks. IEEE Trans Pattern Anal Mach Intell. 2017;39(6):1137–49. doi:10.1109/TPAMI.2016.2577031. [Google Scholar] [PubMed] [CrossRef]
3. García VH, Monroy R, Quintana M. Web attack detection using ID3. In: Professional practice in artificial intelligence. Boston, MA, USA: Springer US; 2006. p. 323–32. doi:10.1007/978-0-387-34749-3_34. [Google Scholar] [CrossRef]
4. Luo C, Tan Z, Min G, Gan J, Shi W, Tian Z. A novel web attack detection system for Internet of Things via ensemble classification. IEEE Trans Ind Inform. 2021;17(8):5810–8. doi:10.1109/TII.2020.3038761. [Google Scholar] [CrossRef]
5. Zhou C, Paffenroth RC, Zhou C, Paffenroth RC. Anomaly detection with robust deep autoencoders. In: Proceedings of the 23rd ACM SIGKDD International Conference on Knowledge Discovery and Data Mining; 2017 Aug 13–17; Halifax, NS, Canada: ACM. p. 665–74. doi:10.1145/3097983.3098052. [Google Scholar] [CrossRef]
6. Tekerek A. A novel architecture for web-based attack detection using convolutional neural network. Comput Secur. 2021;100(2):102096. doi:10.1016/j.cose.2020.102096. [Google Scholar] [CrossRef]
7. Gong X, Lu J, Wang Y, Qiu H, He R, Qiu M. CECoR-net: a character-level neural network model for web attack detection. In: 2019 IEEE International Conference on Smart Cloud (SmartCloud); 2019 Dec 10–12; Tokyo, Japan: IEEE. p. 98–103. doi:10.1109/SmartCloud.2019.00027. [Google Scholar] [CrossRef]
8. Saleem S, Sheeraz M, Hanif M, Farooq U. Web server attack detection using machine learning. In: 2020 International Conference on Cyber Warfare and Security (ICCWS); 2020 Oct 20–21; Islamabad, Pakistan: IEEE. p. 1–7. doi:10.1109/ICCWS48432.2020.9292393. [Google Scholar] [CrossRef]
9. Ren X, Hu Y, Kuang W, Souleymanou MB. A web attack detection technology based on bag of words and hidden Markov model. In: 2018 IEEE 15th International Conference on Mobile Ad Hoc and Sensor Systems (MASS); 2018 Oct 9–12; Chengdu, China: IEEE. p. 526–31. doi:10.1109/MASS.2018.00081. [Google Scholar] [CrossRef]
10. Sabokrou M, Fayyaz M, Fathy M, Moayed Z, Klette R. Deep-anomaly: fully convolutional neural network for fast anomaly detection in crowded scenes. Comput Vis Image Underst. 2018;172(3):88–97. doi:10.1016/j.cviu.2018.02.006. [Google Scholar] [CrossRef]
11. Chawla NV, Bowyer KW, Hall LO, Kegelmeyer WP. SMOTE: synthetic minority over-sampling technique. J Artif Intell Res. 2002;16:321–57. doi:10.1613/jair.953. [Google Scholar] [CrossRef]
12. He H, Garcia EA. Learning from imbalanced data. IEEE Trans Knowl Data Eng. 2009;21(9):1263–84. doi:10.1109/TKDE.2008.239. [Google Scholar] [CrossRef]
13. Lin T-Y, Goyal P, Girshick R, He K, Dollár P. Focal loss for dense object detection. arXiv:1708.02002, 2017. [Google Scholar]
14. Atienza D, Herrero Á, Corchado E. Neural analysis of HTTP traffic for web attack detection. In: Herrero Á, Baruque B, Sedano J, Quintián H, Corchado E, editors. International Joint Conference. CISIS 2015. Advances in Intelligent Systems and Computing; Cham: Springer International Publishing; 2015. Vol. 369, p. 201–12. doi:10.1007/978-3-319-19713-5_18. [Google Scholar] [CrossRef]
15. Japkowicz N, Stephen S. The class imbalance problem: a systematic study. Intell Data Anal. 2002;6(5):429–49. doi:10.3233/IDA-2002-6504. [Google Scholar] [CrossRef]
16. Babiker M, Karaarslan E, Hoscan Y. Web application attack detection and forensics: a survey. In: 2018 6th International Symposium on Digital Forensic and Security (ISDFS); 2018 Mar 22–25; Antalya, Turkey: IEEE. p. 1–6. doi:10.1109/ISDFS.2018.8355378. [Google Scholar] [CrossRef]
17. Liu T, Qi Y, Shi L, Yan J. Locate-then-detect: real-time web attack detection via attention-based deep neural networks. In: Proceedings of the Twenty-Eighth International Joint Conference on Artificial Intelligence; 2019; Macao, China. [Google Scholar]
18. Kozik R, Choraś M, Renk R, Hołubowicz W. A proposal of algorithm for web applications cyber attack detection. In: Computer information systems and industrial management; Berlin/Heidelberg: Springer Berlin Heidelberg; 2014. p. 680–7. doi:10.1007/978-3-662-45237-0_61. [Google Scholar] [CrossRef]
19. Kapodistria H, Mitropoulos S, Douligeris C. An advanced web attack detection and prevention tool. Inf Manag Comput Secur. 2011;19(5):280–99. doi:10.1108/09685221111188584. [Google Scholar] [CrossRef]
20. Pillai S, Sharma DA. Hybrid unsupervised web-attack detection and classification–a deep learning approach. Comput Stand Interfaces. 2023;86(2):103738. doi:10.1016/j.csi.2023.103738. [Google Scholar] [CrossRef]
21. Liang J, Zhao W, Ye W, Liang J, Zhao W, Ye W. Anomaly-based web attack detection. In: Proceedings of the 2017 VI International Conference on Network, Communication and Computing; 2017 Dec 8–10; Kunming, China: ACM. p. 80–5. doi:10.1145/3171592.3171594. [Google Scholar] [CrossRef]
22. Tian Z, Luo C, Qiu J, Du X, Guizani M. A distributed deep learning system for web attack detection on edge devices. IEEE Trans Ind Inform. 2020;16(3):1963–71. doi:10.1109/TII.2019.2938778. [Google Scholar] [CrossRef]
23. Tanrıverdi M, Tekerek A. Implementation of blockchain based distributed web attack detection application. In: 2019 1st International Informatics and Software Engineering Conference (UBMYK); 2019 Nov 6–7; Ankara, Turkey: IEEE. p. 1–6. doi:10.1109/UBMYK48245.2019.8965446. [Google Scholar] [CrossRef]
24. Torrano-Gimenez C, Nguyen HT, Alvarez G, Franke K. Combining expert knowledge with automatic feature extraction for reliable web attack detection. Secur Commun Netw. 2015;8(16):2750–67. doi:10.1002/sec.603. [Google Scholar] [CrossRef]
25. Niu Q, Li X. A high-performance web attack detection method based on CNN-GRU model. In: 2020 IEEE 4th Information Technology, Networking, Electronic and Automation Control Conference (ITNEC); 2020 Jun 12–14; Chongqing, China: IEEE. doi:10.1109/itnec48623.2020.9085028. [Google Scholar] [CrossRef]
26. Wang J, Zhou Z, Chen J, Wang J, Zhou Z, Chen J. Evaluating CNN and LSTM for web attack detection. In: Proceedings of the 2018 10th International Conference on Machine Learning and Computing; 2018 Feb 26–28; Macau, China: ACM. p. 283–7. doi:10.1145/3195106.3195107. [Google Scholar] [CrossRef]
27. Kshirsagar D, Kumar S. An ensemble feature reduction method for web-attack detection. J Discrete Math Sci Cryptogr. 2020;23(1):283–91. doi:10.1080/09720529.2020.1721861. [Google Scholar] [CrossRef]
28. Jin X, Cui B, Yang J, Cheng Z. Payload-based web attack detection using deep neural network. In: Advances on broad-band wireless computing, communication and applications. Cham: Springer International Publishing; 2017. p. 482–8. doi:10.1007/978-3-319-69811-3_44. [Google Scholar] [CrossRef]
29. Wang W, Zhang X, Wang W, Zhang X. High-speed web attack detection through extracting exemplars from HTTP traffic. In: Proceedings of the 2011 ACM Symposium on Applied Computing; 2011 Mar 21–24; TaiChung, Taiwan: ACM. p. 1538–43. doi:10.1145/1982185.1982512. [Google Scholar] [CrossRef]
30. Gong X, Lu J, Zhou Y, Qiu H, He R. Model uncertainty based annotation error fixing for web attack detection. J Signal Process Syst. 2021;93(2):187–99. doi:10.1007/s11265-019-01494-1. [Google Scholar] [CrossRef]
31. Stevanović N, Todorović B, Todorović V. Web attack detection based on traps. Appl Intell. 2022;52(11):12397–421. doi:10.1007/s10489-021-03077-9. [Google Scholar] [CrossRef]
32. Arreche O, Bibers I, Abdallah M. A two-level ensemble learning framework for enhancing network intrusion detection systems. IEEE Access. 2024;12(11):83830–57. doi:10.1109/ACCESS.2024.3407029. [Google Scholar] [CrossRef]
33. Gong X, Zhou Y, Bi Y, He M, Sheng S, Qiu H, et al. Estimating web attack detection via model uncertainty from inaccurate annotation. In: 2019 6th IEEE International Conference on Cyber Security and Cloud Computing (CSCloud)/2019 5th IEEE International Conference on Edge Computing and Scalable Cloud (EdgeCom); 2019 Jun 21–23; Paris, France: IEEE. doi:10.1109/cscloud/edgecom.2019.00019. [Google Scholar] [CrossRef]
34. Khan A, Sharma I. Using ensemble learning for securing public area networks from VPN malicious transmissions. In: 2023 International Conference on Research Methodologies in Knowledge Management, Artificial Intelligence and Telecommunication Engineering (RMKMATE); 2023 Nov 1–2; Chennai, India: IEEE. p. 1–6. doi:10.1109/RMKMATE59243.2023.10368897. [Google Scholar] [CrossRef]
35. Khan A, Sharma I. AI-enabled approach for preventing DNS attacks on banking institutions. In: 2023 International Conference on Research Methodologies in Knowledge Management, Artificial Intelligence and Telecommunication Engineering (RMKMATE); 2023 Nov 1–2; Chennai, India: IEEE; 2023. p. 1–6. doi:10.1109/RMKMATE59243.2023.10369196. [Google Scholar] [CrossRef]
36. Threepak T, Watcharapupong A. Web attack detection using entropy-based analysis. In: The International Conference on Information Networking 2014 (ICOIN2014); 2014 Feb 10–12; Phuket, Thailand: IEEE. p. 244–7. doi:10.1109/ICOIN.2014.6799699. [Google Scholar] [CrossRef]
37. Khan A, Sharma I. Machine learning-based methodology for preventing ransomware attacks on healthcare sector. In: 2023 International Conference on Research Methodologies in Knowledge Management, Artificial Intelligence and Telecommunication Engineering (RMKMATE); 2023 Nov 1–2; Chennai, India: IEEE. p. 1–5. doi:10.1109/RMKMATE59243.2023.10368971. [Google Scholar] [CrossRef]
Cite This Article
 Copyright © 2025 The Author(s). Published by Tech Science Press.
This work is licensed under a Creative Commons Attribution 4.0 International License , which permits unrestricted use, distribution, and reproduction in any medium, provided the original work is properly cited.
 Downloads
 Citation Tools