
 Submit a Paper
 Propose a Special lssue
 Open Access
ARTICLE
A Study on Outlier Detection and Feature Engineering Strategies in Machine Learning for Heart Disease Prediction
1 Department of Computer Science & Engineering (AIML), MLR Institute of Technology, Hyderabad, 500043, India
2 Department of Computer Science and Engineering, Prasad V. Potluri Siddhartha Institute of Technology, Vijayawada, 520007, India
3 Department of Computer Science & Engineering, Sir C. R. Reddy College of Engineering, Eluru, 534001, India
4 Amrita School of Computing, Amrita Vishwa Vidyapeetham, Amaravati, 522503, India
5 Department of Teleinformatics Engineering, Federal University of Ceará, Fortaleza, 60455-970, Brazil
* Corresponding Author: Parvathaneni Naga Srinivasu. Email:
Computer Systems Science and Engineering 2024, 48(5), 1085-1112. https://doi.org/10.32604/csse.2024.053603
Received 06 May 2024; Accepted 25 July 2024; Issue published 13 September 2024
 View Full Text
 Download PDF
Abstract
This paper investigates the application of machine learning to develop a response model to cardiovascular problems and the use of AdaBoost which incorporates an application of Outlier Detection methodologies namely; Z-Score incorporated with Grey Wolf Optimization (GWO) as well as Interquartile Range (IQR) coupled with Ant Colony Optimization (ACO). Using a performance index, it is shown that when compared with the Z-Score and GWO with AdaBoost, the IQR and ACO, with AdaBoost are not very accurate (89.0% vs. 86.0%) and less discriminative (Area Under the Curve (AUC) score of 93.0% vs. 91.0%). The Z-Score and GWO methods also outperformed the others in terms of precision, scoring 89.0%; and the recall was also found to be satisfactory, scoring 90.0%. Thus, the paper helps to reveal various specific benefits and drawbacks associated with different outlier detection and feature selection techniques, which can be important to consider in further improving various aspects of diagnostics in cardiovascular health. Collectively, these findings can enhance the knowledge of heart disease prediction and patient treatment using enhanced and innovative machine learning (ML) techniques. These findings when combined improve patient therapy knowledge and cardiac disease prediction through the use of cutting-edge and improved machine learning approaches. This work lays the groundwork for more precise diagnosis models by highlighting the benefits of combining multiple optimization methodologies. Future studies should focus on maximizing patient outcomes and model efficacy through research on these combinations.Keywords
This study paper focuses on heart ailments, which include several cardiovascular problems. This research examines cardiac diseases, from coronary artery disease to heart failure, to determine their causes, risk factors, and preventative and treatment options. In addition to the overwhelming statistics, understanding cardiac disorders is important because they affect individuals, families, and communities [1]. These illnesses lower the quality of life, increase healthcare costs, and reduce productivity. Thus, rigorous study is necessary to develop effective methods for preventing, detecting, and treating cardiovascular diseases, limiting their negative effects on society.
Heart diseases alone are a leading cause of death globally and contribute a lot to the healthcare budget. Due to the abundance of data and their impact on individuals, families, and communities, cardiac diseases must be understood [2]. These illnesses reduce sufferers’ well-being and increase healthcare costs and productivity losses. Therefore, comprehensive research is needed to develop effective strategies for preventing, early detection, and treating cardiovascular diseases to minimize their impact on community health.
A vast spectrum of cardiac diseases affects global health. This study examines these illnesses to uncover their complicated mechanisms, risk factors, and preventative and treatment methods [3]. This study underlines the necessity to understand these phenomena’ complexity to decrease their widespread impact on people and communities.
One of the major causes of death globally is the diseases related to the heart. This is because most of the complications are easily treatable, especially when detected early enough to prevent poverty levels and high mortality rates. Machine Learning (ML) has thereby become an optimal approach for applying big data analytics in connection to healthcare to anticipate heart disease.
This paper examines how recent treatments and ML techniques have assisted in heart disease prediction. Traditional systems for heart disease diagnosis involve elaborate and costly tests, such as the electrocardiogram (ECG). Machine learning is another non-intrusive approach that could save hundreds of thousands of dollars in research using healthcare data to diagnose patterns of diseases and possible predictions. Soon, it became clear that the choice of ML-based heart disease prediction models was constantly developing. Researchers have invested time and effort in testing different algorithms and feature extraction methods to enhance the prediction capability. However, some drawbacks still exist, such as the problem of insufficient sample size for model training and testing, the dilemma between model performance and model interpretability, and the use of real-world settings.
This article intends to help readers comprehend coronary artery disease, heart failure, and related disorders to better prepare them for heart ailments. It emphasizes the need for a multifaceted approach that includes lifestyle modifications, improved medical treatments, and public health [4]. The ultimate goal is to raise awareness of cardiac disease management worldwide and promote measures to lessen their impact on personal health and society.
However, the following technical challenges are barriers to the efficient utilization of ML and Deep Learning (DL) in heart disease prediction. Different methods used at the moment often use small sets of instances or sets that are not balanced, thus making the algorithms less reliable when it comes to various other datasets. Outlier detection methods used in these models often fail to address the complexities of the data distribution they are applied, making the results congested with biases and inaccuracies. However, feature selection approaches lag, which is reflected in the usage of unsophisticated selection algorithms that potentially fail to produce adequate results, taking into account all possible features of a dataset. Yet, other issues, including computational efficiency and the use of adequate and diverse evaluation metrics, remain underdeveloped, slowing down the applicability of these models in realistic environments.
This research proposes to fill the following technical gaps by framing an effective method, including outlier detection on heart disease prediction that differs from conventional techniques and powerful feature selection tools with efficient ensemble modeling. Firstly, data cleaning and balancing a skewed dataset are applied as major techniques in the systematic approach. The first workflow path detects outlier values for each independent variable calculated by subtracting the mean from and dividing by the Standard Deviation of the set of values. In contrast, the second path calculates the dataset’s Z-Score and IQR. Feature selection includes the strategy of Grey Wolf Optimization and Ant Colony Optimization, which mimics some natural phenomena. These features train AdaBoost models with Decision Trees as estimators. These are the following features: the sample rate determines the number of samples allowed to contribute to the model’s training. The assessment metrics that are considered in the current study includes accuracy, precision or True Positive (TP) rate, recall or sensitivity, F1 measure, and AUC.
The objectives of this study are:
• As a result, the data quality is increased by applying the depuration and balancing methods.
• Thus, the paper aims to enhance and present effective outlier detection methods based on Z-Score and IQR.
• To develop a method that improves feature selection and uses Grey Wolf Optimization (GWO) and ACO algorithms.
• The performance of the trained models must be examined; thus, the process should involve the usual evaluation metrics.
• In order to increase the efficiency of both pathways toward reaching the target, the best scenarios to predict heart diseases must be compared.
1.4 List of Contributions of this Study
The major contributions of the study to cardiovascular heart disease prediction include:
• Enhanced data pre-processing techniques: The work also utilizes other pre-processing steps, including cleaning and balancing the processed big data, in order to derive the optimal heart disease dataset for cardiovascular health prediction.
• Outlier detection methods: The use of Best and Worst approaches in the form of Z-Score and IQR makes it easier to spotlight outlying values with cardiovascular data and eliminate the biases, enhancing the value of judgments.
• Improved feature selection: GWO and ACO help reach the best-fit features that are significant for predicting cardiovascular diseases.
• Effective ensemble learning: This paper establishes that the AdaBoost Decision Tree framework optimizes the outcomes of both AdaBoost and Decision Trees in the analysis of cardiovascular disease prediction, with significant improvements in accuracy and time.
• Comprehensive performance evaluation: The performance evaluation using metrics like accuracy, precision, recall, the F1 measure, and the AUC score which give a broader evaluation result of the forecasted models of cardiovascular heart disease.
Thus, the presented aspects greatly enhance the current approaches to cardiovascular health diagnostics and patient management and can be viewed as a notable contribution to developing the respective field and further enhancing the diagnostics accuracy along with improved outcomes in cardiovascular disease treatment.
The impact of imbalanced datasets on machine learning models for heart disease prediction needs further study. Further research is needed to determine how imbalances in positive and negative cases affect model accuracy and generalizability. Understanding the accuracy-F1 Score trade-offs in imbalanced data is essential for creating robust models that can efficiently handle real-world scenarios with few positive instances (heart disease patients). Addressing this gap may improve the reliability and therapeutic relevance of cardiac disease prediction algorithms. This will allow the models to operate across patient demographics and prevalence rates.
In Section 2, a thorough literature study is presented along with a comprehensive overview of recent publications. Section 3 presents the proposed methodology. Section 4 presents the experimental results of the proposed model and discussion. Section 5 presents the conclusion of the study and the future research directions..
One of the major causes of death globally is the diseases related to the heart. This is because most of the complications are easily treatable, especially when detected early enough to prevent poverty levels and high mortality rates. ML has thereby become an optimal approach for applying big data analytics in connection to healthcare to anticipate heart disease. The present review aims to consider papers within the last five years (2019–2021) that explore using ML algorithms in predicting heart diseases. The review focuses on articles that address different aspects of the decision-making process for kidney disease diagnosis while using various ML algorithms, feature selection methods, and performance evaluation metrics. Based on these criteria, the following papers will be excluded from the review: Papers that include only a selected patient group will also be excluded, as will papers based on theoretical models only.
In 2021, Bharti et al. [5] emphasized the life-saving power of accurate cardiac disease prognosis. The study uses machine learning and deep learning methods on the 14-variable University of California, Irvine (UCI) Machine Learning Heart Disease dataset to evaluate and measure outcomes. Evaluation metrics include accuracy and confusion matrix. The study uses the Isolation Forest approach to remove redundant variables and standardize data to improve results. Multimedia technologies on mobile devices are also investigated, making predictive models more realistic. The machine learning K Neighbors classifier analyzes intermediate datasets well. The confusion matrix, accuracy, specificity, sensitivity, and F1 Score are stressed in the study. Computational efficiency is emphasized to reduce model deployment time. The study stresses data normalization to reduce overfitting and maintain model accuracy in real-world settings. Statistics, Gaussian distribution conformance, and outlier detection with the Isolation Forest algorithm boost the study’s trustworthiness. The research suggests increasing the dataset, improving deep learning, and using heart-disease-trained models with multimedia to improve patient-doctor interactions. This work sheds light on the convergence of machine learning, deep learning, and multimedia technologies, which could enable cardiac illness prediction and practical applications.
In 2021, Gárate-Escamila et al. [6] introduced Chi-Square with Principal Component Analysis (CHI-PCA) to reduce variables and pick the most relevant features to enhance heart disease prediction. Using the UCI Machine Learning Repository’s 74-feature heart disease dataset, the study validates its technique. Six Machine Learning classifiers are used. The CHI-PCA approach uses Random Forests (RF) for high accuracy. The Cleveland dataset has 98.7% accuracy, the Hungarian dataset 99.0%, and the combined Cleveland-Hungarian dataset 99.4%. Cholesterol, maximum heart rate, chest discomfort, and ST depression are anatomically and physiologically significant. Comparative analyses utilizing the original data reveal that CHI-PCA outperforms Logistic Regression (LOG) and Model Predictive Control (MPC) classifiers. The research also examines how imbalanced datasets affect performance measurements, highlighting accuracy-F1 Score trade-offs. The results show that CHI-PCA can identify key features and provide medical diagnostic insights. These focus on reducing data complexity while maintaining accurate predictions.
In 2019, Mohan et al. [7] emphasized cardiovascular disease is a leading cause of mortality globally, emphasizing the need for early detection approaches. This research uses an innovative ML approach to increase cardiovascular disease prediction accuracy. The research provides a machine learning prediction model that incorporates Internet of Things (IoT) advances. Features and classification algorithms are tested in the model. The hybrid Random Forest with a Linear Model (HRFLM) is a promising model with 88.7% accuracy. To detect health risks early and save lives, raw healthcare data must be analyzed. The study emphasizes the importance of ML in turning unprocessed healthcare data into useful insights and offers a novel method for heart illness prediction. Early detection reduces heart disease mortality, and the HRFLM approach has been proven to work. The paper recommends using real-world datasets in future expansions to avoid theoretical techniques and make results more realistic. The study also suggests researching machine learning methodologies and developing new feature-selection methods to improve heart disease prediction models.
In 2018, Gavhane et al. [8] addressed the rising number of young people having heart attacks and provides a simple, reliable method for early heart disease detection. The study suggests using age, sex, and pulse rate to predict heart disease risk in the general population as a cheaper alternative to ECGs. The Multi-Layered Perceptron (MLP) neural network algorithm is chosen for its precision and reliability using machine learning. MLP-based Heart Disease Prediction System predicts cardiovascular health, including coronary artery disease risk. The MLP is suitable for the proposed system due to its efficiency, accuracy, and reliability in generating outputs from user inputs. Cutting-edge technology and widespread adoption of this system may improve people’s understanding of their cardiovascular health, reducing heart disease deaths as more people learn about their condition.
In 2017, Pouriyeh et al. [9] used data mining classification and Ensemble Machine Learning to forecast heart illness. This study uses the 303-occurrence Cleveland dataset. The study examines data enhancement with 10-fold cross-validation. The study analyzes classifiers such as Decision Tree (DT), Naïve Bayes (NB), Multilayer Perceptron (MLP), K-Nearest Neighbor (K-NN), Single Conjunctive Rule Learner (SCRL), Radial Basis Function (RBF), and Support Vector Machine Ensemble methods like bagging, boosting, and stacking increase prediction accuracy. Support Vector Machines (SVM) outperform other methods with 84.81% accuracy, especially when boosted. SCRL and SVM have the highest (69.96%) and lowest (84.15%) accuracy. Bagging and boosting prove SVM’s superiority. However, stacking shows that SVM and MLP attain 84.15% accuracy. This study shows that ensemble techniques improve classifier performance on a short dataset. SVM is the best classifier, especially when it comes to boosting. To provide a more accurate evaluation, the study compares and improves approaches.
The related literature shows several technical issues evident in current approaches used in the prediction of heart diseases. Firstly, it must be noted that many Hospital Information System (HIS) studies involve small and/or unbalanced datasets, which affect the models’ generalizability and stability. Secondly, most outlier detection techniques do not work well when data is non-linear, and the distribution is too complicated, leading to biased and inaccurate results. Some of the fundamental methods implemented are the Chi-Square method and the Principal Component Analysis–though they are not as advanced to get the best from the dataset. Moreover, these models may not have good computational efficiency and are not feasible for practical implementation in real-world systems. In addition, incorporating feature selection using more sophisticated methodologies with the ensemble learning approaches is still in its infancy. Another issue is the incoherence in the choice of evaluation criteria: while the accuracy criterion dominates the results of the studies, other essential criteria, such as precision, recall, F1 coefficient, and AUC, are often left out of consideration. These gaps have ignited the development of the proposed methodology that utilizes efficient data cleaning techniques, improved outlier detection techniques, comprehensive feature selection methodology using Grey Wolf and Ant Colony Optimization techniques, and a wide range of evaluation metrics to enhance the accuracy and generalization of heart disease models.
Fig. 1 illustrates an unprocessed dataset of attributes and heart disease is used. After that, the dataset is split into training and testing sets for model evaluation. Data cleansing and imbalanced dataset handling increase data quality during preparation. The workflow then splits into two concurrent pathways. To find outliers, use the Z-Score method to find data points far from the mean. Features are selected using Grey Wolf Optimization, which mimics grey wolf hunting. The selected characteristics are used to train an AdaBoost model using a Decision Tree as the estimator. The second method uses the IQR to find outliers, focusing on data points outside the range. Ant Colony Optimization, a metaheuristic method inspired by ant foraging, selects pathway attributes. The selected characteristics are used to train an AdaBoost model. The method culminates with the evaluation of the trained models from both paths using accuracy, precision, recall, F1 Score, and AUC score. Compare these parameters to understand each route’s performance. This systematic technique integrates outlier handling, feature selection, and ensemble modeling to find the best heart disease prediction strategy.

Figure 1: Schematic diagram of the proposed methodology
Data cleaning, imbalanced dataset handling, and IQR and Z-Score approaches are used in the research. The steps are listed below.
Machine learning data cleaning ensures the dataset used to train the model is reliable and high-quality. This difficult operation involves numerous critical techniques to fix data errors. Imputation or deletion of missing data is the main focus of preventing model distortions. When imputing missing values using the mean, as shown in Eq. (1):
where
Duplicate records are found and eliminated to ensure each data point is unique. Outliers, which differ considerably from the average, can be removed or transformed to make the model more resilient. Categorical variable data type conversion meets machine learning algorithm requirements. The dataset is corrected to maintain coherence in categorical labels and numerical limits. Normalizing and scaling numerical characteristics standardizes their ranges to eliminate scale-related model effects. A common method is Min-Max Scaling as shown in Eq. (2):
where
Transformations reduce skewed distributions, improving feature distribution symmetry. Encoding categorical data ensures machine learning compliance. Feature engineering improves dataset information by adding or altering features. These processes include integrity checks to verify data meets standards. These methods create a clean, precise, and well-prepared dataset for machine learning model training and prediction.
3.1.2 Handling Imbalanced Dataset
A class imbalance existed before Adaptive Synthetic Sampling (ADASYN) [10,11] oversampling, with 526 examples in class 1 and 499 in class 0. This disparity may bias model training toward the dominant class. After ADASYN was implemented, each class had 423 occurrences, balancing the distribution as shown in Fig. 2. ADASYN prioritizes hard-to-classify circumstances by creating artificial minority class samples. ADASYN solves the imbalance problem without overfitting by considering minority class data density distribution. This balanced dataset improves machine learning models, lowering bias and enhancing prediction accuracy, especially when class distributions vary widely. ADASYN, as outlined in Algorithm 1, is beneficial for managing unbalanced datasets and improving classification algorithms.
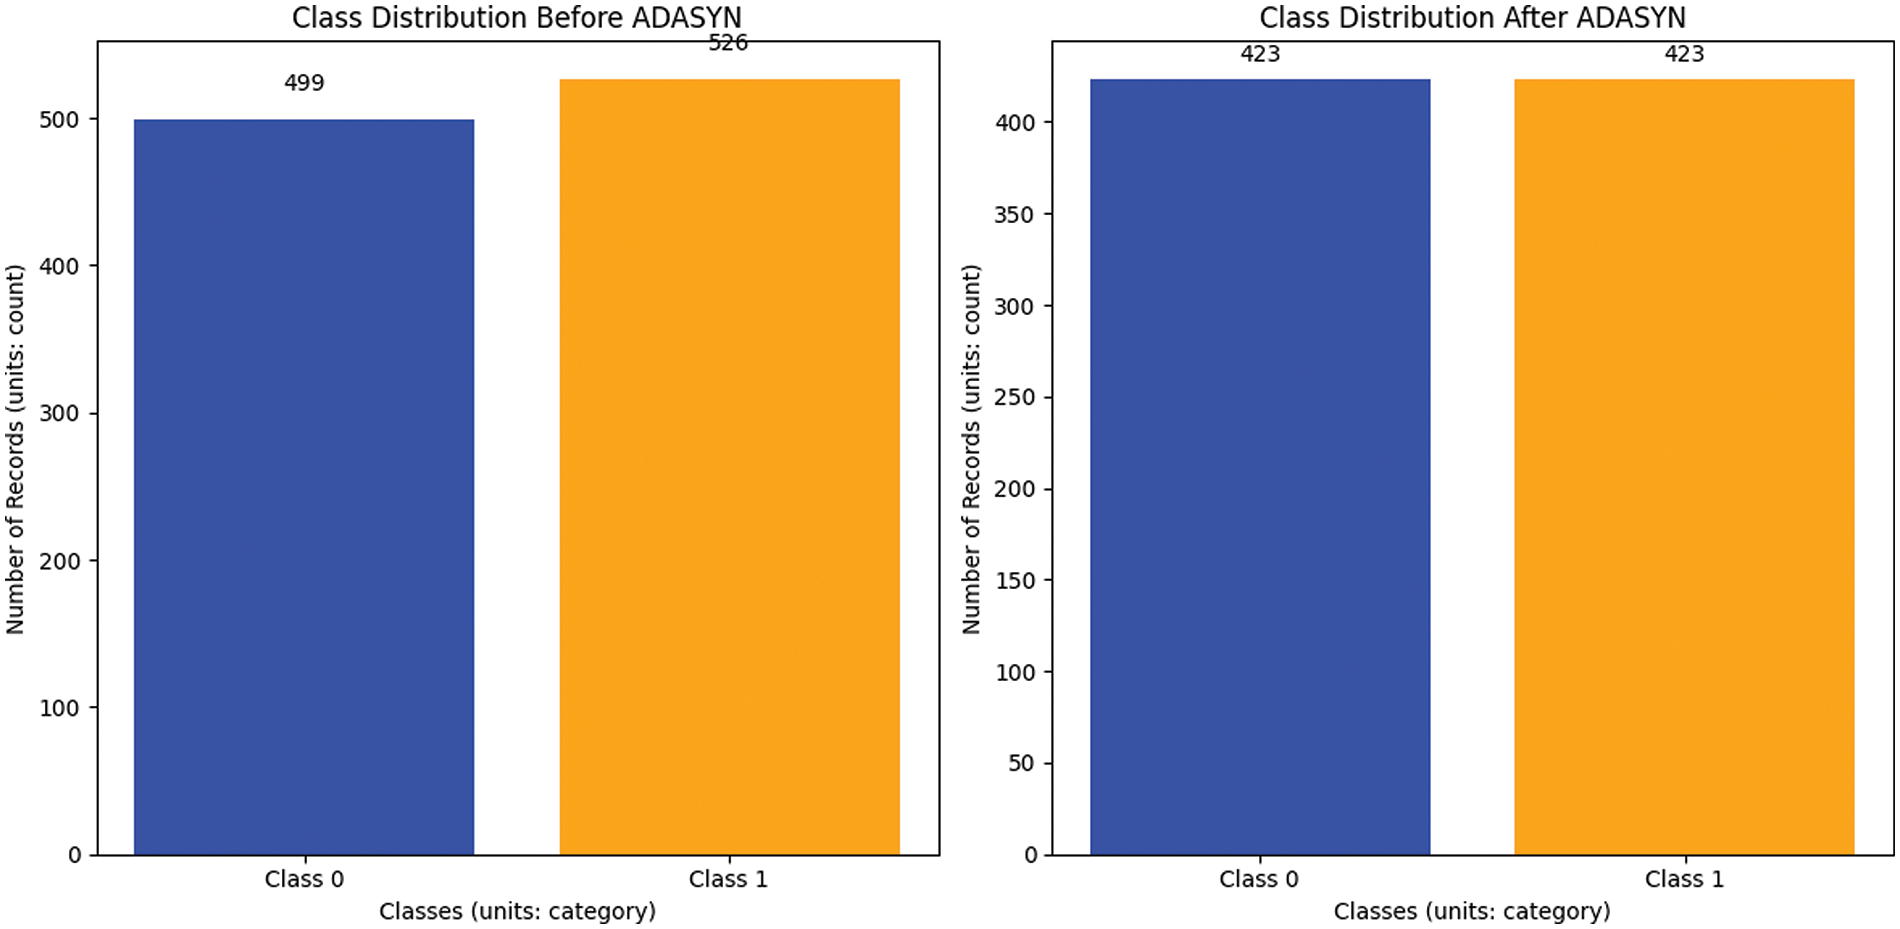
Figure 2: Before and after handling an imbalanced dataset (balancing)
The imbalance ratio

3.1.3 Handling Outliers with Z-Score
A statistical metric called the Z-Score, also known as the standard score or z-value, estimates the deviation of a data point from the dataset mean in standard deviations. It is often used to find outliers or data points far from the mean.
The formula for calculating the Z-Score of a data point
The Z-Score is a measure that quantifies the number of standard deviations a data point deviates from the mean. A Z-Score of 0 shows that the data point’s score equals the mean. A positive Z-Score indicates a value more than the mean, while a negative Z-Score suggests a value less than the mean [12,13].
In practice, Z-Scores are typically used to identify outliers or extreme values. Data points having Z-Scores exceeding a specific threshold are regarded as potential outliers, as shown in Fig. 3:

Figure 3: Before and after removing outliers using Z-Score
3.1.4 Handling Outliers with Interquartile Range
The IQR is a statistical metric employed to evaluate the extent or distribution of a dataset. It is very beneficial for detecting and addressing anomalies. The IQR is the difference between the third quartile (Q3) and the first quartile (Q1) of a dataset [14].
The following are the sequential instructions for computing the interquartile IQR:
• Sort the dataset in ascending order.
• Determine the first quartile (Q1) by finding the median of the lower half of the dataset.
• Determine the third quartile (Q3), which corresponds to the median of the upper half of the dataset.
• Compute the IQR using the formula shown in Eq. (9):
The interquartile range quantifies the dispersion of the central 50% of the dataset. Outliers can be detected by measuring their divergence from the IQR. Specifically, values below Q1 − 1.5 × IQR and above Q3 + 1.5 × IQR are often considered potential outliers.
The dataset includes demographic, clinical, and focus variables ‘Heart Disease.’ Age, gender, chest pain Type, resting BP (blood pressure), cholesterol, fasting BS (blood sugar), resting ECG, maxHR (heart rate), exercise angina, oldpeak, ST_slope, and heart disease binary categorization are the factors as shown in Fig. 4. Find and remove dataset outliers. Data preparation must identify and remove outliers to increase analysis and modeling dependability. Data anomalies differ considerably from the trend and can mislead statistical analysis and harm model performance. In this approach, the dataset includes age, blood pressure, cholesterol, and other health indicators [15].
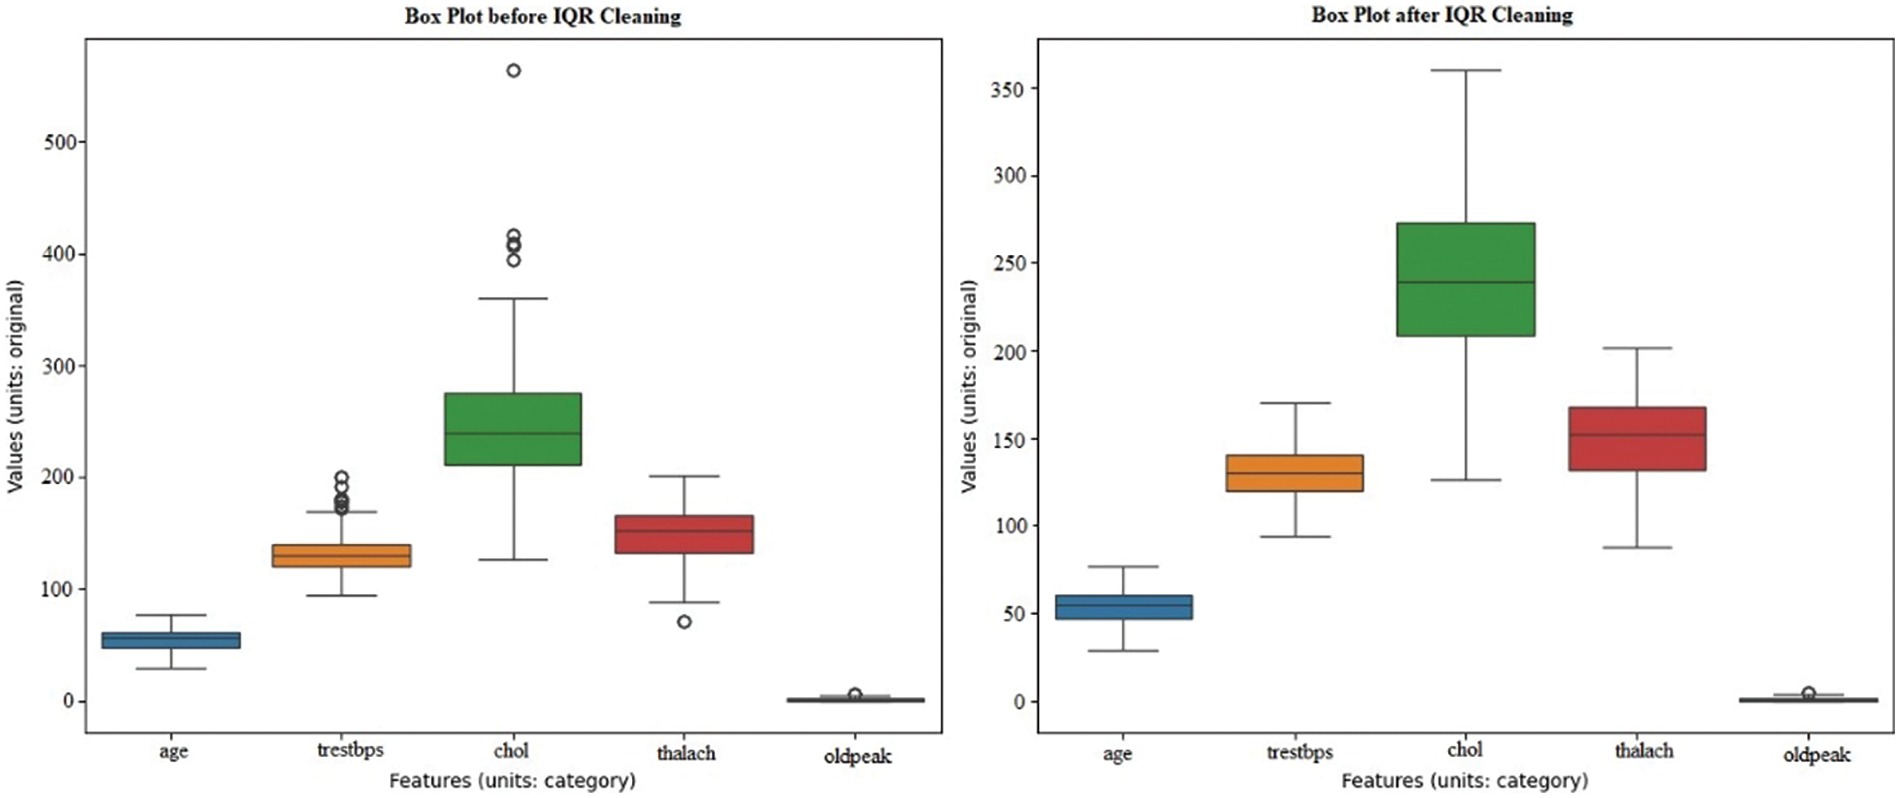
Figure 4: Before and after removing outliers using IQR
Outlier detection and removal methods like IQR are not specified. After reducing outliers, the dataset’s integrity and dependability should improve. Outliers can distort statistical measurements and reduce predictive model accuracy. After removing outliers, the dataset should be better for analysis, ensuring representative and reliable data insights.
Feature selection is an essential and critical process in machine learning, particularly when working with datasets with many features. The objective is to ascertain and preserve the most pertinent characteristics, which can augment the model’s efficacy, diminish overfitting, and boost comprehensibility.
GWO and ACO approaches are used in the research for feature selection.
3.2.1 Grey Wolf Optimization (GWO)
GWO is a metaheuristic algorithm inspired by grey wolf social structure and hunting. In feature selection, GWO finds the best subset of characteristics to maximize an objective function [16]. In the GWO algorithm, the distance between wolves and their updates to position is crucial for converging on optimal solutions. The distance is calculated as shown in Eq. (10):
where
Here,
A linearly decreases from 2 to 0 throughout iterations, and
The algorithm was inspired by a wolf pack’s hierarchical structure—alpha, beta, and delta wolves as leaders and omega as followers. Optimization involves these steps as shown in Fig. 5.

Figure 5: The control flow diagram of the GWO algorithm
• Initial phase: Create a population of wolves, with each wolf representing a potential solution in the form of a feature subset. Assess the fitness level of each wolf by evaluating the goal function.
• Formation of a hierarchy: Determine the alpha, beta, and delta wolves by analyzing their fitness levels. Allocate each wolf a spot within the search space based on their hierarchical ranking.
• Search for prey: Wolves cooperate to locate and capture prey, aiming for the most efficient outcome. Revise the location of each wolf according to their rank in the hierarchy and a random component of exploration.
• Revise the positions of Alpha, Beta, and Delta: Revise the locations of the alpha, beta, and delta wolves in accordance with their hunting tactics. Promote exploring by maintaining a balance between global and local exploration through updated positions.
• Surround the target and launch an assault: Surround the prey (the most effective solution) by modifying the placements of the wolves. Model the assault on the prey, illustrating the process of approaching the most favorable outcome.
• Update the positions of the wolves: Revise the locations of all wolves, including the alpha, beta, delta, and omega individuals. Manage the delicate balance between exploring new possibilities and exploiting existing knowledge to ensure a harmonious local and global search combination.
• Repeat: Iterate the operation for a designated number of cycles or until the convergence requirements are satisfied.
The GWO algorithm is an optimization algorithm using the social behavior of grey wolves in hunting and is one of the metaheuristic methods. To solve the problem, the genetic algorithm is used, which involves testing a population of wolves and moving the wolves to the hunting population to achieve the best solution possible. High-ranking wolves and breeding pairs introduce the alpha, beta, and delta wolves as the best individuals in the population to drive the search. They head together to search for the prey; an effect that would lead to the most optimal benefit to the pack. They even reallocate their positions. It may be noted that the algorithm provides an appropriate trade-off between exploration and exploitation of the solution space for a satisfactory solution, per the requirements of the problem. It means that a certain point in a solution space is chosen to mark the end of the optimization if specific criteria are fulfilled. Otherwise, iterations continue until the values stabilize and reach a certain level known as convergence level or until another condition halts the process. It is showing excellent results in numerous optimization problems on account of its simplicity and efficiency in yielding optimal solutions.
The hyperparameters of the GWO algorithm are:
Population size (N), Number of iterations (T), Coefficient vectors (a, A, C), Dimension of the problem (D), Lower and upper bounds, and Fitness function.
The mentioned hyperparameters are significant in hopes of regulating and defining the associated behaviors and performance of the GWO algorithm. From the equation, the population size (N) and the number of iterations (T) define the exploration and convergence rate of the algorithm. While parameter a satisfies the successful exploration of the search space during the optimization process, C encourages the exploitation of iteration point A at the right time. The range of the problem that has to be solved defines the range of the solution space, the dimension of the problem (D), and the lower and upper boundaries. It determines the adequacy of the solutions to be improved upon in an effort to select the best feature subsets. Specifically, they are the number of particles, the current, the conjugate, and the inertia coefficients, which, if well-chosen and regulated, can optimize GWOs on feature selection pertaining to heart disease prediction probabilities.
3.2.2 Ant Colony Optimization (ACO)
The metaheuristic algorithm ACO is based on ant foraging. ACO is used in combinatorial optimization and feature selection to mimic ants’ ability to find the shortest route between their colony and a food source [17]. ACO to find the best graph pathways. The way ants find their way to food-inspired it. The two equations that are essential for the ACO method are listed below:
1. Probability of Choosing a Path
In ACO, the probability
where:
2. Pheromone Update Rule
After all ants have done their tours, edge pheromone levels are changed to reflect their route preferences. The typical pheromone updating rule is shown in Eq. (14):
where:
where:
Ant Colony Optimization in brief as shown in Fig. 6.

Figure 6: The control flow diagram of the ACO algorithm
• Inspiration from Ant Foraging: Ant collective foraging, where ants deposit pheromones on the ground as they travel, inspired ACO. Pheromone attracts other ants to shorter trails since they accumulate more.
• Solution Representation: Combinatorial optimization uses ACO for problems with pathways or combinations. Feature selection solutions represent subsets of features.
• Pheromone Update: The technique employs a pheromone matrix to encode the answers and their respective quality. After each cycle, the pheromone is updated according to the quality of the solutions that have been discovered. Solutions that are shorter or more efficient are rewarded with a greater concentration of pheromones.
• Solution Construction: Ants build solutions by repeatedly choosing characteristics depending on the pheromone matrix. The selection likelihood of a specific feature is controlled by the concentration of pheromones associated with that characteristic.
• Local Search and Exploration: Local search algorithms can improve solution quality and solution space exploration. Ants may base their decisions on heuristics or other information.
• Pheromone Evaporation: Pheromone concentrations are evaporated to prevent the algorithm from converging to suboptimal solutions. Evaporation makes unreinforced routes less appealing.
• Iterative Process: Multiple generations of the algorithm refine solutions. The pheromone matrix converges to an optimal or near-optimal solution.
• Application to Feature Selection: ACO is used to pick features that maximize a parameter, like model correctness or another performance metric. Pheromone-guided construction selects or excludes features.
3.2.3 Application to Feature Selection
ACO is used to pick features that maximize a parameter, like model correctness or another performance metric. Pheromone-guided construction selects or excludes features.
Fig. 6 illustrates the cycle of ACO with ants constructing solutions derived from pheromone, and the algorithm converting these solutions through pheromone evaporation and neighborhood search, assessing convergence at each step [18]. This occurs until divergence stops and the defined convergence criteria are realized.
The hyperparameters of the ACO algorithm are:
Number of Ants
The hyperparameters mentioned above are important for controlling and determining the behavior and performance of the ACO algorithm to a certain extent. Hence, their meticulous selection and adjustment are the keys to this algorithm’s efficiency in feature selection for heart disease prediction.
3.3 Model for Heart Failure Prediction
AdaBoost, also known as Adaptive Boosting [19], is an effective ensemble learning method designed to enhance weak learners and build a precise classifier. First, a base or weak learner is trained on the original dataset, usually a classifier that outperforms random chance. After each repetition, AdaBoost adjusts the weights to account for the weak learner’s accuracy. Incorrectly classified instances are weighted more, focusing the system on difficult situations. Weighted voting merges the predictions of many weak learners to form a robust learner. The best model prioritizes competent weak learners’ predictions, creating a flexible classifier [20]. This strategy involves careful consideration of noise susceptibility and weak learner selection.
AdaBoost adapts instance weights to prioritize difficult situations and calculates weak learner weights based on accuracy, as the formulas show. The final projection is a mix of weak learners’ forecasts, with high-performing learners having more impact. AdaBoost helps weak learners construct a powerful and adaptive classifier, as shown in Eqs. (16) through (20).
i)Given a training set (x1, y1), (x2, y2), …, (xm, ym) where
Initialize weights
For
• Train weak Learners
Train a weak learner
• Calculate Error
Compute the error of
where
Compute Classifier Weight
Calculate the weight
Update Weights
Update the weights
Final Strong Classifier
The final strong classifier
where:
•
•
•
•
This section provides the proposed network setting for conducting the experiments, which forms part of this research. All the experiments were performed with the Google Colab environment, which provides the cloud-based interface and free access to the GPU (Graphics Processing Unit) resources by the choice of computational power during the machine learning model development and validation.
4.1.2 Outcome of Feature Selection Using GWO
Key prognostic factors were identified using the results from the GWO on the heart disease dataset. The GWO research found “thalach,” or maximum heart rate, to be the most important factor. Its fitness score of 604.927870 and unbelievably low p-value of 1.418912e−133 showed its remarkable outcome prediction ability. In addition to fitness ratings, ‘oldpeak’ (the amount of ST depression caused by exercise relative to rest), ‘ca’ (the number of major vessels colored by fluoroscopy), and ‘cp’ (chest pain kind) showed low p-values as shown in Fig. 7 and Table 1.

Figure 7: A line graph denoting selected features with scores using GOW

These data supported keeping these features in the model. Fasting blood sugar (FBS) had the least effect on the prediction model. It fit the least and had a high p-value, indicating little effect. This technique lets me focus on the prediction model’s most critical components, perhaps boosting heart disease detection. This technique improves the data collection, model reliability, and clinical importance, resulting in better results.
4.1.3 Outcome of Feature Selection Using ACO
After the ACO method was applied to the heart disease dataset, our study concentrated on evaluating the importance of the produced characteristics. By applying the ACO algorithm—which takes its cues from the effective navigation of ants—researchers could determine which heart disease markers are most important. With a significance score of 0.095369, the study found that the feature ‘trestbps’ (resting blood pressure) is the most significant. The parameters ‘ca’ (the number of major vessels visible during fluoroscopy) and ‘thalach’ (the greatest heart rate obtained under stress), with scores of 0.088210 and 0.089583, respectively, were attentively followed. ‘Sex’, ‘age’, and ‘thal’ are a few more noteworthy attributes that also showed significant relevance, indicating their value in the prediction model as shown in Fig. 8 and Table 2.
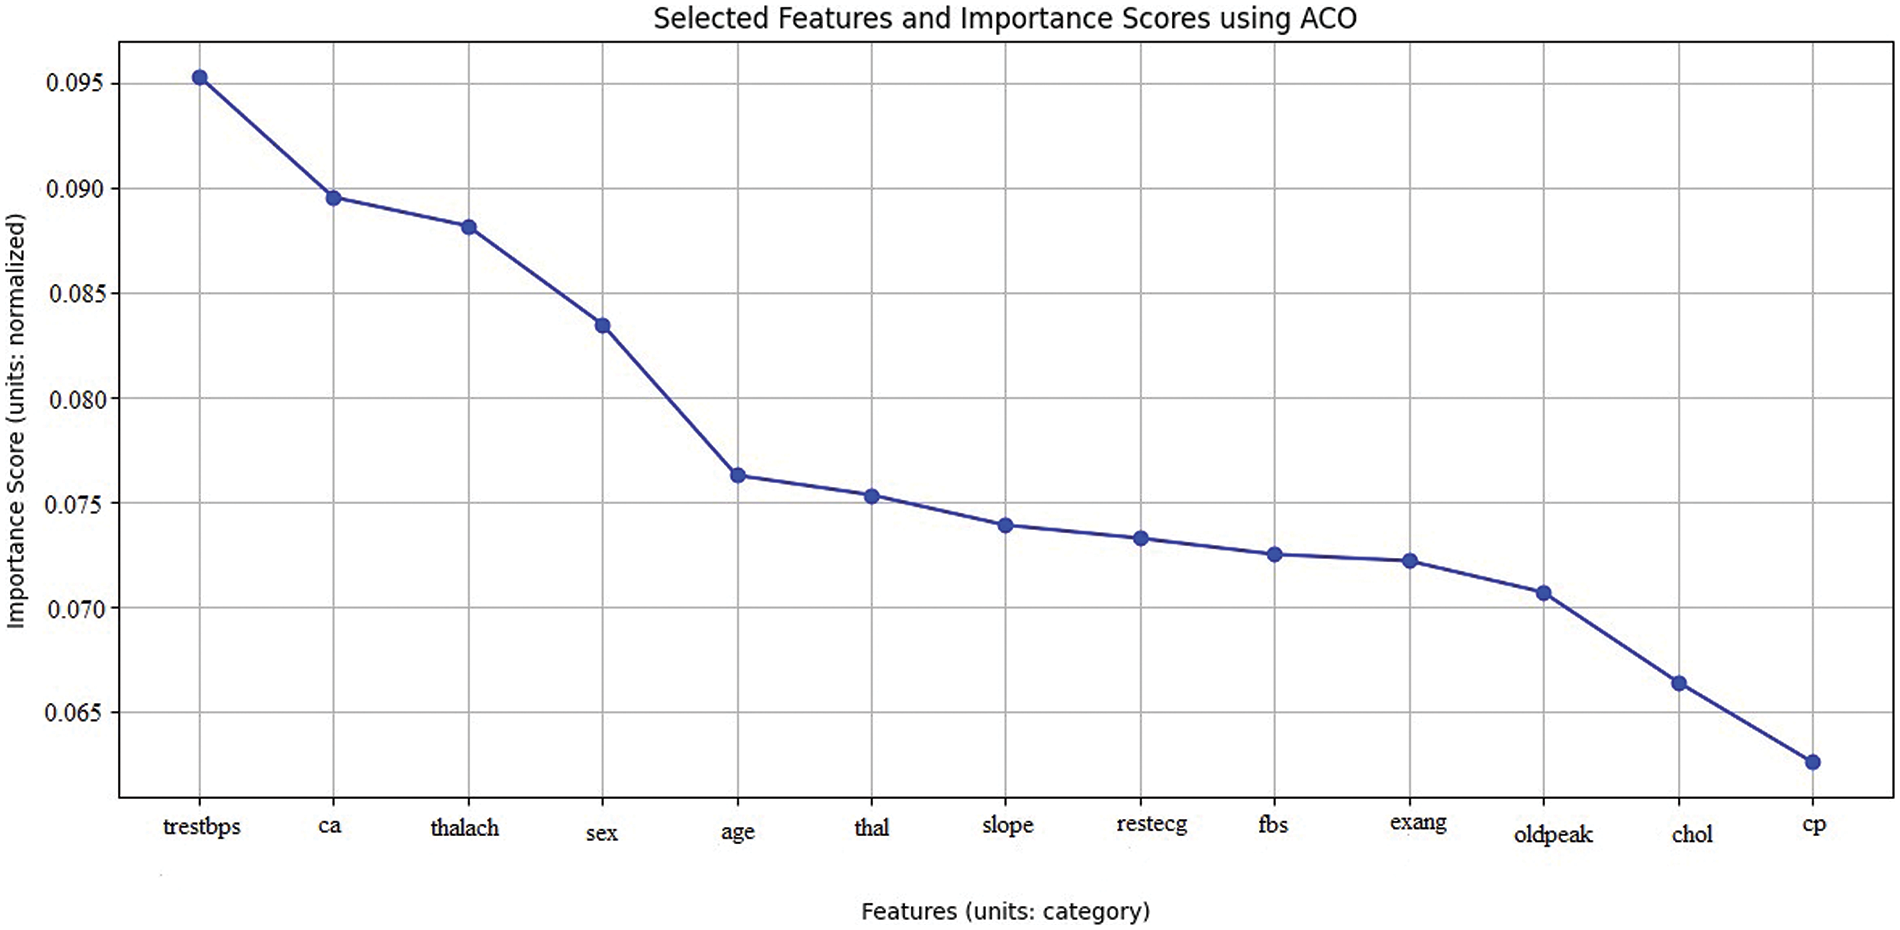
Figure 8: A line graph denoting selected features with importance using ACO

These results allow me to order these crucial features in my modeling efforts, increasing the final models’ efficacy and precision. This method makes feature selection easier and helps me learn more about the fundamental causes of heart disease, which will help to develop more focused and effective treatments.
4.1.4 Z-Score Outlier Detection and GWO with AdaBoost
Z-Score Outlier Detection, GWO for feature selection, and AdaBoost classification provide promising heart disease prediction results. The accuracy of the test is 89.0%, which indicates good precision in predicting positive and negative cases. Precision, which measures positive prediction accuracy, is 89.0%, showing few false positives. The model’s recall rate is 90.0%, indicating its ability to recognize heart disease patients.
The harmonic mean of precision and memory, the F1 Score, is 89.0%, showing a balanced performance in precision and recall. The model’s AUC value of 93.0% indicates high discrimination between positive and negative cases, as shown in Table 3, Figs. 9–11. The confusion matrix shows 84 correctly identified negatives, 97 correctly identified positives, 12 wrongly identified positives, and 11 incorrectly identified negatives.


Figure 9: Bar graph shows Z-Score outlier detection and GWO with AdaBoost performance metrics

Figure 10: Confusion matrix for Z-Score outlier detection and GWO with AdaBoost

Figure 11: ROC for Z-Score outlier detection and GWO with AdaBoost
The confusion matrix shows that the model accurately classifies scenarios as either having heart disease or not. However, false positive and false negative values suggest model errors and must be addressed. One can research ways to reduce false positives and negatives to increase model accuracy.
4.1.5 IQR Outlier Detection and ACO with AdaBoost
With IQR Outlier Detection and ACO for feature selection and AdaBoost classification, heart disease prediction results are promising. With 86.0% accuracy, the model makes accurate predictions. Positive predictions had 84.0% precision, indicating few false positives. A 90.0% recall rate shows the model can detect positive heart disease patients.
The F1 Score, the harmonic mean of precision and recall, is 87.0%, showing a balanced performance in predicting positive instances and limiting false positives. The model’s AUC score is 91.0%, indicating strong discrimination. Confusing matrix analysis helps explain model effectiveness. The model successfully classifies patients with and without heart disease with 97 true positives, 78 true negatives, 18 false positives, and 11 false negatives. Optimizing the model’s parameters may enhance precision and recall even when false positives and negatives are low, as shown in Figs. 12–14 and Table 4.

Figure 12: The bar graph shows IQR outlier detection and ACO with AdaBoost performance metrics

Figure 13: Confusion matrix for IQR outlier detection and ACO with AdaBoost

Figure 14: ROC for IQR outlier detection and ACO with AdaBoost
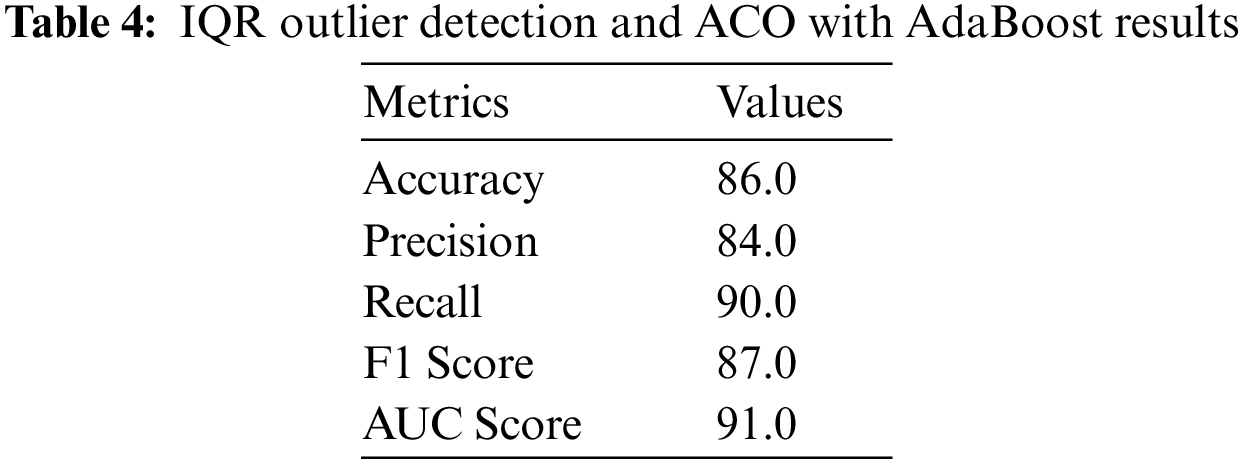
IQR Outlier Detection, ACO for feature selection, and AdaBoost perform well in heart disease prediction. Balanced performance indicators and a decent AUC score highlight the model’s real-world potential. Use case-specific fine-tuning and modification can improve model forecast accuracy.
4.1.6 Comparative Performance of Z-Score and IQR Outlier Detection with GWO and ACO in AdaBoost-Based Heart Disease Prediction
In the classification results, there are significant differences in identifying heart disease using Feature Selection with AdaBoost combined with Z-Score and GWO on the one hand, and the use of IQR and ACO on the other. The GWO and Z-Score achieved higher training and testing accuracies than the proposed IQR and ACO methods, as it was observed at 91.00% in training and 89.00% in testing accuracies for the GWO and Z-Score method and 88.00% in training and 86.00% in testing accuracies for the IQR and ACO method. This implies that the combination of Z-Score and GWO is a better fit for the training data and performs more optimally when making predictions on actual, unseen data. Moreover, it can be seen that the accuracy of the Z-Score and GWO methods is slightly higher, being 89.0% compared to IQR and ACO method accuracy of 84.0%, thus reducing the false positive. It shows that each technique has 90.0% recall. However, the F1 Scores of the Z-Score technique are 89.0% and 87.02%, respectively. In contrast, GWO is 87.02% and 90.0%, respectively, proves that GWO is more sensitive and selective in terms of parameters.
Comparing the miss rates, the number indicating the false negative cases, the training and testing miss rate of both methods is 10.0% based on 90.0% recall. This means that both methods’ miss rate is equally efficient in predicting actual positive cases of heart disease. Nevertheless, given that the Z-Score and GWO method possesses higher overall performance than other methods concerning precision, F1 Score, and AUC, it ensures the correct identification of positive cases. It reduces the number of FPs and the ability to differentiate classes. Thus, using the AdaBoost with Z-Score and GWO demonstrates better accuracy, balanced performance, stronger characteristics, and better generalization to the unseen data set, making it perfect for heart disease predictability that is tabulated in Table 5 and the corresponding graphs are shown in Fig. 15.


Figure 15: The bar graph shows a performance comparison of Z-Score and IQR outlier detection with GWO and ACO in AdaBoost-based heart disease prediction
4.1.7 Comparative Performance of Z-Score and IQR Outlier Detection with Existing Counterparts
Table 6 compares outlier identification strategies, including existing methods, and the proposed model. The accuracy of outlier identification for each method indicates its efficacy. The “Our Work” method employs AdaBoost, Z-Score, and GWO to find outliers with 91.0% accuracy. This improves outlier detection. Since it uses Random Forest (RF) and Genetic Algorithms, Rani et al.’s algorithm stands out. This algorithm beats the specified method with 86.6% accuracy. Other methods, such as regularization with Random Forest (RF) and Genetic Algorithms (GA) with Radial Basis Function, achieve 84.98% to 85.40% accuracy.
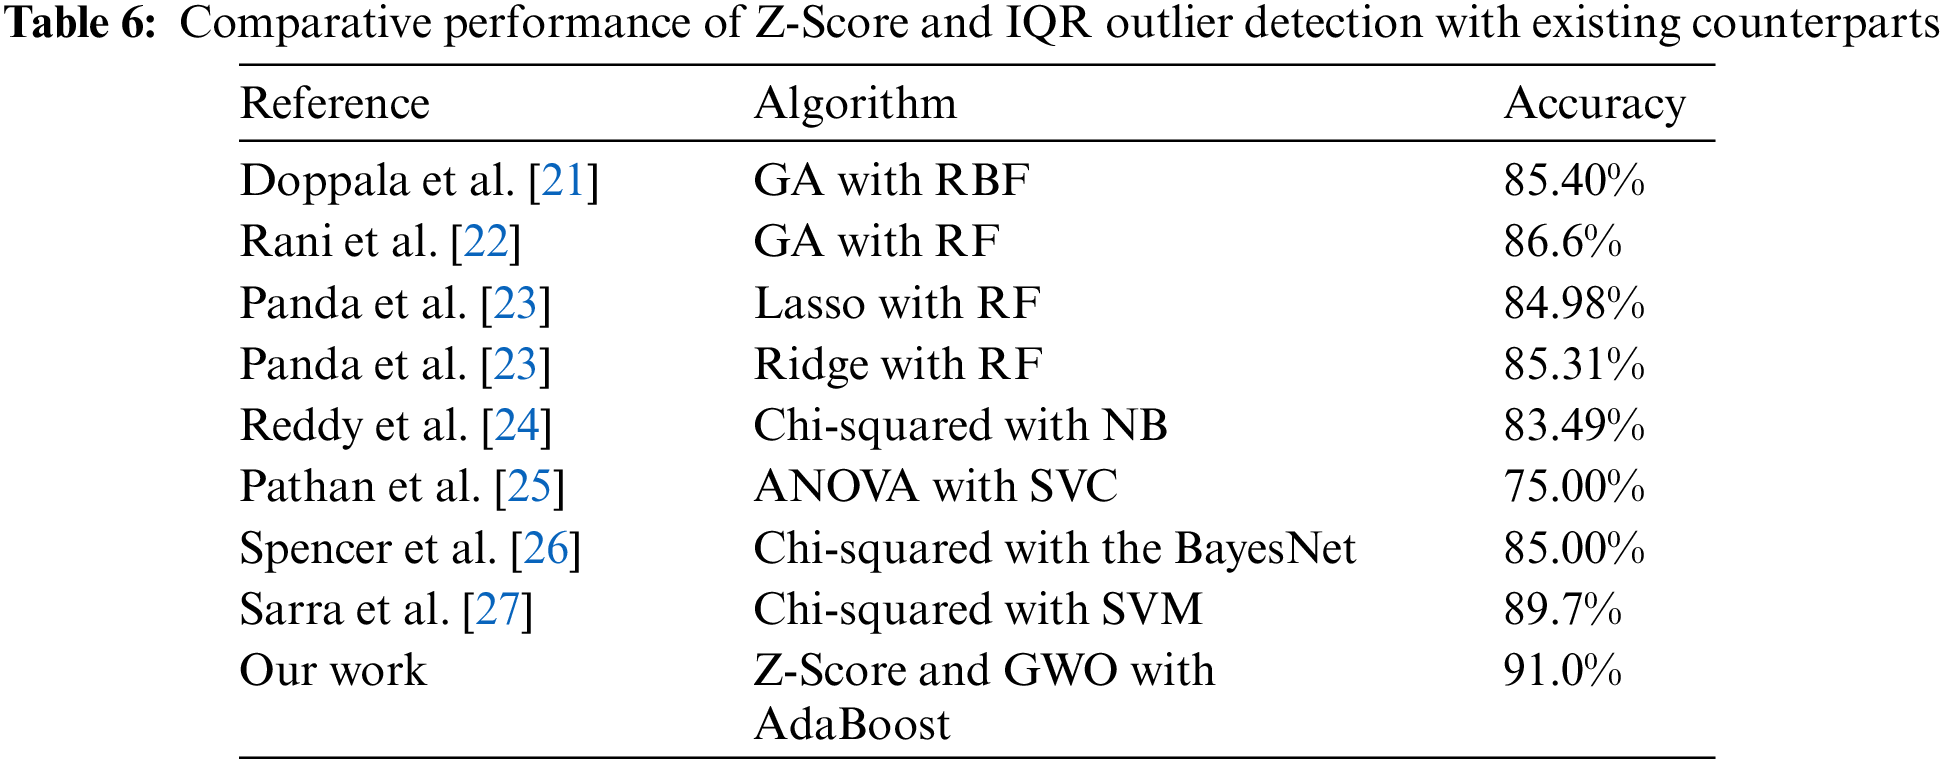
Interestingly, the proposed strategy accurately identifies dataset irregularities better than any other method. This implies that Z-Score, GWO, and AdaBoost can locate outliers effectively, improving predictive analytics for cardiovascular health and other fields.
Limitations of this research indicate that the difference in performance is presented with different datasets where the quality and characteristics of datasets influence the methodology’s effectiveness. The analyzed methods, GWO and ACO, are computationally expensive depending on the size of the dataset or the number of iterations set, which could be a drawback of these algorithms in terms of time consumption. Adjustment of AdaBoost is most often overfitting, and it pays too much attention to outlier detection along with some feature selection, which causes worse results for unseen data. The selection of features through GWO and ACO may be prone to certain bias levels if the specified algorithms fail to adequately cover the feature domain concerning identifying informative features. However, it should be noted that the balancing techniques may not address all problems linked with imbalanced data. Its symptoms may cause the model to predict largely towards the largest class.
In conclusion, advanced machine learning methods, Z-Score Outlier Detection with GWO and IQR Outlier Detection with ACO, integrated with AdaBoost, improve heart disease prediction. Our research intended to boost diagnostic precision in addressing the significant problem of cardiovascular disorders worldwide. With 89.0% accuracy, precision, F1 Score, 90.0% recall, and 93.0% AUC, the Z-Score and GWO with AdaBoost performed well. The IQR and ACO with AdaBoost performed much worse. They had 86.0% accuracy, 84.0% precision, 87.02% F1 Score, and 91.0% AUC. Considering the small compromises between the two strategies is key. Z-Score and GWO with AdaBoost had greater precision, but IQR and ACO had excellent recall, demonstrating their capacity to identify positive cases. Considering the use-case requirements and reducing erroneous predictions is important while choosing various approaches. Our research helps optimize heart disease prognostic models, improving therapy and patient outcomes. Further studies should also focus on developing better balancing mechanisms of the data, unique approaches to detecting outliers, and feature selection techniques that will improve the performance and transferability of the models in the future.
Acknowledgement: The authors would like to thank the management of Amrita School of Computing, Amrita Vishwa Vidyapeetham, Amaravathi campus for providing all the necessary resources to conduct the research.
Funding Statement: The current study has not received any external funding.
Author Contributions: Study conception and design: Parvathaneni Naga Srinivasu and Varada Rajkumar Kukkala; data collection: Surapaneni Phani Praveen and Naga Satya Koti Mani Kumar Tirumanadham; analysis and interpretation of results: Naga Satya Koti Mani Kumar Tirumanadham and Varada Rajkumar Kukkala; draft manuscript preparation: Varada Rajkumar Kukkala and Parvathaneni Naga Srinivasu; implementation of the model: Surapaneni Phani Praveen. All authors reviewed the results and approved the final version of the manuscript.
Availability of Data and Materials: The link for the dataset that is used in the current study is provided below: https://www.kaggle.com/datasets/johnsmith88/heart-disease-dataset (accessed on 02 April 2024).
Ethics Approval: Not applicable.
Conflicts of Interest: The authors declare that they have no conflicts of interest to report regarding the present study.
References
1. T. R. Ramesh, U. K. Lilhore, P. M. S. Simaiya, A. Kaur, and M. Hamdi, “Predictive analysis of heart diseases with machine learning approaches,” Malaysian J. Comput. Sci., pp. 132–148, Mar. 2022. doi: 10.22452/mjcs.sp2022no1.10. [Google Scholar] [CrossRef]
2. G. H. Mudge, R. M. Mills, H. Taegtmeyer, R. Gorlin, and M. Lesch, “Alterations of myocardial amino acid metabolism in chronic ischemic heart disease,” J. Clin. Invest., vol. 58, no. 5, pp. 1185–1192, Nov. 1976. doi: 10.1172/JCI108571. [Google Scholar] [PubMed] [CrossRef]
3. D. C. Greenwood, K. R. Muir, C. J. Packham, and R. J. Madeley, “Coronary heart disease: A review of the role of psychosocial stress and social support,” J. Public Health, vol. 18, no. 2, pp. 221–231, Jun. 1996. doi: 10.1093/oxfordjournals.pubmed.a024483. [Google Scholar] [PubMed] [CrossRef]
4. I. D. Mienye and N. Jere, “Optimized ensemble learning approach with explainable AI for improved heart disease prediction,” Information, vol. 15, no. 7, pp. 394, Jul. 2024. doi: 10.3390/info15070394. [Google Scholar] [CrossRef]
5. R. Bharti, A. Khamparia, M. Shabaz, G. Dhiman, S. Pande and P. Singh, “Prediction of heart disease using a combination of machine learning and deep learning,” Comput. Intell. Neurosci., vol. 2021, pp. 1–11, Jul. 2021. doi: 10.1155/2021/8387680. [Google Scholar] [PubMed] [CrossRef]
6. A. K. Gárate-Escamila, A. H. E. Hassani, and E. Andrès, “Classification models for heart disease prediction using feature selection and PCA,” Inform. Med. Unlocked, vol. 19, pp. 100330, Jan. 2020. doi: 10.1016/j.imu.2020.100330. [Google Scholar] [CrossRef]
7. S. Mohan, C. Thirumalai, and G. Srivastava, “Effective heart disease prediction using hybrid machine learning techniques,” IEEE Access, vol. 7, pp. 81542–81554, Jan. 2019. doi: 10.1109/ACCESS.2019.2923707. [Google Scholar] [CrossRef]
8. A. Gavhane, G. Kokkula, I. Pandya, and K. Devadkar, “Prediction of heart disease using machine learning,” in 2018 Second Int. Conf. Electron. Commun. Aerospace Technol. (ICECA), Coimbatore, India, Mar. 2018. doi: 10.1109/iceca.2018.8474922. [Google Scholar] [CrossRef]
9. S. Pouriyeh, S. Vahid, G. Sannino, G. De Pietro, H. Arabnia and J. Gutierrez, “A comprehensive investigation and comparison of machine learning techniques in the domain of heart disease,” in 2017 IEEE Symp. Comput. Commun. (ISCC), Heraklion, Greece, 03–06 July, 2017. doi: 10.1109/iscc.2017.8024530. [Google Scholar] [CrossRef]
10. A. Lakshmanarao, A. Srisaila, and T. S. R. Kiran, “Heart disease prediction using feature selection and ensemble learning techniques,” in 2021 Third Int. Conf. Intell. Commun. Technol. Virtual Mob. Netw. (ICICV), Tirunelveli, India, Feb. 2021, pp. 994–998. doi: 10.1109/icicv50876.2021.9388482. [Google Scholar] [CrossRef]
11. S. Sharma and A. Singhal, “A novel heart disease prediction system using XGBoost classifier coupled with ADASYN SMOTE,” in 2023 Int. Conf. Comput., Commun., Intell. Syst. (ICCCIS), Greater Noida, India, 2023, pp. 76–81. doi: 10.1109/icccis60361.2023.10425095. [Google Scholar] [CrossRef]
12. B. Akkaya, E. Sener, and C. Gursu, “A comparative study of heart disease prediction using machine learning techniques,” in 2022 Int. Congress Hum.-Comput. Interact., Optimization Robot. Appl. (HORA), Ankara, Turkey, Jun. 2022, pp. 1–8. doi: 10.1109/hora55278.2022.9799978. [Google Scholar] [CrossRef]
13. E. Cainelli et al., “Detecting neurodevelopmental trajectories in congenital heart diseases with a machine-learning approach,” Sci. Rep., vol. 11, no. 1, Jan. 2021. doi: 10.1038/s41598-021-82328-8. [Google Scholar] [PubMed] [CrossRef]
14. Y. K. Saheed, T. T. Salau-Ibrahim, M. Abdulsalam, I. A. Adeniji, and B. F. Balogun, “Modified bi-directional long short-term memory and hyperparameter tuning of supervised machine learning models for cardiovascular heart disease prediction in mobile cloud environment,” Biomed. Signal Process. Control, vol. 94, pp. 106319, Aug. 2024. doi: 10.1016/j.bspc.2024.106319. [Google Scholar] [CrossRef]
15. R. C. Ripan et al., “A data-driven heart disease prediction model through k-means clustering-based anomaly detection,” SN Comput. Sci., vol. 2, no. 2, pp. 175, Feb. 2021. doi: 10.1007/s42979-021-00518-7. [Google Scholar] [CrossRef]
16. Y. K. Saheed, B. F. Balogun, B. J. Odunayo, and M. Abdulsalam, “Microarray gene expression data classification via wilcoxon sign rank sum and novel grey wolf optimized ensemble learning models,” IEEE/ACM Trans. Comput. Biol. Bioinform., vol. 20, no. 6, pp. 3575–3587, Nov. 2023. doi: 10.1109/tcbb.2023.3305429. [Google Scholar] [PubMed] [CrossRef]
17. S. Rajathi and G. Radhamani, “Prediction and analysis of Rheumatic heart disease using kNN classification with ACO,” in 2016 Int. Conf. Data Mining Adv. Comput. (SAPIENCE), Ernakulam, India, 2016, pp. 68–73. doi: 10.1109/SAPIENCE.2016.7684132. [Google Scholar] [CrossRef]
18. N. Savita, G. Sharma, G. Rani, and V. S. Dhaka, “A review on machine learning techniques for prediction of cardiovascular diseases,” in 2020 Sixth Int. Conf. Parallel, Distributed Grid Comput. (PDGC), Waknaghat, India, Nov. 2020, pp. 237–242. doi: 10.1109/pdgc50313.2020.9315747. [Google Scholar] [CrossRef]
19. A. Saboor, M. Usman, S. Ali, A. Samad, M. F. Abrar and N. Ullah, “A method for improving prediction of human heart disease using machine learning algorithms,” J. Mob. Inf. Syst., vol. 2022, pp. 1–9, Mar. 2022. doi: 10.1155/2022/1410169. [Google Scholar] [CrossRef]
20. G. Choudhary and S. N. Singh, “Prediction of heart disease using machine learning algorithms,” in 2020 Int. Conf. Smart Technol. Comput., Electr. Electron. (ICSTCEE), Bengaluru, India, Oct. 2020, pp. 1–5. doi: 10.1109/icstcee49637.2020.9276802. [Google Scholar] [CrossRef]
21. B. P. Doppala, D. Bhattacharyya, M. Chakkravarthy, and T. -H. Kim, “A hybrid machine learning approach to identify coronary diseases using feature selection mechanism on heart disease dataset,” Distrib. Parallel Databases, vol. 41, pp. 1–20, Mar. 2021. doi: 10.1007/s10619-021-07329-y. [Google Scholar] [CrossRef]
22. P. Rani, R. Kumar, N. M. O. S. Ahmed, and A. Jain, “A decision support system for heart disease prediction based upon machine learning,” J. Reliab. Intell. Environ., vol. 7, no. 3, pp. 263–275, Jan. 2021. doi: 10.1007/s40860-021-00133-6. [Google Scholar] [CrossRef]
23. D. Panda, R. Ray, A. A. Abdullah, and S. R. Dash, “Predictive systems: Role of feature selection in prediction of heart disease,” J. of Phys. Conf. Ser., Int. Conf. Biomed. Eng., vol. 1372, no. 1, pp. 012074. doi: 10.1088/1742-6596/1372/1/012074. [Google Scholar] [CrossRef]
24. K. V. V. Reddy, I. Elamvazuthi, A. A. Aziz, S. Paramasivam, H. N. Chua and S. Pranavanand, “Heart disease risk prediction using machine learning classifiers with attribute evaluators,” Appl. Sci., vol. 11, no. 18, pp. 8352, Sep. 2021. doi: 10.3390/app11188352. [Google Scholar] [CrossRef]
25. M. S. Pathan, A. Nag, M. M. Pathan, and S. Dev, “Analyzing the impact of feature selection on the accuracy of heart disease prediction,” Healthc. Anal., vol. 2, pp. 100060, Nov. 2022. doi: 10.1016/j.health.2022.100060. [Google Scholar] [CrossRef]
26. R. Spencer, F. Thabtah, N. Abdelhamid, and M. Thompson, “Exploring feature selection and classification methods for predicting heart disease,” Digit. Health, vol. 6, Jan. 2020. doi: 10.1177/2055207620914777. [Google Scholar] [PubMed] [CrossRef]
27. R. R. Sarra, A. M. Dinar, M. A. Mohammed, and K. H. Abdulkareem, “Enhanced heart disease prediction based on machine learning and χ2 statistical optimal feature selection model,” Designs, vol. 6, no. 5, pp. 87, Sep. 2022. doi: 10.3390/designs6050087. [Google Scholar] [CrossRef]
Cite This Article
 Copyright © 2024 The Author(s). Published by Tech Science Press.
This work is licensed under a Creative Commons Attribution 4.0 International License , which permits unrestricted use, distribution, and reproduction in any medium, provided the original work is properly cited.
 Downloads
 Citation Tools