
 Submit a Paper
 Propose a Special lssue
 Open Access
ARTICLE
Emotion Detection Using ECG Signals and a Lightweight CNN Model
Department of Electronics and Telecommunication Engineering, Goa College of Engineering, Goa University, Ponda, 403401, India
* Corresponding Author: Amita U. Dessai. Email:
Computer Systems Science and Engineering 2024, 48(5), 1193-1211. https://doi.org/10.32604/csse.2024.052710
Received 12 April 2024; Accepted 15 July 2024; Issue published 13 September 2024
 View Full Text
 Download PDF
Abstract
Emotion recognition is a growing field that has numerous applications in smart healthcare systems and Human-Computer Interaction (HCI). However, physical methods of emotion recognition such as facial expressions, voice, and text data, do not always indicate true emotions, as users can falsify them. Among the physiological methods of emotion detection, Electrocardiogram (ECG) is a reliable and efficient way of detecting emotions. ECG-enabled smart bands have proven effective in collecting emotional data in uncontrolled environments. Researchers use deep machine learning techniques for emotion recognition using ECG signals, but there is a need to develop efficient models by tuning the hyperparameters. Furthermore, most researchers focus on detecting emotions in individual settings, but there is a need to extend this research to group settings as well since most of the emotions are experienced in groups. In this study, we have developed a novel lightweight one dimensional (1D) Convolutional Neural Network (CNN) model by reducing the number of convolution, max pooling, and classification layers. This optimization has led to more efficient emotion classification using ECG. We tested the proposed model’s performance using ECG data from the AMIGOS (A Dataset for Affect, Personality and Mood Research on Individuals and Groups) dataset for both individual and group settings. The results showed that the model achieved an accuracy of 82.21% and 85.62% for valence and arousal classification, respectively, in individual settings. In group settings, the accuracy was even higher, at 99.56% and 99.68% for valence and arousal classification, respectively. By reducing the number of layers, the lightweight CNN model can process data more quickly and with less complexity in the hardware, making it suitable for the implementation on the mobile phone devices to detect emotions with improved accuracy and speed.Keywords
Advancements in emotion recognition technology have enabled HCI systems to facilitate human-to-human interactions instead of just human-to-machine interactions [1]. Emotion results in psychological and physiological changes, influencing decision-making, and cognitive processes. Emotion recognition has the potential to be very beneficial in healthcare, e-learning, retail market analysis, gaming, driver assistance, recruitment, and the entertainment industry [1]. Patients’ emotions, such as stress, anger, and depression, can be detected in smart healthcare centers, enabling timely actions or medication recommendations. Emotion detection also benefits elderly care and surveillance systems in healthcare [2]. During the COVID-19 lockdown scenario, it was vital to remotely monitor patients’ emotions, such as stress, to prevent suicidal attempts and maintain social balance [3]. In a smart healthcare system, pain detection in babies and patients who cannot express themselves verbally is a priority to take timely actions and provide appropriate treatment [4]. Emotion detection can also help manage conditions such as autism, psycho-neural disorders, Parkinson’s disease, and sleep disorders like schizophrenia [1]. Moreover, the development of virtual emotion detection-based surveillance systems could be aimed at facilitating smart healthcare systems [5,6]. Affective Brain-Computer Interaction (BCI) involves communicating with BCI through emotions and aims to develop real-time emotional responses in BCI. The development of Affective BCI studies has been very beneficial to HCI systems, particularly for disabled and neuro-disordered patients. Earlier studies in Affective BCI focused on using a single modality, Electroencephalogram (EEG). However, multimodal emotion recognition systems that combine EEG with other modalities are more reliable [7]. Researchers used various methods to elicit emotions in test subjects, such as virtual reality, images, music, and videos [1]. Among these methods, videos are the most commonly used for emotion elicitation. Emotions are assessed by the subjects using techniques such as questionnaires and self-assessment manikins [8–10]. Physical signals such as facial expressions, voice signals [11], and biosignals such as EEG, electromyogram (EMG), respiration rate, photoplethysmography (PPG), galvanic skin response (GSR), ECG, and skin temperature are used to recognize emotions [1]. The subjects cannot consciously control physiological signals because they are activated unintentionally [12]. Smartwatches or smart fabrics can be used to collect physiological data from subjects in a mobile and unobtrusive environment [12]. Lin et al. [13] comprehensively reviewed emotion detection using EEG, ECG, GSR, and respiration rate and describe the various emotion models, emotion elicitation methods, datasets, features, and classification techniques. The ECG dataset is well-studied by many researchers for emotion recognition, and many publicly available datasets are available [1]. Public ECG datasets such as DEAP [14], MAHNOB [15], AMIGOS [16], and ASCERTAIN [17] are preferred by researchers over private ones for emotion detection [1]. The emotions are classified using the two-dimensional (2D) Valence Arousal model, as shown in Fig. 1 [1].
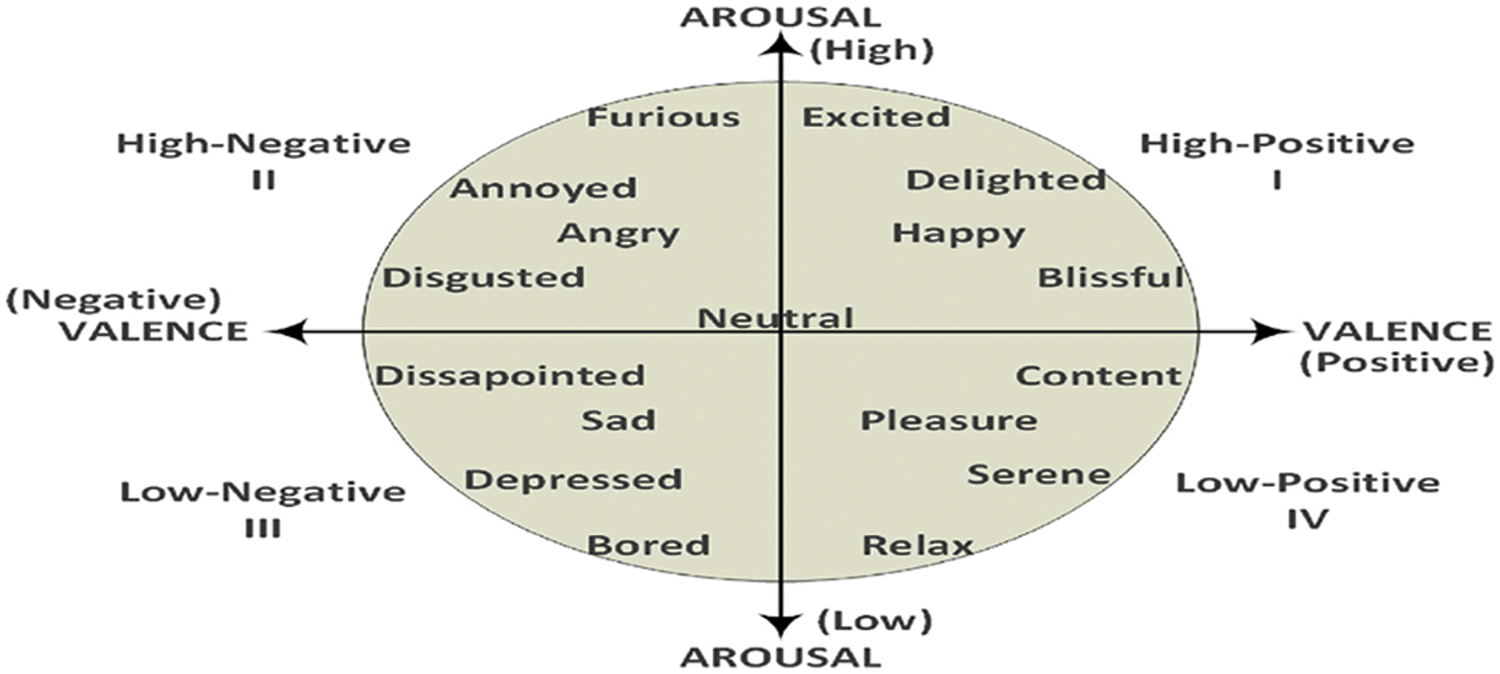
Figure 1: Valence Arousal model (reprinted from reference [1])
Classification of emotions has been highest using the 2D Valence Arousal model, followed by four-class discrete emotion classification [1]. Statistical features, such as time and frequency features [18], as well as wavelet features [19], are manually extracted for the best features to be selected and passed on to machine learning classifiers. Emotion detection employs machine learning models such as Random Forest (RF), K-Nearest Neighbor (KNN), Support Vector Machine (SVM), and Decision Trees (DT) [16–22]. Deep learning models such as Long Short-Term Memory, Recurrent Neural Networks, and CNN are also used for automatic feature extraction in emotion classification [23–25]. Manual feature extraction requires domain expertise and consumes a significant amount of time, whereas deep learning methods have complexity in architecture and computation, requiring longer training times [25]. In the Machine Learning taxonomy, SVM, and KNN are most efficient in ECG classification, while CNN is more common in the Deep Learning taxonomy [1]. ML and deep learning models have achieved reasonable accuracy, and validation is done for multiple datasets. However, there are some limitations in emotion recognition using ECG, such as uncertainty in performance and future research can focus on the usage of hyperparameter tuning and fusion techniques [1]. HCI systems are designed to enable humans to interact with machines more naturally and intuitively. Affective Computing techniques using deep learning have found applications in elderly care, pain detection, stress detection, surveillance systems, and healthcare systems. Deep Learning techniques such as 1D CNN systems are suitable for emotion detection using ECG data. However, the complexity and speed of the system can be improved by tuning the hyperparameters in the CNN model. Our study aims to enhance the performance of the CNN model for classifying emotions using ECG signals. We plan to achieve this by tuning the hyperparameters, such as the number of convolutional layers, filter sizes, max pooling, and dense layers, to improve the model’s accuracy. As a result, we contribute to the advancements in deep learning technology by developing a lightweight CNN model.
Our research work is motivated by several objectives:
• We are interested in contributing to the field of emotion intelligence, Affective computing, HCI, and healthcare, by developing a lightweight CNN model.
• We aim to create a model that can be easily integrated into smart healthcare systems for practical usage.
• We aim to explore emotions in social contexts. This is because many emotions are experienced in groups rather than in isolation.
• We aim to improve emotion classification accuracy in individual and group settings using lightweight CNN model.
The study’s research contributions are as follows:
• The creation of a novel lightweight CNN model with fewer layers, reduced complexity, and improved speed for emotion classification using ECG signals.
• An increase in the accuracy of emotion classification using ECG and CNN model for both individual and group settings of the participants. We believe that our study is the first to use 1D CNN for group classification in social contexts with ECG data.
• A valuable contribution to the fields of Affective computing, HCI, and healthcare through the development of this novel algorithm.
• The validation of the model’s performance for both individual and group settings.
This section briefly explains the literature on emotion classification using machine learning techniques and 1D CNN models. Ferdinando et al. [26] conducted a study on classifying emotions using ECG signals from the MAHNOB database. They extracted features using bivariate empirical mode decomposition and used dimensionality reduction techniques to convert high dimension feature space to lower dimension feature space. They trained the K-Nearest Neighbor (KNN) Machine Learning (ML) classifier using the extracted features and performed ten-fold cross-validation. The best results obtained were 64.1% for valence and 66.1% for arousal by using Neighborhood Components Analysis. Lin et al. [27] collected heart rate data collected from 25 healthy subjects, between the ages of 22–25 years. These subjects were free from psychiatric illnesses, medications, and alcoholism. The data was collected using a wearable smart bracelet. A total of 53 features were extracted, and the best features were selected using the Selectkbest method. Five ML classifiers, such as KNN, RF, DT, Gradient Boost DT (GBDT), and Adaboost, were trained. Cross-validation was performed using the Leave-One-Subject-Out method. Among the classifiers, GBDT exhibited the highest accuracy of 84% while classifying happy and sad emotions [27]. The ECG data is collected through a non-contact data acquisition system. The signal is then processed, converted to digital form, and transmitted to a computer via a Bluetooth module. To induce emotions, video clips are shown to participants of diverse work cultures. Time and frequency features, along with correlation features, are extracted from the collected data. The Max-Min Ant System technique is used to optimize the selected features. KNN, SVM, and DT classifiers are employed for classification. The experiments were conducted using only time-frequency features, correlation features, and a combination of both. The KNN classifier, with correlation features, outperformed the other experiments, achieving an accuracy of 91% for Happy, 90% for Sad, 88% for Pleasant, and 97% for Angry emotions [28]. Bulagang et al. [21] conducted a study on emotions by collecting heart rate data from 20 healthy participants aged 20 to 28 years old, who had no prior heart issues. They used Empatica E4 wristbands to collect the data while the participants watched 360-degree emotional videos. The videos belonged to the four quadrants of the Russel’s model. They classified the emotions into four classes using KNN, RF, and SVM classifiers. In a study conducted by Sun et al. [29], ECG data was collected to correspond to various emotions including calm, excited, happy, and tense. The data was collected using iRealcare, which can transmit data through the smartphone. Calm emotion was recorded when subjects were in a normal state, excited emotion was recorded while exercising, happy emotion was recorded while watching comedy movies, and tense emotion was recorded while watching thriller movies. The ECG signal noise was filtered using the finite impulse filter with frequencies ranging from 3 to 100 Hz. The frequency domain discrete cosine transform method was used to extract features from the ECG data. The emotions were classified using SVM, RF, and KNN. With the Particle Swarm Optimization technique, SVM yielded the highest accuracy of 90.51%, while KNN and RF gave 82.48% and 81.70% accuracy, respectively. Sayed Ismail et al. [30] conducted a comparative study on numerical 1D ECG data and ECG data in the form of two-dimensional images. They converted the 1D ECG data from the DREAMER dataset into images and performed emotion classification. Feature extraction was carried out separately for numerical and image data. They used LDA for dimensionality reduction and SVM for classification. For the 1D data, they obtained a valence accuracy of 65.06% and an arousal accuracy of 57.83%. For the images, they achieved a valence accuracy of 62.35% and an arousal accuracy of 59.64%. These results prove that both forms of ECG signals are suitable for classification. Alam et al. [31] obtained ECG signals from 45 individuals. The signals were recorded while the participants were watching videos. They extracted ten statistical features from the ECG signals, performed ten-fold cross-validation, and used SVM and RF classifiers to classify the ECG signals based on emotions. The results showed that the SVM classifier had a classification accuracy of 86.6%, while the RF classifier had an accuracy of 98.2%. The authors of the study [32] implemented the multi-filtering augmentation technique to improve the classification accuracy of ECG data using the KNN, RF classifier on A2ES, AMIGOS, and DREAMER datasets. KNN classifier outperformed the results. Dessai et al. classified emotions using the early fusion of ECG and GSR signals and validated the results using the various ML classifiers such as SVM,KNN, RF, and DT [22].
Furthermore, various CNN models have been used to detect emotions through ECG data in multiple studies. Khare et al. have reviewed emotion recognition using EEG, GSR, and ECG signals from one hundred and forty-two journal articles using PRISMA guidelines [1]. Dar et al. [33] employed Z score normalization to normalize the ECG data from the AMIGOS dataset. The output is classified into four classes: HALV, LVHA, LVLA, and HVHA, and achieved an accuracy of 98.73% using a CNN LSTM model. Santamaria-Granados et al. [23] preprocessed ECG data from the AMIGOS database and classified it into four categories: HALV, LVHA, LVLA, and HVHA, and achieved 81% arousal accuracy and 71% valence accuracy. Sarkar et al. [34] proposed a deep multi-task learning model for emotion recognition based on ECG data, which utilizes a self-supervised learning approach, the convolutional layers are kept frozen while the dense layers are trained with labeled ECG data. This self-supervised learning approach significantly improves the performance of the network when compared to a network trained using fully-supervised learning. The accuracy rates obtained are as follows: AMIGOS = 78.95%, DREAMER = 76.00%, WESAD = 95.00%, and SWELL = 92.30%. Chen et al. [35] proposed a multi-input deep convolutional neural network structure that utilizes multi-modal physiological signals to automatically extract features and classify emotions using the GSR, ECG, and respiratory signals from 52 participants. Lee et al. [36] used PPG data from the DEAP database to classify emotions into valence and arousal. They obtained classification accuracies of 82.10% and 80.90%, respectively, by combining statistical features and CNN features in a neural network. Jin et al. [37] introduced a new PPG dataset for emotional analysis and used a 1D CNN with time and frequency domain features for feature extraction. The extracted features were concatenated and passed to two dense layers via a flattened layer. The network was trained with an Adam optimizer for 200 epochs and achieved a maximum accuracy of 75.16% with an LSTM layer. Han et al. [38] proposed a real-time emotion recognition approach using physiological signals (PPG and EMG) and a CNN to extract common features. Salih et al. [39] applied a deep fully connected neural network on the Dreamer dataset and obtained 93.90% and 97.56% accuracy for valence and arousal, respectively. Timothy et al. [40] used a temporal CNN model on the DREAMER dataset and obtained an accuracy of 98.68% for arousal and 97.37% for valence. Dessai et al. [41] obtained a classification accuracy of 91.27% and 91.45% for valence and arousal, respectively, using the InceptionResnetV2 2D CNN classifier. Rahim et al. [42] used AlexNet for emotion classification using ECG data and obtained a classification accuracy of 91.5% for ECG data from the AMIGOS dataset. Previous literature studies have focused on individual settings only, while our study aims to develop a less complex and faster CNN model with a reduced number of layers for emotion classification in group settings of participants as well.
The methodology for ECG-based emotion classification is explained in Fig. 2.
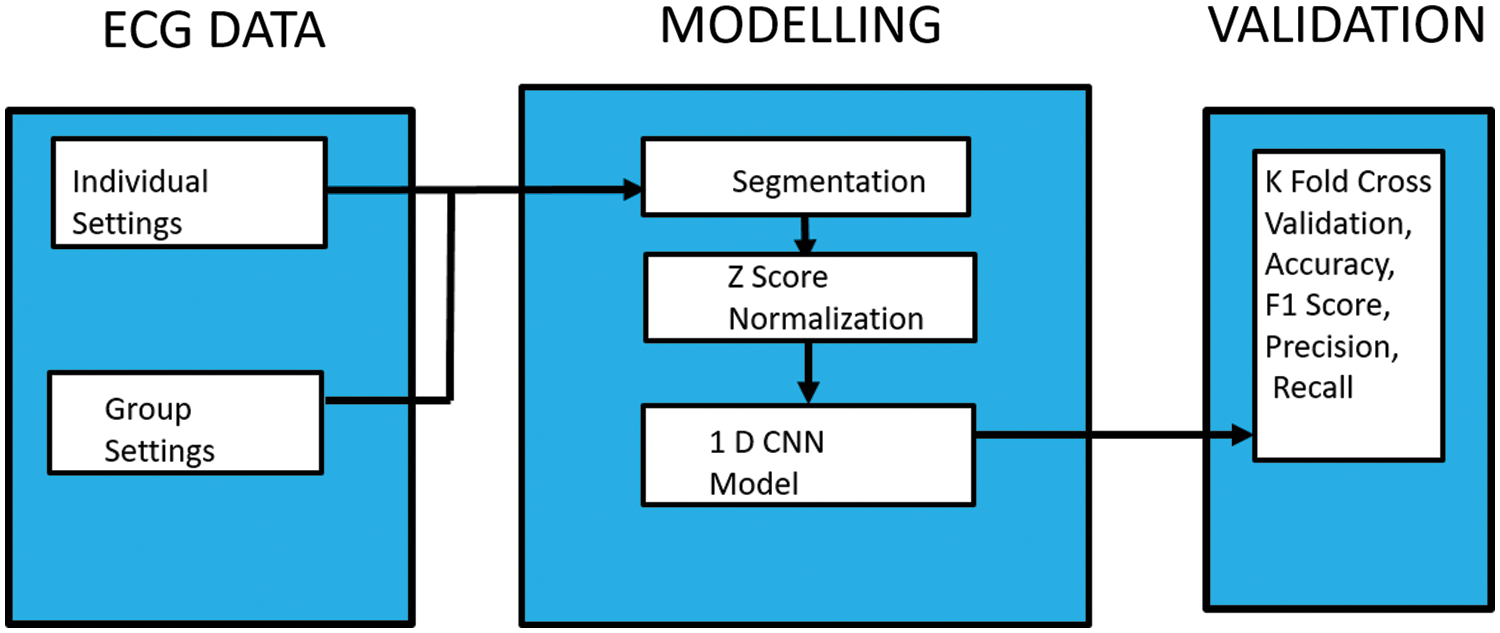
Figure 2: Block diagram of the proposed methodology
The input ECG data is segmented, preprocessed using Z score normalization, and classified using the 1D CNN model. Performance measures such as Accuracy, Precision, Recall, and Confusion matrices are computed. Further details are explained below.
Emotion classification is done using the ECG data from the AMIGOS dataset [16] in both the individual settings and group settings. The AMIGOS dataset is a publicly available database that contains ECG data of forty healthy adults, including thirteen females, aged from twenty-one to forty years. The ECG data was collected using the Shimmer sensor with a reference electrode placed on the left ankle and two other electrodes on the right and left arm. The ECG data was obtained at a sampling frequency of 256 Hz [16]. ECG signal is shown in Fig. 3 [43] and consists of PQRST waves.
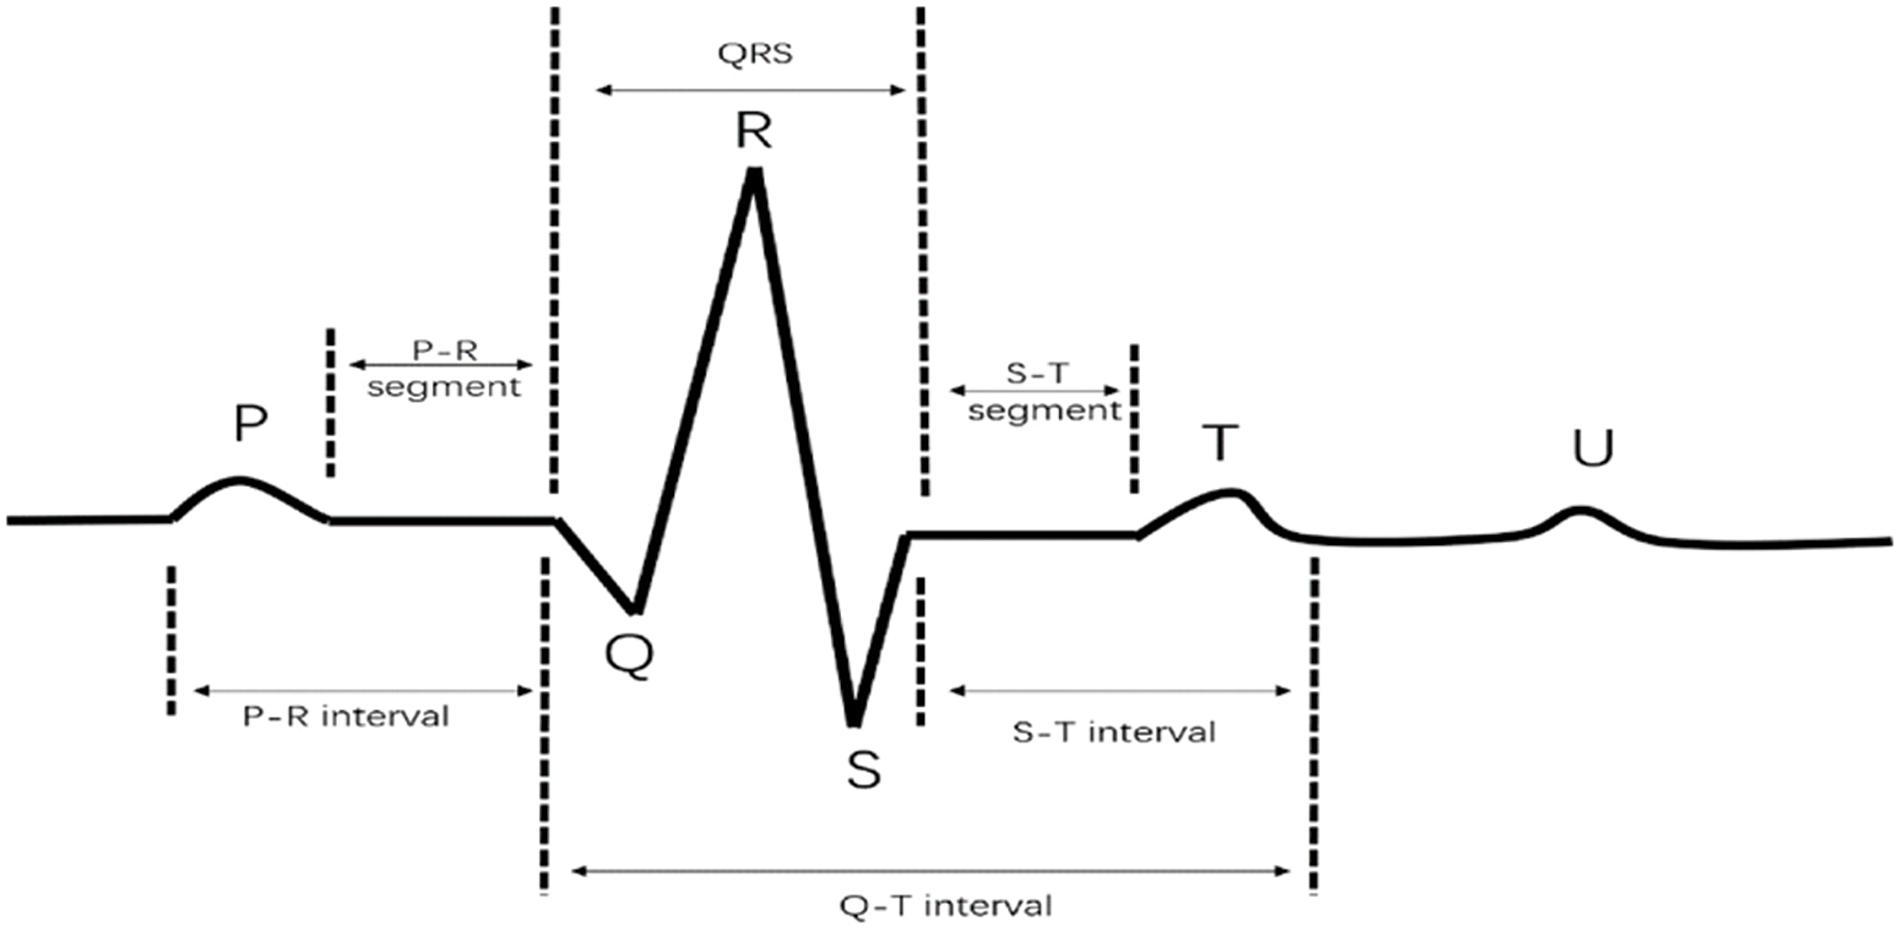
Figure 3: ECG waveform (reprinted from reference [43])
• Scenario 1, Individual Settings using short video data (Non-social context).
The AMIGOS dataset [16] contains data from forty individuals who individually watched sixteen short videos of duration less than 250 s. For this study, data from four videos (video 1 (HVLA), video 6 (LVLA), video 8 (LVHA), and video 12 (HVHA)) [16] were considered, each representing a different quadrant of Russell’s model. The valence classification uses data of videos 6 and 12 and the arousal classification uses data of videos 1 and 12 [16].
• Scenario 2, Group Settings using long video data (Social context).
The data from the AMIGOS dataset [16] was collected in a group setting with five groups of four people. The subjects watched long videos of a duration greater than sixteen min. Videos 17–20 represent these long videos [16]. The group valence classification uses data from videos 18 and 19 and the group arousal classification uses data of videos 17 and 20 [16].
The ECG signal is divided into segments of 200 sampling points, with the peaks used as fiducial points for QRS complex detection. In Scenario 1, for individual classification, a total of 2720 samples are obtained, with one class having 1360 samples. In Scenario 2, for group classification, each class has 1377 samples, and there are 2754 samples for two classes.
The data is preprocessed using Z score normalization [33] to reduce the variation in training data and improve the CNN model’s performance.
One-dimensional (1D) CNNs are suitable for time series data such as ECG signals. Convolutional Neural Networks work by performing feature extraction using convolution operations between the input data and filters. The number of filters and filter sizes are fixed in the convolutional layers. The filters slide over the input data and the convolution operation is performed between the filter data and input data [44]. The max pooling layer reduces the dimensionality of the input data, preserving the most essential features based on the maximum value across the filter dimension. The pooled feature map is then converted into a vector with the help of a flattened layer. Finally, fully connected layers are used to classify the extracted features [45]. In this work, we have developed a CNN model as shown in Fig. 4 with two convolutional layers, one max pooling layer, and one fully connected layer.
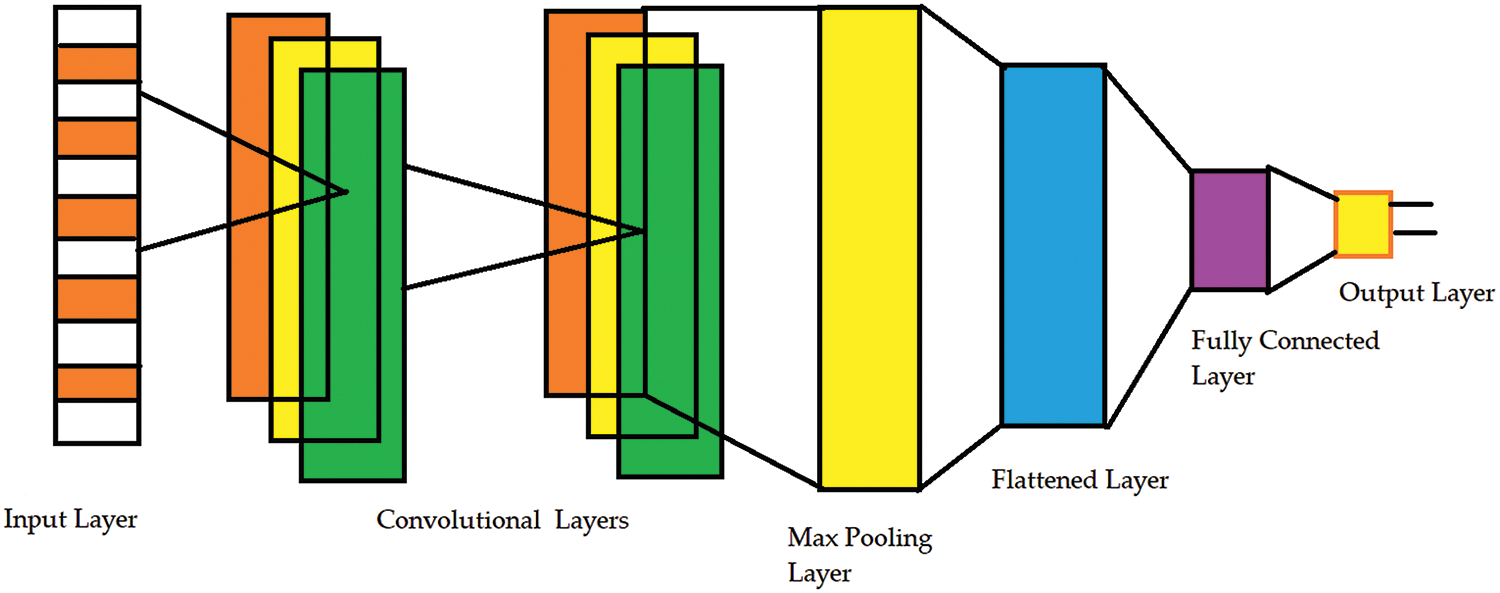
Figure 4: 1D CNN architecture
The proposed CNN model uses an input data size of 200 with 64 filters in the first convolutional layer. In the next CNN layer, 80 filters are used for convolution. Furthermore, the input data is normalized in a batch size of 80. The batch normalization helps to reduce the variations within the input data. After passing through the max pooling layer, the feature map is reduced to 100. The features are automatically extracted with the help of the convolution layers and pooling layers in the CNN model. Relu Activation function is used that helps to avoid the vanishing gradient problem.The flattened layer produces a vector of size 8000, which is then fed to the fully connected layer (dense layer) for classification. In the dense layer, all neurons are fully connected. The classification is carried out with the help of the softmax classifier and the softmax activation function. This function transforms the input vector of p numbers into a probability distribution of p potential outcomes. This provides the probability distribution of the classes, and the class with the highest probability is considered as the predicted class. To prevent overfitting, a dropout rate of 0.3 is employed for regularization. During training, the trainable parameters are updated with backpropagation, while non-trainable parameters remain static. The model is trained using 80 epochs. The hyperparameters such as number of layers, filter sizes, number of filters, batch size, number of epochs are varied till the model achieves the optimum performance in terms of classification. The parameters indicating the best performance are then finalized.
To improve the performance of a model, the training dataset is split into K folds, and each fold is validated separately as shown in Fig. 5 [46]. The validation accuracy is then calculated based on the average accuracy of all the folds. By using this method, the model’s performance can be more accurately validated.
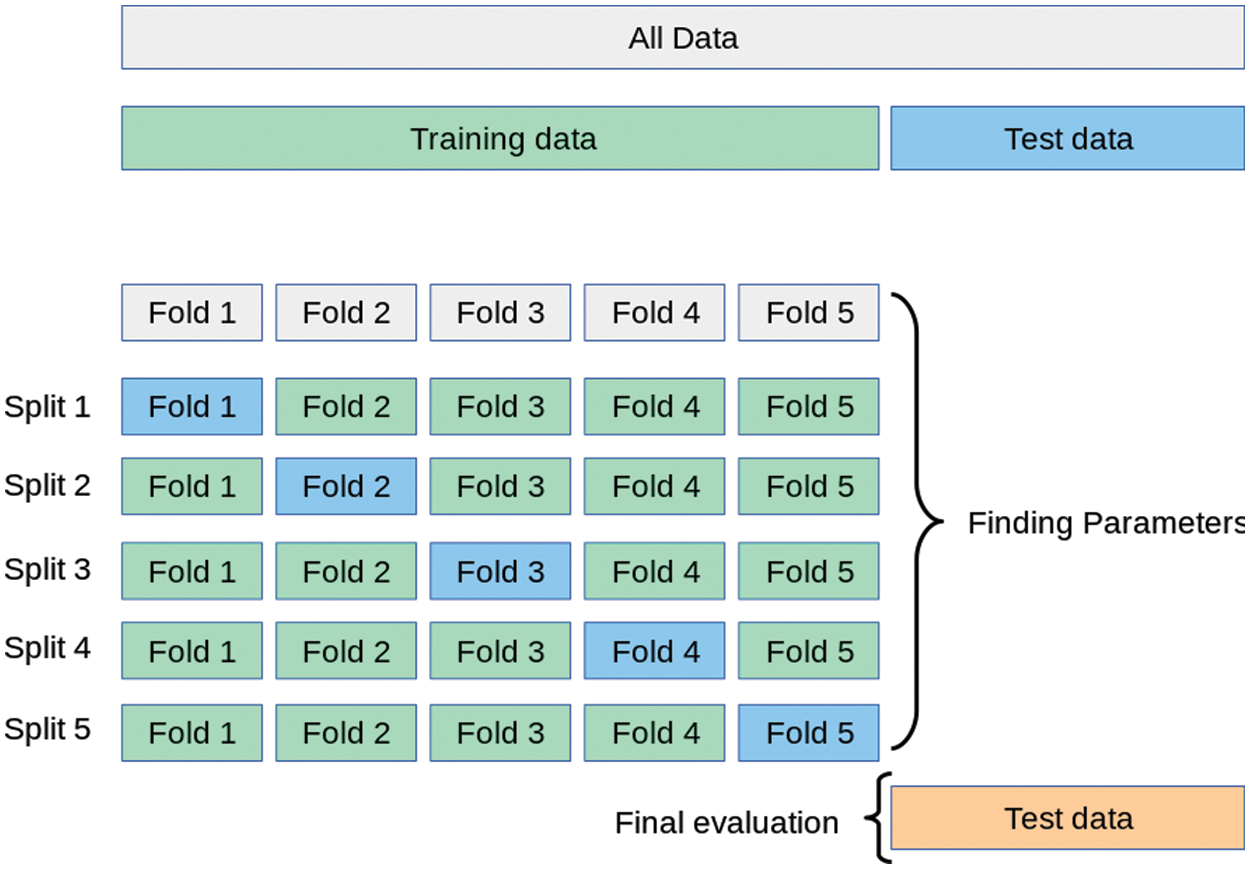
Figure 5: K fold cross validation (reprinted from reference [46])
In this study, the dataset has been divided into two parts: 70% for training and 30% for testing. Additionally, the training dataset is further split into seven folds using the cross-validation technique [47]. In Scenario 1, 816 samples were used for testing, while Scenario 2 used 827 samples for testing. The average accuracy of all seven folds is obtained, and testing is performed on the test data. We used Python software to implement the methodology.
The performance of the lightweight CNN model has been tested on ECG data from the AMIGOS dataset for two different scenarios: individual settings and group settings. Seven-fold cross-validation accuracy, Precision, Recall, F1 score, and confusion matrices have been obtained to validate the model’s performance. Additionally, training and validation accuracy and loss plots have been generated. When the predicted class is positive and the actual class is also positive, it is considered a true positive (TP). Similarly, when the predicted class is negative and the actual class is also negative, it is considered a true negative (TN). On the other hand, if the predicted class is positive but the actual class is negative, it is considered a false positive (FP). And, if the predicted class is negative but the actual class is positive, it is considered a false negative (FN). Accuracy is defined as the ratio of the total correctly predicted outcomes (TP and TN) to the total number of cases (TP, TN, FP, and FN). Precision is the ratio of TP to the total number of predicted positives (TP and FP). Recall, on the other hand, is the ratio of TP to the total number of actual positives (TP and FN). Finally, F1 score is a measure of a model’s accuracy that takes both Precision and Recall into account. It is defined as the ratio of twice the product of Precision and Recall to the sum of Precision and Recall [41]. The confusion matrix is shown in the Fig. 6 [48].
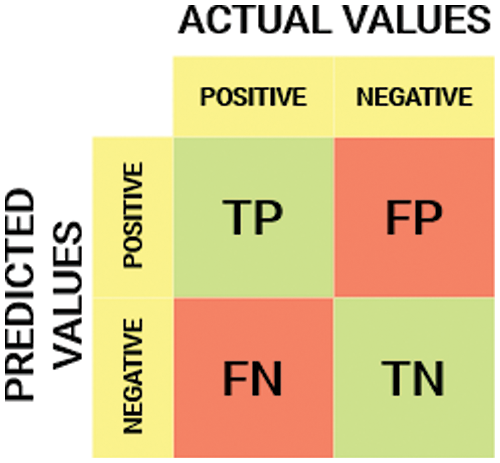
Figure 6: Confusion matrix (reprinted from reference [48])
Quantitatively the Accuracy, Precision, Recall, and F1 score can be computed from the confusion matrix using the Eqs. (1)–(4) respectively as indicated below:
The emotion classification model may misclassify many emotions. Performance parameters such as Accuracy, Precision, Recall, and F1 score, obtained from the confusion matrix, provide an overview of the model’s classification task performance.
The seven-fold cross-validation accuracy obtained for valence classification is shown in Table 1, and Fig. 6 in individual, and group settings.
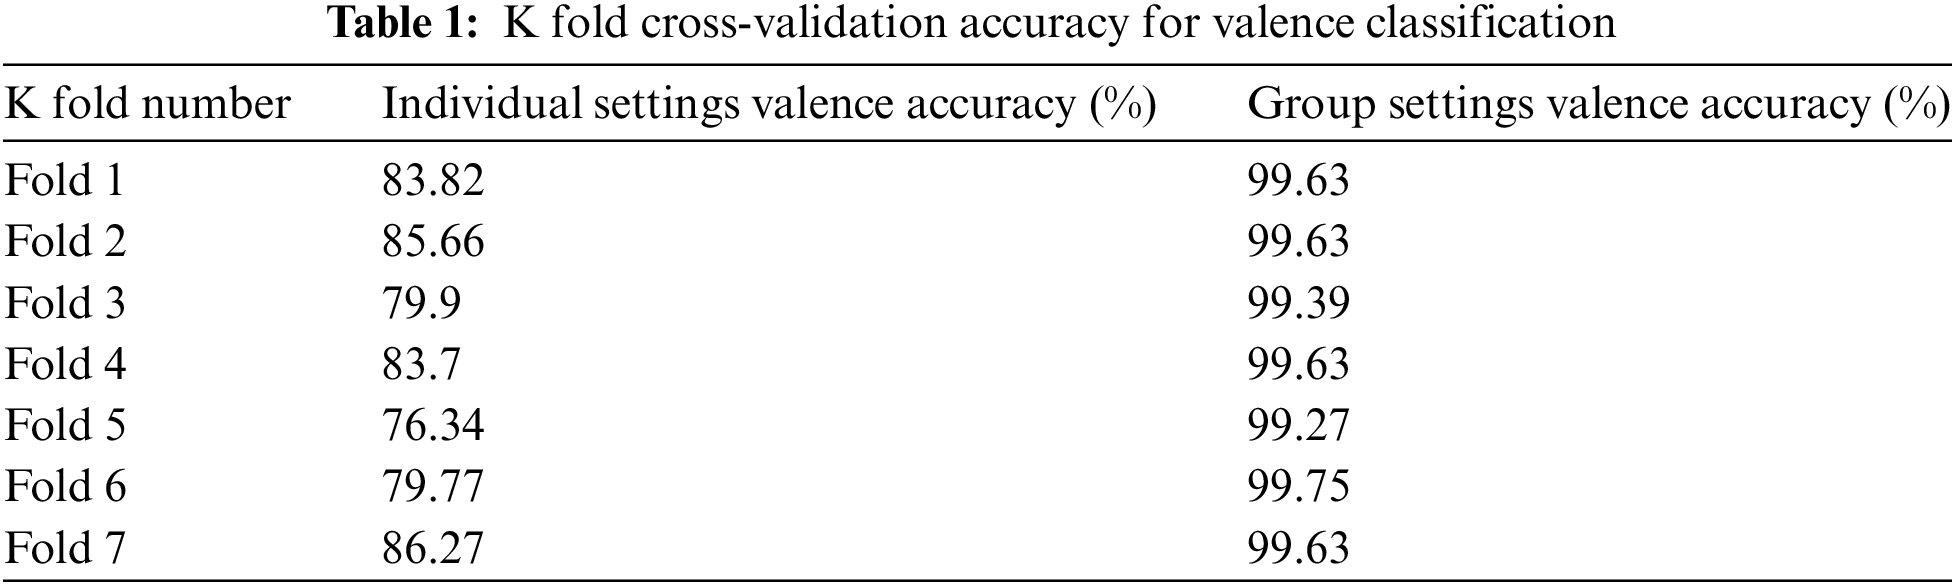
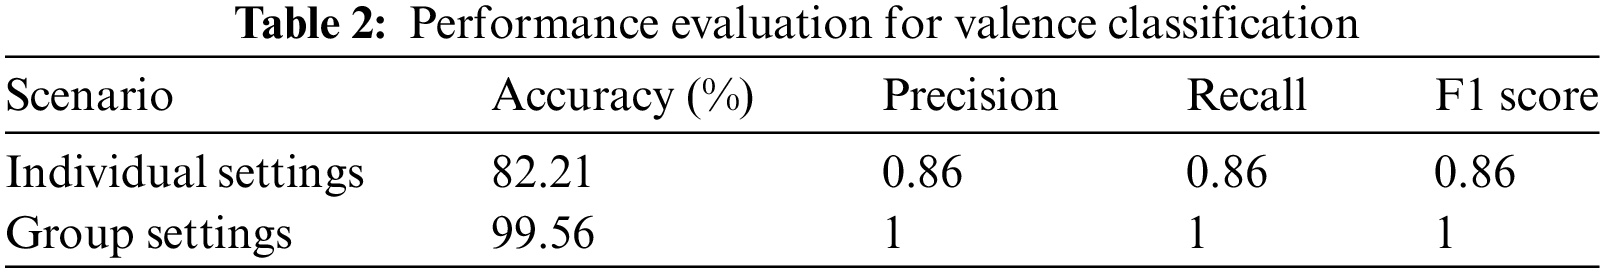
Table 1 indicates that the accuracy of the model varies between 76.34% and 86.27% for individual settings. However, for the group settings, the accuracy is consistently around 99% for all folds. This indicates that the model has performed well across all the folds for valence classification and has delivered reasonable results. The K fold cross-validation accuracy is useful for determining the best and worst case scenarios. For valence classification in individual settings, the worst case accuracy is 76.34% and the best case accuracy is 86.27%, as presented in Table 1. Table 2 indicates the performance measures for valence classification in terms of Precision, Recall, and F1 score in individual, and group settings. The average accuracy for valence classification is 82.21% for individual settings and 99.56% for group settings. Precision, Recall, and F1 score values are 0.86 and 1 for individual settings and group settings, respectively. The model’s Precision, Recall, and F1 score values in Table 2 confirm its performance in line with its accuracy.
The matrices indicate the suitable performance of the model for valence classification in both scenarios. Similarly, the seven-fold cross-validation accuracy obtained for arousal classification is shown in Table 3 and Fig. 7. The accuracy of the model varies between 82.59% and 90.56% for individual settings. However, for the group settings, the accuracy is consistently around 99% for all folds. This indicates that the model has performed well across all the folds for arousal classification.
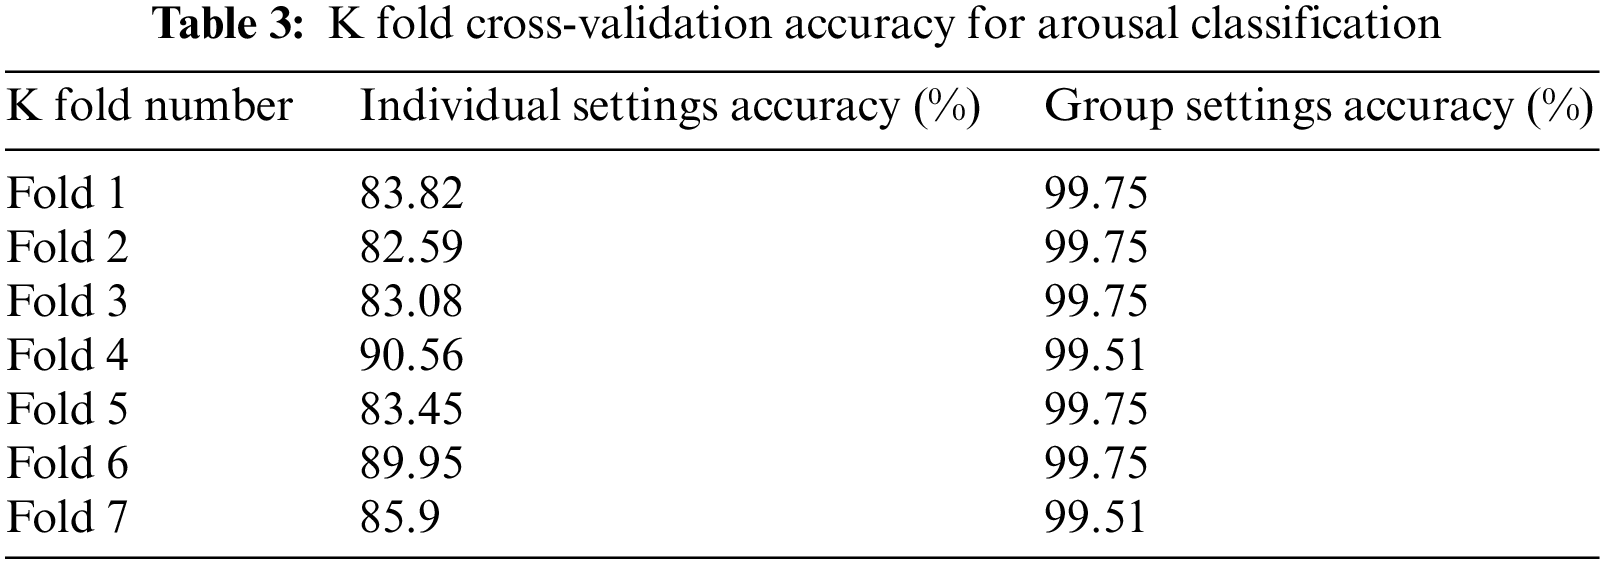
Figure 7: K fold cross validation arousal accuracy
For arousal classification in individual settings, the worst-case accuracy is 82.59% and the best-case accuracy is 90.56%, as presented in Table 3.
Table 4 indicates the performance measures for arousal classification regarding the average accuracy, Precision, Recall and F1 score.

The average accuracy for arousal classification is 85.62% for individual settings and 99.68% for group settings. Precision, Recall, and F1 score values are 0.86 and 1 for individual setting and group setting, respectively. The model’s Precision, Recall, and F1 score values in Table 4 validate the performance of the model by its accuracy. Thus the performance measures indicate the suitable performance of the model for arousal classification in both scenarios.
Table 5 and Fig. 8 indicate the Valence Arousal accuracy comparison for the individual and group settings. This proves the model performs equally well for valence and arousal classification in both settings.
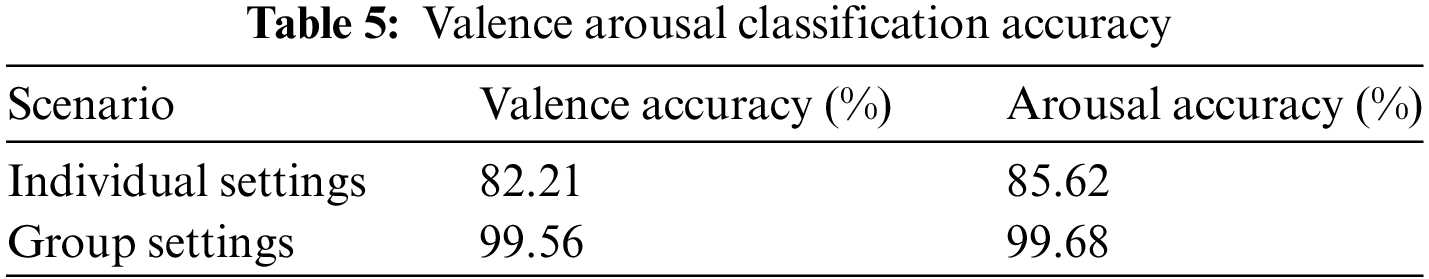
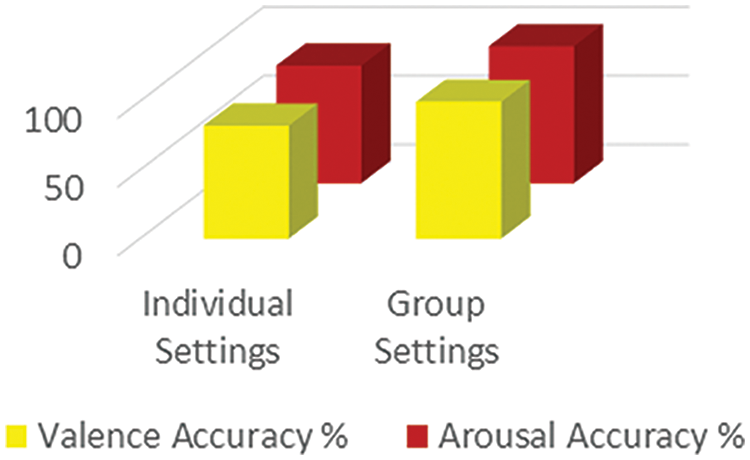
Figure 8: Valence arousal classification accuracy
Fig. 9 indicates the Confusion matrix for individual setting for valence classification and Fig. 10 indicates the Confusion matrix for group setting for valence classification.
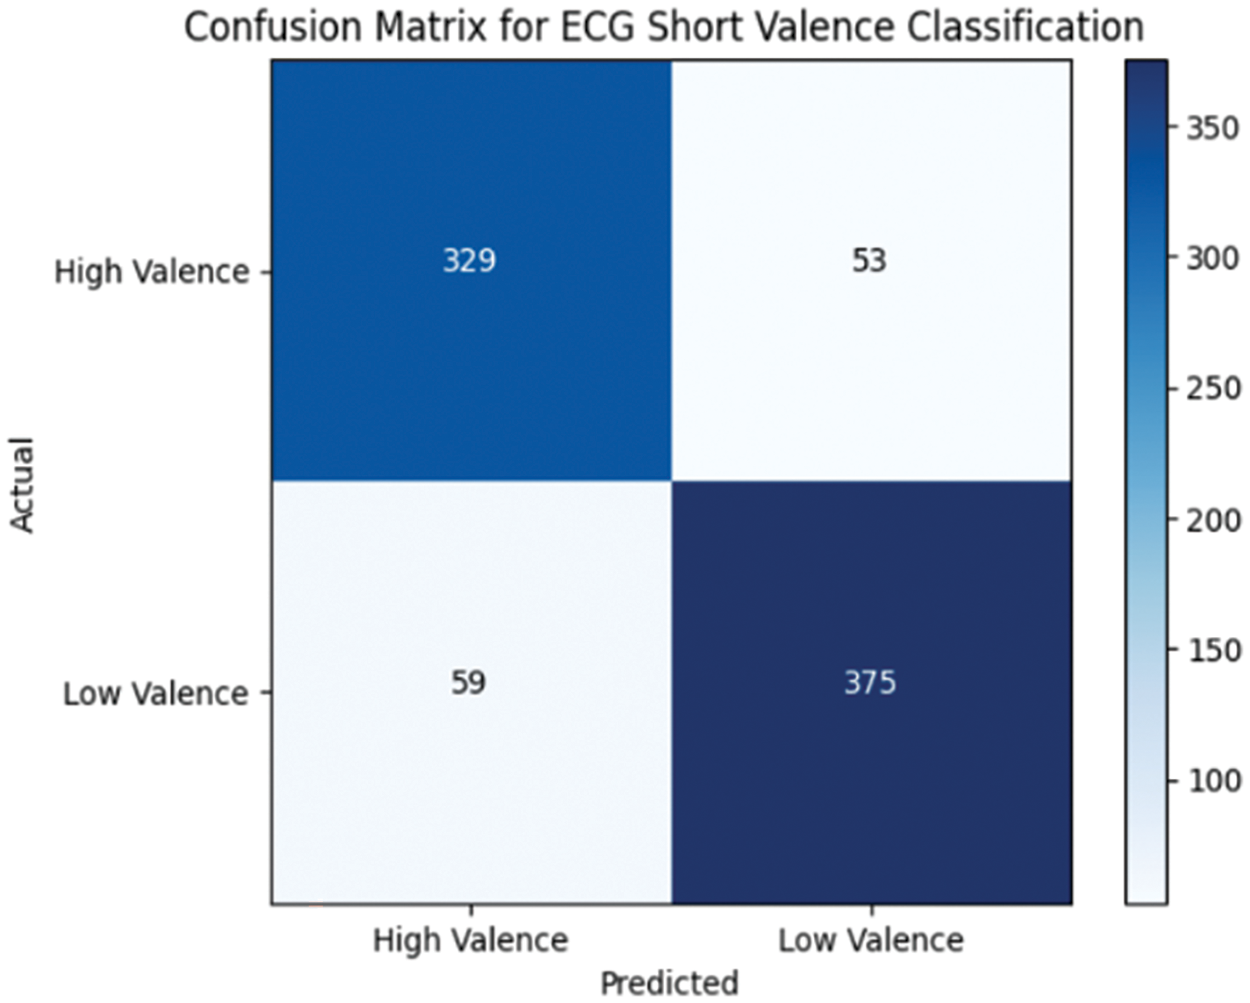
Figure 9: Confusion matrix for valence individual setting

Figure 10: Confusion matrix for valence group setting
Figs. 11 and 12 show the confusion matrices for arousal classification in individual and group settings.
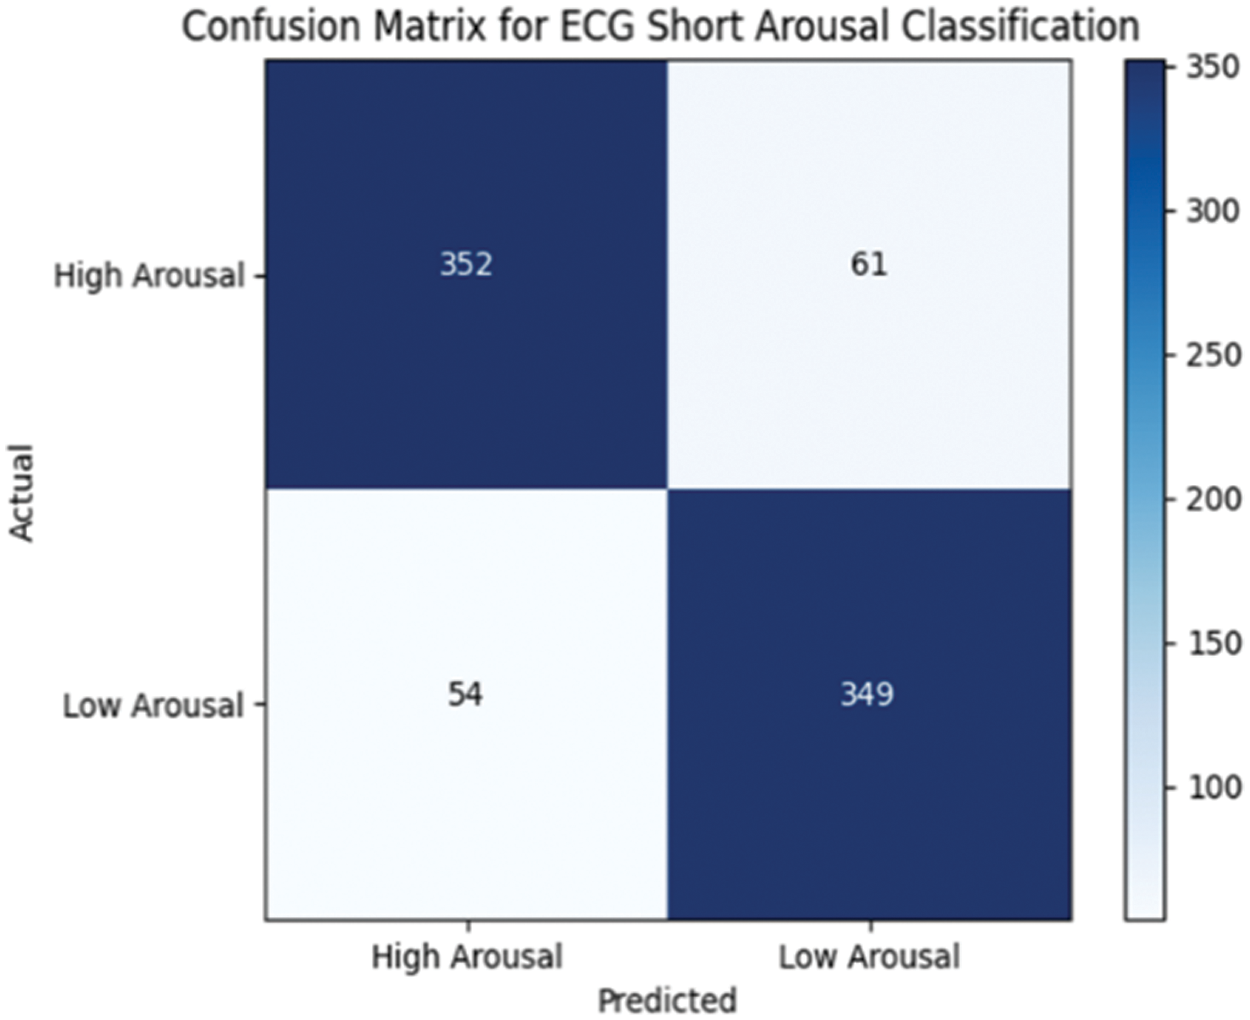
Figure 11: Confusion matrix for arousal individual settings
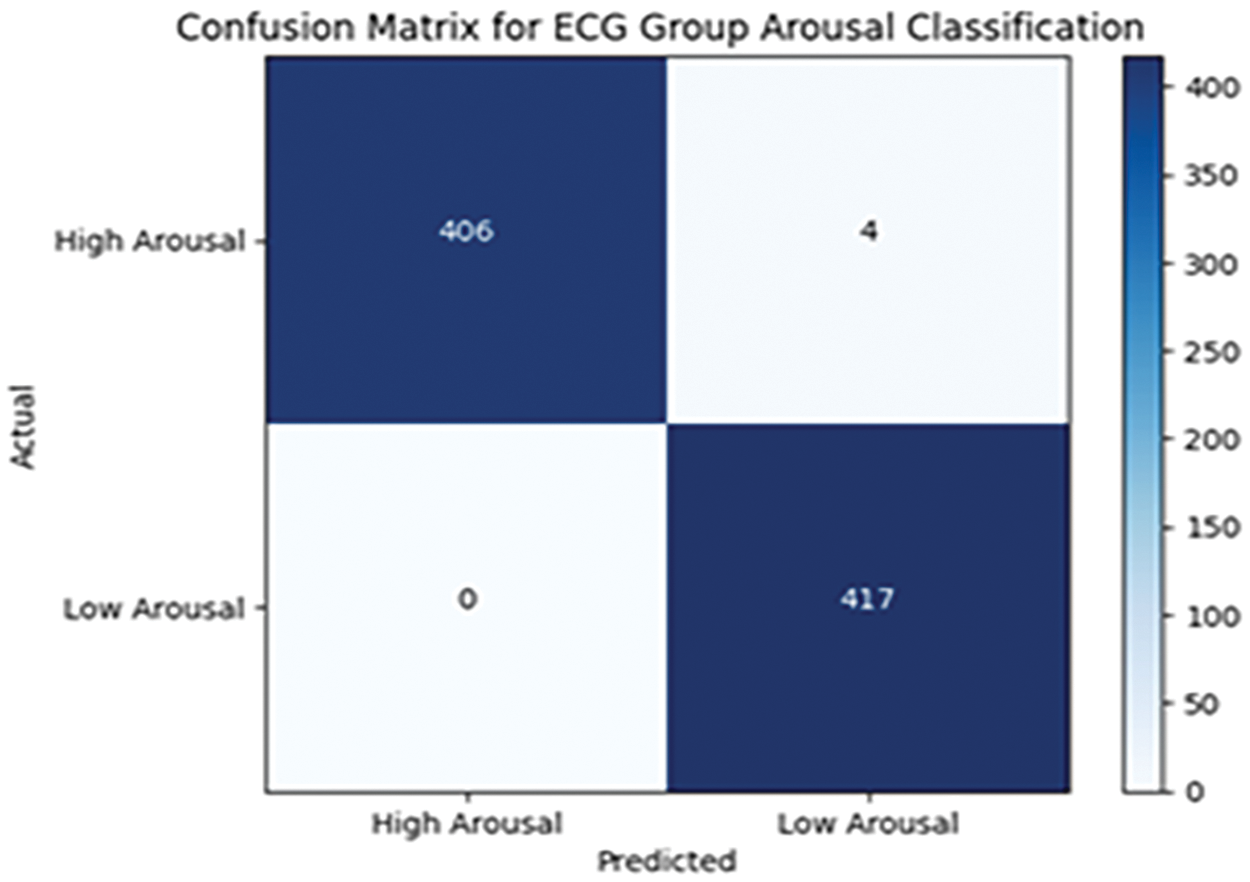
Figure 12: Confusion matrix for arousal group settings
The confusion matrices further validate the Precision, Recall, and F1 score. Fig. 13 indicates the training and validation accuracy plot for the individual setting and Fig. 14 for the group settings.
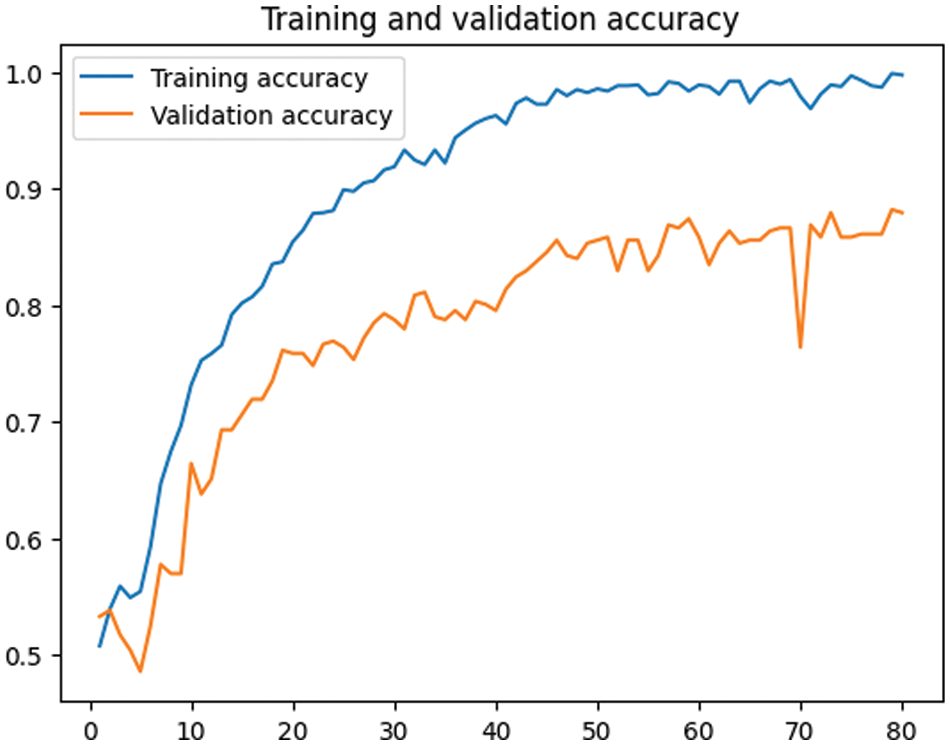
Figure 13: Accuracy plot for individual settings
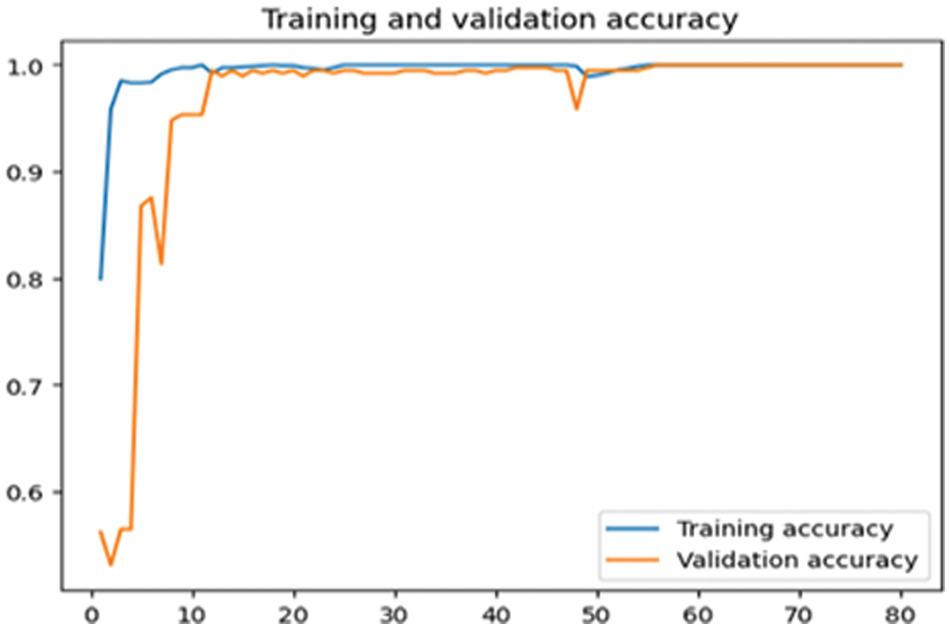
Figure 14: Accuracy plot for group settings
The training and validation accuracy indicate similar performance, proving the suitability of the model. Table 6 gives a comparison with the other works in the literature.
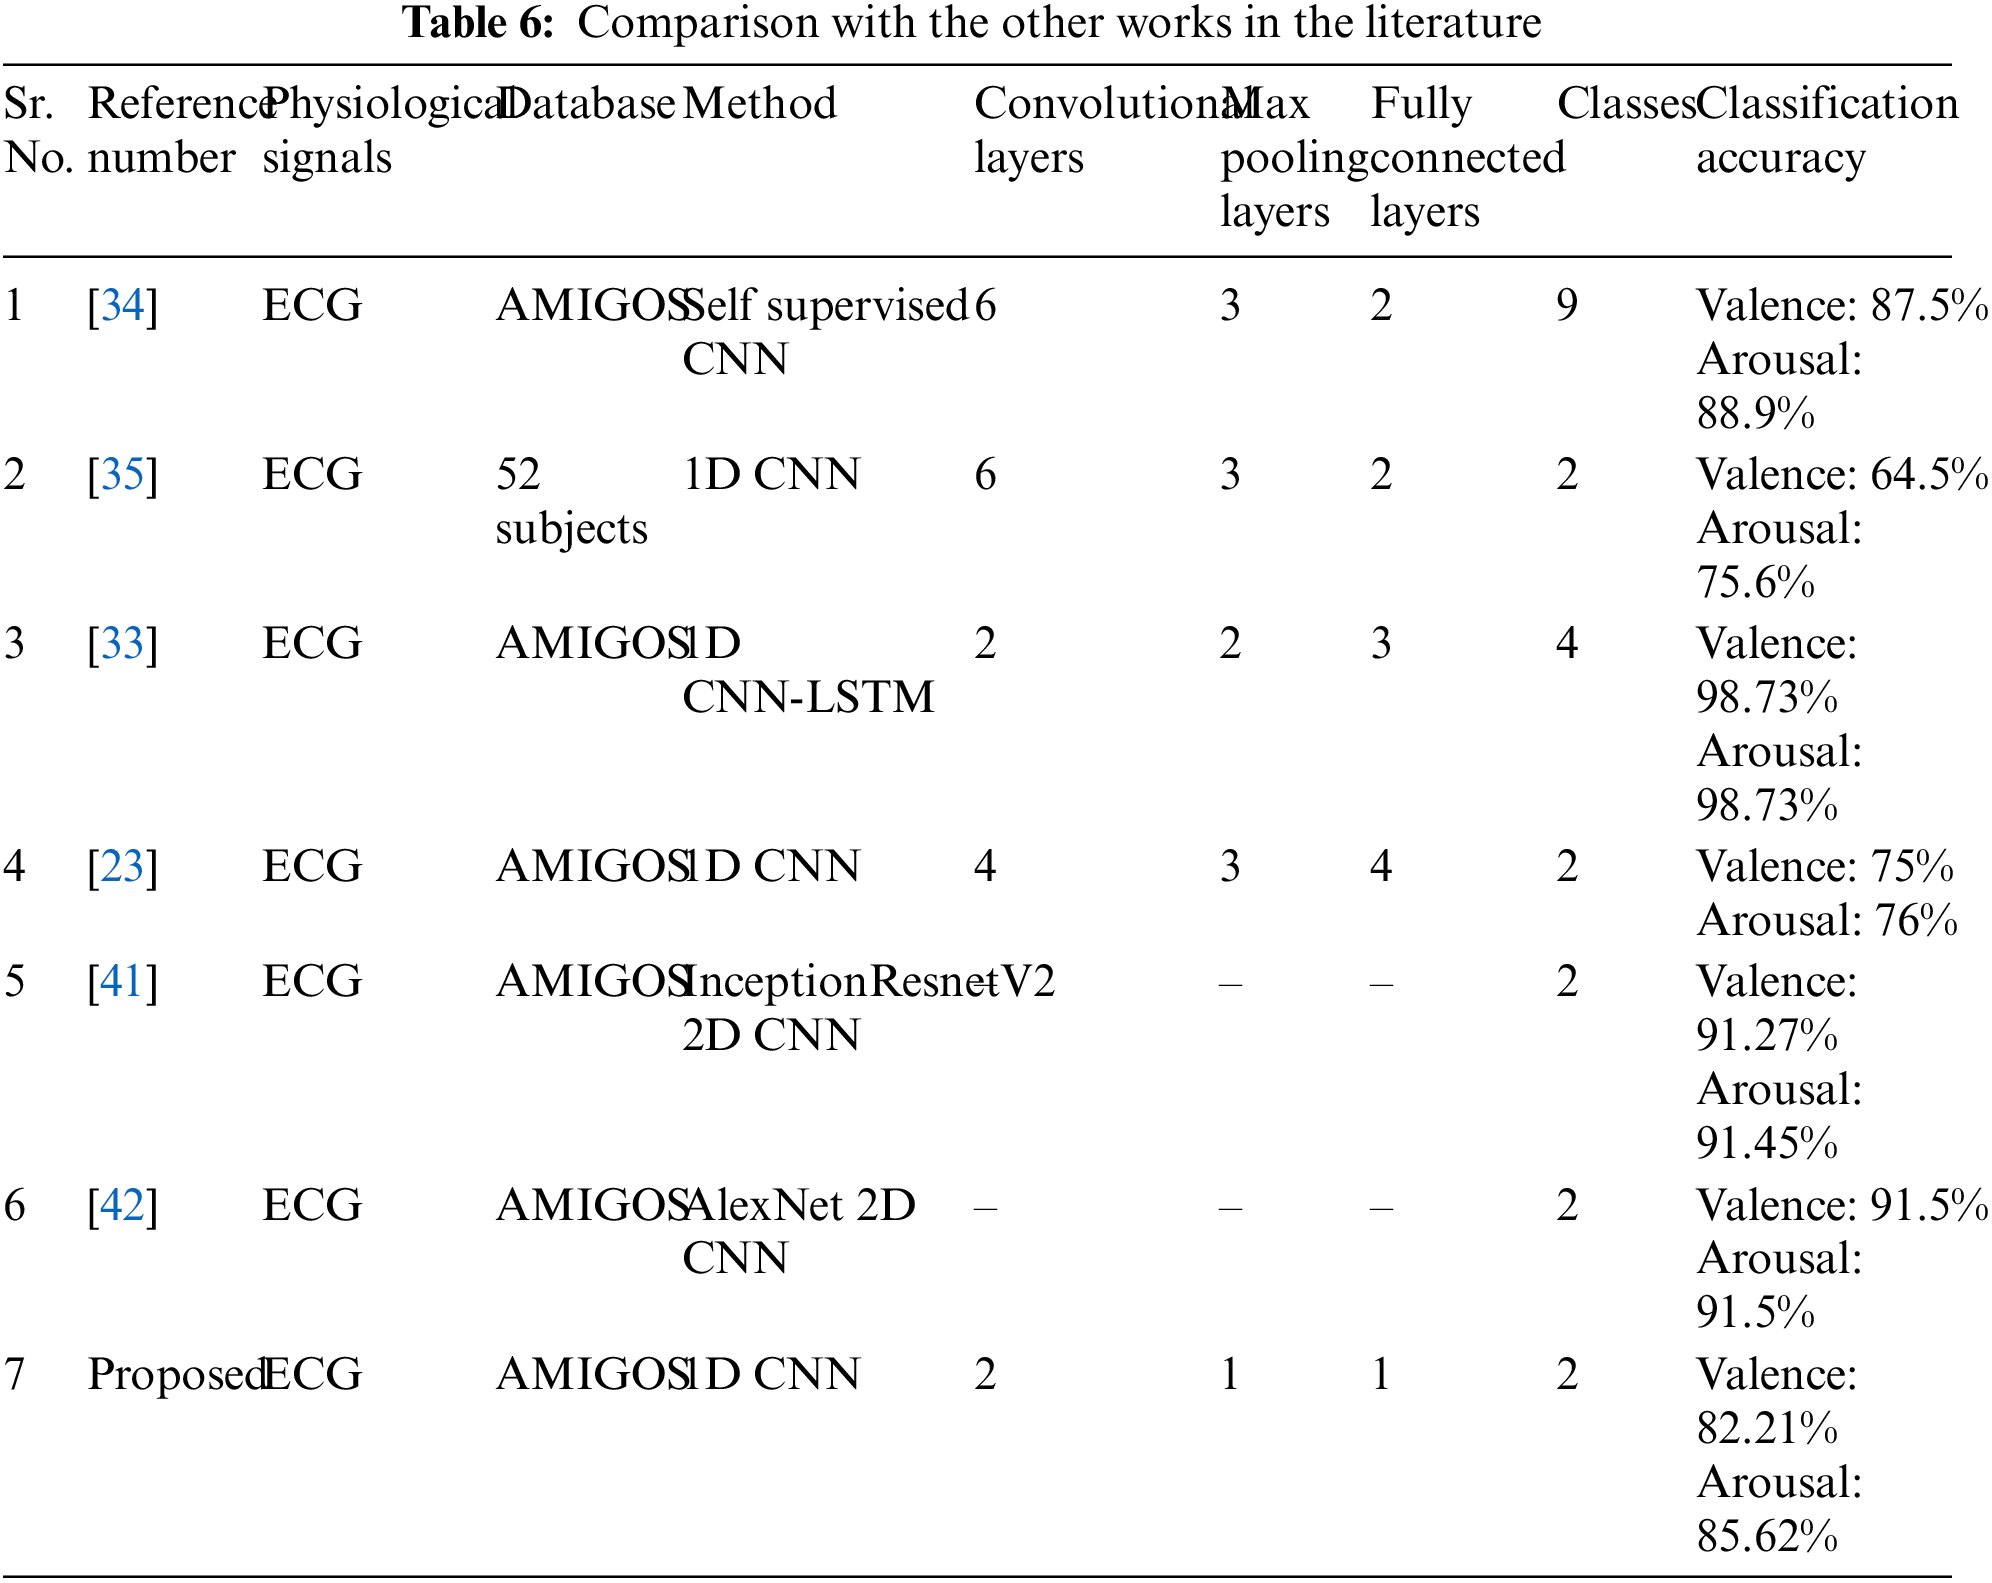
As indicated in Table 6, Sarkar et al. [34] used a self-supervised CNN model with six convolutional layers to classify emotions into nine different classes. However, the self-supervised networks require expert knowledge and could be challenging to formulate. Chen et al. [35] employed 1D CNN with six convolutional layers to classify emotions using ECG data from fifty-two subjects. Dar et al. [33] used 1D CNN LSTM model to classify emotions into four categories. However, the addition of the LSTM layer makes it computationally expensive as compared to the simple CNN model. Santamaria-Granados [23] used a 1D CNN model to classify emotions into four categories, using four convolutional layers. Both Dar et al. [33] and Santamaria-Granados et al. [23] developed models that are appropriate for classifying emotions using ECG and GSR data. The 2D CNN models using AlexNet [42] and InceptionResnetV2 [41] require complex preprocessing. Furthermore, scalograms need to be obtained from preprocessed ECG data and converted into images. Moreover, they need complex hardware and more training time compared to 1D CNN models. Few studies in the literature have used the 1D CNN model for emotion classification using ECG data. However, they have used more layers and these parameters can be optimized to develop a lightweight CNN model. Our method involves developing a lightweight CNN model with fewer layers, resulting in improved speed and complexity. Thus the model could be implemented on smart phones and can be used for healthcare scenarios. Our study focused on classifying emotions based on the Valence Arousal scale, specifically using ECG data and a lightweight 1D CNN model with fewer layers, with improved accuracy.
This study explores the use of ECG signals for emotion recognition, which accurately identifies genuine emotions. Emotion recognition plays a vital role in healthcare systems such as stress detection, elderly care, and surveillance systems, providing timely support to patients and increasing the quality of their lives. The advancements in deep learning technology benefit healthcare systems in developing sophisticated models for emotion detection. The study proposes a novel method for classifying emotions based on ECG data. The method involves developing a lightweight CNN model with fewer layers, resulting in improved speed and complexity. The model’s performance is optimized by reducing the number of convolutional layers, max pooling layer, and fully connected layer. The study evaluates the model’s performance in both individual and group settings, making it the first research to explore the use of a lightweight 1D CNN model for emotion classification based on ECG data in group settings. The model demonstrated superior performance in group settings than in individual settings and exhibited subject-independent classification. Moreover, the lightweight model can be implemented on smartphones, making it versatile and suitable for a variety of applications, including smart healthcare systems. The AMIGOS dataset has a limitation in that it only contains ECG recordings of young adults with similar cultural backgrounds. However, it is possible to test the model on people from diverse age groups and cultural backgrounds. Currently, in the field of emotion detection, there is a lack of publicly available datasets that consider the ECG recordings of participants from diverse age groups, ethnicities, cultural backgrounds, and unhealthy subjects. In the future, such datasets could be developed and the model’s performance could be tested. Furthermore, the AMIGOS dataset used in this research contains ECG recordings taken in a laboratory environment in a noise-free scenario. However, when implementing the model in real-time scenarios, factors such as environmental noise need to be taken into account. Suitable preprocessing techniques need to be designed to remove noise. In the future, it would be interesting to test the model for real-time emotion detection using ECG signals. Additionally, the model could be modified to classify emotions using other physiological signals such as Galvanic Skin Response and electroencephalogram. This can be accomplished by making suitable changes to the preprocessing stages and tuning the hyperparameters of a lightweight CNN, such as the number of filters, filter dimensions, batch sizes, etc. The peak occurrence duration varies in different types of physiological signals. The fiducial points in the signals need to be detected based on the location of the peaks or using various algorithms and suitable segmentation to be performed. Furthermore, the hyperparameters of the CNN model need to be obtained for optimum performance for each of these physiological signals. Such modifications would enable the implementation of the model in a multimodal scenario for emotion detection.
Acknowledgement: The authors are thankful to the Goa College of Engineering, affiliated with Goa University, for supporting the work carried out in this study.
Funding Statement: The authors received no specific funding for this study.
Author Contributions: Amita U. Dessai and Hassanali G. Virani finalized the methodology and analyzed the data. All authors reviewed the results and approved the final version of the manuscript.
Availability of Data and Materials: The data are available upon approval at http://www.eecs.qmul.ac.uk/mmv/datasets/amigos/index.html (accessed on 10 June 2023).
Ethics Approval: Not applicable.
Conflicts of Interest: The authors declare that they have no conflicts of interest to report regarding the present study.
References
1. S. K. Khare, V. Blanes-Vidal, E. S. Nadimi, and U. R. Acharya, “Emotion recognition and artificial intelligence: A systematic review (2014–2023) and research recommendations,” Inform. Fusion, vol. 102, no. 3, pp. 102019, Feb. 01, 2024. doi: 10.1016/j.inffus.2023.102019. [Google Scholar] [CrossRef]
2. M. Dhuheir, A. Albaseer, E. Baccour, A. Erbad, M. Abdallah and M. Hamdi, “Emotion recognition for healthcare surveillance systems using neural networks: A survey,” presented at the 2021 Int. Wirel. Commun. Mob. Comput. (IWCMCHarbin City, China, IEEE, Jun. 28–Jul. 02, 2021, pp. 681–687. doi: 10.1109/IWCMC51323.2021.9498861. [Google Scholar] [CrossRef]
3. Y. Meléndez, J. C. Satorres, E. Reyes-Olmedo, M. Delhom, I. Real and E. Lora, “Emotion recognition changes in a confinement situation due to COVID-19,” J. Environ. Psychol., vol. 72, no. 9607, pp. 101518, Dec. 2020. doi: 10.1016/j.jenvp.2020.101518. [Google Scholar] [PubMed] [CrossRef]
4. F. A. Pujol, H. Mora, and A. Martínez, “Emotion recognition to improve e-healthcare systems in smart cities,” presented at the Res. Innov. Forum 2019, Rome, Italy, Springer, Apr. 24–26, 2019, pp. 245–254. doi: 10.1007/978-3-030-30809-4_23. [Google Scholar] [CrossRef]
5. S. Lee et al., “Affective surveillance management in virtual emotion based smart complex infrastructure,” IEEE Commun. Mag., vol. 61, no. 10, pp. 62–68, Oct. 2023. doi: 10.1109/MCOM.003.2200798. [Google Scholar] [CrossRef]
6. S. Lee et al., “Task-oriented surveillance framework for virtual emotion informatics in polygon spaces,” IEEE Wirel. Commun., vol. 30, no. 3, pp. 104–111, Jun. 2023. doi: 10.1109/MWC.001.2200454. [Google Scholar] [CrossRef]
7. H. Zhipeng et al., “Advances in multimodal emotion recognition based on brain-computer interfaces,” Brain Sci., vol. 10, no. 10, pp. 687, Sep. 2020. doi: 10.3390/brainsci10100687. [Google Scholar] [PubMed] [CrossRef]
8. A. U. Dessai and H. G. Virani, “Emotion detection and classification using machine learning techniques,” in Title of Multidisciplinary Applications of Deep Learning-Based Artificial Emotional Intelligence, Ist ed., Hershey, PA, USA: IGI Global, 2023, pp. 11–31. Accessed: Jan. 10, 2024. [Online]. Available: https://www.igi-global.com/chapter/emotion-detection-and-classification-using-machine-learning-techniques. [Google Scholar]
9. M. A. Hasnul, N. A. A. Aziz, S. Alelyani, M. Mohana, and A. A. Aziz, “Electrocardiogram-based emotion recognition systems and their applications in healthcare—A review,” Sensors, vol. 21, no. 15, pp. 5015, Aug. 1, 2021. doi: 10.3390/s21155015. [Google Scholar] [PubMed] [CrossRef]
10. S. N. M. Sayed Ismail, N. A. Ab. Aziz, S. Z. Ibrahim, and M. S. Mohamad, “A systematic review of emotion recognition using cardio-based signals,” ICT Express, Korean Inst. Commun. Inf. Sci., vol. 10, no. 1, pp. 156–183, Feb. 01, 2023. doi: 10.1016/j.icte.2023.09.001. [Google Scholar] [CrossRef]
11. P. Vasuki, “Design of hierarchical classifier to improve speech emotion recognition,” Comput. Syst. Sci. Eng., vol. 44, no. 1, pp. 19–33, Jan. 2023. doi: 10.32604/csse.2023.024441. [Google Scholar] [CrossRef]
12. M. Egger, M. Ley, and S. Hanke, “Emotion recognition from physiological signal analysis: A review,” Electr. Notes Theoret. Comput. Sci., vol. 343, pp. 35–55, May 2019. doi: 10.1016/j.entcs.2019.04.009. [Google Scholar] [CrossRef]
13. S. Lin et al., “A review of emotion recognition using physiological signals,” Sensors, vol. 18, no. 7, pp. 2074, Jul. 1, 2018. doi: 10.3390/s18072074. [Google Scholar] [PubMed] [CrossRef]
14. S. Koelstra et al., “DEAP: A database for emotion analysis; using physiological signals,” IEEE Trans. Affect. Comput., vol. 3, no. 1, pp. 18–31, Jan. 2012. doi: 10.1109/T-AFFC.2011.15. [Google Scholar] [CrossRef]
15. M. Soleymani, J. Lichtenauer, T. Pun, and M. Pantic, “A multimodal database for affect recognition and implicit tagging,” IEEE Trans. Affect. Comput., vol. 3, no. 1, pp. 42–55, Jan. 2012. doi: 10.1109/T-AFFC.2011.25. [Google Scholar] [CrossRef]
16. J. A. Miranda-Correa, M. K. Abadi, N. Sebe, and I. Patras, “AMIGOS: A dataset for affect, personality and mood research on individuals and groups,” IEEE Trans. Affect. Comput., vol. 12, no. 2, pp. 479–493, Apr. 1–Jun. 2021. doi: 10.1109/TAFFC.2018.2884461. [Google Scholar] [CrossRef]
17. R. Subramanian, J. Wache, M. K. Abadi, R. L. Vieriu, S. Winkler and N. Sebe, “ASCERTAIN: Emotion and personality recognition using commercial sensors,” IEEE Trans. Affect. Comput., vol. 9, no. 2, pp. 147–160, Apr. 1–Jun. 2018. doi: 10.1109/TAFFC.2016.2625250. [Google Scholar] [CrossRef]
18. A. Dessai and H. Virani, “Emotion detection using physiological signals,” presented at the 2021 Int. Conf. Electr., Comput., Energy Technol. (ICECETCape Town, South Africa, Dec. 9–10, 2021. doi: 10.1109/ICECET52533.2021.9698729. [Google Scholar] [CrossRef]
19. A. Sepúlveda, F. Castillo, C. Palma, and M. Rodriguez-Fernandez, “Emotion recognition from ecg signals using wavelet scattering and machine learning,” Appl. Sci., vol. 11, no. 11, pp. 4945, Jun. 2021. doi: 10.3390/app11114945. [Google Scholar] [CrossRef]
20. L. Romeo, A. Cavallo, L. Pepa, N. Bianchi-Berthouze, and M. Pontil, “Multiple instance learning for emotion recognition using physiological signals,” IEEE Trans. Affect. Comput., vol. 13, no. 1, pp. 389–407, Jan. 01–Mar. 2022. doi: 10.1109/TAFFC.2019.2954118. [Google Scholar] [CrossRef]
21. A. F. Bulagang, J. Mountstephens, and J. Teo, “Multiclass emotion prediction using heart rate and virtual reality stimuli,” J. Big Data, vol. 8, no. 1, pp. 374, Dec. 2021. doi: 10.1186/s40537-020-00401-x. [Google Scholar] [CrossRef]
22. A. Dessai and H. Virani, “Multimodal and multidomain feature fusion for emotion classification based on electrocardiogram and galvanic skin response signals,” Sci, vol. 6, no. 1, pp. 10, Feb. 10, 2024. doi: 10.3390/sci6010010. [Google Scholar] [CrossRef]
23. L. Santamaria-Granados, M. Munoz-Organero, G. Ramirez-Gonzalez, E. Abdulhay, and N. Arunkumar, “Using deep convolutional neural network for emotion detection on a physiological signals dataset (AMIGOS),” IEEE Access, vol. 7, pp. 57–67, Nov. 2018. doi: 10.1109/ACCESS.2018.2883213. [Google Scholar] [CrossRef]
24. D. S. Hammad and H. Monkaresi, “Based emotion detection via parallel-extraction of temporal and spatial features using convolutional neural network,” Trait. Du Signal, vol. 39, no. 1, pp. 43–57, Feb. 2022. doi: 10.18280/ts.390105. [Google Scholar] [CrossRef]
25. A. Fang, F. Pan, W. Yu, L. Yang, and P. He, “ECG-based emotion recognition using random convolutional kernel method,” Biomed. Signal Process. Control, Elsevier, vol. 91, no. 2, pp. 105907, May 2024. doi: 10.1016/j.bspc.2023.105907. [Google Scholar] [CrossRef]
26. H. Ferdinando, T. Seppänen, and E. Alasaarela, “Enhancing emotion recognition from ECG signals using supervised dimensionality reduction,” presented at the ICPRAM 2017–Proc. 6th Int. Conf. Pattern Recogn. Appl. Meth, SciTePress, Porto, Portugal, Feb. 24–26, 2017, pp. 112–128. doi: 10.5220/0006147801120118. [Google Scholar] [CrossRef]
27. S. Lin et al., “Wearable emotion recognition using heart rate data from a smart bracelet,” Sensors, vol. 20, no. 3, pp. 718, Feb. 2020. doi: 10.3390/s20030718. [Google Scholar] [PubMed] [CrossRef]
28. Z. Zhang, X. Wang, P. Li, X. Chen, and L. Shao, “Research on emotion recognition based on ECG signal,” J. Phys. Conf. Ser., vol. 1678, no. 1, pp. 012091, Nov. 2020. doi: 10.1088/1742-6596/1678/1/012091. [Google Scholar] [CrossRef]
29. B. Sun and Z. Lin, “Emotion recognition using machine learning and ECG signals,” arXiv preprint arXiv:2203.08477, Mar. 2022. [Google Scholar]
30. S. N. M. Sayed Ismail et al., “Evaluation of electrocardiogram: Numerical vs. image data for emotion recognition system,” F1000Research, vol. 10, pp. 1114, May 2022. doi: 10.12688/f1000research.73255.2. [Google Scholar] [PubMed] [CrossRef]
31. A. Alam, S. Urooj, and A. Q. Ansari, “Design and development of a non-contact ECG-based human emotion recognition system using SVM and RF classifiers,” Diagnostics, vol. 13, no. 12, pp. 2097, Jun. 2023. doi: 10.3390/diagnostics13122097. [Google Scholar] [PubMed] [CrossRef]
32. M. A. Hasnul, N. A. Ab. Aziz, and A. Abd. Aziz, “Augmenting ECG data with multiple filters for a better emotion recognition system,” Arab J. Sci. Eng., vol. 48, no. 8, pp. 10313–10334, Aug. 2023. doi: 10.1007/s13369-022-07585-9. [Google Scholar] [PubMed] [CrossRef]
33. M. N. Dar, M. U. Akram, S. G. Khawaja, and A. N. Pujari, “CNN and LSTM-based emotion charting using physiological signals,” Sensors, vol. 20, no. 16, pp. 1–26, Aug. 2020. doi: 10.3390/s20164551. [Google Scholar] [PubMed] [CrossRef]
34. P. Sarkar and A. Etemad, “Self-supervised ECG representation learning for emotion recognition,” IEEE Trans. Affect. Comput., vol. 13, no. 3, pp. 1541–1554, Jul.–Sep. 2022. doi: 10.1109/TAFFC.2020.3014842. [Google Scholar] [CrossRef]
35. P. Chen et al., “An improved multi-input deep convolutional neural network for automatic emotion recognition,” Front. Neurosci., vol. 16, pp. 265, Oct. 2022. doi: 10.3389/fnins.2022.965871. [Google Scholar] [PubMed] [CrossRef]
36. M. S. Lee, Y. K. Lee, M. T. Lim, and T. K. Kang, “Emotion recognition using convolutional neural network with selected statistical photoplethysmogram features,” Appl. Sci., vol. 10, no. 10, pp. 3501, May 2020. doi: 10.3390/app10103501. [Google Scholar] [CrossRef]
37. Y. -J. Jin et al., “A photoplethysmogram dataset for emotional analysis,” Appl. Sci., vol. 12, no. 13, pp. 6544, Jun. 2022. doi: 10.3390/app12136544. [Google Scholar] [CrossRef]
38. E. G. Han, T. K. Kang, and M. T. Lim, “Physiological signal-based real-time emotion recognition based on exploiting mutual information with physiologically common features,” Electronics, vol. 12, no. 13, pp. 2933, Jul. 2023. doi: 10.3390/electronics12132933. [Google Scholar] [CrossRef]
39. D. S. Hammad and H. Monkaresi, “Detecting naturalistic emotions using deep learning techniques applied to ECG signals,” Webology, vol. 19, no. 1, pp. 6146–6180, Jan, 2022. [Google Scholar]
40. T. Sweeney-Fanelli and M. Imtiaz, “ECG-based automated emotion recognition using temporal convolution neural networks,” TechRxiv, Feb. 14, 2024. doi: 10.36227/techrxiv.23636304.v3. [Google Scholar] [CrossRef]
41. A. Dessai and H. Virani, “Emotion classification based on CWT of ECG and GSR signals using various CNN models,” Electronics, vol. 12, no. 13, pp. 2795, Jun. 2023. doi: 10.3390/electronics12132795. [Google Scholar] [CrossRef]
42. A. Rahim, A. Sagheer, K. Nadeem, M. N. Dar, A. Rahim and U. Akram, “Emotion charting using real-time monitoring of physiological signals,” presented at the 2019 Int. Conf. Robot. Autom. Industry (ICRAIRawalpindi, Pakistan, IEEE, Oct. 21–22, 2019, pp. 1–5. doi: 10.1109/ICRAI47710.2019.8967398. [Google Scholar] [CrossRef]
43. H. Lin, R. Liu, and Z. Liu, “ECG signal denoising method based on disentangled autoencoder,” Electronics, vol. 12, no. 7, pp. 1606, Mar. 2023. doi: 10.3390/electronics12071606. [Google Scholar] [CrossRef]
44. A. Dessai and H. Virani, “Emotion classification using physiological signals: A recent survey,” presented at the 2022 IEEE Int. Conf. Signal Process., Inf., Commun. Energy Syst. (SPICES), Thiruvananthapuram, India, Mar. 10–12, 2022, pp. 333–338. doi: 10.1109/SPICES52834.2022.9774240. [Google Scholar] [CrossRef]
45. S. Kiranyaz, O. Avci, O. Abdeljaber, T. Ince, M. Gabbouj and D. J. Inman, “1D convolutional neural networks and applications: A survey,” Mech. Syst. Signal Process, vol. 151, pp. 107398, Apr. 2021. doi: 10.1016/j.ymssp.2020.107398. [Google Scholar] [CrossRef]
46. Accessed: Jan. 10, 2024. [Online]. Available: https://scikit-learn.org/stable/modules/cross_validation.html [Google Scholar]
47. P. Gupta, “Cross-validation in machine learning,” Towards Data Science, Jun. 2017. Accessed: Jan. 10, 2024. [Online]. Available: https://towardsdatascience.com/cross-validation-in-machine-learning-72924a69872f [Google Scholar]
48. Accessed: Jan. 10, 2024. [Online]. Available: https://www.analyticsvidhya.com/blog/2020/04/confusion-matrix-machine-learning [Google Scholar]
Cite This Article
 Copyright © 2024 The Author(s). Published by Tech Science Press.
This work is licensed under a Creative Commons Attribution 4.0 International License , which permits unrestricted use, distribution, and reproduction in any medium, provided the original work is properly cited.
 Downloads
 Citation Tools