
 Submit a Paper
 Propose a Special lssue
 Open Access
ARTICLE
A Stacking Machine Learning Model for Student Performance Prediction Based on Class Activities in E-Learning
Department of Computer Engineering, University of Science and Culture, Tehran, 1461968151, Iran
* Corresponding Author: Mohammad Javad Shayegan. Email:
Computer Systems Science and Engineering 2024, 48(5), 1251-1272. https://doi.org/10.32604/csse.2024.052587
Received 08 April 2024; Accepted 22 July 2024; Issue published 13 September 2024
 View Full Text
 Download PDF
Abstract
After the spread of COVID-19, e-learning systems have become crucial tools in educational systems worldwide, spanning all levels of education. This widespread use of e-learning platforms has resulted in the accumulation of vast amounts of valuable data, making it an attractive resource for predicting student performance. In this study, we aimed to predict student performance based on the analysis of data collected from the OULAD and Deeds datasets. The stacking method was employed for modeling in this research. The proposed model utilized weak learners, including nearest neighbor, decision tree, random forest, enhanced gradient, simple Bayes, and logistic regression algorithms. After a trial-and-error process, the logistic regression algorithm was selected as the final learner for the proposed model. The results of experiments with the above algorithms are reported separately for the pass and fail classes. The findings indicate that the accuracy of the proposed model on the OULAD dataset reached 98%. Overall, the proposed method improved accuracy by 4% on the OULAD dataset.Keywords
The widespread adoption of data mining techniques has revolutionized research across various domains, with educational data mining (EDM) emerging as a prominent area of focus [1]. Within e-learning specifically, understanding student engagement, interaction patterns, and academic progress presents significant challenges [2]. Traditional classroom settings allow for relatively straightforward assessment methods like exams and quizzes. However, e-learning environments introduce a unique online context that can lead to a lack of well-defined, easily quantifiable, or precise evaluation criteria.
The COVID-19 pandemic further accelerated a remarkable shift from in-person classrooms to remote e-learning platforms, demanding rapid adaptation from both educators and students [3–5]. While Learning Management Systems (LMS) have become ubiquitous in education, evaluating their effectiveness within this evolving landscape is crucial, given the ever-increasing integration of technology in modern pedagogy [6].
A persistent research gap exists regarding the prediction of student performance using metrics that capture their engagement and participation levels in online courses. Early identification of students who may struggle academically allows for targeted interventions, ultimately improving the effectiveness of e-learning platforms. These insights benefit not only students by providing them with additional support, but also educators and institutions, enabling them to refine their approaches and learning materials more efficiently [7,8].
While numerous studies have explored student performance prediction using various machine learning (ML) methods, the use of stacking ensembles has been less common in this domain, especially considering the limited availability of standard datasets. The Deeds and OULAD datasets are the most widely used in such studies. Notably, a review of previous research revealed a lack of studies employing stacking methods for student performance prediction, particularly on the Deeds and OULAD datasets.
Stacking ensembles, a type of ensemble learning technique, combine the predictions from multiple base models to create a more robust and accurate final prediction [9]. By leveraging the strengths of multiple models, the stacking approach has the potential to improve the generalizability and accuracy of student performance predictions in e-learning environments.
This research aims to bridge this gap by proposing a novel model for predicting student performance. It leverages the stacking method on two well-recognized datasets, Deeds and OULAD. Similar to prior works on these datasets, this study aims to enhance prediction accuracy of performance, but through the application of the stacking technique. Stacking ensembles have demonstrated the potential to improve the performance of individual machine learning models [10]. By leveraging the strengths of multiple models, the stacking approach can potentially lead to more robust and accurate predictions of student performance in e-learning environment.
The contribution of this paper comprises:
• The utilization of stacking modeling for predicting students’ performance.
• Improving the prediction accuracy of students’ performance on two standard datasets, Deeds and OULAD.
• Evaluation of K-nearest neighbor (KNN), random forest, simple Bayes, XGBoost, logistic regression, and decision tree algorithms using a trial-and-error approach with stacking appraoch.
• Best accuracy achieved by selecting Logistic regression as the meta-model and employing KNN, random forest, simple Bayes, XGBoost, logistic regression, and decision tree as base learners on the OULAD dataset.
• Best accuracy obtained by selecting decision tree as the meta-model and utilizing KNN, random forest, simple Bayes, XGBoost, logistic regression, and decision tree as base learners on the Deeds dataset.
The remainder of the paper proceeds as follows: Previous works are reviewed in Section 2. Research methodology is presented in Section 3. Section 4 presents the research findings and their evaluation, followed by the conclusion.
Considerable research has been conducted in the realm of educational data mining, and in this section, we will delve into relevant literature. Bolliger et al. [11] elucidated educational interaction theory, drawing from the work of Moore [12]. Moore’s theory delineates three types of interaction crucial for student motivation and participation in classrooms: learner-learner, learner-instructor, and learner-content interactions. Cole et al. [13] identified student isolation as a key challenge in online learning. They also note that in traditional classrooms, instructors can tailor teaching methods to foster student interaction and engagement, redirecting attention to the lesson.
Moubayed et al. [14] analyzed student participation rates, emphasizing the necessity of examining indicators linked to student performance alongside tracking system events. Batool et al. [1] proposed a neural network-based model for predicting student performance, stressing the significance of metrics such as time spent watching instructional videos, particularly in video-conferencing-based classes.
Ali et al. [15], through questionnaire-based research, revealed that 37.8% of participants prefer e-learning, with a majority suggesting more online practice exams before final evaluations. Convolutional neural networks are employed in evaluating student participation, as demonstrated by Bhardwaj et al. [16], who assesses student engagement in online classes using neural networks.
Semerci et al. [17] employed Convolutional Neural Networks (CNN) to generate heat maps, with activity and performance as primary research factors. Their study concludes that deep learning methods are optimal for discerning student activity patterns. Gray et al. [18] proposed criteria for measuring student interaction in face-to-face classes, noting that students with minimal interaction, merely present in the classroom, during initial weeks are at risk of course failure.
Lincke et al. [19] examined the correlation between e-learning activities and test performance, leveraging Rich Context Model (RCM) and ML for performance prediction. Lu et al. [20] investigated the link between attendance and performance in Technology Enhanced Learning (TEL) courses, finding that mandatory attendance does not enhance academic outcomes, emphasizing the importance of motivation and engagement for success.
Mubarak et al. [21] modeled student performance through graph convolution, basing classification on video consumption and viewing duration. Hao et al. [22] analyzed e-learning data and predict student performance utilizing the OULAD dataset and Bayesian theory.
Hussain et al. [23] introduced a model to predict students’ future challenges within the Technology Enhanced Learning (TEL) system using the Matlab. Brahim [7] demonstrated the predictability of student performance by analyzing engagement reports from the DEEDs dataset. The study found that the Random Forest algorithm yielded the highest accuracy at 97%, with an F1 measure of 97%.
Ahamad et al. [24] assessed the predictive capability of various classification algorithms for determining students’ knowledge levels. Initially, GNB, MLP, Fuzzy, NN, and Random Forest algorithms were applied to the UCI dataset. Subsequently, summarization, voting methods, and different stacking algorithm combinations were employed. Huang et al. [25] utilized the Long Short-Term Memory (LSTM) method to develop a model for identifying students at risk of failure.
Dermy et al. [26] aimed to illustrate the dynamics of students’ digital behavior, utilizing the OULAD dataset for its comprehensive session-wise student transaction records, ideal for behavioral analysis. Jha et al. [27] employed regression and deep learning methods to predict student academic outcomes, distinguishing between students who remain enrolled and those who drop out. Similarly, Souai et al. [28] proposed methods for predicting academic failure, utilizing the OULAD dataset and categorizing performances into Pass, Fail, Withdraw, and Distinguished groups. They applied
the Bidirectional Long Short-Term Memory (BLSTM) method for modeling. Yang et al. [29] devised a predictive model for student performance by integrating multiple features. Their approach employed a deep neural network capable of automatic feature engineering.
In [30], the study explored the connection between student engagement in activities and academic performance through three approaches: statistical methods, data analytics, and machine learning (ML), employing methodological triangulation. Findings from this triangulation indicated that students who have a solid academic foundation from secondary school are more likely to engage in activities focused on developing generic competencies.
Another study [31], a series of early detection models was introduced to determine suitable support programs for students entering with suboptimal scores or to initiate interventions for those facing difficulties. These models are advantageous as they rely on minimal academic history data, facilitating early identification of students at risk of dropping out and enabling timely implementation of interventions and retention strategies.
In [32], researchers proposed a study focused on automatically predicting student engagement in online learning through continuous video streaming. To analyze the videos, they implement a tool utilizing an ensemble of LSTM to predict engagement levels from, gaze behavior, facial expressions and head pose.
Kukkar et al. [33] used Recurrent Neural Network (RNN) to forecast students’ performance. Nonetheless, while current performance prediction systems, based on Deep Learning (DL) technologies like Recurrent Neural Network (RNN), are more accurate than ML-based systems, they still encounter challenges such as ignoring relevant features, limited data analysis, and unclear student records.
Alsulami et al. [34] introduced a model incorporating three conventional data mining algorithms: random forest, Naive Bayes, and decision tree, augmented by three ensemble approaches: voting, boosting and bagging. The findings indicated that this approach enhanced accuracy from 0.75 to 0.77 when employing the decision tree with boosting.
Nayak et al. [35] conducted an analysis using two distinct datasets: the Kalboard 360 dataset, a comprehensive collection encompassing academic, demographic, and class-related behavioral features; and a dataset from a local institute which, in contrast, does not include behavioral features. Their study involved the application of various machine learning algorithms such as Random Forest (RF), Naive Bayes (NB), Decision Tree (J48), and Multilayer Perceptron (MLP) to classify students.
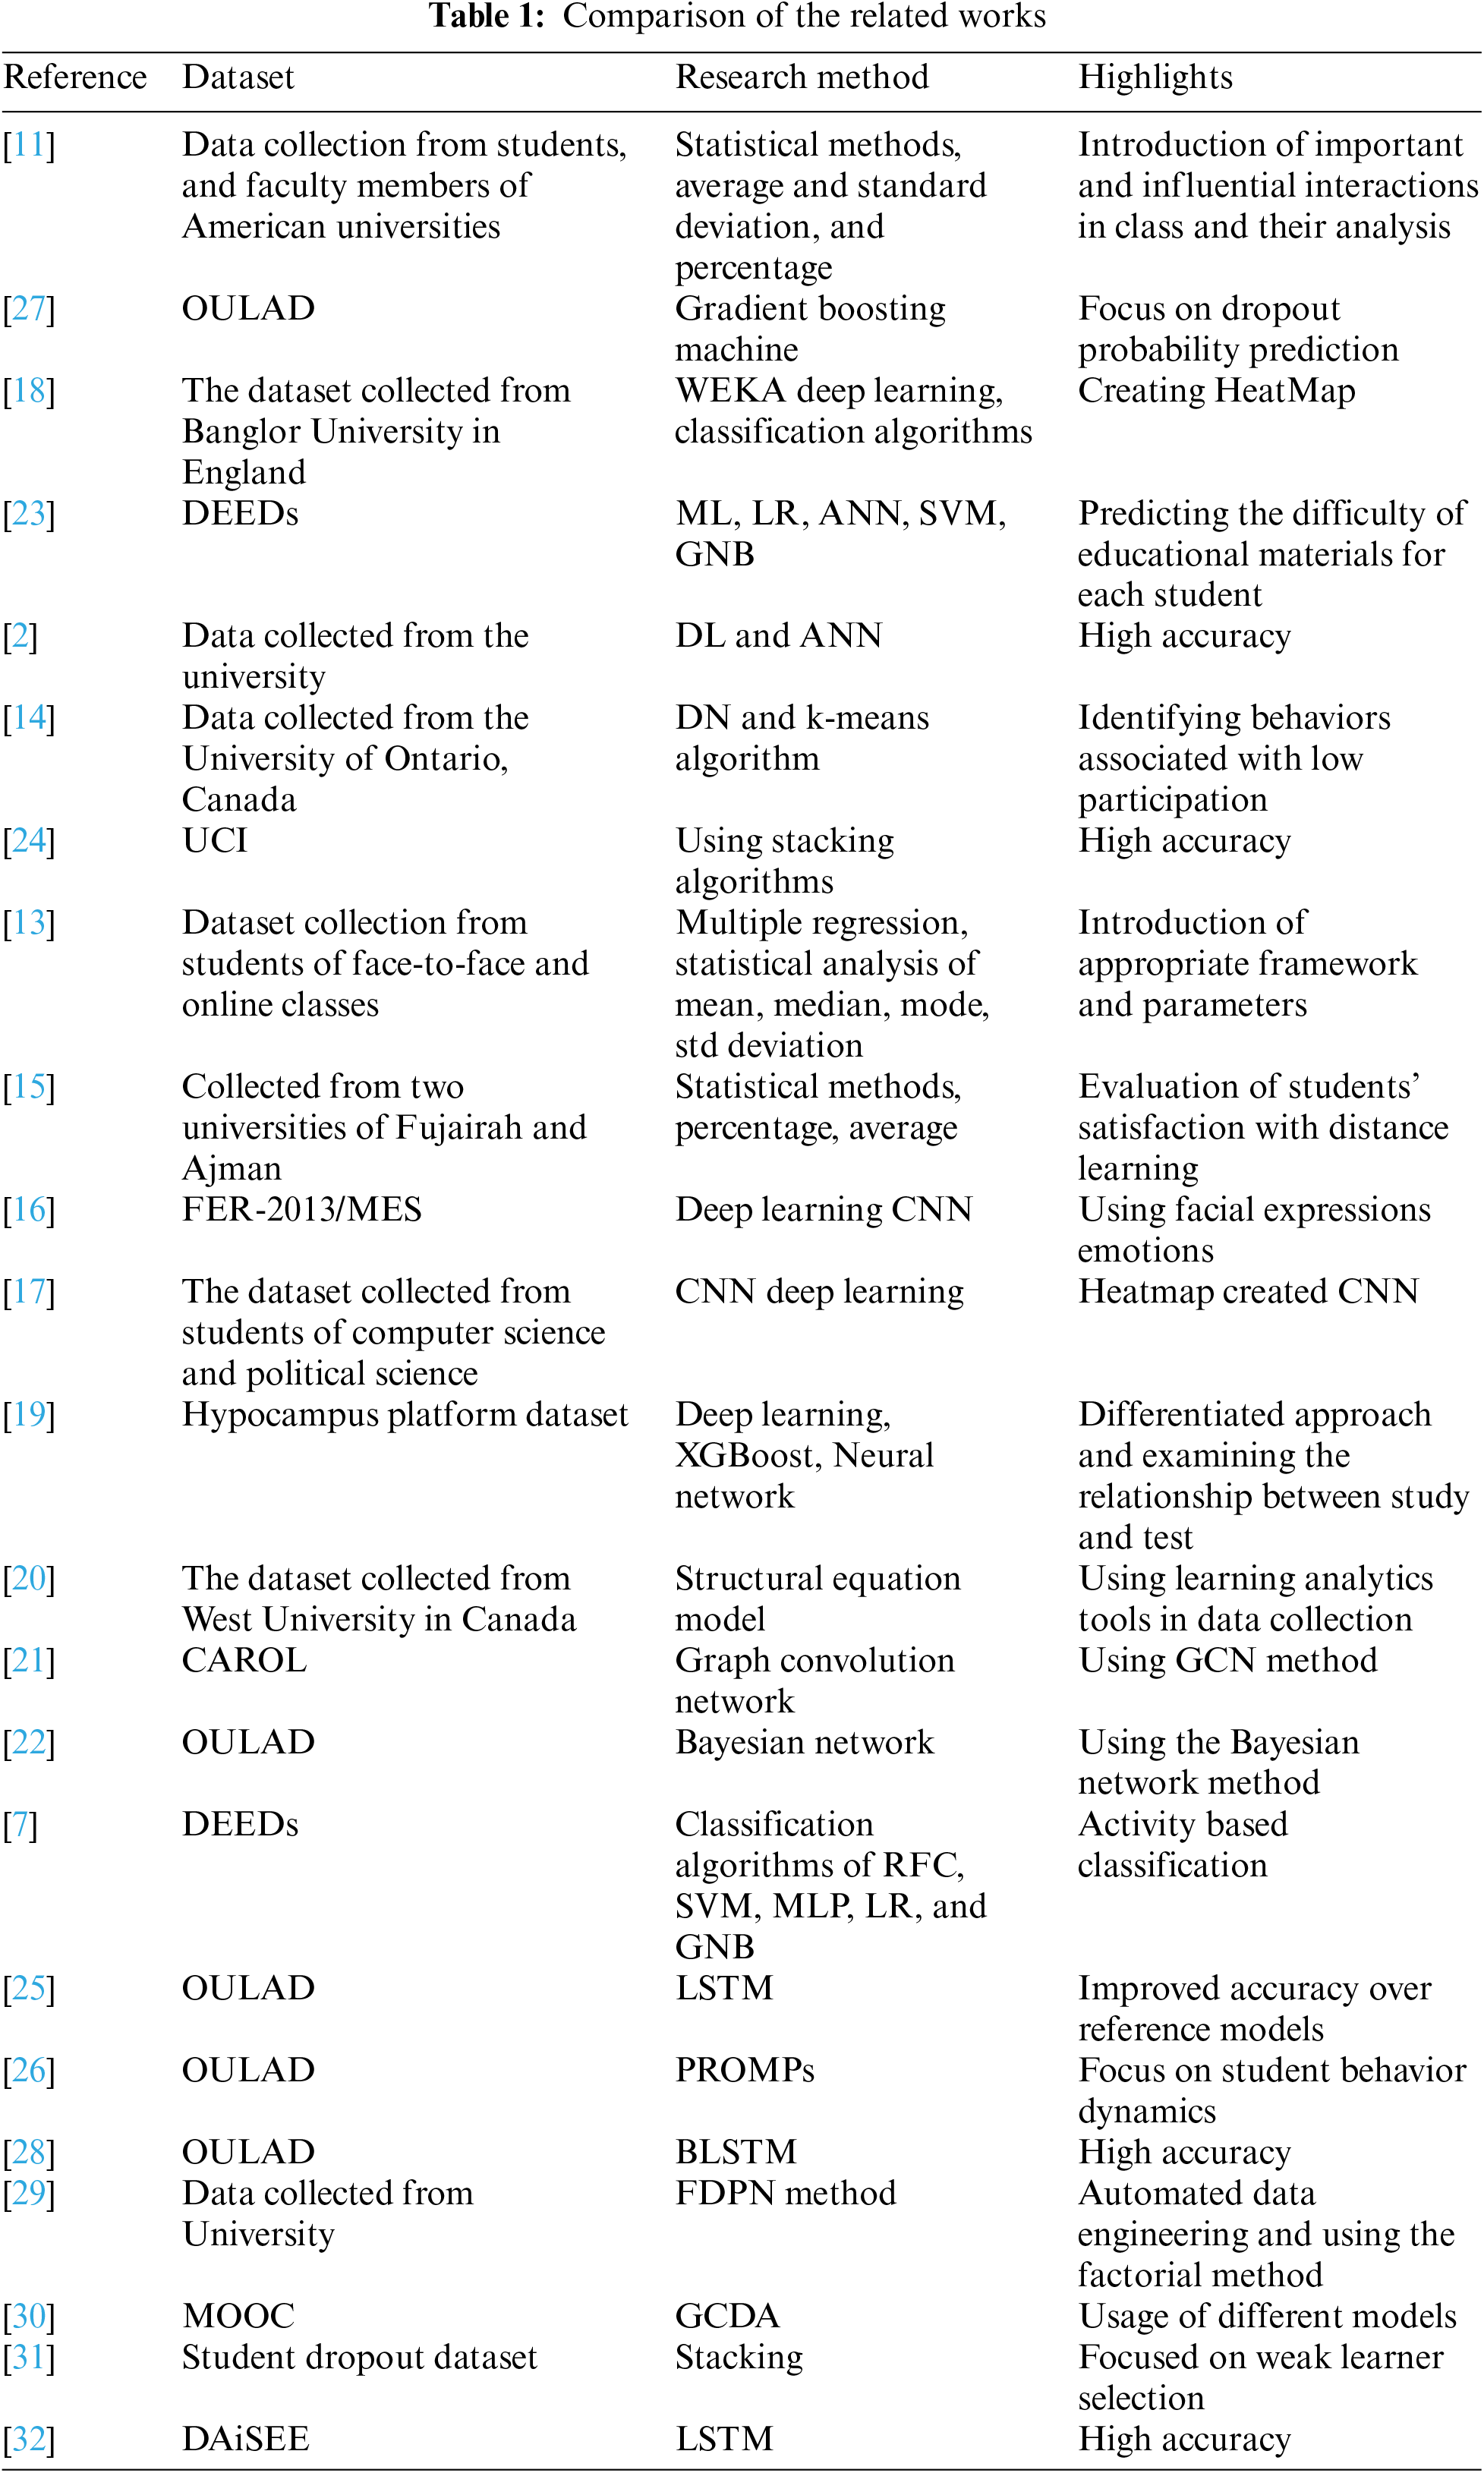
Table 1 shows a comparison of the related works. The aforementioned studies demonstrate promising results through the application of machine learning, deep learning, and ensemble methods. These ensemble techniques have shown superior performance compared to individual classifiers. However, existing literature lacks clear guidelines on feature selection and combination methods for ensemble modeling. Moreover, previous studies often rely on survey-based data collection, providing limited information. In this study, we propose employing ensemble techniques on two scalable and widely used databases, addressing the scalability issue often overlooked in prior ensemble method research.
As illustrated in Fig. 1, this study comprises multiple stages. It predominantly involves integrating traditional ML techniques with the newly proposed stacking algorithm. While some steps are common between the two approaches, others exhibit distinctions. The following delineates the sequential stages of the research.
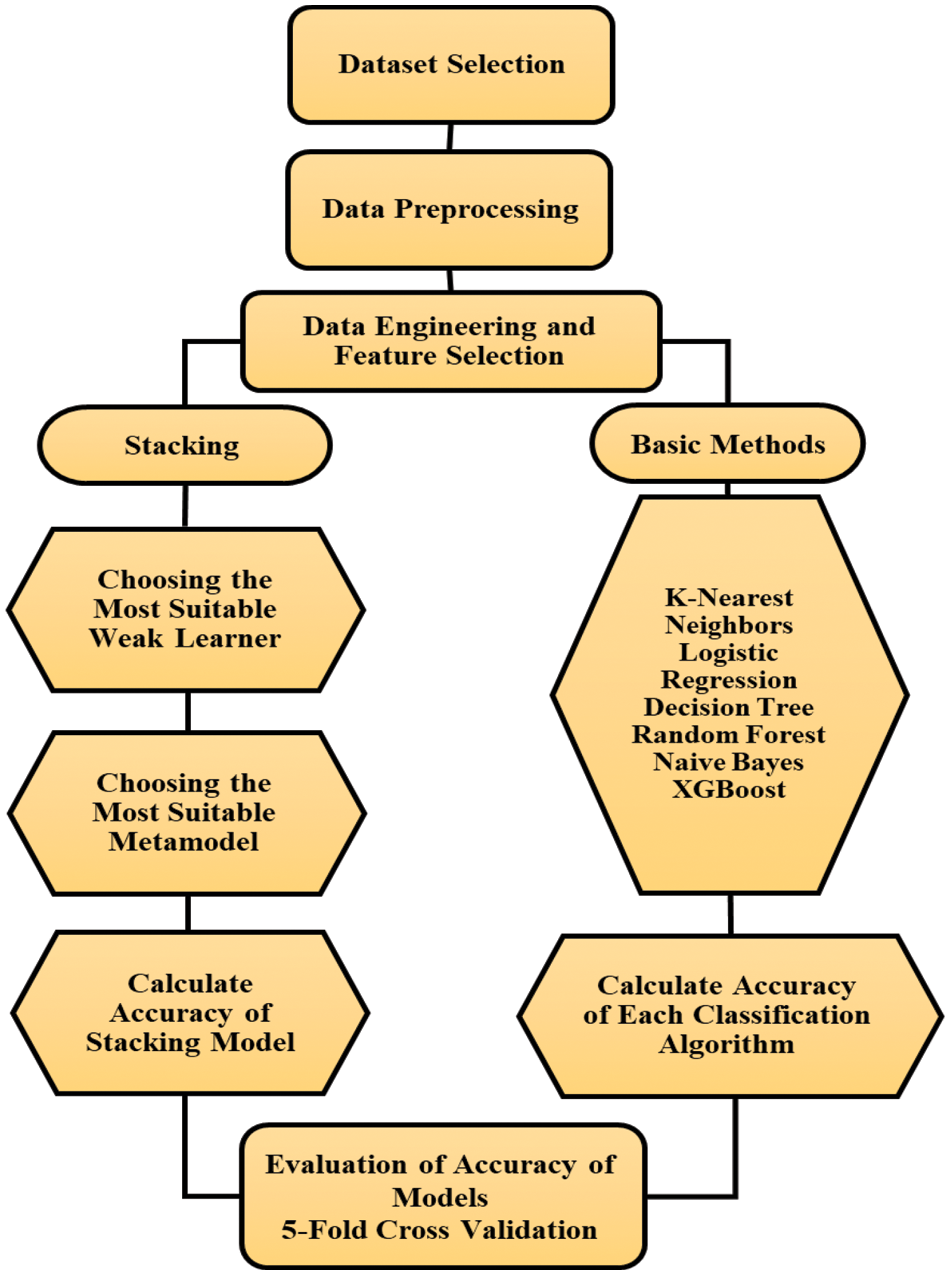
Figure 1: General process of the methodology
The research utilized two primary datasets: the OULAD standard dataset (Kuzilek et al. [36]) and the Deeds dataset [37]. The OULAD dataset comprises 9,859,080 records from 32,592 students, encompassing diverse data such as student demographics, exam dates and grades, as well as data regarding student interactions with the Virtual Learning Environment (VLE). This dataset is comprised of seven CSV files. On the other hand, the Deeds dataset contains 230,318 records detailing the time series of student activities across six laboratory sessions in a digital course at the University of Genoa. Each session is represented by a folder containing student data, with each folder containing up to 99 CSV files, each corresponding to a specific student’s report during that session. The number of files in each folder varies based on the number of students present in the session.
This section provides a detailed account of the preprocessing procedures applied to the OULAD and Deeds datasets. Despite the widespread use of the Deeds and OULAD datasets in various studies, achieving satisfactory results without fundamental preprocessing of the data from these two datasets is challenging. Microsoft SQL Server software was employed to preprocess and refine the final dataset. Given that some features are in VARCHAR format, operations on this type of data cannot be performed using Python and ML libraries. Therefore, text formats were converted to numeric values to facilitate processing. Subsequently, certain data, such as the week_to, week_from, and Date_unregistration, were eliminated due to a significant number of Null values, which contributed to data noise. This operation substantially reduced data noise.
In the subsequent step, null values were identified across the entire dataset, and rows containing these values were deleted. Following this, the desired features for the final dataset were selected based on the R2 coefficient, encompassing columns such as date, weight, module_presentation_length, date_submitted, score, region, imd_band, age_band, num_of_prev_attempts, id_site, sum_click, and activity_type. It is essential to emphasize that the OULAD dataset is vast. Without appropriate preprocessing procedures, obtaining satisfactory results from model execution is improbable.
To outline the steps taken:
• Integration of seven separate tables provided in the OULAD dataset to form a consolidated final table.
• Elimination of features containing null or zero values, resulting in the creation of a sparse matrix.
• Determination of correlation coefficients for the features and subsequent selection of final features based on this criterion.
It is imperative to note that the OULAD dataset is extensive, and without proper preprocessing operations, achieving satisfactory results from model execution is unlikely. In summary, the steps conducted are as follows:
1. Integration of 7 separate tables provided in the OULAD dataset and creation of a final table.
2. Removal of features with null or zero values and creation of a sparse matrix.
3. Calculation of correlation coefficients for the features and selection of final features based on this criterion.
Python was also utilized for preprocessing the Deeds dataset. Initially, all data collected from meeting files, average grades, final grades, and logs were processed. Subsequently, records of students who did not attend all six sessions were discarded. Among students attending all sessions, those who did not partake in the final exam were excluded. The average grades table was then merged with the final grades, followed by cleaning of behavioral data related to students. As the system stored all student activities in a transactional format, using raw data was impractical due to unrelated transactions causing noise. Data with “other” or empty values in the activity attribute were removed to mitigate noise. Additionally, features indicating class start and end times were leveraged to create a new feature called class duration. Furthermore, the feature of idle time, although accurately recorded, was deemed unreliable in indicating whether the student was studying or engaging in other activities. Hence, this feature was removed from the dataset. Finally, the grades table was merged with the table of students’ behavioral features for the final analysis. It is noteworthy that the limited number of records in the Deeds dataset makes it particularly susceptible to noise, underscoring the sensitivity of the preprocessing process for Deeds.
This section delineates the execution of six classic ML algorithms: nearest neighbor, random forest, decision tree, simple Bayes, logistic regression, and enhanced gradient. The dataset was partitioned into 70% for training and 30% for testing purposes.
The SKlearn library, along with the KNeighborsClassifier() module, facilitated the execution of K-nearest neighbor (KNN) algorithm. Logistic regression was implemented using the logistic regression() module from the SKlearn library. For decision tree and random forest algorithms, the DecisionTree() and RandomForestClassifier() modules were employed, respectively. The simple Bayes algorithm was executed using the GaussianNB() module. The Extreme Gradient Boosting algorithm was implemented using the XGboost library, with the XGBClassifier() module, and executed with its default hyperparameters.
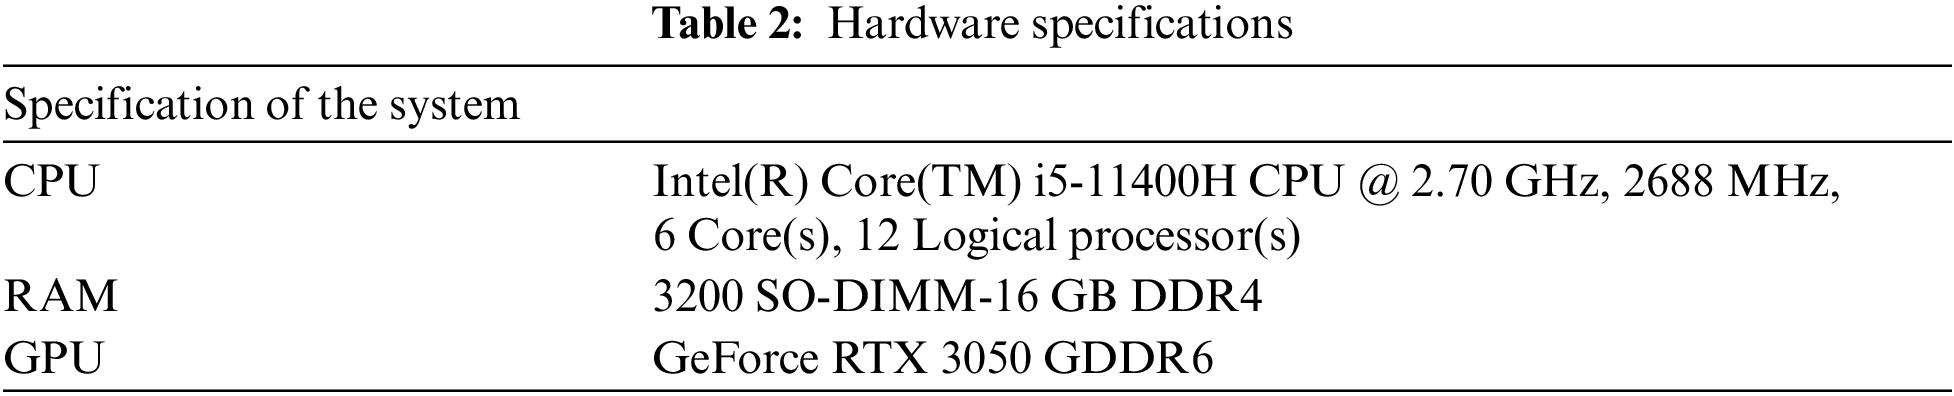
In the initial stages of the research, attempts were made to utilize the StackingClassifier module from both the mlxtend.classifier and sklearn.ensemble libraries. However, upon implementing this method, it was observed that, despite various efforts, the highest accuracy achieved using these modules did not significantly surpass that of the basic models (weak learners). Furthermore, these libraries are designed in a manner that consumes considerable system resources such as RAM and processor. Consequently, this results in long processing times; for instance, executing a stacking algorithm on the OULAD dataset required 49,781 s, equivalent to approximately 13 h and 50 min. These timeframes were recorded using a system with the specifications detailed in Table 2. To address these issues, efforts were made to rewrite the stacking algorithm to be more lightweight.
As mentioned before we rewrite and improve the stacking algorithm. For this at first, the basic models or weak learners were defined; then, six classifiers of logistic regression, decision tree, random forest, simple Bayes, nearest neighbor, and enhanced gradient were performed. After this, the final learner of the model was defined to start the stacking process (Fig. 2).
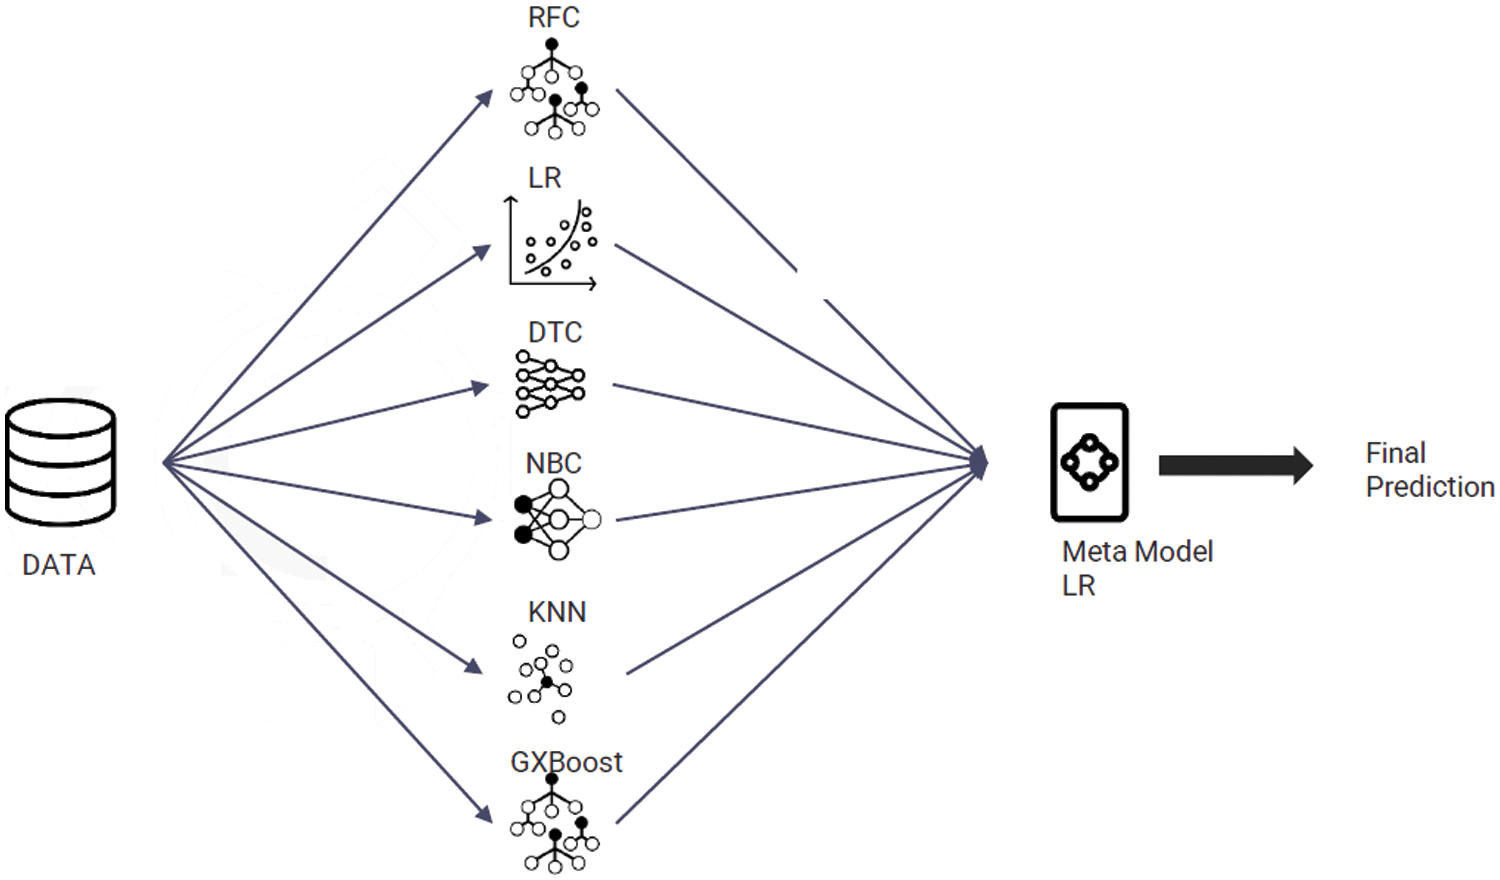
Figure 2: The proposed stacking model components
Stacking begins with employing the K-fold cross-validation method for each classifier in the ensemble of weak learner models. Subsequently, the training data outputs serve as the input for the final learner model, while the test data outputs are designated as the test data for the final learner model. In other words, instead of aggregating or averaging the outputs of weak learners, these outputs are utilized as inputs for another model. It should be noted that for regression problems, the outputs of weak learners are in the form of real values, whereas for classification problems, the outputs can be probability values or class labels. Given that this research deals with a classification problem, class labels are utilized for the outputs. Weak learners often comprise models with high complexity and varied nature, while meta-models typically consist of models with low complexity. For instance, logistic regression algorithms are employed for classification tasks, and linear regression algorithms are used for regression tasks. However, depending on the nature of the problem and the data, any algorithm can be employed. In implementing this stage, it is crucial to recognize that unlike Bagging, which utilizes multiple weak learners, and unlike Boosting, which utilizes only one model to combine weak learners, Stacking employs multiple weak learners and only one model for combining them.
In this section, we present the results of both this stacking method and traditional ML methods using the OULAD and Deeds datasets in e-learning. Additionally, we compare the obtained results. We utilized the GridSearchCV module in all sections to determine the best parameters. Four metrics—F1 Score, Precision, Recall, and Accuracy—have been taken into account in executing simple data mining algorithms. Figs. 3 to 6 illustrate the calculation of F1 Score, Precision, and Recall metrics for both “failed” and “pass” classes. Although k-fold cross-validation commonly relies on accuracy as the primary evaluation metric, it is not the only metric used. Accuracy, which defines the proportion of correctly classified instances relative to the total dataset, is preferred for its simplicity and comprehensive reflection of model performance. Additionally, it serves as a widely used benchmarking metric across various studies. Therefore, to ensure comparability and validity in evaluating one’s work against others, accuracy remains a commonly used evaluation metric. In this study, accuracy is also selected as the primary evaluation metric to enable meaningful comparisons with existing literature.
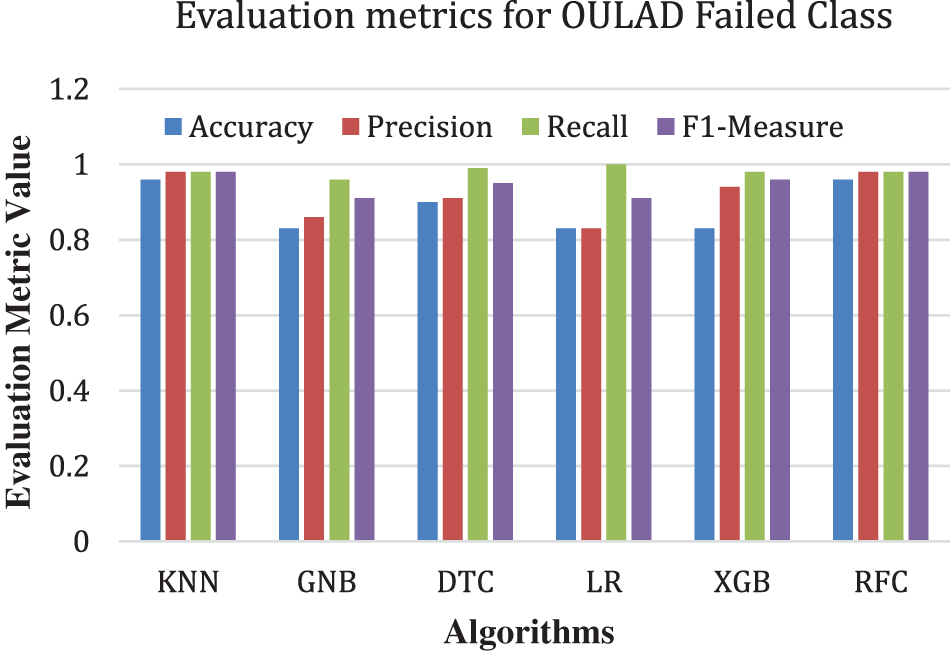
Figure 3: Precision, recall, and F1 measure for the failed class (OULAD)

Figure 4: Precision, recall, and F1 measure for the pass class (OULAD)

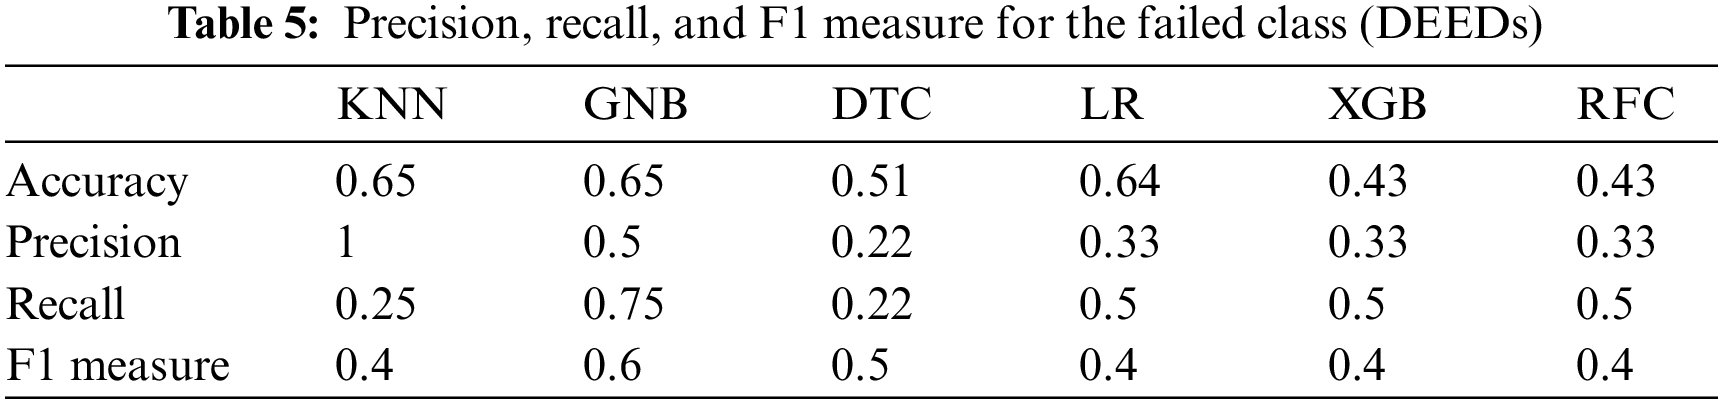
Figure 5: Precision, recall, and F1 measure for the failed class (DEEDs)
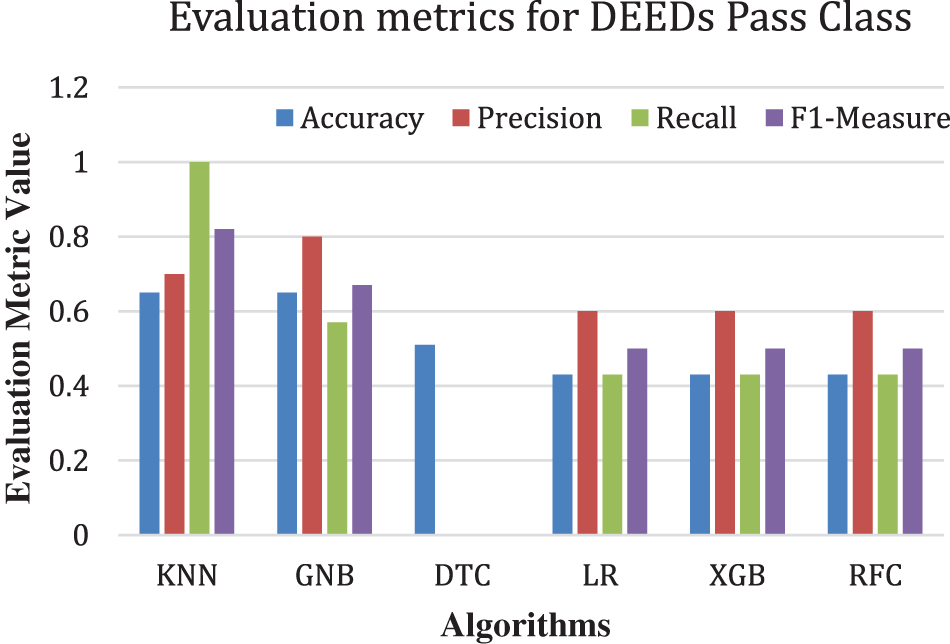
Figure 6: Precision, recall, and F1 measure for the pass class (DEEDs)
4.1 The Results of Implementing Traditional ML Algorithms
This section presents the outcomes of applying traditional ML algorithms to the OULAD dataset. Figs. 3, 4, Tables 3 and 4depict the precision, recall, and F1 measure criteria results for the KNN, simple Bayes, decision tree, logistic regression, enhanced gradient, and random forest algorithms concerning the OULAD dataset. As illustrated in Figs. 3, 4, Tables 3 and 4, the random forest algorithm achieves the highest precision result of 95% in the pass class, while the KNN attains the best performance with 98% precision in the failed class. Regarding recall, the random forest algorithm demonstrates the best results in both pass and fail classes, with 92% and 98%, respectively.
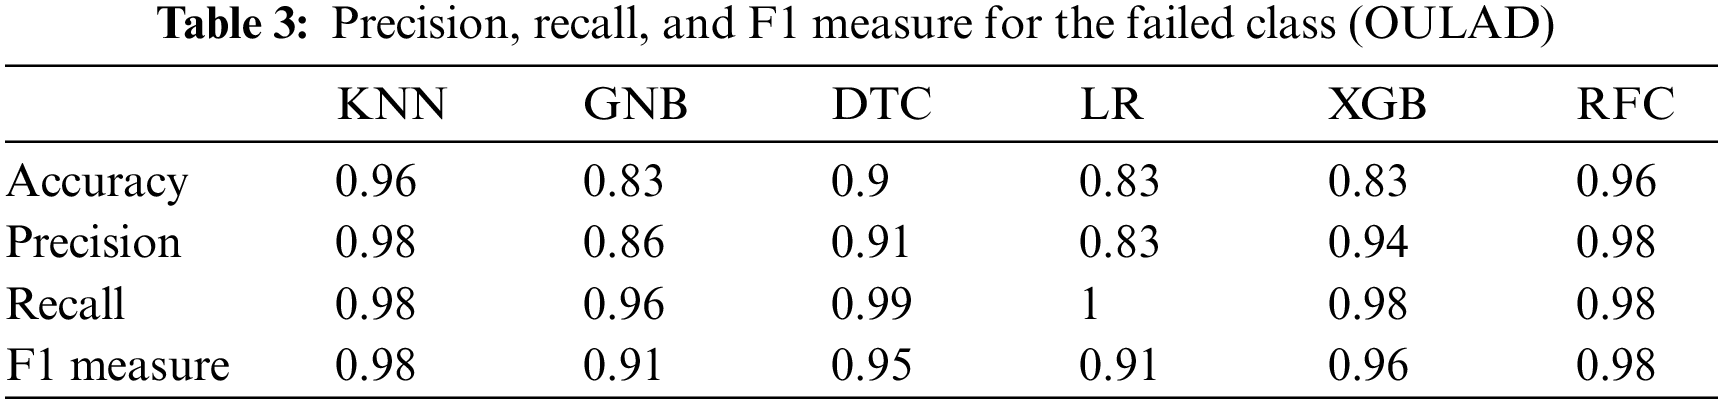
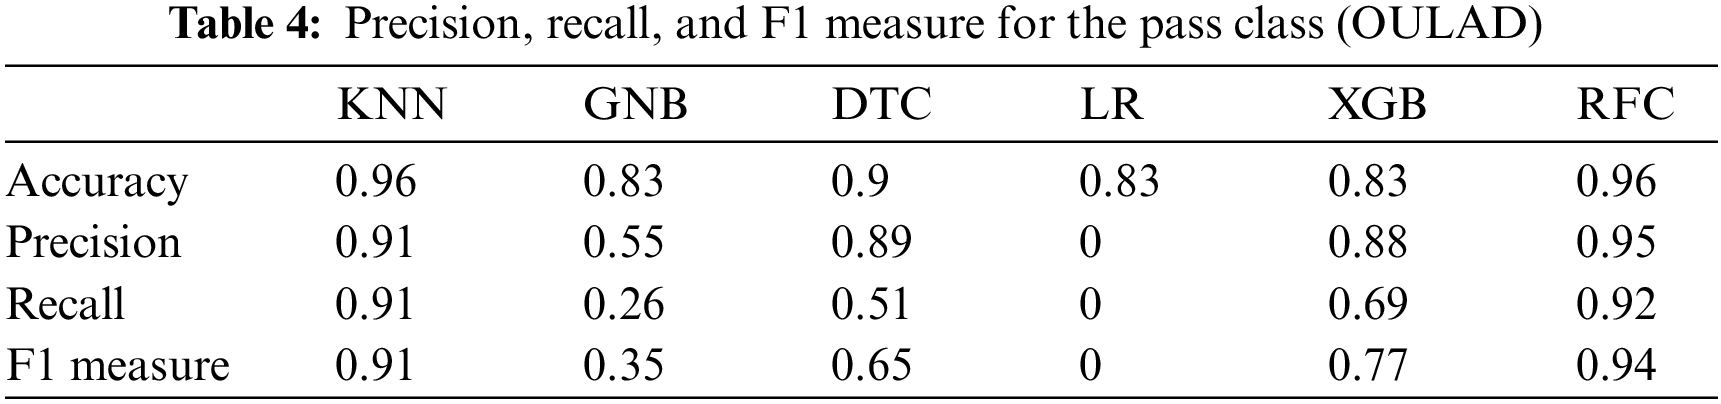
Additionally, the F1 measure yields the highest outcomes for the random forest algorithm with 94% in the pass class and for both the KNN and random forest algorithms with 98% in the failed class. Figs. 5 and 6 and Tables 5 and 6 display the results of the Deeds dataset, wherein the KNN algorithm and the Naive Bayes classifier exhibit the highest accuracy of 65%.

4.2 The Results of Stacking Algorithm
This section delineates the outcomes of various combinations utilized for implementing stacking on both the OULAD and Deeds datasets. Numerous models were generated through trial and error by combining six traditional ML algorithms. As trial and error failed to provide insights into the optimal values for the parameters and hyperparameters of each algorithm, the GridSearchCV module from the scikit-learn library was employed. Fig. 7 and Table 7 illustrate the models yielding the highest accuracy in the OULAD dataset. The highest accuracy in the OULAD dataset was achieved when logistic regression was utilized as the metamodel, alongside KNN, random forest, simple Bayes, XGBoost, logistic regression, and decision tree algorithms serving as weak learners. The accuracy rate for both the training and testing sections reached 98%.

Figure 7: Accuracy in different stacking combinations in the OULAD dataset

Fig. 8 presents the confusion matrix of the final model, obtained through 5-fold validation. It provides insight into the true positives, false positives, true negatives, and false negatives.

Figure 8: Confusion matrix of final model (5-fold validation)
Additionally, Fig. 9 illustrates the ROC curve, showcasing the classifier’s ability to achieve a high true positive rate while simultaneously maintaining a low false positive rate across various thresholds. This performance culminates in an AUC of 0.9, signifying the classifier’s strong discrimination capability.

Figure 9: ROC of proposed model (5-fold validation)
Models with the highest accuracy in the Deeds dataset are depicted in Fig. 10 and Table 8. The best accuracy in the Deeds dataset was obtained when the decision tree was a metamodel, and the KNN, random forest, simple Bayes, logistic regression, and decision tree algorithms were used as weak learners.

Figure 10: Accuracy in different stacking combinations in the deed dataset

Fig. 11 displays the confusion matrix of the final model developed for the DEEDs dataset, employing 5-fold validation. Within this figure, one can observe the values denoting false negatives, true negatives, false positives and true positives. The model achieves an accuracy of 87% during training.

Figure 11: Confusion matrix of DEEDs final model (5-fold validation)
As depicted in the ROC curve (Fig. 12), for smaller datasets such as DEEDs, adjustments in threshold values correspond to larger proportions of the dataset, resulting in more pronounced steps. Conversely, in larger datasets like OULAD, the ROC curve tends to appear smoother due to the availability of more threshold points. Furthermore, certain classifiers, particularly those with binary decision-making mechanisms such as decision trees, produce outputs that are not continuous probabilities but rather distinct classes. Consequently, when these outputs are employed to construct ROC curves, the transitions between various true positive rates (TPR) and false positive rates (FPR) are characterized by abrupt shifts.
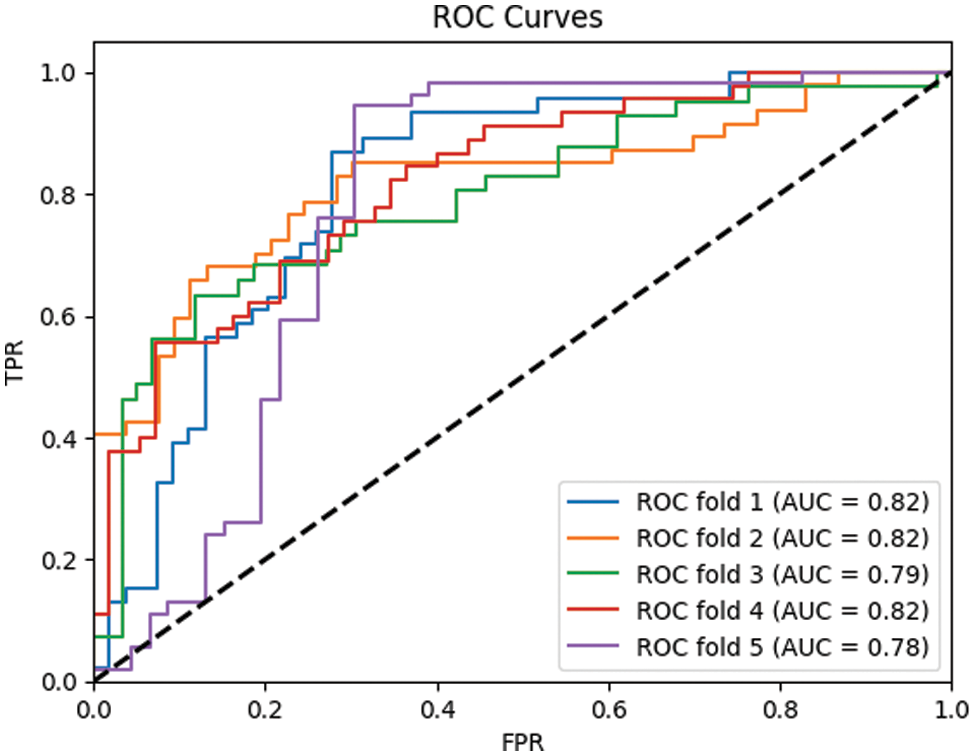
Figure 12: ROC curve of DEEDs final model (5-fold validation)
4.3 Comparison of Stacking Results with Traditional ML Algorithms
Fig. 13 and Table 9 illustrate that in the OULAD dataset, the highest performance among the presented classification algorithms was attributed to KNN with 94% accuracy, which surged to 98% accuracy when employing the stacking algorithm. The proposed stacking approach enhanced accuracy by 4% compared to the conventional method in the OULAD dataset. Additionally, the stacking technique achieved an 87% accuracy rate in the Deeds dataset, indicating a 22% increase in accuracy compared to the KNN and simple Bayes algorithms.
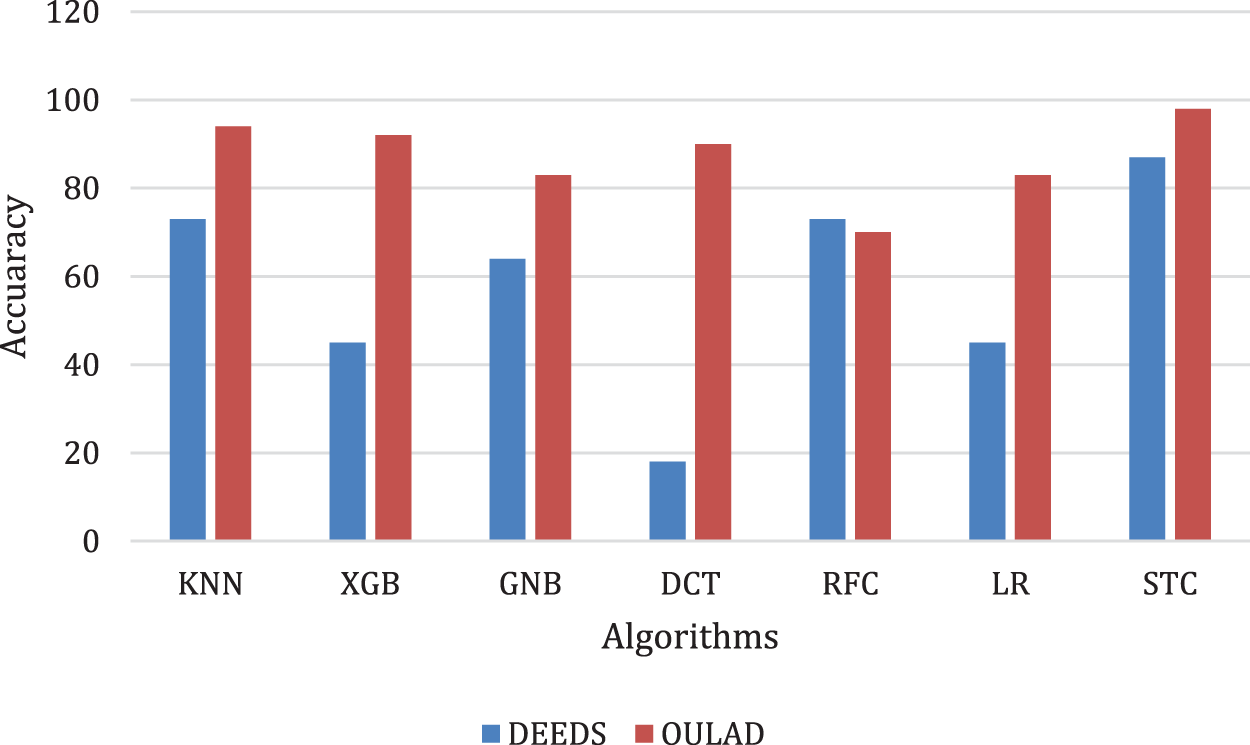
Figure 13: Comparison of all algorithms implemented on OULAD and deeds datasets

4.4 Comparison of Stacking Results with the Related Works
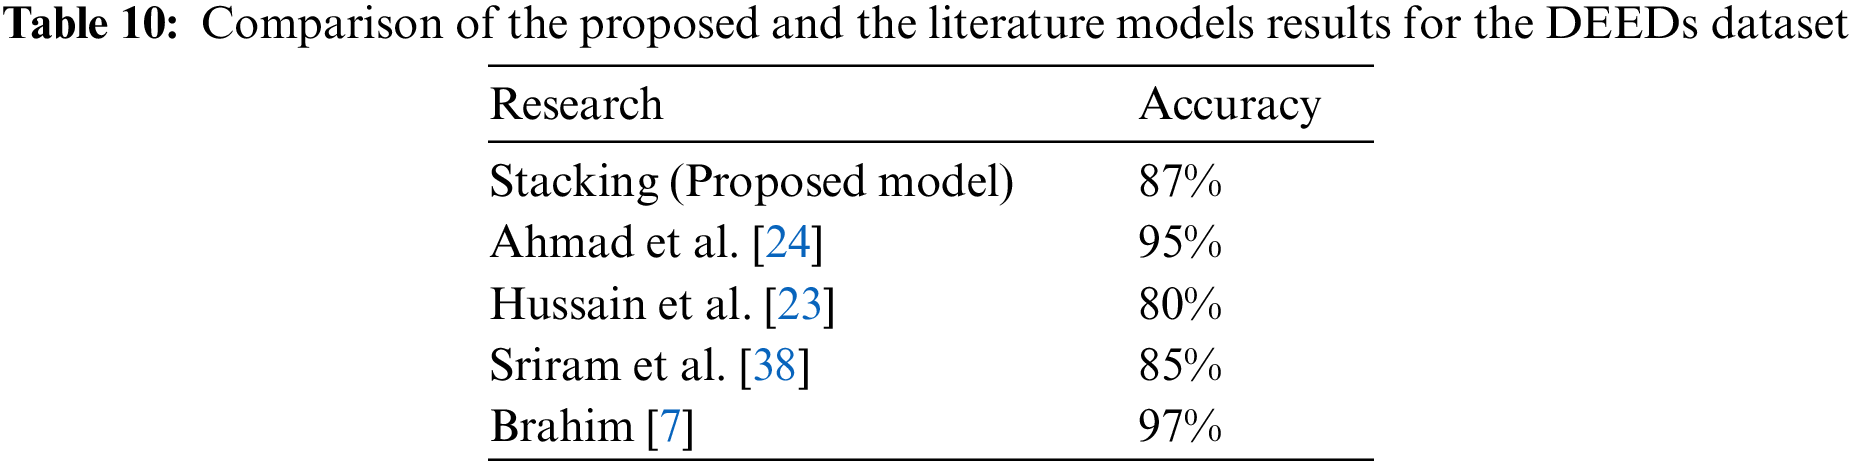
The results were assessed based on accuracy, precision, recall, and F1 Score criteria, revealing enhancements in the outcomes for the OULAD dataset. Both conventional and proposed methods were employed on identical data for result comparison. The primary assessment metric, accuracy, reached 98% in the OULAD datasets. This signifies a 4% and 2% improvement in results compared to traditional methods and alternative modeling approaches in the OULAD dataset, respectively. In the Deeds dataset, the highest accuracy achieved was 87%, indicating a notable 22% enhancement attributed to the stacking method over traditional methods, surpassing other models as well. The superior performance of the stacking methods on the OULAD dataset can be attributed to their broader scope and inclusivity. Unlike Deeds, which merely stored data from 6 class sessions in a transactional format, OULAD encompasses information from various courses across consecutive semesters. It is essential to note that data preprocessing significantly impacts the results directly. Fig. 14 and Table 10 illustrate a comparison of preprocessing techniques applied to the Deeds dataset.
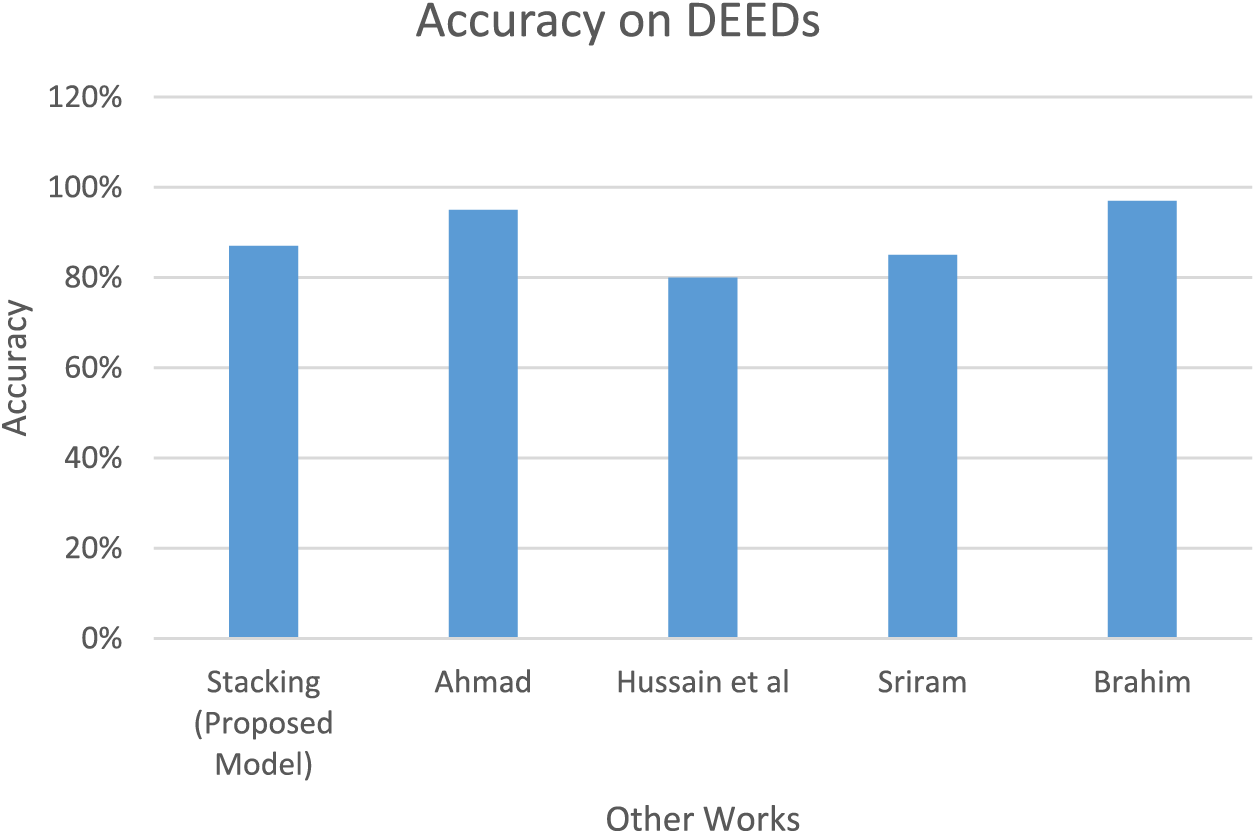
Figure 14: Comparison of the proposed and Ahmad et al. [24], Hussain et al [23], Sriram et al. [38] and Brahim [7] results for the DEEDs dataset [38]
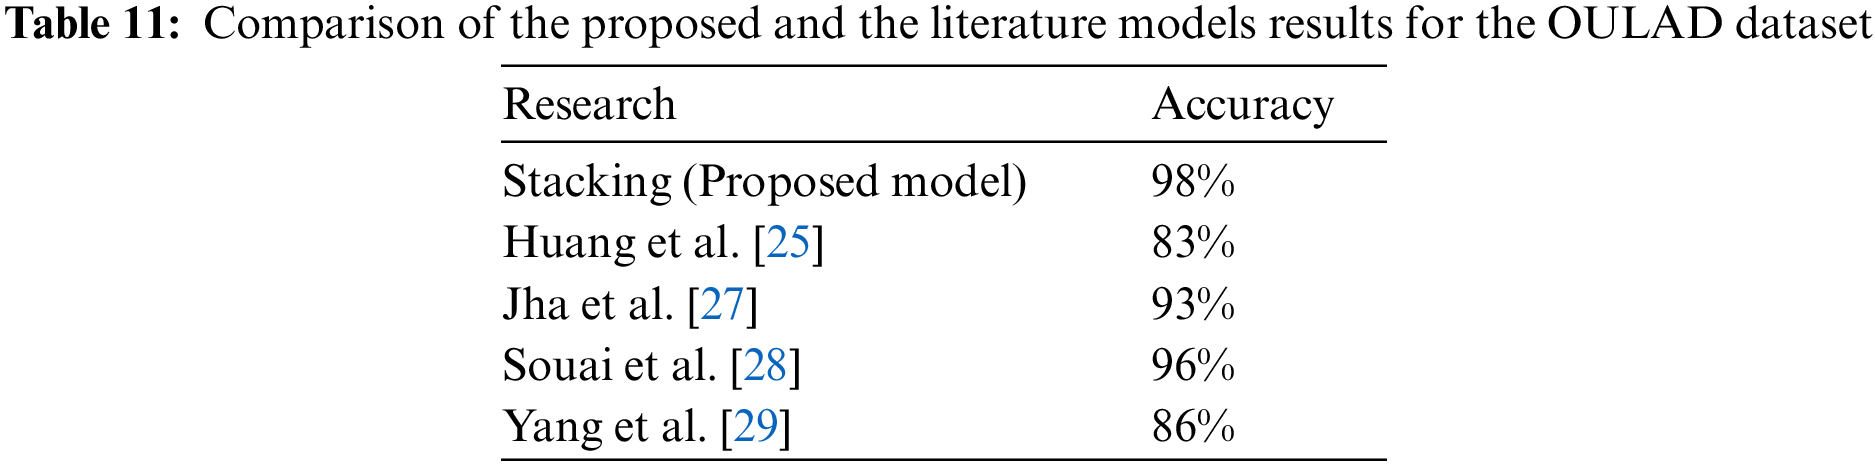
Additionally, Fig. 15 and Table 11 show the accuracy of the proposed model with that of previous works on the OULAD dataset. Overall, the results indicate a 2% enhancement in accuracy compared to the model presented by Souai et al. [28].

Figure 15: Comparison of the proposed and results for the OULAD dataset
Our findings shed light on the differences between conventional data mining methods and stacking approaches implemented on distinct databases. While traditional algorithms were initially deployed and compared with the stacking model results, it became evident that the latter yielded more reliable outcomes. Moreover, through feature selection, particularly in theOULADdataset, our model demonstrated stacking methods' competitiveness with deep learning approaches.However, it is crucial to interpret the results cautiously due to certain limitations. The sample size in theDEEDs dataset was relatively small, making it challenging to identify significant associations in the data. Consequently, our model's efficiency on theDEEDs datasetwas compromised. On the other hand, although accuracy improvement was achieved on the OULAD dataset, further optimization of feature selection methods is warranted.
The aim of this study was to develop a stacking machine learning model for predicting student performance in e-learning based on class activities. Given the importance of feature nature reflecting student behaviors, the OULAD and Deeds datasets were deemed suitable options. After thorough data cleaning and preprocessing, relevant features were selected and analyzed. A predictive model for e-learning student scores utilizing stacking and behavioral data analysis was introduced. Subsequently, the KNN, random forest, decision tree, logistic regression, simple Bayes, and XGBoost algorithms were implemented. Following the recording of results using basic ML models, the stacking algorithm was applied, involving the definition of weak learner models and metamodels. After a trial-and-error process, the logistic regression algorithm was selected as the final learner for the proposed model. The modeling outcomes demonstrated improved performance of the proposed model compared to previous approaches.
A key limitation of this research lies in the high resource consumption associated with the utilization of pre-built stacking models, such as the StackingClassifier from the mlxtend and SKlearn libraries. This consumption of hardware resources results in prolonged processing times, thereby impacting the efficiency of the implementation process. Furthermore, the research is hindered by the lack of reliable datasets. Not only is there a scarcity of trustworthy datasets available, but the quality of the existing data poses challenges, necessitating extensive cleaning and preprocessing efforts.
For future research directions, we suggest exploring the use of neural networks as both weak learners and metamodels within the stacking framework. Additionally, enhancing the preprocessing stage could yield more effective features. Further research focusing on different faculties can also yield interesting results because some studies like [39] have shown that the factors contributing to the success of e-learning may vary across different faculties. Additionally, integrating autoencoders for dimensionality reduction or feature extraction and employing Generative Adversarial Networks (GANs) for synthesizing data to augment training datasets could serve as promising avenues for future research. These endeavors hold potential to propel the state-of-the-art in stacked models, enhancing their efficacy, efficiency, and applicability across diverse problem domains.
Acknowledgement: None.
Funding Statement: The authors did not receive support from any organization for the submitted work.
Author Contributions: The authors confirm contribution to the paper as follows: study conception and design: Mohammad Javad Shayegan and Rosa Akhtari; data collection: Rosa Akhtari; analysis and interpretation of results: Mohammad Javad Shayegan and Rosa Akhtari; draft manuscript preparation: Mohammad Javad Shayegan and Rosa Akhtari. All authors reviewed the results and approved the final version of the manuscript.
Availability of Data and Materials: The datasets generated and/or analysed during the current study are available in the following repositories: https://analyse.kmi.open.ac.uk/open_dataset (accessed on 22 May 2022); https://archive.ics.uci.edu/dataset/346/educational+process+mining+epm+a+learning+analytics+data+set (accessed on 4 September 2022).
Ethics Approval: Not applicable.
Conflicts of Interest: The authors declare that they have no conflicts of interest to report regarding the present study.
References
1. S. Batool, J. Rashid, M. W. Nisar, J. Kim, H.Y. Kwon and A. Hussain, “Educational data mining to predict students’ academic performance: A survey study,” Educ. Inform. Technol., vol. 28, no. 1, pp. 905–971, 2023. doi: 10.1007/s10639-022-11152-y. [Google Scholar] [CrossRef]
2. Ş. Aydoğdu, “Predicting student final performance using artificial neural networks in online learning environments,” Educ. Inform. Technol., vol. 25, no. 3, pp. 1913–1927, 2020. doi: 10.1007/s10639-019-10053-x. [Google Scholar] [CrossRef]
3. M. N. Al-Nuaimi and M. Al-Emran, “Learning management systems and technology acceptance models: A systematic review,” Educ. Inform. Technol., vol. 26, no. 5, pp. 5499–5533, 2021. doi: 10.1007/s10639-021-10513-3. [Google Scholar] [CrossRef]
4. U. Alturki and A. Aldraiweesh, “Application of learning management system (LMS) during the COVID-19 pandemic: A sustainable acceptance model of the expansion technology approach,” Sustainability, vol. 13, no. 19, pp. 10991, 2021. doi: 10.3390/su131910991. [Google Scholar] [CrossRef]
5. A. T. Esawe, K. T. Esawe, and N. T. Esawe, “Acceptance of the learning management system in the time of COVID-19 pandemic: An application and extension of the unified theory of acceptance and use of technology model,” E-Learn. Digit. Med., vol. 20, no. 2, pp. 162–190, 2023. doi: 10.1177/20427530221107788. [Google Scholar] [CrossRef]
6. L. Pereira and J. Guerreiro, “Evaluation on moodle LMS data usage during the first wave of COVID-19’s pandemic,” presented at the Int. Conf. Human-Comput. Interaction (HCII2021Washington, DC, USA, Jul. 24–29, 2021, pp. 154–166. doi: 10.1007/978-3-030-78095-1_13. [Google Scholar] [CrossRef]
7. G. B. Brahim, “Predicting student performance from online engagement activities using novel statistical features,” Arab. J. Sci. Eng., vol. 47, no. 8, pp. 10225–10243, 2022. doi: 10.1007/s13369-021-06548-w. [Google Scholar] [PubMed] [CrossRef]
8. J. E. Lee and M. Recker, “Predicting student performance by modeling participation in asynchronous discussions in university online introductory mathematical courses,” Educ. Technol. Res. Dev., vol. 70, no. 6, pp. 1993–2015, 2022. doi: 10.1007/s11423-022-10153-5. [Google Scholar] [CrossRef]
9. R. Dey and R. Mathur, “Ensemble learning method using stacking with base learner, A comparison,” presented at the Int. Conf. Data Anal. Insights (ICDAI 2023Kolkata, India, May 11–13, 2023, pp. 159–169. [Google Scholar]
10. M. Rashid, J. Kamruzzaman, T. Imam, S. Wibowo, and S. Gordon, “A tree-based stacking ensemble technique with feature selection for network intrusion detection,” Appl. Intell., vol. 52, no. 9, pp. 9768–9781, 2022. doi: 10.1007/s10489-021-02968-1. [Google Scholar] [CrossRef]
11. D. U. Bolliger and F. Martin, “Instructor and student perceptions of online student engagement strategies,” Distance Educ., vol. 39, no. 4, pp. 568–583, 2018. doi: 10.1080/01587919.2018.1520041. [Google Scholar] [CrossRef]
12. M. G. Moore, “Editorial: Three types of interaction,” Am. J. Distance Educ., vol. 3, no. 2, pp. 1–7, 1989. doi: 10.1080/08923648909526674. [Google Scholar] [CrossRef]
13. A. W. Cole, L. Lennon, and N. L. Weber, “Student perceptions of online active learning practices and online learning climate predict online course engagement,” Interact. Learn. Environ., vol. 29, no. 5, pp. 866–880, 2021. doi: 10.1080/10494820.2019.1619593. [Google Scholar] [CrossRef]
14. A. Moubayed, M. Injadat, A. Shami, and H. Lutfiyya, “Student engagement level in an e-learning environment: Clustering using K-means,” Am. J. Distance Educ., vol. 34, no. 2, pp. 137–156, 2020. doi: 10.1080/08923647.2020.1696140. [Google Scholar] [CrossRef]
15. L. Ali and N. A. H. H. A. Dmour, “The shift to online assessment due to COVID-19: An empirical study of university students, behaviour and performance, in the region of UAE,” Int. J. Inf. Educ. Technol., vol. 11, no. 5, pp. 220–228, 2021. doi: 10.18178/ijiet.2021.11.5.1515. [Google Scholar] [CrossRef]
16. P. Bhardwaj, P. K. Gupta, H. Panwar, M. K. Siddiqui, R. Morales-Menendez and A. Bhaik, “Application of deep learning on student engagement in e-learning environments,” Comput. Electr. Eng., vol. 93, pp. 107277, Jul. 2021. doi: 10.1016/j.compeleceng.2021.107277. [Google Scholar] [PubMed] [CrossRef]
17. Y. C. Semerci and D. Goularas, “Evaluation of students’ flow state in an e-learning environment through activity and performance using deep learning techniques,” J. Educ. Comput. Res., vol. 59, no. 5, pp. 960–987, 2020. doi: 10.1177/0735633120979836. [Google Scholar] [CrossRef]
18. C. C. Gray and D. Perkins, “Utilizing early engagement and machine learning to predict student outcomes,” Comput. Edu., vol. 131, pp. 22–32, 2019. doi: 10.1016/j.compedu.2018.12.006. [Google Scholar] [CrossRef]
19. A. Lincke, M. Jansen, M. Milrad, and E. Berge, “The performance of some machine learning approaches and a rich context model in student answer prediction,” Res. Pract. Technol. Enhanc. Learn., vol. 16, no. 1, pp. 10, 2021. doi: 10.1186/s41039-021-00159-7. [Google Scholar] [CrossRef]
20. C. Lu and M. Cutumisu, “Online engagement and performance on formative assessments mediate the relationship between attendance and course performance,” Int. J. Educ. Technol. High. Educ., vol. 19, no. 1, pp. 2, 2022. doi: 10.1186/s41239-021-00307-5. [Google Scholar] [PubMed] [CrossRef]
21. A. A. Mubarak, H. Cao, I. M. Hezam, and F. Hao, “Modeling students’ performance using graph convolutional networks,” Complex Intell. Syst., vol. 8, no. 3, pp. 2183–2201, 2022. doi: 10.1007/s40747-022-00647-3. [Google Scholar] [PubMed] [CrossRef]
22. J. Hao, J. Gan, and L. Zhu, “MOOC performance prediction and personal performance improvement via Bayesian network,” Educ. Inform. Technol., vol. 27, pp. 1–24, 2022. doi: 10.1007/s10639-022-10926-8. [Google Scholar] [CrossRef]
23. M. Hussain, W. Zhu, W. Zhang, S. M. R. Abidi, and S. Ali, “Using machine learning to predict student difficulties from learning session data,” Artif. Intell. Rev., vol. 52, no. 1, pp. 381–407, 2019. doi: 10.1007/s10462-018-9620-8. [Google Scholar] [CrossRef]
24. M. Ahamad and N. Ahmad, “Machine learning approaches to digital learning performance analysis,” Int. J. Comput. Digit. Syst., vol. 10, pp. 963–971, 2021. doi: 10.12785/ijcds/100187. [Google Scholar] [CrossRef]
25. H. Huang, S. Yuan, T. He, and R. Hou, “Use of behavior dynamics to improve early detection of at-risk students in online courses,” Mob. Netw. Appl., vol. 27, no. 1, pp. 441–452, 2022. doi: 10.1007/s11036-021-01844-z. [Google Scholar] [CrossRef]
26. O. Dermy, A. Roussanaly, and A. Boyer, “Using behavioral primitives to model students’ digital behavior,” Procedia Comput. Sci., vol. 207, pp. 2444–2453, 2022. doi: 10.1016/j.procs.2022.09.302. [Google Scholar] [CrossRef]
27. N. Jha, I. Ghergulescu, and A. N. Moldovan, “OULAD MOOC dropout and result prediction using ensemble,” presented at the 1th Int. Conf. Comput. Supp. Educ. (CSEDU 2019), Heraklion, Greece, May 2–4, 2019, pp. 154–164. [Google Scholar]
28. W. Souai, A. Mihoub, M. Tarhouni, S. Zidi, M. Krichen and S. Mahfoudhi, “Predicting at-risk students using the deep learning BLSTM approach,” presented at the 2022 2nd Int. Conf. Smart Syst. Emerg. Technol. (SMARTTECHRiyadh, Saudi Arabia, May 9–11, 2022, pp. 32–37. doi: 10.1109/SMARTTECH54121.2022.00022. [Google Scholar] [CrossRef]
29. L. Yang and Z. Bai, “Study on score prediction model with high efficiency based on deep learning,” Electronics, vol. 11, no. 23, pp. 3995, 2022. doi: 10.3390/electronics11233995. [Google Scholar] [CrossRef]
30. J. C. H. So et al., “Analytic study for predictor development on student participation in generic competence development activities based on academic performance,” IEEE Trans. Learn. Technol., vol. 16, no. 5, pp. 790–803, 2023. doi: 10.1109/TLT.2023.3291310. [Google Scholar] [CrossRef]
31. J. A. Talamás-Carvajal and H. G. Ceballos, “A stacking ensemble machine learning method for early identification of students at risk of dropout,” Educ. Inform. Technol., vol. 28, no. 9, pp. 12169–12189, 2023. doi: 10.1007/s10639-023-11682-z. [Google Scholar] [CrossRef]
32. P. Buono, B. De Carolis, F. D’Errico, N. Macchiarulo, and G. Palestra, “Assessing student engagement from facial behavior in on-line learning,” Multimed. Tools Appl., vol. 82, no. 9, pp. 12859–12877, 2023. doi: 10.1007/s11042-022-14048-8. [Google Scholar] [PubMed] [CrossRef]
33. A. Kukkar, R. Mohana, A. Sharma, and A. Nayyar, “Prediction of student academic performance based on their emotional wellbeing and interaction on various e-learning platforms,” Educ. Inform. Technol., vol. 28, no. 8, pp. 9655–9684, 2023. doi: 10.1007/s10639-022-11573-9. [Google Scholar] [CrossRef]
34. A. A. Alsulami, A. S. A. M. AL-Ghamdi, and M. Ragab, “Enhancement of e-learning student’s performance based on ensemble techniques,” Electronics, vol. 12, no. 6, pp. 1508, 2023. doi: 10.3390/electronics12061508. [Google Scholar] [CrossRef]
35. P. Nayak, S. Vaheed, S. Gupta, and N. Mohan, “Predicting students’ academic performance by mining the educational data through machine learning-based classification model,” Educ. Inform. Technol., vol. 28, no. 11, pp. 14611–14637, 2023. doi: 10.1007/s10639-023-11706-8. [Google Scholar] [CrossRef]
36. J. Kuzilek, M. Hlosta, and Z. Zdrahal, “Open university learning analytics dataset,” Sci. Data, vol. 4, no. 1, pp. 170171, 2017. doi: 10.1038/sdata.2017.171. [Google Scholar] [PubMed] [CrossRef]
37. M. Vahdat, L. Oneto, D. Anguita, M. Funk, and M. Rauterberg, “A learning analytics approach to correlate the academic achievements of students with interaction data from an educational simulator,” in G. Conole, T. Klobučar, C. Rensing, J. Konert, and E. Lavoué, Eds. Design for Teaching and Learning in a Networked World, Cham: Springer International Publishing, 2015, pp. 352–366. [Google Scholar]
38. K. Sriram, T. Chakravarthy, and K. Anastraj, “A comparative analysis of student performance prediction using machine learning techniques with DEEDS lab,” J. Compos. Theory, vol. 12, pp. 14–23, 2019. doi: 10.1007/s10639-023-11672-1. [Google Scholar] [CrossRef]
39. M. J. Shayegan and A. Ashoori, “Evaluating success of e-learning in different faculties of a university,” Int. J. Web Res., vol. 5, no. 2, pp. 61–69, 2022. doi: 10.22133/ijwr.2023.377551.1148. [Google Scholar] [CrossRef]
Cite This Article
 Copyright © 2024 The Author(s). Published by Tech Science Press.
This work is licensed under a Creative Commons Attribution 4.0 International License , which permits unrestricted use, distribution, and reproduction in any medium, provided the original work is properly cited.
 Downloads
 Citation Tools