
 Submit a Paper
 Propose a Special lssue
 Open Access
ARTICLE
MPDP: A Probabilistic Architecture for Microservice Performance Diagnosis and Prediction
Department of Computer Science, College of Computer Science and Engineering, Taibah University, Madinah, 42353, Saudi Arabia
* Corresponding Author: Talal H. Noor. Email:
Computer Systems Science and Engineering 2024, 48(5), 1273-1299. https://doi.org/10.32604/csse.2024.052510
Received 04 April 2024; Accepted 01 July 2024; Issue published 13 September 2024
 View Full Text
 Download PDF
Abstract
In recent years, container-based cloud virtualization solutions have emerged to mitigate the performance gap between non-virtualized and virtualized physical resources. However, there is a noticeable absence of techniques for predicting microservice performance in current research, which impacts cloud service users’ ability to determine when to provision or de-provision microservices. Predicting microservice performance poses challenges due to overheads associated with actions such as variations in processing time caused by resource contention, which potentially leads to user confusion. In this paper, we propose, develop, and validate a probabilistic architecture named Microservice Performance Diagnosis and Prediction (MPDP). MPDP considers various factors such as response time, throughput, CPU usage, and other metrics to dynamically model interactions between microservice performance indicators for diagnosis and prediction. Using experimental data from our monitoring tool, stakeholders can build various networks for probabilistic analysis of microservice performance diagnosis and prediction and estimate the best microservice resource combination for a given Quality of Service (QoS) level. We generated a dataset of microservices with 2726 records across four benchmarks including CPU, memory, response time, and throughput to demonstrate the efficacy of the proposed MPDP architecture. We validate MPDP and demonstrate its capability to predict microservice performance. We compared various Bayesian networks such as the Noisy-OR Network (NOR), Naive Bayes Network (NBN), and Complex Bayesian Network (CBN), achieving an overall accuracy rate of 89.98% when using CBN.Keywords
As application requirements continue to evolve, cloud computing enables the acquisition and release of computing resources on demand. Users can rent various types of computational resources, each with its costs and properties, including specialized hardware like Field Programmable Gate Arrays (FPGAs), Graphics Processing Units (GPUs), Virtual Machines (VMs), bare-metal resources, or containers. Effective automated control of cloud resource de-provisioning requires consideration of several key aspects [1] including resource utilization, provisioning and management costs, and automatable resource management actions.
Cloud providers such as Google Compute Engine (GCE) or Amazon Lambda increasingly offer resource provisioning services such as Infrastructure as a Service (IaaS), Platform as a Service (PaaS), and Software as a Service (SaaS) using a billing technique based on seconds or even milliseconds. Therefore, it is crucial to recognize the performance implications associated with deploying, terminating, and maintaining container hosting functions, as this influences a provider’s ability to offer users more granular charging options for stream analytics or processing application requirements. Several factors affect provisioning and de-provisioning operations, primarily [2] including overheads related to actions (e.g., starting a new virtual machine may take minutes) [3]; and variations in processing time due to resource contention, leading to potential user confusion.
The rapid advancement of web services significantly impacts business outcomes, as an increasing number of companies utilize the cloud to deliver services. Agile development, coupled with DevOps [4], is employed by developers to accelerate the delivery of web services. Microservice architecture, proposed by Lewis et al. [5], has emerged because of the widespread adoption of agile development. Lewis and Fowler define microservices as “a particular way of designing software applications as suites of independently deployable services.” These microservices leverage lightweight mechanisms such as Hypertext Transfer Protocol (HTTP) resources and Application Programming Interfaces (APIs) to communicate and execute their processes. This architecture enables developers to update specific segments of a web service without disrupting or shutting down the entire service, fulfilling a critical requirement for continuous integration in agile development [6].
As the global trend toward microservice architecture development continues, cloud vendors must accommodate numerous microservices. Individual services within the microservice architecture use HTTP or other standard protocols for web communication [7]. Additionally, developers utilize Docker containers to develop web services within the microservice architecture.
Docker containers provide the capability to isolate and manage resources within a process set. Operating under the Linux kernel, Docker containers are virtualized at the operating system level, distinguishing them from full virtualization methods like virtual machines. This results in reduced overhead and lightweight operation [8].
Application containerization, such as deploying application components in containers, has gained popularity in the cloud services industry. For instance, Google offers all its renowned products on a container-based platform. Docker containers contain all necessary application software packages, facilitating quick and easy development and execution of different product versions [9].
Container-based applications are often referred to as microservices and are employed by various service providers for multiple reasons, including reducing complexity by utilizing small operating systems, efficiently managing, removing, and introducing components, enhancing consistency across different systems and tools, improving overall optimization, and enhancing device durability. Containers have led to increased adoption of lightweight microservice architectures, offering rapid startup times and low power consumption [8,9].
The primary focus of much of the current research has been on performance modeling of multi-tier applications in cloud data centers using virtualization technologies based on hypervisors. These technologies enable cloud providers to create unique virtual machines sharing physical hardware resources such as CPU, network, disk, and memory [10]. Although hypervisor-based virtualization offers enhanced security, it often comes with a performance overhead due to each virtual machine having its operating system image. In recent years, cloud virtualization solutions based on containers like Docker and Linux Containers (LXC) have emerged to bridge the performance gap between non-virtualized and virtualized physical resources. However, there is a notable absence of microservice performance prediction techniques in the literature, which hinders the ability to accurately differentiate and explain differences in overhead performance between infrastructures and containers.
For example, akin to hypervisor-based infrastructure, the container engine distributes resources of a single host among several containers, yet each virtual machine receives its separate resources from hypervisors. Additionally, the runtime performance of a containerized web or database microservice hinges on factors such as the physical host and the configuration of resources like memory size and assigned CPU cores [11]. When containerized web services are deployed on hypervisor-based cloud infrastructure, it is imperative to conduct multi-level modeling across each application level, encompassing both containers and virtual machine levels. Service providers require a diverse array of tracking instruments on their networks to capture data from customers for real-time results. Microservice providers face two major challenges: determining the appropriate metrics to track container-based microservices and identifying anomalous behavior even after collecting measurements [11]. Merely examining the difficulty of determining the underlying reason for microservice performance by examining the impact of several influencing factors alone is insufficient.
The need to close the performance gap between non-virtualized and virtualized resources and the growing popularity of container-based cloud virtualization solutions are the driving forces behind the proposed Microservice Performance Diagnosis and Prediction (MPDP) model. The inability to forecast microservice performance notwithstanding these developments has a substantial impact on cloud service users’ capacity to deploy or de-provision microservices effectively. Because of things like resource contention and variances in processing time, it might be difficult to predict microservice performance and confuse users. To enable precise diagnosis and prediction of microservice performance, the MPDP architecture dynamically models interactions between different microservice performance indicators, such as response time, throughput, and CPU consumption.
This paper proposes, develops, and validates a probabilistic model called Microservice Performance Diagnosis and Prediction (MPDP). MPDP considers various factors such as response time, throughput, CPU usage, and other metrics to dynamically model interactions between microservice performance indicators for diagnosis and prediction. We illustrate how stakeholders can construct different networks for analyzing microservice performance diagnosis and prediction probabilistically and anticipate the optimal combination of microservice resources for a specific Quality of Service (QoS) level using experimental data obtained from our monitoring tool. To illustrate the effectiveness of the proposed MPDP architecture, we gathered our dataset of microservices which comprises 2726 records across four benchmarks: CPU, memory, response time, and throughput. We have conducted validation for MPDP and showcased its proficiency in predicting microservices performance. Furthermore, we compared various Bayesian networks, such as the Noisy-OR Network (NOR), Naive Bayes Network (NBN), and Complex Bayesian Network (CBN), achieving an overall accuracy rate of 89.98% when using CBN.
The key features of the proposed MPDP model include:
• Through monitoring agents, which are combined into the conceptual framework of a Smart-Agent (SA), real-time monitoring of data described by metrics is carried out.
• Fault injection is implemented by mounting an injection agent on each service container. CPU and memory faults are simulated by certain software deployments and managed through a Secure Shell (SSH) protocol connection.
• With the use of Bayesian networks and the Expectation Maximization algorithm, benchmarking analysis enables accurate diagnosis and prediction of stochastic microservice performance even in the case of sparse or restricted data.
The remaining sections of the paper are structured as follows: Section 2 discusses the related work. Section 3 provides an overview of MPDP architecture. Section 4 covers the MPDP implementation. Section 5 details the experiments and analyzes the results. Finally, Section 6 concludes the paper and discusses the future work.
The issue of monitoring and diagnosing microservice performance has garnered significant attention among researchers recently. Several surveys have been conducted to explore topics such as challenges, emerging technologies, and future research directions in microservice monitoring and performance diagnosis [12–16].
Some researchers focused on monitoring and performance diagnosis of microservices. For example, Gribaudo et al. [17] address the challenge of decision-making support concerning the design, maintenance, and management of infrastructures based on microservices. They introduce a novel approach for evaluating the performance of infrastructures that facilitate the operation of microservice-based software applications. Their approach facilitates parametric simulation, enabling providers to model such architectures, especially in scenarios involving diverse and adjustable workloads. The primary objective of this approach is to provide an initial estimation of how various classes of microservice-based applications may behave under specific system configurations. Wu et al. [18] address the challenge of identifying problematic microservices. This task is challenging due to the highly distributed and complex architecture of microservices. The authors propose a system that is not specific to any application but aims to pinpoint the causes of performance degradation in microservices. Their approach involves creating a service dependency graph to identify potential problematic services and then utilizing an autoencoder to detect abnormal service metrics based on a predefined list of errors. In contrast to research works that concentrate on microservice monitoring and performance diagnosis either through infrastructure analysis or identification of problematic microservices via service dependency graphs, this paper showcases how stakeholders can construct various models for probabilistic microservice performance analysis and prediction. It illustrates how stakeholders can anticipate the optimal resource combination for achieving specific levels of Quality of Service (QoS) using experimental data collected by our monitoring tool. Moreover, we incorporated well-known key QoS metrics such as CPU, memory, response time, and throughput to comprehensively diagnose microservice performance [13,16].
However, there is a growing interest among researchers in exploring monitoring and performance diagnosis within cloud services. The evolution of cloud services has opened new opportunities for cloud applications. Analysis, benchmarking, and prediction of cloud performance have become focal points of interest for both industry and academia [19–23]. Various domains in the cloud, such as Amazon CloudWatch [19], CloudHarmony [20], and Cloud Workbench [24], have previously developed benchmarking and monitoring systems for cloud businesses and academic institutions. These platforms provide user-friendly visual tools, allowing modelers to concentrate solely on simulation parameters without delving into system intricacies. Bashar [25] employs Bayesian networks (BNs) for cloud autoscaling to fulfill the required Quality of Service (QoS) and service level agreement (SLA) objectives. According to the author’s preliminary research, BNs are capable of modeling workloads and QoS factors like CPU utilization and response time. An empirical study by Philipp et al. [26] focuses on evaluating the performance predictability of public Infrastructure-as-a-Service (IaaS) clouds by systematically reviewing previous studies and conducting in-person experiments. The authors present fifteen theories about why performance varies in IaaS systems, ranging from temporal impacts to hardware heterogeneity and multi-tenancy. Four cloud providers are used for empirical validation, which shows significant platform-level performance variations and emphasizes the effect of multi-tenancy on performance predictability. Hardware heterogeneity is discovered to be less common than previously thought, while multi-tenancy is found to be a significant predictor of performance variances. The study emphasizes the necessity of more investigation to improve benchmarking techniques and broaden our comprehension of cloud performance dynamics. Simon et al.’s [27] research work seeks to understand the stability of performance tests for serverless apps. By examining two datasets repeats of the same performance test over ten months and repetitions of the test for varied memory sizes and load intensities. Laaber et al.’s [28] research examine performance microbenchmarking using public cloud services. The findings of the study demonstrate that there are significant differences in the variability of microbenchmarking outcomes between cloud provider benchmarks and instance kinds. Still, statistical analysis can be used to identify slowdowns by running a test on the same instance. Eismann et al.’s [29] research work investigates software development’s move toward microservice-based architectures. Small, focused services define these designs, which provide advantages like flexibility and scalability. Performance testing has difficulties even though microservices enable targeted functional testing. In the past, creating baseline metrics for software versions to compare was a necessary step in performance testing. The paper does highlight the challenge of figuring out what baseline performance looks like in microservice architectures. Through trials on the TeaStore application, the paper highlights the difficulty of obtaining trustworthy results in microservice contexts and sheds light on the subtle effects of microservices on performance testing.
Zhang et al. [30] address the challenge of fault detection in cloud services to enhance the reliability of cloud data centers. To find host faults in the cloud data center, they developed a fault detection approach that makes use of a Weighted One-Class Support Vector Machine (WOCSVM). The authors proposed conducting important metrics for lowering complexity by performing a correlation analysis among monitoring metrics. Additionally, they proposed a weight allocation strategy to assign weights to samples, aiming to enhance fault detection accuracy. Moreover, the authors optimized parameters using a parameter optimization algorithm based on Quantum-behaved Particle Swarm Optimization (QPSO) to improve accuracy further. Alexandros et al. [31] address the challenge of selecting the most suitable cloud and edge infrastructure solution for specific applications. This task is complex as it involves considering both operational costs and the Quality of Service (QoS) required for various application types within these environments. The authors proposed a method for generating and refining multidimensional vectors that depict the hardware usage characteristics of an application. They integrated a machine-learning classification algorithm to develop a system capable of producing hardware-agnostic profiles for a wide range of containerized applications. Hidayat et al. [32] address the challenge of monitoring virtual machines (VMs) within data centers (DCs). They highlight issues such as virtual network management, memory usage, and CPU utilization affecting VMs. To assist VM users in making informed decisions about their VMs’ performance status, the authors propose various approaches, including fuzzy Mamdani, holdout validation, and Naive Bayes methods.
In contrast to prior research works focusing on cloud services or virtual machine monitoring and performance diagnosis, our research specifically targets microservice performance diagnosis and prediction. Unlike previous works utilizing simulated datasets, we have collected our data using a dedicated monitoring tool for this study. Additionally, while prior research has not developed a model capable of predicting microservice output under instability and missing data values, our proposed MPDP architecture considers various variables, including response time, throughput, CPU, and memory metrics. It effectively models dynamic interactions among these microservice performance indicators for diagnosis and prediction. Furthermore, the MPDP architecture introduces a hierarchical and integrated framework centered on BNs to model dynamic connections among different microservice performance diagnostic and prediction variables. It illustrates how stakeholders can construct different models for the performance analysis of probabilistic microservice performance diagnosis and prediction. Table 1 provides a concise summary of each research work focus, techniques used, as well as advantages and disadvantages, aiding in understanding the breadth of research on monitoring and performance diagnosis in microservices and cloud services.

Various technologies, such as virtual machines and Docker containers, have been employed to expand the array of components requiring management for application development. This includes utilizing containers for executing software, web servers, or processing big data. While traditionally, only hardware and software components like servers, databases, or proxies needed monitoring, there is a growing need for monitoring even at lower levels such as cloud systems, microservices, and APIs, as well as internally used methods or functions [1]. This paper aims to present an automated management architecture for the diverse layers utilized in applications decomposed within a microservice architecture and container clusters (refer to Fig. 1).

Figure 1: MPDP architecture
Container-based applications can be deployed not only on a single host but across multiple container clusters [11]. Each container cluster consists of several nodes (hosts), and each node contains multiple containers. Monitoring data from various layers of code, such as the node layer, database layer, and server layer, can be collected for applications running in container-based environments. Applications are allocated a specific set of resources by a group. Alongside Docker Engine on Linux, another technology known as control groups (cgroups) is utilized [33]. Control groups enable Docker Engine to allocate available container hardware resources and optionally enforce limitations. For example, the memory available to a particular container can be restricted. Managing this complexity involves specialized monitoring tools capable of processing extremely detailed output data.
The MPDP model architecture depicted in Fig. 1 aims to address this challenge by implementing a multi-layer monitoring system for applications decomposed and deployed within containers. This involves obtaining information on software and hardware metrics by keeping an eye on server and database operations, as well as internal metrics like method latency or API call processing rates. Moreover, it employs a Publish/Subscribe communication model to facilitate high availability and potential scalability. The MPDP model architecture consists of three modules including Monitoring, Fault Injection, and Bayesian Networks. External agent encoding was based on a method that was previously disclosed in [34], which switched from REST to Publish/Subscribe as the mode of communication.
As illustrated in Fig. 1, a monitoring agent is deployed on each container to collect and store performance metrics. Building upon a previously published solution [34], we enhanced it to comprise three main components (see Fig. 2): external monitoring agents, internal code agents, and managerial consumers for data storage.

Figure 2: Monitoring process
The external agents, called Outside Agents (OAg), are designed to gather systems and process data utilized by the microservices. For example, a microservice that uses MySQL as the database and Tomcat as the web server would need at least three external agents: one for MySQL (MySQL-CPU, MySQLMemory), one for Tomcat (Tomcat-CPU, Tomcat-Memory, etc.), and one for the system (Disk, Network, System-CPU, etc.). External agents utilize the Publish/Subscribe communication protocol, leveraging Advanced Message Queuing Protocol (AMQP) producers compatible with RabbitMQ to publish monitored data on pre-defined message topics. RabbitMQ acts as the AMQP server, serving as a message broker between producer agents and managerial consumers. For example, the AMQP client connects to the RabbitMQ server and begins delivering data to the relevant queue, “Process,” when an agent keeps monitoring a process’s CPU utilization. This data is then collected by consumer managers or query consumers.
Similarly, internal agents, or Inside Agents (IAg), utilize AMQP clients to communicate with pre-registered topics in RabbitMQ. These agents collect two microservice code metrics: Response Time and Throughput, by annotating methods with @Response Time and including variables to calculate the response time of microservice methods. RabbitMQ is also used by managerial consumers to subscribe to topics and get agent messages. The time-series data from continuous microservice monitoring is stored for a lengthy period in a MySQL database, which houses these metrics.
Each service container is equipped with an injection agent. Through an SSH connection, this agent manages CPU and memory faults simulated by certain software deployments. One agent utilizes an iterative algorithm to increase CPU utilization for abnormal CPU consumption, while another agent allocates fixed-sized arrays until the memory consumption reaches the limit set by the user, thereby increasing memory consumption. As depicted in Algorithm 1, we propose utilizing a fault injection system to induce anomalies in both CPU and memory utilization. The user defines parameters such as the type of fault denoted as Φ (CPU or Memory), the container where the error will be injected denoted as α, the duration of the fault denoted as Δ, and the pause time of the error denoted as ΔP. The workload λ is a crucial component of the algorithm and is defined beforehand. To build a Pascal triangle, an iterative process is carried out continuously until the CPU fault injection time is reached. The algorithm allocates 1 MB byte arrays for memory error injection until the memory utilization rate hits 90%. It then keeps this memory occupation rate going until Δ is reached. Based on the defect type, the algorithm first creates a workload. The fault type is then assigned by calling the injection method. The created workload is then injected into the designated container. Ultimately, the injection is stopped within the given time window ΔP.

This study presents complicated interdependencies across microservice performance parameters, including response time, throughput, CPU utilization, and memory metrics. By accurately simulating these dynamic interactions, BNs enable us to represent the stochastic aspect of microservice performance. This ability sets the proposed approach apart from traditional deterministic models and is essential for precise diagnosis and prediction. Bayesian inference is made easier by BNs, enabling us to revise the probability estimates of various performance metrics as new evidence becomes available. They represent conditional dependencies through edges in a directed graph, making them suitable for modeling such dependencies. Through this representation, BNs allow for easy inference of random variables in the graph using factors. These networks have several advantages: they utilize factors to eliminate the need for explicit rules, they can accommodate both numerical and categorical variables, they can handle uncertainty in inventory environments like microservices and networks, and they can be extended over time to Bayesian functional networks to clarify various theories. Additionally, BNs enable decision-making under uncertainty through utility theory. We demonstrate how BNs are utilized in modeling multiple variables for effective microservice diagnosis and prediction. A BN can be defined as follows:
Definition 1. The Bayesian Network (BN) is a Directed Acyclic Graph (DAG) comprising random variables represented as network nodes. The directed links between nodes represent causal relationships, where β is the parent of γ in the direction of an β−γ link. The Joint Probability Distribution (JPD) in a Bayesian network can be determined for every entry using:
The parents are denoted as
BNs offer a comprehensive delineation of the problem domain and provide a detailed elucidation of the causal connections between various nodes within the BN [33]. Fig. 3 depicts an example of BNs used for diagnosing and predicting microservices. In these BNs, the oval nodes represent random variables, which are collectively modeled to probabilistically ascertain their mutual influence. A parent-child relationship in a BN is represented by the course of an arc connecting a node (or nodes) to another node (or nodes), where the parent node is probabilistically influenced by the child node. To evaluate the effect of CPU and throughput on reaction time, for example, the arcs from the CPU and throughput nodes to the response time node in Fig. 3C show that these nodes are parent nodes of the “response time” node.

Figure 3: Bayesian networks for microservices diagnosis and prediction: (A) Noisy-OR Network (NOR), (B) Naive Bayes Network (NBN), and (C) Complex Bayesian Network (CBN)
A BN can be built in several ways (see Fig. 3A–C), including the Noisy-OR Network, the Naive Bayes Network, and a more complex model (shown in Fig. 3C) where the majority of nodes are connected based on causality theory. It can be difficult to manually build BNs because stakeholders or subject matter experts may find it difficult to determine causal linkages. For instance, consider nodes A and B to test the theoretical connection between two factors or random variables. If a domain expert determines that the state of node A (denoted as t ∈ T where T is a set of states) determines the state of node B, according to the relation, if node B’s states remain unchanged (the degree of certainty and probability in a state t ∈ T where T is a collection of states for node B), then node A is not a cause of node B; otherwise, it is.
The Random Variable (RV) factor in each BN node is the random variable. This RV can be divided into several different states. The T is then awarded probabilities, which are shown through the CPT. For continuous RVs, a Conditional Probability Distribution (CPD) like the Gaussian distribution is defined. The CPT can be learned from datasets or provided by domain experts, although setting CPTs accurately can be challenging even with reliable statistical methods [36]. In such cases, high-entropy techniques may be employed. To automatically construct a BN structure, stakeholders can also take into consideration BN structural learning methods, such as the Monte Carlo Chain and structural expectation maximization [35]. Determining the ideal structure for the BNs is a combinatorial problem (i.e., NP-hard) and has a computational complexity of
Microservice behavior is probabilistic, influenced by a set of variables denoted by B. Each variable b ∈ B can have z ∈ Z different states. BNs offer a method to represent these relationships, employing various techniques like regression analysis, decision trees, and neural networks to define the nodes g ∈ G in the network. Through the inclusion of evidence in a BN, we aim to attribute a level of confidence to a particular state t ∈ T (i.e., assigning probabilities) associated with a Random Variable (RV). Inference in BNs, which involves computing the posterior probability of specific variables based on observable data, is also computationally intensive having a worst-case time complexity of
Once a BN is constructed, whether through computational learning algorithms or expert input, it undergoes validation to ensure its accuracy and reliability [36]. Cross-validation is a standard procedure used for this purpose, where a portion of the available data is used to train the BN, and the remainder is reserved for testing its predictive performance. The widely employed expectation-maximization algorithm is commonly utilized for testing the parameters of the BN model [36]. Once the BN demonstrates satisfactory prediction accuracy, stakeholders or domain experts can confidently apply it in real-world scenarios.
For the implementation of the MPDP architecture, we used Java (version 8), which consists of three modules including Monitoring, Fault Injection, and Bayesian Networks.
For the Monitoring module, we have developed various monitoring techniques, including external agents for collecting metrics, internal agents for collecting metrics, and managerial consumers for data storage. The external agents, known as Outside Agents (OAg), were constructed using the SIGAR (https://github.com/hyperic/sigar, accessed on 19 February 2024) libraries. Communication was facilitated through the Publish/Subscribe protocol, utilizing AMQP producers compatible with RabbitMQ via the (com.rabbitmq.amqp-client, accessed on 19 February 2024) library (version 5.6.0). In contrast, the internal agents (IAg) employed the org.javassist.javassist, (accessed on 19 February 2024) library (version 3.26-GA) to manipulate the application’s Bytecode. The managerial consumers also utilized the (com.rabbitmq.amqp-client, accessed on 19 February 2024) library (version 5.6.0) for communication. The metrics collected by these consumers persisted in a MySQL database, serving as a long-term storage solution for the time-series data obtained from the continuous monitoring of microservices.
In the Fault Injection module, we developed two distinct components using Java (version 8): one for injecting CPU faults and another for injecting memory faults into the data collection system individually. This allowed us to observe the system’s behavior under different conditions when subjected to these faults. By simulating real anomalies such as high CPU and memory consumption after injecting the faults, we aimed to evaluate the system’s response.
In the Bayesian Networks module, we developed the module using Java (version 8) to facilitate probabilistic diagnosis. This involved inserting evidence in the form of probability assignments into the BN to determine the likelihood of a random variable (or factor) assuming a specific value. We incorporated various types of BNs, including a simple Noisy-OR network, Naive Bayes Network, and a more complex Bayesian Network, as depicted in Fig. 3.
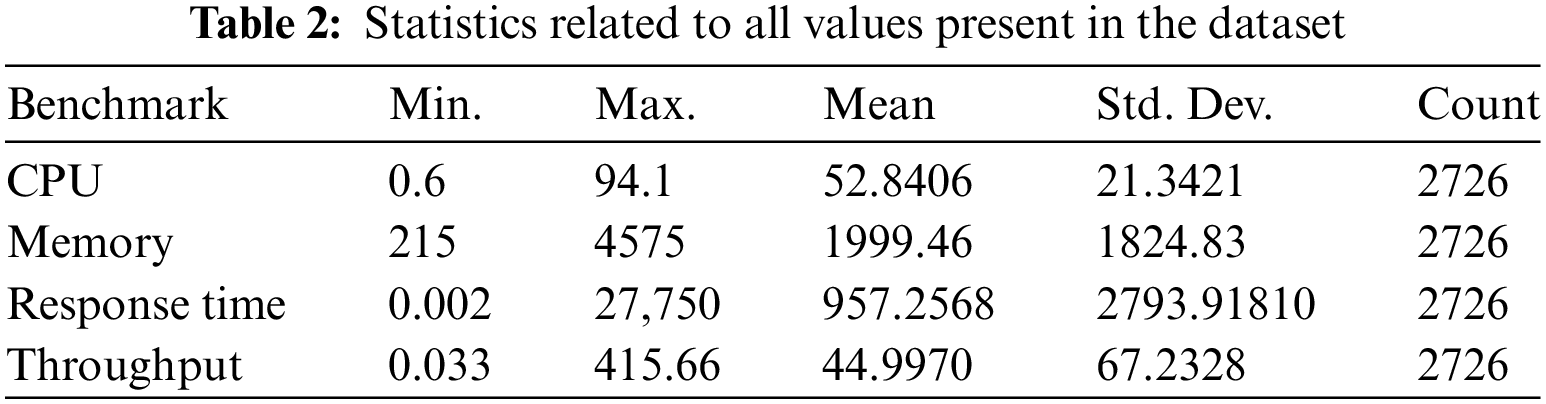
To showcase the effectiveness of the proposed MPDP architecture, we gathered our dataset of microservices. This dataset, sourced from our monitoring tool deployed on Amazon EC2 (AWS), comprises 2726 records across four benchmarks: CPU, memory, response time, and throughput. The CPU benchmark measures the total time required (in seconds). For the memory benchmark, we allocated 256 MB arrays to calculate read-write memory velocity in MB/s. Response time data was obtained at the start and end of each method to calculate the system’s response time in nanoseconds. Lastly, the throughput benchmark measures the number of requests serviced per second. Further details about the dataset are outlined in Table 2.
For the Microservices implementation, we developed a Bookshop application in Java (version 9), utilizing the Restlet (https://restlet.talend.com/ (org.restlet.jse), accessed on 20 February 2024) library to construct its APIs. Docker containers (version 18.09) were employed for the implementation, facilitated by the Docker Compose tool (version 1.24.1). The entire Book Shop Application, along with the architecture infrastructure for our experiment, was deployed on Amazon EC2 cloud services, running Ubuntu version 18.04. Each microservice was packaged into JAR files, which were then used to create Docker Images based on OpenJDK 9 (https://hub.docker.com/_/openjdk, accessed on 20 February 2024). To ensure consistent performance results and mitigate hardware differences, all containers had restricted resources specified using cgroup (docker.com/compose/compose-file/, accessed on 20 February 2024) directives: (deploy: resources: limits: CPU: ‘0.50’, memory: 256 MB).
5 Experiment and Results Analysis
An evaluative experiment was conducted to assess the effectiveness of the MPDP architecture in monitoring and generating alerts based on implemented metrics. The experiment involved analyzing data collected over a 48-h period, which served as input for the Data Processing and Fault Injection modules. The target application for this evaluation comprised three microservices: User Interface (UI), Book Service (BS), and Purchase Service (PS). These microservices are part of an application designed to manage purchases and inventory for an electronic bookstore.
The UI microservice handles the processing of Javascript and HTML content to construct web pages for the electronic bookstore. For simplicity in application development, the UI service does not include a database for storing user or shopping cart attributes; instead, these attributes are simulated in memory for the experiment’s purposes.
On the other hand, the BS microservice manages information related to books and their respective stocks. It includes a MySQL database dedicated to storing data related to the Books domain. Similarly, the PS microservice stores purchase data and utilize its own MySQL database, containing a single table named Purchases.
We used Apache JMeter (https://jmeter.apache.org/, accessed on 20 February 2024) to generate HTTP requests to test the capability of MPDP’s architecture. During the experimental evaluation, the operations and requests conducted are as follows:
• The first request involves the UI receiving a book listing request, which redirects to the BS. The BS processes the request and returns a list of books in JSON format, which is converted to HTML format by the UI before being sent back to JMeter.
• The second request entails JMeter sending a detailed information request for 10 random books to the BS. The BS processes this request using its MySQL database and returns a JSON list containing the requested data.
• The third request involves JMeter sending a request to the PS to include a book purchase. The PS consults the BS to check for available stock before saving the purchase in its MySQL database.
These simulated requests are sent continuously, starting with 10 users initially and gradually increasing up to 150 simultaneous users over a 48-h interval.
The Bookshop application, deployed according to the parameters outlined in Section 3.2, underwent a workload simulation as depicted in Fig. 4. JMeter initiated the requests (step 1 in Fig. 4), simulating access by up to 150 concurrent users for 48 h. Throughout this duration, the MPDP architecture captured (step 2 in Fig. 4), Sending the collected data through the RabbitMQ (step 3 in Fig. 4), and stored the data in MySQL database (step 4 in Fig. 4). The median results obtained are presented in Table 3. The following subsection will explain the results of our experiments.

Figure 4: Workload

The average CPU utilization across microservices was 45.2%, 48.35%, and 46.02% for UI, BS, and PS, respectively. The aggregated CPU usage results are depicted in the graph shown in Fig. 5. The higher consumption observed in the BS microservice can be attributed to the larger volume of requests processed by this service, as it handled all three types of requests sent. However, the CPU usage results across the microservices were consistent, which can be attributed to the limitations imposed by the Cgroup parameters. Furthermore, the internal operations carried out by the requests (i.e., first, second, and third) exhibited similar computational requirements, primarily involving processing HTTP requests (first to third) and converting SQL result data into JSON format (first to second) or inserting data in SQL format (third).

Figure 5: Microservices CPU usage from OAg
In terms of average memory usage, the UI microservice utilized only 272.12 MB (median value), whereas the BS and PS microservices used 2.7 and 3.0 GB, respectively, as depicted in Fig. 6. The observed variations in memory consumption can be attributed to the specific operations performed by each microservice. The UI primarily functions as a proxy, handling UI-API requests by redirecting them to the BS service. Consequently, it does not incur significant memory usage for processing objects resulting from MySQL queries or translating data formats. In contrast, the BS service is responsible for querying MySQL databases and translating data to JSON format, resulting in higher memory utilization. Similarly, the PS microservice handles request redirection and MySQL manipulation, utilizing additional memory due to transactions performed by the Purchase-DB. The Purchase-API receives requests, forwards them to Purchase-DB, and interacts with Books-API while inserting purchase records into the MySQL database if the requested book stock is available.

Figure 6: Microservices memory consumption from OAg
The network traffic, measured in bytes transferred, is illustrated in Fig. 7. For the UI microservice, the download and upload rates were 602.32 and 645.79 GB, respectively. Similarly, the BS microservice recorded 828.80 GB of download and 852.83 GB of upload. As anticipated, the upload rate exceeded the download rate for both the UI and BS services, as they primarily deliver HTTP responses in JSON format, containing extensive lists of books. Conversely, the PS microservice exhibited 567.95 GB of download and 543.35 GB of upload, indicating higher download traffic compared to upload. This can be attributed to the Purchase-API returning an HTTP response with JSON data containing details of the recently completed purchase transactions.

Figure 7: Microservices network rate from OAg
5.4 Response Time and Throughput Results
The response time and throughput values are organized based on the invoked methods, as monitored by the internal code agents (IAg), as shown in Table 3. The median response times (depicted in Fig. 8) for UI-API, Purchase-API, Book-API, Book-DB, and Purchase-DB were 41.21, 31.28, 21.47, 20.15, and 31.22 ms, respectively. The UI-API exhibits the highest response time due to the inclusion of both Book-API and Book-DB in its processing. Meanwhile, Purchase-API and Purchase-DB, besides incorporating Books-API and Books-DB, also execute the purchase insertion operation in the MySQL database. In contrast, the Throughput results (refer to Table 3 and Fig. 9) display an inverse pattern to response time, as shorter response times enable the processing of more requests within a given period. Consequently, the measured Throughput values were 17.57 requests/second (Purchase-API), 18.04 requests/second (Purchase-DB), 18.57 requests/second (UI-API), 28.47 requests/second (Books-DB), and 28.48 requests/second (Books-API).

Figure 8: Microservices response time from IAg

Figure 9: Microservices throughput from IAg
5.5 Performance Diagnosis Analysis
The response time and throughput values are organized based on the invoked methods, as monitored by the internal code agents (IAg), as shown in Table 3. The median response times (depicted in Fig. 8) for UI-API, Purchase-API, Book-API, Book-DB, and Purchase-DB were 41.21, 31.28, 21.47, 20.15, and 31.22 ms, respectively. The UI-API exhibits the highest response time due to the inclusion of both Book-API and Book-DB in its processing. Meanwhile, Purchase-API and Purchase-DB, besides incorporating Books-API and Books-DB, also execute the purchase insertion operation in the MySQL database. In contrast, the Throughput results (refer to Table 3 and Fig. 9) display an inverse pattern to response time, as shorter response times enable the processing of more requests within a given period. Consequently, the measured Throughput values were 17.57 requests/second (Purchase-API), 18.04 requests/second (Purchase-DB), 18.57 requests/second (UI-API), 28.47 requests/second (Books-DB), and 28.48 requests/second (Books-API).
We evaluated the proposed MPDP architecture under the following four scenarios as explained below:
Scenario 1 (S1): In the best-case scenario, where the response time is less than 5 ms and the throughput exceeds 50 requests/second, the evidence was inserted into the Bayesian network for the book microservice. The analysis revealed that achieving these optimal values necessitates having a memory capacity exceeding 400 MB, with a probability of 53%, as depicted in Fig. 10A. Interestingly, even with CPU values exceeding 65%, which accounts for 59%, there was no significant impact on response time and throughput.


Figure 10: Screenshot of microservices implemented in GeNIe platform on scenario 1: (A) Book microservice, (B) Purchases microservice, (C) UI microservice
To achieve optimal performance for the purchases microservice, it is necessary to have a memory allocation of over 400 MB, yielding a success rate of 77%. Interestingly, despite CPU values exceeding 65%, which achieved a success rate of 59%, there was no significant impact on response time and throughput, as depicted in Fig. 10B.
Similarly, for the UI microservice, optimal performance is achieved with a memory allocation below 400 MB, resulting in a success rate of 100%. Surprisingly, despite CPU values exceeding 65%, which achieved a success rate of 57%, there was no significant effect on response time and throughput, as illustrated in Fig. 10C.
Scenario 2 (S2): The worst-case scenario where response time exceeds 20 ms and throughput drops below 5 requests/second. For the book microservice, to achieve optimal performance under these conditions, a memory allocation greater than 4000 MB is required, resulting in a success rate of 100%, as depicted in Fig. 11A. Interestingly, CPU values below 35%, which yielded a success rate of 53%, had a significant impact on response time and throughput.

Figure 11: Screenshot of microservices implemented in GeNIe platform on scenario 2: (A) Book microservice, (B) Purchases microservice, (C) UI microservice
Similarly, for the purchases microservice, optimal performance is attained with a memory allocation greater than 400 MB, yielding a success rate of 99%. Surprisingly, CPU values below 35%, which achieved a success rate of 49%, had a significant effect on response time and throughput, as shown in Fig. 11B.
For the UI microservice, to achieve optimal performance under these conditions, a memory allocation below 400 MB is required, resulting in a success rate of 100%. Interestingly, CPU values below 35%, which yielded a success rate of 48%, had a significant impact on response time and throughput, as illustrated in Fig. 11C.
Scenario 3 (S3): Choosing mid-range memory values for each microservice, in this scenario, we select memory allocations ranging from 400 to 4000 MB and focus on each microservice individually for validation.
For the book microservice, selecting memory within this range yields an 84% probability of achieving a response time below 5 ms and a throughput of 50 requests/second or higher, as depicted in Fig. 12A.

Figure 12: Screenshot of microservices implemented in GeNIe platform on scenario 3: (A) Book microservice, (B) Purchases microservice, (C) UI microservice
For the purchases microservice, this selection results in a 48% chance of achieving a response time between 5 and 20 ms and a 56% chance of achieving a throughput of 5 requests/second or lower, as shown in Fig. 12B.
For the UI microservice, there is a 48% probability of achieving a response time below ms, and the throughput varies with a 33% probability across all statements, as illustrated in Fig. 12C.
Scenario 4 (S4): Opting for mid-range CPU values for each microservice, in this scenario, we select CPU utilization ranging from 35% to 65% and examine each microservice individually for validation.
For the book microservice, selecting CPU utilization within this range results in a 40% probability of achieving a throughput between 5 and 50 requests/second, and a 55% probability of achieving a response time below 5 ms, as depicted in Fig. 13A.

Figure 13: Screenshot of microservices implemented in GeNIe platform on scenario 4: (A) Book microservice, (B) Purchases microservice, (C) UI microservice
For the purchases microservice, there is a 48% probability of achieving a throughput of 5 requests/second or lower, and a 48% probability of achieving a response time between 5 and 20 ms, as shown in Fig. 13B.
For the UI microservice, the majority probability lies in achieving a throughput of 5 requests/second or lower, with 48%, and a response time below 5 ms, with 39%, as illustrated in Fig. 13C.
5.5.1 CPU Performance Diagnosis
We utilized a hierarchical discretization method with manual fine-tuning to categorize the Quality of Service (QoS) values. Our hierarchical discretization method’s manual fine-tuning is intended to improve the QoS categorization’s accuracy and relevance. We can manually modify the discretization criteria to better fit each microservice’s unique operational environment and performance requirements. With this customization, the model is fine-tuned to capture the subtleties of the real performance data, resulting in predictions that are more relevant and accurate. In our study, the hierarchical discretization method’s manual fine-tuning offers significant advantages in terms of accuracy, adaptability, and customization. The incorporation of domain knowledge experts and the adaptability to various workloads serve as further justifications for our method’s manual fine-tuning. Ultimately, we established three states for this dataset, as depicted in Table 4.

Initially focusing on the book microservice, we observed its performance to be reasonably predictable, with a 38% likelihood that the values would fall within the range of 35% to 65% (state 2, see Table 4).
Subsequently, when analyzing the purchases microservice, we noted a similarity to the book microservice, with approximately a 39% probability of the values falling within the 35% to 65% range (state 2).
Lastly, in evaluating the performance of the UI microservice, we found a similar likelihood (38% probability) of the values falling within the 35% to 65% range (state 2), akin to the book microservice. The size of the figure is measured in centimeters and inches.
5.5.2 Memory Performance Diagnosis
Once again, we applied a hierarchical discretization method with manual adjustments to categorize the QoS values. Overall, we established three states for this dataset, as outlined in Table 5. The objective of the memory diagnosis was to assess the impact of various factors on memory-intensive applications.

Initially, we examined the book microservice and observed its performance to be reasonably predictable, with a 76% likelihood of the values falling within the range of greater than 4000 MB (state 3, see Table 5).
Next, we turned our attention to the purchases microservice and found that the majority of its performance instances fell within the range between 400 and 4000 MB (state 2) with a probability of 79%.
Lastly, in analyzing the performance of the UI microservice, we observed that all instances of the UI microservice (100% probability) fell within the range of 0 and 400 MB (state 1).
5.5.3 Response Time Performance Diagnosis
Once more, we utilized a hierarchical discretization method with manual fine-tuning to categorize the QoS values. Overall, we established three states for this dataset, as illustrated in Table 6.

Initially, we focused on the book microservice, where we observed its performance to be reasonably predictable. There was a 58% likelihood that the values would fall within the range of 0 and 5 ms (state 1, see Table 6).
Subsequently, we examined the purchases microservice and noted that the majority of instances fell within the range between 5 and 20 ms (state 2) with a probability of 49%.
Lastly, in analyzing the performance of the UI microservice, we found that the majority of UI microservice instances (42% probability) fell within the range of 0 and 5 ms (state 1).
5.5.4 Throughput Performance Diagnosis
To discretize the QoS values, we once more used the hierarchical discretization method with manual fine-tuning. For this dataset, we ultimately determined three states, as Table 7 illustrates.

We initiated the analysis by focusing on the book microservice, revealing that its performance was reasonably predictable, with a 39% probability of values falling in the range of greater than 50 requests/second (state 3, see Table 7).
Subsequently, we examined the purchases microservice and observed that the majority of its performance values fell within the range of 0 to 5 requests/second (state 1), with a probability of 44%.
Lastly, our investigation of the UI microservice indicated that most of its performance values, approximately 43%, were within the range of 0 to 5 requests/second (state 1).
5.5.5 Microservice QoS Prediction
To assess the microservice QoS prediction accuracy of BNs, we employed 10-fold cross-validation, a commonly employed technique for evaluating the accuracy and reliability of a prediction model. The Expectation-Maximization (EM) algorithm was utilized for training the model [26]. The prediction accuracies of all BNs are detailed in Table 8. Our analysis indicates that BNs can effectively forecast Microservice QoS metrics, achieving an overall prediction accuracy of 89.98% when using Complex Bayesian Network (CBN).

We contend that these findings hold valuable insights for stakeholders, enabling them not only to make informed decisions regarding microservice selection but also to anticipate the QoS that their application may experience by considering the combination of the aforementioned factors.
This paper proposes, develops, and validates a probabilistic architecture called Microservice Performance Diagnosis and Prediction (MPDP). MPDP incorporates multiple variables like response time, throughput, CPU usage, and other metrics to dynamically analyze the relationships between microservice performance indicators for both diagnosis and prediction purposes. Through validation, we confirm MPDP’s ability to predict microservice performance and we compared various Bayesian networks such as the Noisy-OR Network (NOR), Naive Bayes Network (NBN), and Complex Bayesian Network (CBN) scoring an overall accuracy of 89.98% when using CBN. We argue that these results offer significant insights to stakeholders, empowering them to make informed decisions not only about microservice selection but also to foresee the QoS that their application might encounter by considering the amalgamation of the mentioned factors. In future work, we aim to expand the quantity and variety of microservices and to perform experimentation on different cloud environments to explore the MPDP generalization and enhance the MPDP accuracy using domain experts. Furthermore, to improve our model and capture finer performance nuances, we intend to investigate a more granular approach to each QoS metric using several states.
Acknowledgement: I express my gratitude to the anonymous reviewers for their comments and suggestions which have greatly helped me to improve the content, quality, organization, and presentation of this work.
Funding Statement: There is no funding support for this work.
Availability of Data and Materials: The data that support the findings of this study are available from the corresponding author, Talal H. Noor, upon reasonable request.
Conflicts of Interest: The author declares that they have no conflicts of interest to report regarding the present study.
References
1. V. Medel, R. Tolosana-Calasanz, J. Á. Bañares, U. Arronategui, and O. F. Rana, “Characterising resource management performance in kubernetes,” Comput. Electr. Eng., vol. 68, pp. 286–297, 2018. doi: 10.1016/j.compeleceng.2018.03.041. [Google Scholar] [CrossRef]
2. R. Tolosana-Calasanz, J. Diaz-Montes, L. F. Bittencourt, O. Rana, and M. Parashar, “Capacity management for streaming applications over cloud infrastructures with micro billing models,” in Proc. 9th Int. Conf. on Utility Cloud Comput., Shanghai, China, 2016, pp. 251–256. [Google Scholar]
3. A. Wittig and M. Wittig, Amazon Web Services in Action: An in-Depth Guide to AWS. New York, USA: Simon and Schuster, 2023. [Google Scholar]
4. F. Almeida, J. Simões, and S. Lopes, “Exploring the benefits of combining devops and agile,” Future Internet, vol. 14, no. 2, pp. 1– 63, 2022. doi: 10.3390/fi14020063. [Google Scholar] [CrossRef]
5. J. Lewis and M. Fowler, “Microservices a definition of this new architectural term,” 2014. Accessed: Jan. 20, 2024. [Online]. Available: http://martinfowler.com/articles/microservices.html [Google Scholar]
6. R. Kasauli, E. Knauss, J. Horkoff, G. Liebel, and F. G. de Oliveira Neto, “Requirements engineering challenges and practices in large-scale agile system development,” J. Syst. Softw., vol. 172, pp. 1–26, 2021. doi: 10.1016/j.jss.2020.110851. [Google Scholar] [CrossRef]
7. T. Ueda, T. Nakaike, and M. Ohara, “Workload characterization for microservices,” in Proc. 2016 IEEE Int. Symp. Workload Characterization (IISWC), Providence, RI, USA, 2016, pp. 1–10. [Google Scholar]
8. Z. Kozhirbayev and R. O. Sinnott, “A performance comparison of container-based technologies for the cloud,” Future Gener. Comput. Syst., vol. 68, pp. 175–182, 2017. doi: 10.1016/j.future.2016.08.025. [Google Scholar] [CrossRef]
9. H. Khazaei, C. Barna, N. Beigi-Mohammadi, and M. Litoiu, “Efficiency analysis of provisioning microservices,” in Proc. of IEEE Int. Conf. on Cloud Comput. Technol. Sci. (CloudCom), Luxembourg, 2016, pp. 261–268. [Google Scholar]
10. J. F. Pérez, L. Y. Chen, M. Villari, and R. Ranjan, “Holistic workload scaling: A new approach to compute acceleration in the cloud,” IEEE Cloud Comput., vol. 5, no. 1, pp. 20–30, 2018. doi: 10.1109/MCC.2018.011791711. [Google Scholar] [CrossRef]
11. Q. Du, T. Xie, and Y. He, “Anomaly detection and diagnosis for container-based microservices with performance monitoring,” in Proc. of Int. Conf. on Algorithms and Archit. for Parallel Process., Guangzhou, China, 2018, pp. 560–572. [Google Scholar]
12. N. Fareghzadeh, M. A. Seyyedi, and M. Mohsenzadeh, “Toward holistic performance management in clouds: Taxonomy, challenges and opportunities,” J. Supercomput., vol. 75, pp. 272–313, 2019. doi: 10.1007/s11227-018-2679-9. [Google Scholar] [CrossRef]
13. M. Waseem, P. Liang, M. Shahin, A. Di Salle, and G. Ḿarquez, “Design, monitoring, and testing of microservices systems: The practitioners’ perspective,” J. Syst. Softw., vol. 182, pp. 111061, 2021. doi: 10.1016/j.jss.2021.111061. [Google Scholar] [CrossRef]
14. M. Usman, S. Ferlin, A. Brunstrom, and J. Taheri, “A survey on observability of distributed edge & container-based microservices,” IEEE Access, vol. 10, pp. 86904–86919, 2022. doi: 10.1109/ACCESS.2022.3193102. [Google Scholar] [CrossRef]
15. X. Zhou et al., “Fault analysis and debugging of microservice systems: Industrial survey, benchmark system, and empirical study,” IEEE Trans. Softw. Eng., vol. 47, no. 2, pp. 243–260, 2018. doi: 10.1109/TSE.2018.2887384. [Google Scholar] [CrossRef]
16. J. Soldani and A. Brogi, “Anomaly detection and failure root cause analysis in (micro) service-based cloud applications: A survey,” ACM Comput. Surv., vol. 55, no. 3, pp. 1–39, 2022. [Google Scholar]
17. M. Gribaudo, M. Iacono, and D. Manini, “Performance evaluation of massively distributed microservices-based applications,” in Proc. of the 31st Eur. Conf. on Model. and Simul. (ECMS), Budapest, Hungary, 2017, pp. 598–604. [Google Scholar]
18. L. Wu, J. Bogatinovski, S. Nedelkoski, J. Tordsson, and O. Kao, “Performance diagnosis in cloud microservices using deep learning,” in Proc. of the Int. Conf. on Serv.-Orient. Comput. (ICSOC), Dubai, United Arab Emirates, 2020, pp. 85–96. [Google Scholar]
19. Amazon cloudwatch. 2024. Accessed: Feb. 7, 2024. [Online]. Available: https://aws.amazon.com/ [Google Scholar]
20. Cloudharmony. 2024. Accessed: Feb. 10, 2024. [Online]. Available: http://cloudharmony.com/ [Google Scholar]
21. K. Alhamazani et al., “An overview of the commercial cloud monitoring tools: Research dimensions, design issues, and state-of-the-art,” Computing, vol. 97, no. 4, pp. 357–377, 2015. doi: 10.1007/s00607-014-0398-5. [Google Scholar] [CrossRef]
22. B. Varghese, O. Akgun, I. Miguel, L. Thai, and A. Barker, “Cloud benchmarking for performance,” in Proc. of IEEE 6th Int. Conf. on Cloud Comput. Technol. Sci., Singapore, 2014, pp. 535–540. [Google Scholar]
23. J. S. Ward and A. Barker, “Observing the clouds: A survey and taxonomy of cloud monitoring,” J. Cloud Comput., vol. 3, no. 1, pp. 1–24, 2014. doi: 10.1186/s13677-014-0024-2. [Google Scholar] [CrossRef]
24. J. Scheuner, J. Cito, P. Leitner, and H. Gall, “Cloud workbench: Benchmarking IaaS providers based on infrastructure-as-code,” in Proc. of the 24th Int. Conf. on World Wide Web, Florence, Italy, 2015, pp. 239–242. [Google Scholar]
25. A. Bashar, “Autonomic scaling of cloud computing resources using bn-based prediction models,” in Proc. of IEEE 2nd Int. Conf. on Cloud Netw. (CloudNet), San Francisco, CA, USA, 2013, pp. 200–204. [Google Scholar]
26. L. Philipp and J. Cito, “Patterns in the chaos—A study of performance variation and predictability in public iaas clouds,” ACM Trans. Internet Technol., vol. 16, no. 3, pp. 1–23, 2016. doi: 10.1145/2885497. [Google Scholar] [CrossRef]
27. E. Simon et al., “A case study on the stability of performance tests for serverless applications,” J. Syst. Softw., vol. 189, pp. 1– 38, 2022. [Google Scholar]
28. L. Christoph, J. Scheuner, and P. Leitner, “Software microbenchmarking in the cloud. How bad is it really?” Empir. Softw. Eng., vol. 24, no. 4, pp. 2469–2508, 2019. doi: 10.1007/s10664-019-09681-1. [Google Scholar] [CrossRef]
29. E. Simon, C. Bezemer, W. Shang, D. Okanović, and A. Hoorn, “Microservices: A performance tester’s dream or nightmare?” in Proc. of the ACM/SPEC Int. Conf. on Perform. Eng., Edmonton, AB, Canada, 2020, pp. 138–149. [Google Scholar]
30. X. Zhang and Y. Zhuang, “A fault detection algorithm for cloud computing using qpso-based weighted one-class support vector machine,” in Proc. of the 19th Int. Conf. Algorithms and Archit. for Parallel Process. (ICA3PP), Melbourne, VIC, Australia, 2020, pp. 286–304. [Google Scholar]
31. A. Psychas, P. Dadamis, N. Kapsoulis, A. Litke, and T. Varvarigou, “Containerised application profiling and classification using benchmarks,” Appl. Sci., vol. 12, no. 23, pp. 12374, 2022. doi: 10.3390/app122312374. [Google Scholar] [CrossRef]
32. T. Hidayat and M. Alaydrus, “Performance analysis and mitigation of virtual machine server by using naive bayes classification,” in Proc. of 4th Int. Conf. on Inform. Comput. (ICIC), Semarang, Indonesia, 2019, pp. 1–5. [Google Scholar]
33. X. Gao, Z. Gu, Z. Li, H. Jamjoom, and C. Wang, “Houdini’s escape: Breaking the resource rein of Linux control groups,” in Proc. of the 2019 ACM SIGSAC Conf. on Comput. Commun. Security, London, UK, 2019, pp. 1073–1086. [Google Scholar]
34. A. Noor et al., “A framework for monitoring microservice-oriented cloud applications in heterogeneous virtualization environments,” in Proc. of the IEEE 12th Int. Conf. on Cloud Comput. (CLOUD), Milan, Italy, 2019, pp. 156–163. [Google Scholar]
35. J. Rohmer, “Uncertainties in conditional probability tables of discrete bayesian belief networks: A comprehensive review,” Eng. Appl. Artif. Intell., vol. 88, pp. 103384, 2020. doi: 10.1016/j.engappai.2019.103384. [Google Scholar] [CrossRef]
36. B. G. Marcot and A. M. Hanea, “What is an optimal value of k in k-fold cross-validation in discrete bayesian network analysis?” Comput. Stat., vol. 36, no. 3, pp. 2009–2031, 2021. doi: 10.1007/s00180-020-00999-9. [Google Scholar] [CrossRef]
Cite This Article
 Copyright © 2024 The Author(s). Published by Tech Science Press.
This work is licensed under a Creative Commons Attribution 4.0 International License , which permits unrestricted use, distribution, and reproduction in any medium, provided the original work is properly cited.
 Downloads
 Citation Tools