
 Submit a Paper
 Propose a Special lssue
 Open Access
ARTICLE
Research on Feature Matching Optimization Algorithm for Automotive Panoramic Surround View System
College of Automobile and Traffic Engineering, Nanjing Forestry University, Nanjing, 210037, China
* Corresponding Author: Guangbing Xiao. Email:
Computer Systems Science and Engineering 2024, 48(5), 1329-1348. https://doi.org/10.32604/csse.2024.050817
Received 19 February 2024; Accepted 13 May 2024; Issue published 13 September 2024
 View Full Text
 Download PDF
Abstract
In response to the challenges posed by insufficient real-time performance and suboptimal matching accuracy of traditional feature matching algorithms within automotive panoramic surround view systems, this paper has proposed a high-performance dimension reduction parallel matching algorithm that integrates Principal Component Analysis (PCA) and Dual-Heap Filtering (DHF). The algorithm employs PCA to map the feature points into the lower-dimensional space and employs the square of Euclidean distance for feature matching, which significantly reduces computational complexity. To ensure the accuracy of feature matching, the algorithm utilizes Dual-Heap Filtering to filter and refine matched point pairs. To further enhance matching speed and make optimal use of computational resources, the algorithm introduces a multi-core parallel matching strategy, greatly elevating the efficiency of feature matching. Compared to Scale-Invariant Feature Transform (SIFT) and Speeded Up Robust Features (SURF), the proposed algorithm reduces matching time by 77% to 80% and concurrently enhances matching accuracy by 5% to 15%. Experimental results demonstrate that the proposed algorithm exhibits outstanding real-time matching performance and accuracy, effectively meeting the feature-matching requirements of automotive panoramic surround view systems.Keywords
The automotive panoramic surround view system combines partial road images from multiple vehicle-mounted cameras to generate real-time 360° panoramic views centered on the current vehicle. This significantly enhances the vehicle’s perception of the surrounding road environment and improves driving safety [1–4]. The key to this technology is efficiently matching high-dimensional feature points across different partial road images. Given the need for real-time road environment perception in intelligent driving, accurately matching these feature points has become a primary focus and challenge in the field.
Currently, researchers have embarked on investigations into feature matching for high-dimensional images, broadly falling into four categories:
(i) Brute-Force Matching: These algorithms make similarity comparison between the feature points to be matched and the reference feature points one by one, and takes the reference feature points with the highest similarity as the best match. Alaee et al. [5] utilized a brute-force matching method based on Euclidean distance, followed by a ratio test using a dynamic threshold to determine matched point pairs, effectively enhancing matching robustness. Sun et al. [6] proposed a bidirectional brute-force matching strategy. This strategy computes the distance ratio between the nearest and second nearest neighbors for the pair of feature points to be matched. It adjusts the threshold according to the change of the number of feature point pairs, and solves the problem of one-to-many matching effectively. Although these algorithms can quickly and accurately match the features with a small number of features and low dimension, they are less efficient when matching high-dimensional features.
(ii) Feature Dimensionality Reduction: These algorithms reduce computational complexity and eliminate redundant information by transforming the high-dimensional feature representation of images into a lower-dimensional representation. Zou et al. [7] introduced a circular region descriptor extraction method based on the SURF algorithm, reducing the dimensionality of descriptors. They utilized the minimum Euclidean distance criterion for matching, effectively enhancing matching speed. Wang et al. [8] proposed a feature dimensionality reduction method based on local linear embedding. While reducing dimensionality, they retained the local linear relationships of features, enhancing robustness in deformation and rotation matching. Although these algorithms can optimize the dimension of feature descriptors to a certain extent and improve the matching speed, the dimensionality reduction degree is limited, and they are not suitable for massive high-dimensional feature points between road images.
(iii) Metaheuristic Feature Matching: These algorithms optimize the feature matching process by using meta-heuristic algorithms, such as genetic algorithm, particle swarm optimization algorithm, ant colony algorithm, etc. Tran et al. [9] proposed a variable-length particle swarm optimization algorithm, enabling particles to have different and shorter lengths, thereby defining a smaller feature matching search space and effectively enhancing matching speed. Ghosh et al. [10] introduced a feature selection technique based on ant colony optimization algorithms, combining them with wrapping and filtering methods, and utilizing filtering methods for feature subset evaluation, thereby reducing computational complexity. Such algorithm optimizes the feature matching process by simulating biologically inspired thinking, which is flexible and efficient. However, its performance is limited by the design of heuristic rules, and it may encounter the problem of local optimal solution in the feature matching process.
(iv) Deep Learning Matching Algorithms: These algorithms obtain the matching rules between high-dimensional feature points through large-scale data learning, and realizes efficient and accurate feature point matching. Ma et al. [11] used a Convolutional Neural Network (CNN) based on homography transformation to extract feature points. They employed a neural network with a cross-attention mechanism for high-dimensional feature matching, effectively addressing the issue of poor feature matching under large disparities and distortion transformations. Chaudhari et al. [12] combined a neural network with image grayscale information to form a feature descriptor grid. They used same-name point constraints to match regions, effectively addressing the matching problem caused by abrupt feature content changes across different viewpoints. Such algorithms can automatically learn feature representations and process high-dimensional feature relationships, but feature matching based on artificial intelligence requires large computational resources, is poor in real-time, and is more sensitive to abnormal data, which is prone to overfitting.
It can be seen that the current algorithms for matching high-dimensional features suffer from low matching efficiency and poor real-time performance. There is still considerable room for improvement before these algorithms can be practically applied in automotive panoramic surround view systems. To address these issues and meet the real-time and matching accuracy requirements for local road image stitching in automotive panoramic surround view systems, this paper proposes a high-performance dimensionality reduction parallel algorithm, named SUPD (SURF combining PCA and DHF), based on the SURF algorithm.
Addressing the computational complexity caused by high-dimensional descriptors in traditional SURF algorithm [13–15], the SUPD employs Principal Component Analysis (PCA) to project the feature point set onto a lower-dimensional space. It also utilizes the Square Euclidean Distance (SED), which has lower computational cost, for ranking estimation in feature point matching. Additionally, to eliminate mis-matching, the SUPD employs the Double Heap Filter (DHF) for feature point purification. This involves re-projecting the matched point pairs in the PCA space back into the high-dimensional space for verification, effectively eliminating erroneous matched point pairs. Furthermore, the SUPD improves the feature point matching process by transforming the traditional sequential matching process into a grouped matching process, making full use of multi-core computing resources and enhancing the matching speed of image feature points.
The contributions of this algorithm are as follows:
(1) Dimensionality reduction projection is applied to high-dimensional image feature points, replacing the high-dimensional Euclidean distance with the square Euclidean distance in a lower-dimensional space, thereby reducing computational overhead by reducing the dimensionality of feature points and avoiding square root calculations.
(2) To eliminate erroneous matches, the Double Heap Filter algorithm is proposed to filter and refine the matched point pairs, enhancing the matching accuracy of the SUPD.
(3) To enhance the concurrency performance of the SUPD algorithm, a multi-core parallel matching strategy is proposed. This strategy involves parallel matching of reference feature points in a grouped manner, thereby improving the efficiency of feature point matching.
Consider the matching process of the partial road images
Define
where
Define the matching accuracy
Define the matching efficiency
where Eq. (3) represents the objective function for completing feature matching in the partial road images matching process. A higher value of
In order to meet the requirements of panoramic surround view systems in terms of matching accuracy and real-time performance, this paper proposes a novel panoramic image feature matching algorithm named SUPD. This algorithm integrates the advantages of PCA and DHF algorithms, aiming to perform dimensionality reduction matching and purification filtering on high-dimensional feature points. Simultaneously, by employing a parallel matching strategy to fully utilize computational resources, the algorithm further accelerates the matching efficiency.
3.1 Distance Ranking Based on PCA Dimensionality Reductions
Principal Component Analysis (PCA) is a commonly used dimensionality reduction technique. Its fundamental concept involves projecting high-dimensional data onto a lower-dimensional space, extracting essential features, and reducing redundant information, thereby offering a more concise and efficient data representation for subsequent data analysis and modeling processes [16–18]. Applied to the domain of feature matching, PCA employs a projection matrix P to project the feature point set from the high-dimensional original space to a lower-dimensional space (PCA space) for distance estimation. This estimation predicts the similarity between query and reference feature points.
In this paper, singular value decomposition is used to obtain the projection matrix
where
From Eq. (5), the eigenvalues and corresponding eigenvectors of matrix
where
Once the number of principal components
After obtaining the projection matrix
Upon completing the projection, the distance between each reference feature point
where
The nearest reference feature point
As shown in Fig. 1a, considering a three-dimensional vector where
where
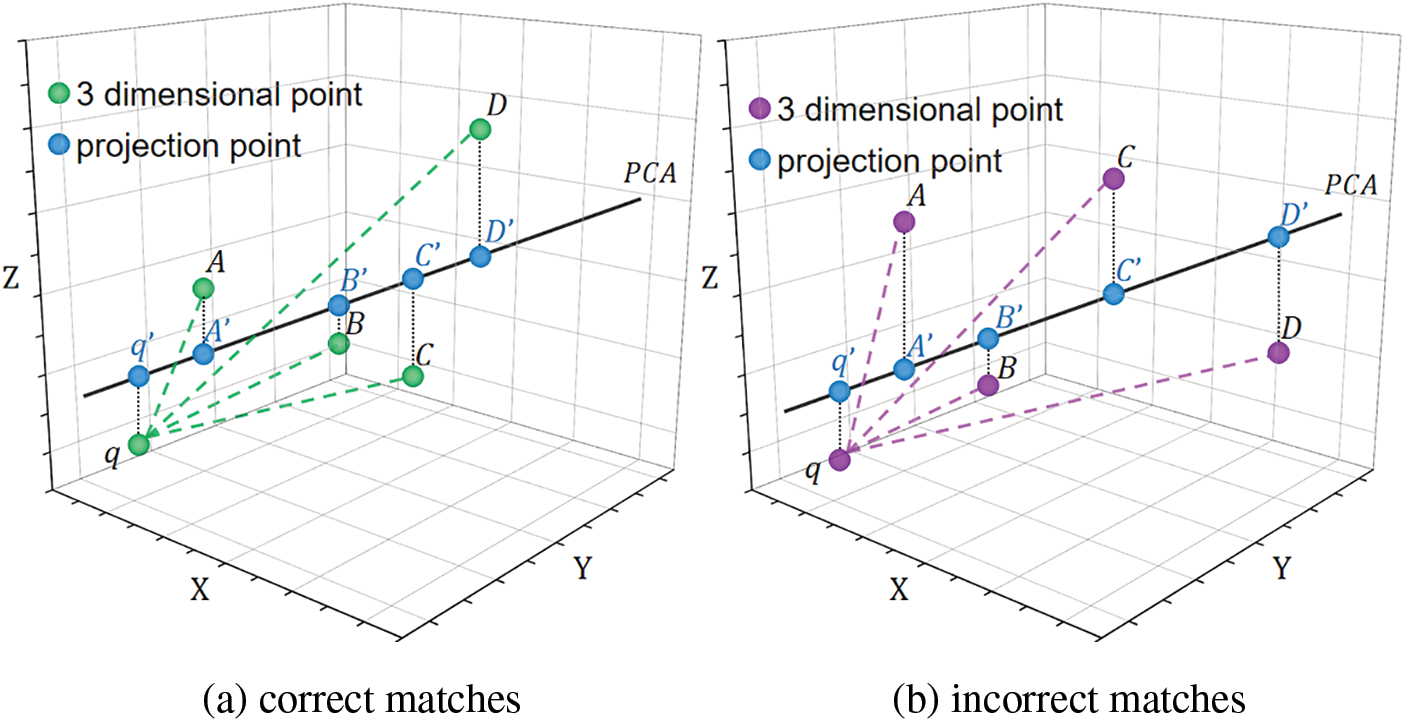
Figure 1: Three-dimensional feature points and their projections in the PCA space. (a) correct matches. (b) incorrect matches
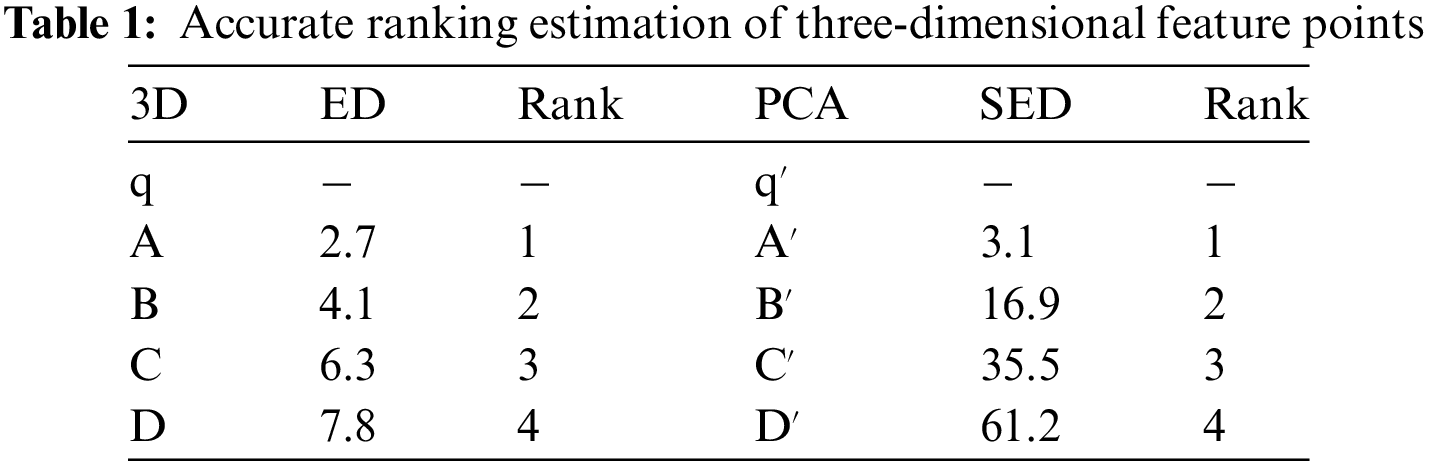
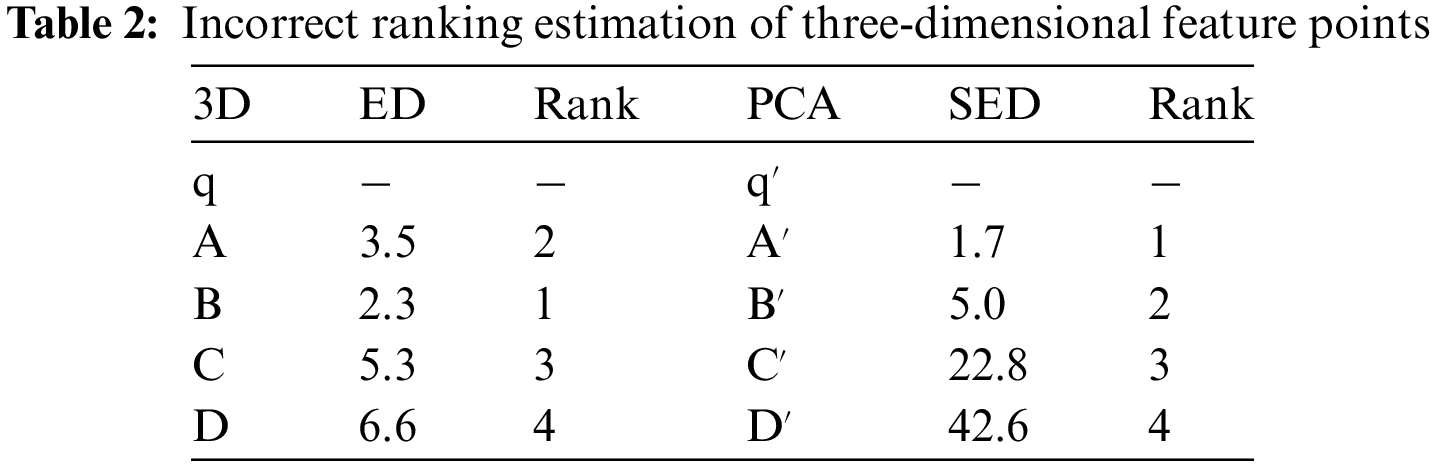
Although using the squared Euclidean distance ranking in the low-dimensional PCA space can predict the similarity between query points and reference feature points, occasional incorrect matches may occur, as depicted in Fig. 1b and Table 2. In the PCA space, the distance ranking is
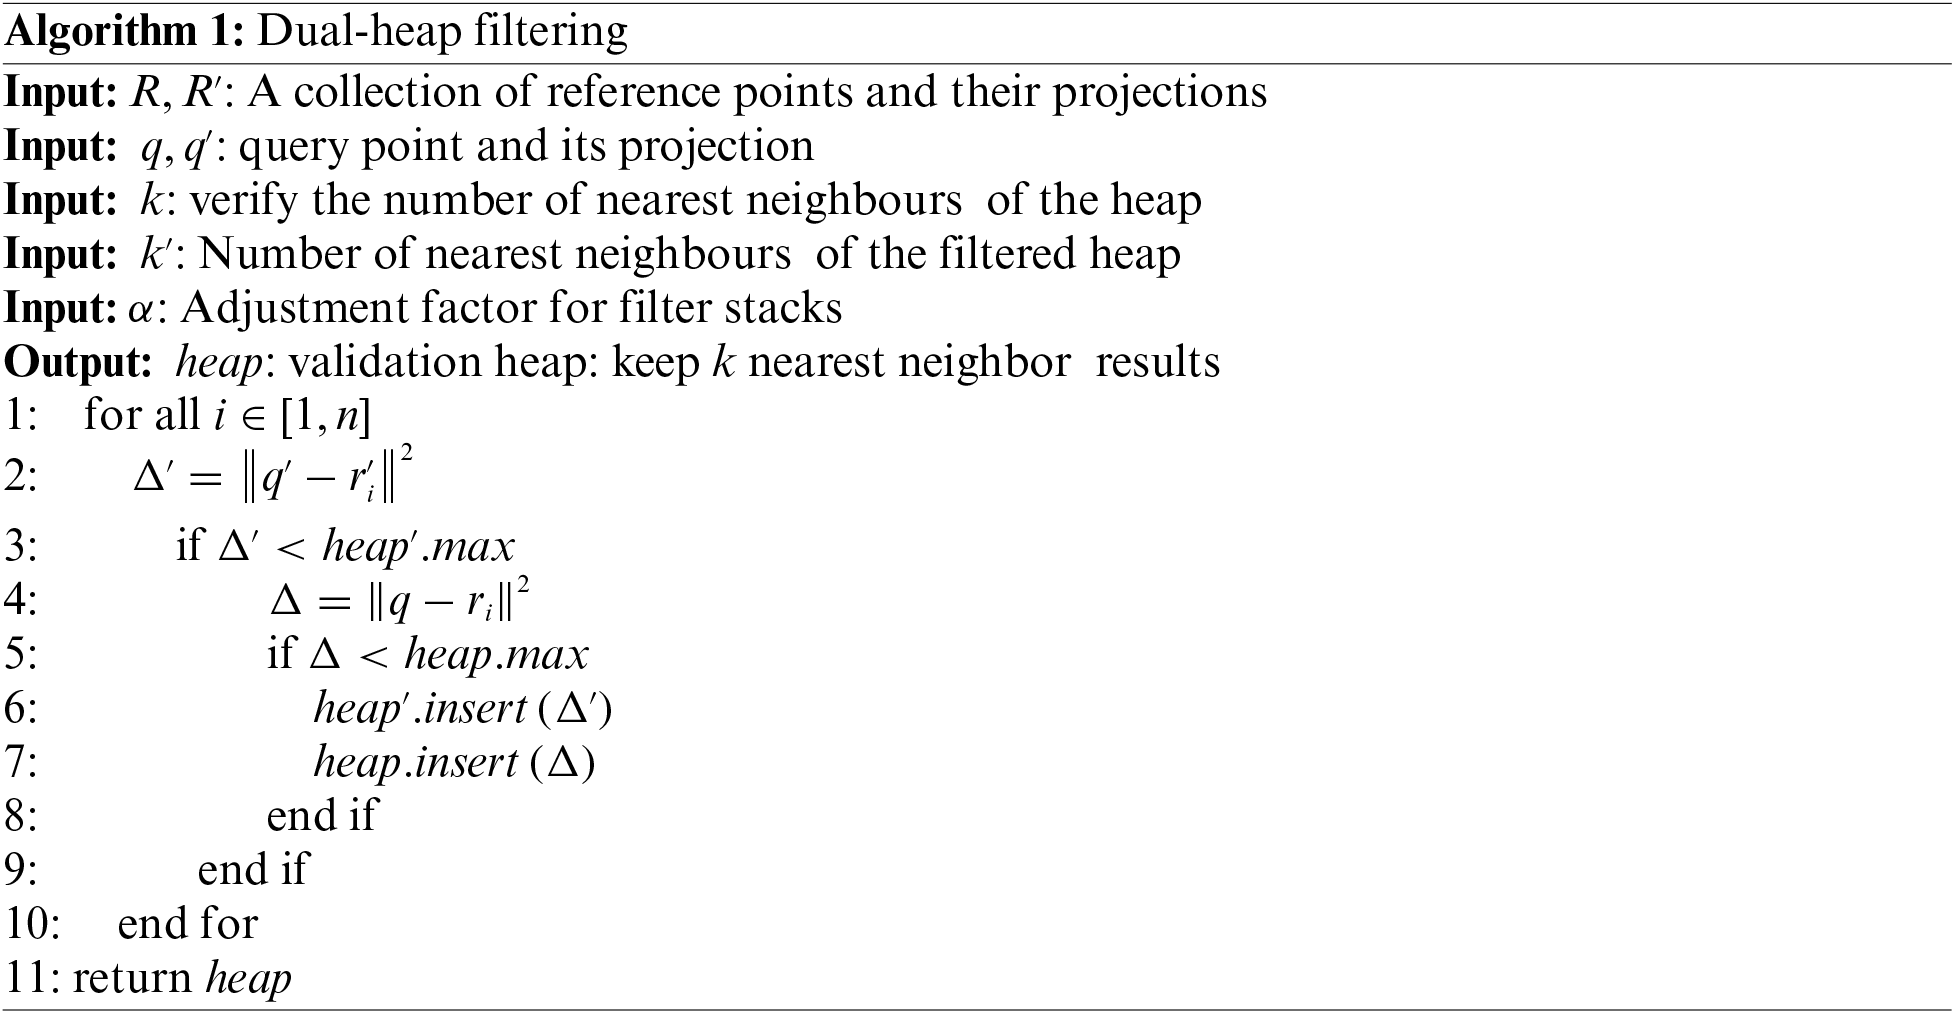
To address the aforementioned issue, this paper proposes a Dual-Heap Filtering (DHF) algorithm based on PCA ranking prediction. DHF maintains two filtering heaps: one in the PCA space called the filtering heap, and the other in the original space called the validation heap. Each heap retains the top
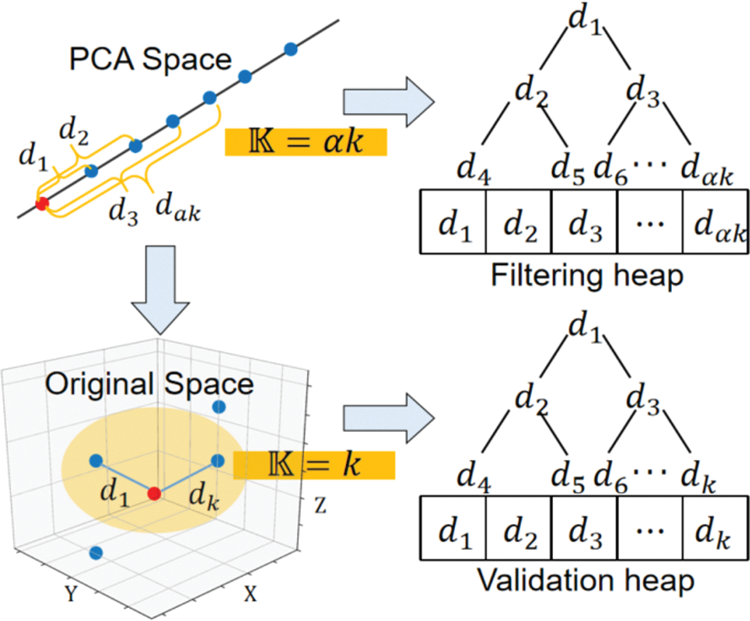
Figure 2: Illustration of the dual-heap filtering
When using the DHF algorithm to filter feature points, the first step is to calculate the squared Euclidean distance (SED) between the projected reference feature point and the query point in the PCA space. If this squared Euclidean distance is greater than the maximum value in the filtering heap, the reference feature point is discarded. If the squared Euclidean distance is less than the maximum value in the filtering heap, the Euclidean distance (ED) between the reference feature point and the query point in the original space is then calculated. If this Euclidean distance is greater than the maximum value in the validation heap, the reference feature point is discarded. If it is less than the maximum value, it is considered a correct judgment. The respective Euclidean distance value and squared Euclidean distance value are then inserted into the validation heap and the filtering heap, respectively, replacing their initial maximum values and reordering them accordingly. The specific code implementation is as follows:
The relationship between the adjustment factor
3.3 Multi-Core Parallel Matching
Traditional matching algorithms typically involve matching according to the index order of reference feature points, with each matching task performed on a per-reference-point basis. For instance, matching algorithms utilizing kd-trees necessitate continuous searching of reference feature points based on tree-like indexing [20–22]. However, due to the large number of reference feature points overall, this matching approach imposes a significant computational burden during the matching process of individual query points, thereby complicating the task of load balancing within the system.
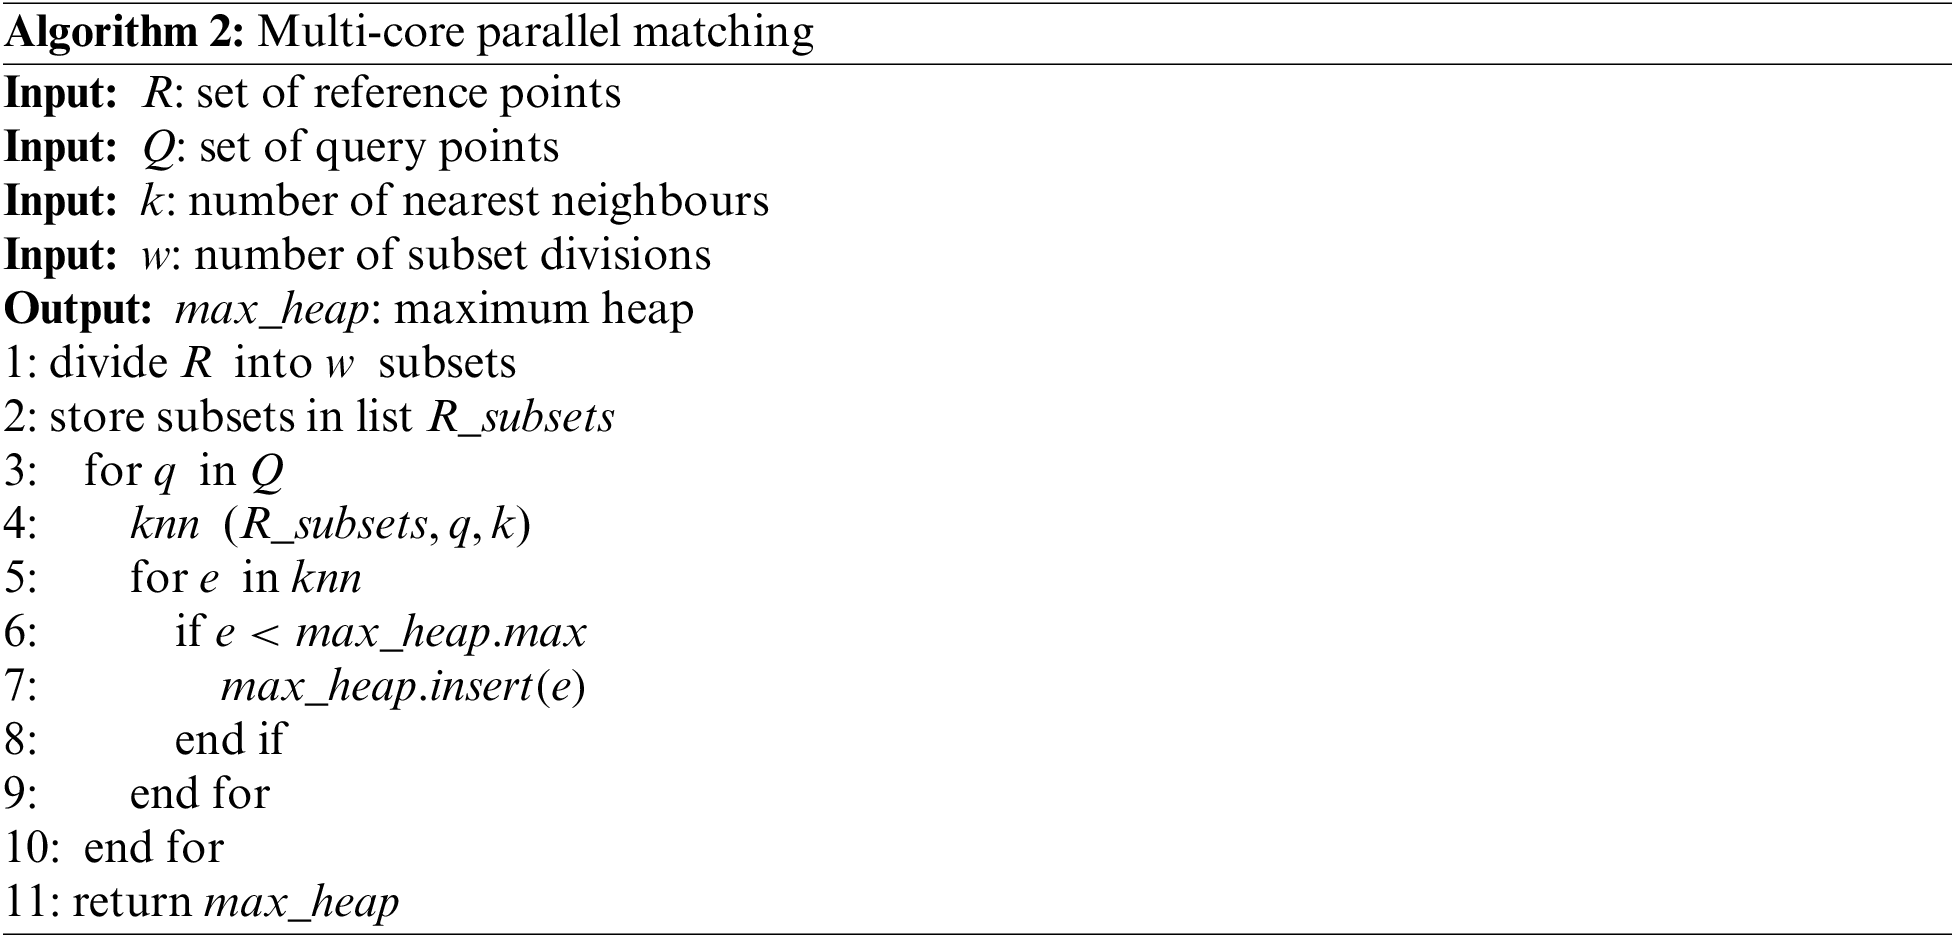
Due to the relatively independent nature of the matching tasks for each reference feature point in the proposed algorithm, it is particularly suitable for parallel processing when dealing with a large number of reference feature points [23–25]. To achieve this, we have designed a multi-core parallel matching strategy, dividing the matching tasks into multiple subsets and concurrently assigning these subsets to multiple processing cores for parallel computation, as illustrated in Fig. 3.
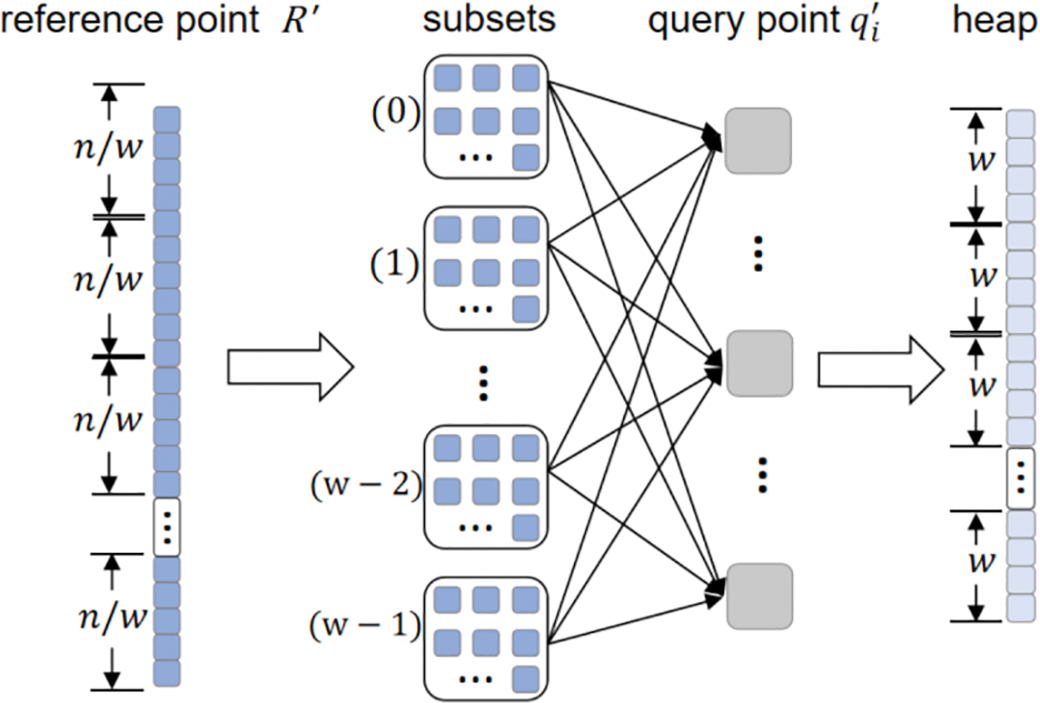
Figure 3: Schematic diagram of multi-core parallel matching
During feature matching, the first step involves partitioning the reference feature point set
In this section, brute-force search (BF) will be used as a comparative algorithm to analyze the time and space complexity of the SUPD. For the matching of a single query feature point, the BF algorithm calculates and matches the distances of all reference feature points in the original space through exhaustive search [26–28]. Due to the high dimensionality of the original space, the BF algorithm needs to traverse all reference feature points, resulting in a high space complexity of
However, in the actual matching process, if most unnecessary distance calculations are avoided, the algorithm’s performance can be significantly improved. The SUPD precisely possesses this characteristic. This algorithm first projects feature points into a low-dimensional PCA space and then utilizes the K-nearest neighbors (KNN)-based DHP algorithm for filtering. Although these two steps introduce some computational overhead, they play a crucial role in reducing the computational load in the subsequent matching process.
In the dimensionality reduction process, Principal Component Analysis is used to project feature points from high-dimensional space to low-dimensional space, thereby eliminating redundant information among features. Although PCA involves calculating the covariance matrix and decomposing eigenvectors, which may incur some computational overhead, it can significantly reduce the amount of data to be processed in the subsequent matching steps. Therefore, from an overall performance perspective, this overhead is worthwhile. Next, the DHP utilizes the KNN for filtering. The space complexity of the KNN mainly stems from the construction of the tree, while the tree search process does not require additional storage space [29–30]. Although tree construction may introduce some additional computational overhead, this overhead is negligible compared to the subsequent avoided matching computations. By filtering out most of the unlikely matching feature points, the DHP significantly improves the efficiency of the matching process.
Considering these computational overheads, the space complexity of the SUPD after dimensionality reduction and filtering can be approximated as
Suppose the total time required for the BF algorithm to compute all distances for a single query feature point in the original space is denoted as
The principal parameters of the SUPD encompass the number of principal components (
Firstly, when employing Principal Component Analysis for dimensionality reduction, it is essential to determine the number of retained principal components, namely the reduced dimensionality. Having too many principal components (large
Subsequently, the DHP is employed to refine and extract matching point pairs. The size of the filtering heap is determined by
Finally, the projected reference feature point set is divided into
The hardware platform for this experiment is an AMD Opteron Processor 6376 CPU @ 2.30 GHz with 16 MB L3 cache, 16 cores, 32 logical processors, and 128 GB of memory. The software platform consists of a 64-bit Windows 10 operating system, Visual Studio Code, and OpenCV 4.
To meet the research requirements, this paper utilized a self-constructed dataset comprising 100 sets of local road images with a certain degree of overlap. The images are sized at 1000 pixels × 700 pixels and are formatted as JPG. The dataset covers various road scenarios, including urban roads, rural lanes, highways, etc. It exhibits significant diversity in perspectives, lighting conditions, and weather conditions to better reflect the complexity of real road environments.
1)Total Matching Time (
Matching Accuracy (
Root Mean Square Error of Matches
This section establishes the precise values of each parameter when the algorithm achieved optimal performance through experimentation, based on the parameter ranges analyzed in Section 4.2. Before the experiments were conducted, the evaluation criteria for parameter selection were first defined as follows:
a) Speedup Ratio: Matching time of brute-force matching divided by the matching time of the algorithm proposed in this paper.
b) Acceleration Ratio: Serial matching time of the algorithm divided by parallel matching time.
c) Comprehensive Efficiency Index: This index is obtained by multiplying the speedup ratio with the matching accuracy rate, thereby comprehensively considering the algorithm’s runtime and matching precision.
According to the analysis in Section 4.2, it is calculated that the number of principal components corresponding to the cumulative contribution rates of 55% and 95% for the dataset are 5 and 20, respectively. Therefore, this study analyzes the number of principal components, denoted as
The experimental results are shown in Fig. 4, demonstrate a similar trend between the comprehensive efficiency index and the number of principal components under different conditions of the filter heap adjustment factor
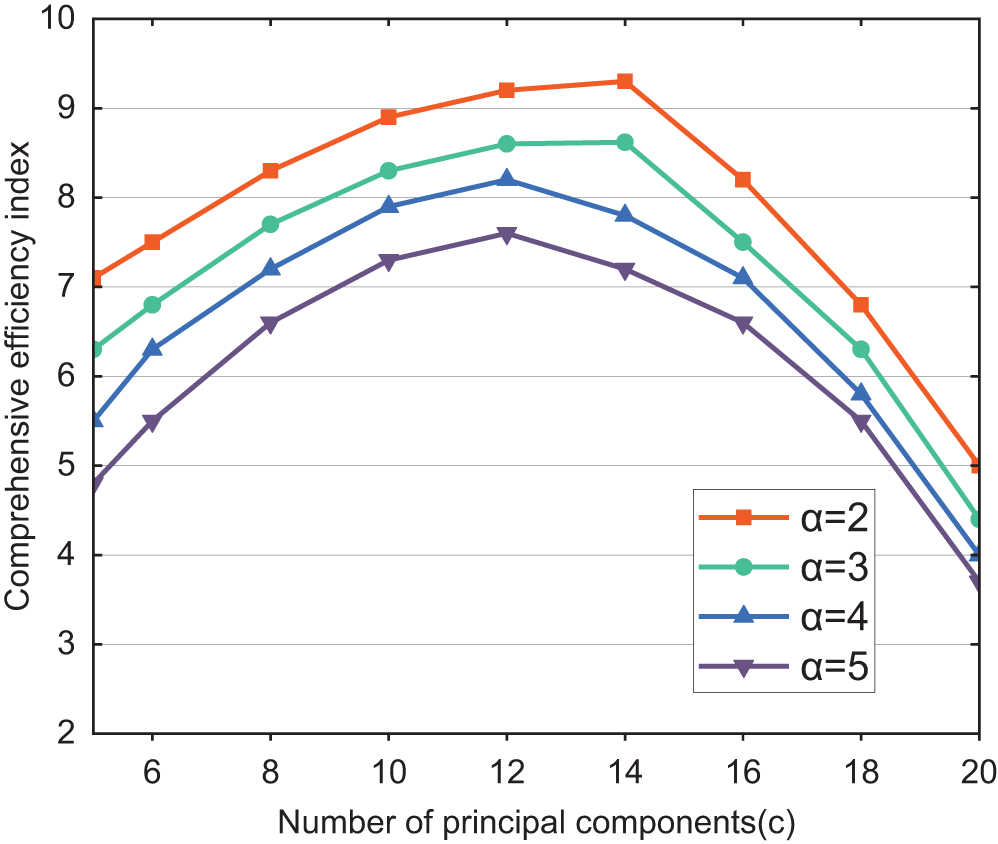
Figure 4: Influence on the performance of the algorithm for the number of principal components (
Considering the relatively high independence of the number of subset divisions (
The experimental results are depicted in Fig. 5. With the increase of
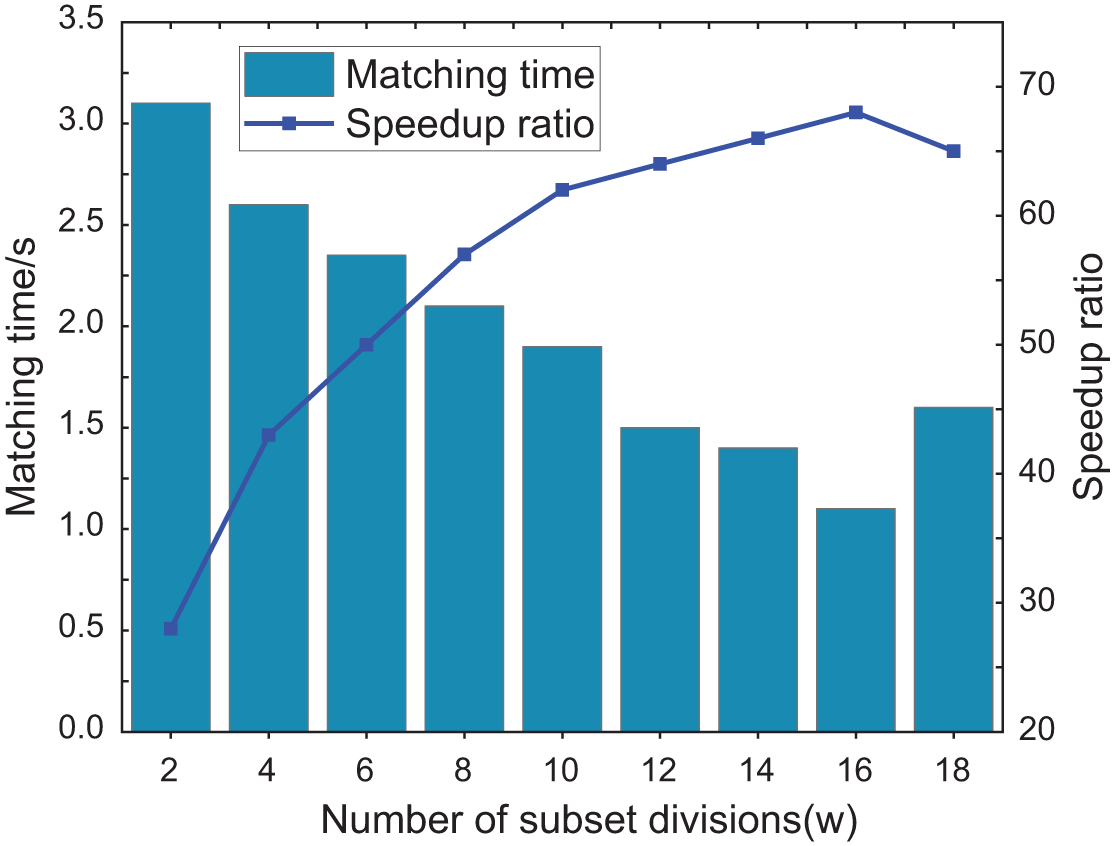
Figure 5: Influence on the performance of the algorithm for the number of subset divisions
To verify the performance of the SUPD, this paper divides the data set into 5 groups according to the complexity of color and texture, and the complexity of the experimental group increases from 1 to 5. For each experimental group, the average values of matching total time, matching accuracy, and MERD were calculated. Additionally, comparative experiments were conducted with traditional SIFT and SURF to obtain more comprehensive performance comparison results. Both SIFT and SURF algorithms were paired with the built-in brute-force matching algorithm in OpenCV for feature matching.
Total matching time as a significant metric effectively measures the real-time performance of algorithms. Fig. 6 presents a comparison of the total matching time between the SUPD and two other traditional algorithms. It is evident that the SUPD outperforms the conventional SIFT and SURF in terms of total matching time, reducing the time by 77% to 80%. This improvement in real-time performance stems from the specific design of the SUPD. The algorithm employs Principal Component Analysis to perform dimensionality reduction on feature descriptors, effectively reducing computational complexity. Additionally, the SUPD introduces a multi-core parallel matching strategy, allowing multiple processing cores to simultaneously execute matching operations. This not only accelerates the computation process but also enhances system throughput, significantly boosting the overall algorithm’s running speed.
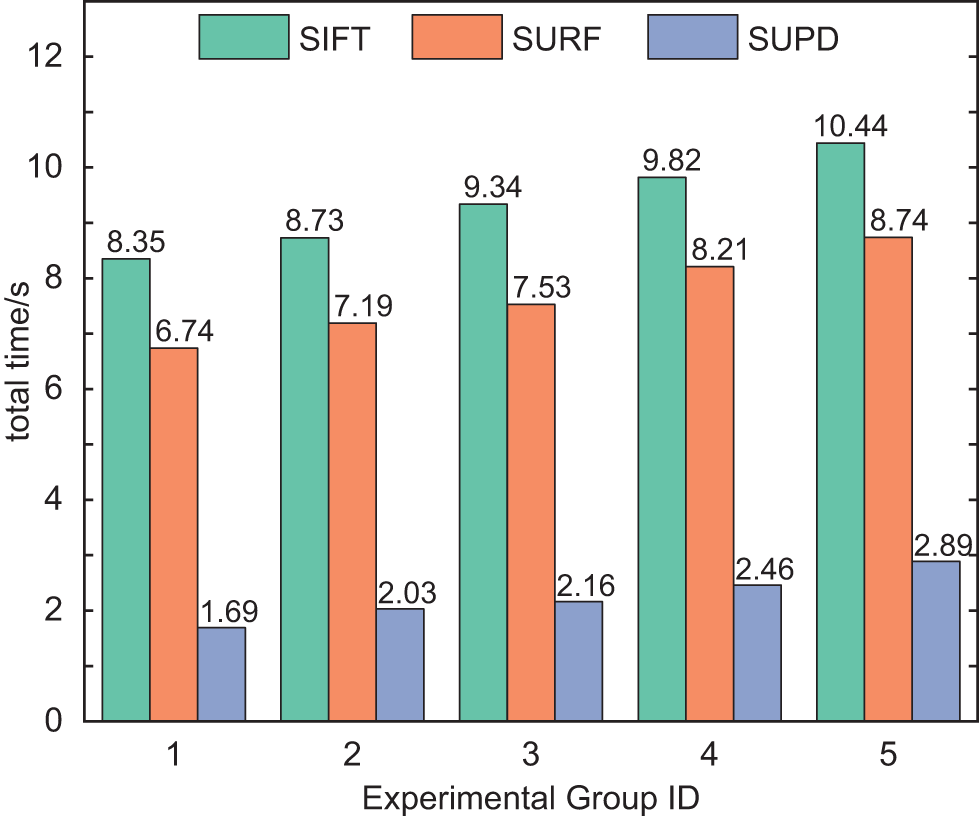
Figure 6: Total matching time of SIFT, SURF and SUPD
Matching accuracy effectively reflects the precision and robustness of feature matching algorithms. Its calculation method is shown in Eq. (11). Fig. 7 illustrates the comparison results of matching accuracy between the SUPD and two other traditional algorithms. The comparison reveals that compared to traditional SIFT and SURF algorithms, the SUPD improves accuracy by 5% to 15%.
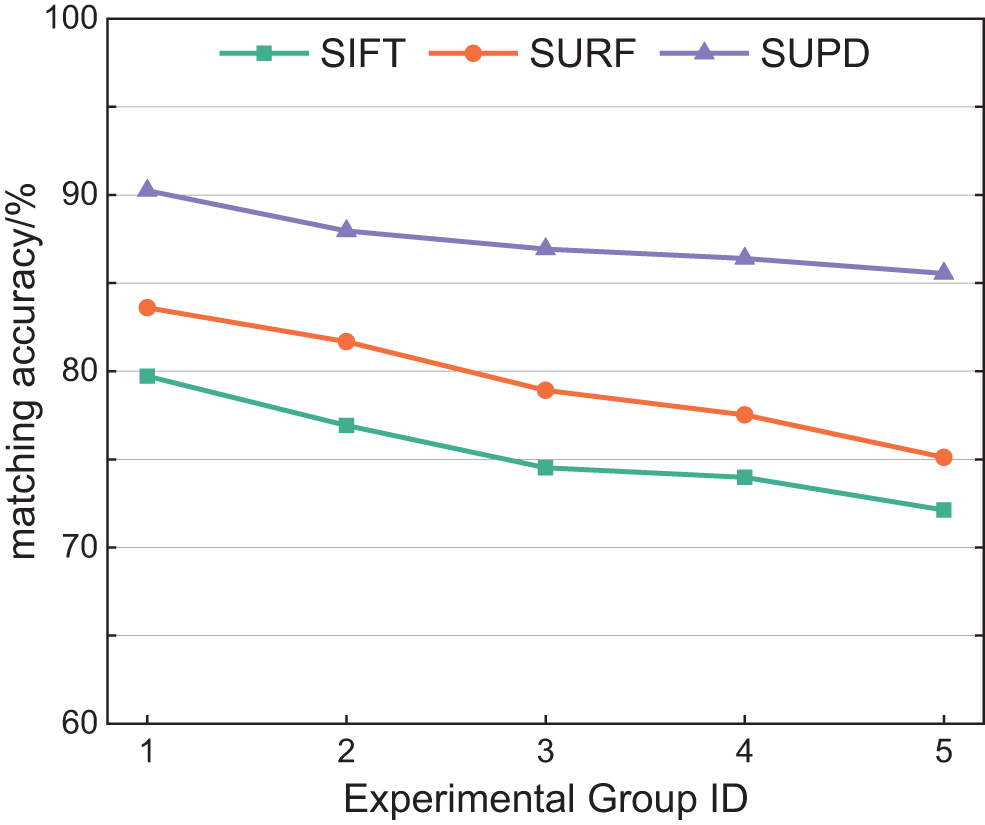
Figure 7: Matching accuracy of SIFT, SURF and SUPD
To provide a more intuitive representation of the contrasting matching accuracy, this paper takes the matching results of the first experiment in the third group as an example to analyze the relative performance of the SUPD against the traditional SIFT and SURF in terms of matching accuracy, as shown in Fig. 8.
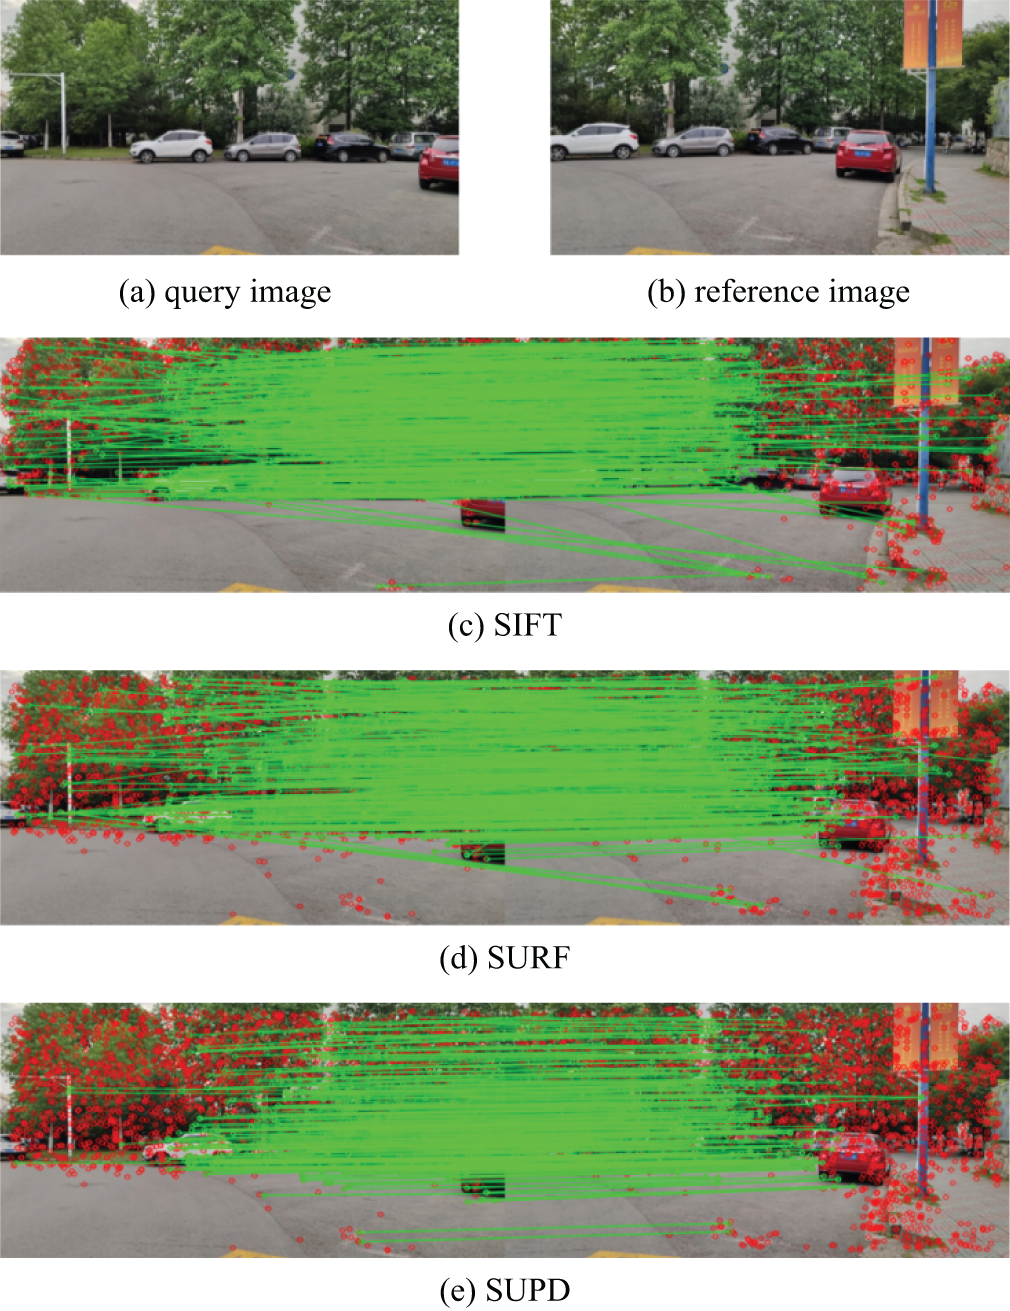
Figure 8: Matching results of different algorithms. (a) The query image. (b) The reference image. (c) SIFT algorithm (d) SURF algorithm. (e) SUPD algorithm
From Fig. 8c,d, it can be seen that traditional SIFT and SURF exhibit a significant number of issues like cross-matching and repetitive matching, leading to lower matching accuracy. In contrast, the matching effect of the SUPD is shown in Fig. 8e. The algorithm filters and refines the matched point pairs using the two maintained filtering heaps in the DHF algorithm. This process effectively reduces false matching and ensures a high level of matching accuracy.
5.3.3 Matching Error Root Mean Square
In order to provide a more intuitive representation of the overall matching quality between feature point pairs, this paper introduces the Matching Error Root Mean Square (MERD) as an evaluation metric. A smaller MERD value indicates higher overall matching quality between feature point pairs, whereas a larger MERD value suggests poorer matching quality. The calculation formula for MERD is given in Eq. (12). Fig. 9 illustrates the comparison results of the SUPD and two other traditional algorithms in terms of MERD. It can be observed that the MERD values of the SUPD are consistently lower than those of the SIFT and SURF, with reductions ranging from 12% to 32%. This indicates that the SUPD exhibits superior performance in matching feature point pairs overall, enabling more accurate matching of high-dimensional features between local road images.
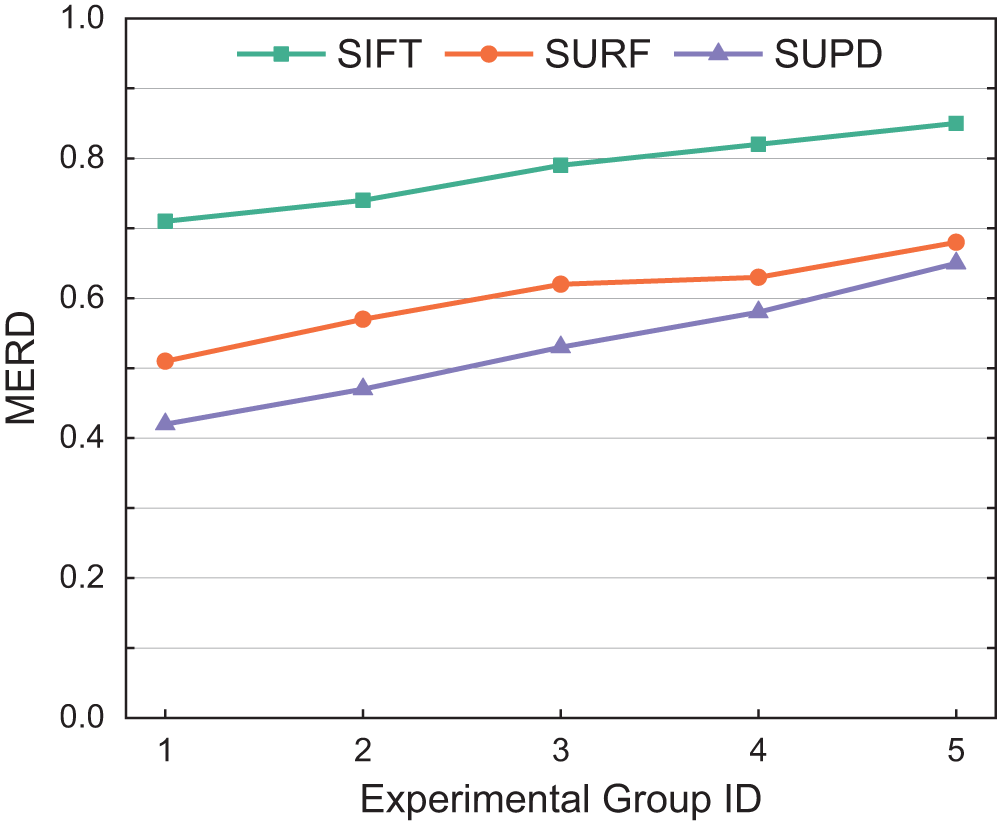
Figure 9: Matching error root mean square of SIFT, SURF and SUPD
Addressing the inefficiencies of traditional image feature matching algorithms in handling high-dimensional feature points within partial road images, this paper proposes a high-performance dimensionality reduction and parallel matching algorithm that combines Principal Component Analysis (PCA) and Dual-Heap Filtering. Through PCA, the algorithm projects the feature point set into a lower-dimensional space and employs squared Euclidean distance for rank estimation, effectively reducing the computational complexity during the matching process. Furthermore, to ensure the accuracy of feature matching, the proposed algorithm employs the Dual-Heap Filtering for refining matched point pairs. In addition, the algorithm utilizes a parallel structure to fully leverage computational resources, enhancing the overall matching speed. Experimental results demonstrate that the proposed algorithm holds distinct advantages over traditional image feature matching algorithms in terms of total matching time, matching accuracy, and MERD. Thus, the algorithm strikes a balance between matching accuracy and real-time performance, making it suitable for efficient matching of high-dimensional feature points in partial road images.
Despite the advantages presented by this algorithm, there are challenges that might arise when it is applied to extremely large datasets, especially within environments constrained by limited computational resources. In response to these challenges, future research will be directed towards the development of more effective strategies and optimization techniques. This includes plans to update the experimental equipment and to conduct experiments with a broader range of datasets to enhance the scalability and robustness of the algorithm in complex environments. Furthermore, the integration of machine learning methods for the automatic adjustment and optimization of the algorithm’s parameters is under consideration. Such steps are anticipated to improve the adaptability and performance of the algorithm in various application scenarios.
Acknowledgement: The authors thank their institutions for infrastructure support.
Funding Statement: The authors would like to thank the National Natural Science Foundation of China (61803206), the Key R&D Program of Jiangsu Province (BE2022053-2), and the Nanjing Forestry University Youth Science and Technology Innovation Fund (CX2018004) for partly funding this project.
Author Contributions: The authors confirm contribution to the paper as follows: study conception and design: Guangbing Xiao, Ruijie Gu; data collection: Ning Sun; analysis and interpretation of results: Ruijie Gu, Ning Sun; draft manuscript preparation: Ruijie Gu, Yong Zhang. All authors reviewed the results and approved the final version of the manuscript.
Availability of Data and Materials: The authors confirm that the data supporting the findings of this study are available within the article.
Conflicts of Interest: The authors declare that they have no conflicts of interest to report regarding the present study.
References
1. X. Guo, Z. Wang, and W. Zhu, “Research on DSO vision positioning technology based on binocular stereo panoramic vision system,” Def. Technol., vol. 18, no. 4, pp. 593–603, 2022. doi: 10.1016/j.dt.2021.12.010. [Google Scholar] [CrossRef]
2. P. Paul and A. Sharma, “A comprehensive review of navigation system, design, and safety issues for autonomous vehicle development,” in Autonomous Driving and Advanced Driver-Assistance Systems (ADAS), 1st, ed., CRC Press, 2021, pp. 87–104. [Google Scholar]
3. D. Li, K. Cao, L. Kong, and H. Yu, “Fully distributed cooperative circumnavigation of networked unmanned aerial vehicles,” IEEE/ASME Trans. Mechatron., vol. 26, no. 2, pp. 709–718, 2021. doi: 10.1109/TMECH.2021.3055654. [Google Scholar] [CrossRef]
4. S. Li, X. Shao, W. Zhang, and Q. Zhang, “Distributed multicircular circumnavigation control for UAVs with desired angular spacing,” Def. Technol., vol. 31, no. 4, pp. 429–446, 2024. doi: 10.1016/j.dt.2023.02.007. [Google Scholar] [CrossRef]
5. S. Alaee, R. Mercer, K. Kamgar, and E. Keogh, “Time series motifs discovery under DTW allows more robust discovery of conserved structure,” Data Min. Knowl. Discov., vol. 35, no. 3, pp. 863–910, 2021. doi: 10.1007/s10618-021-00740-0. [Google Scholar] [CrossRef]
6. C. Sun, X. Wu, J. Sun, C. Sun, and L. Dong, “Robust pose estimation via hybrid point and twin line reprojection for RGB-D vision navigation,” IEEE Trans. Instrum. Meas., vol. 71, pp. 1–19, 2022. doi: 10.1109/TIM.2022.3170980. [Google Scholar] [CrossRef]
7. X. Zou and B. Pan, “Full-automatic seed point selection and initialization for digital image correlation robust to large rotation and deformation,” Opt. Lasers Eng., vol. 138, no. 8, pp. 106432, 2021. doi: 10.1016/j.optlaseng.2020.106432. [Google Scholar] [CrossRef]
8. X. Wang, Q. Xie, T. Ma, and J. Zhu, “Feature extraction based on dimension reduction and clustering for maize leaf spot images,” Int. J. Pattern Recognit. Artif. Intell., vol. 32, no. 12, pp. 1854029, 2018. doi: 10.1142/S0218001418540290. [Google Scholar] [CrossRef]
9. B. Tran, B. Xue, and M. Zhang, “Variable-length particle swarm optimization for feature selection on high-dimensional classification,” IEEE Trans. Evol. Comput., vol. 23, no. 3, pp. 473–487, 2018. doi: 10.1109/TEVC.2018.2869405. [Google Scholar] [CrossRef]
10. M. Ghosh, R. Guha, R. Sarkar, and A. Abraham, “A wrapper-filter feature selection technique based on ant colony optimization,” Neural Comput. Appl., vol. 32, no. 12, pp. 7839–7857, 2020. doi: 10.1007/s00521-019-04171-3. [Google Scholar] [CrossRef]
11. W. Ma, J. Zhang, Y. Wu, L. Jiao, H. Zhu and W. Zhao, “A novel two-step registration method for remote sensing images based on deep and local features,” IEEE Trans. Geosci. Remote Sens., vol. 57, no. 7, pp. 4834–4843, 2019. doi: 10.1109/TGRS.2019.2893310. [Google Scholar] [CrossRef]
12. S. Chaudhari, V. Mithal, G. Polatkan, and R. Ramanath, “An attentive survey of attention models,” ACM Trans. Intell. Syst. Technol., vol. 12, no. 5, pp. 1–32, 2021. doi: 10.1145/3465055. [Google Scholar] [CrossRef]
13. B. Y. Wang, X. H. Zhang, and W. B. Wang, “Feature matching method based on SURF and fast library for approximate nearest neighbor search,” Integr. Ferroelectr., vol. 218, no. 1, pp. 147–154, 2021. doi: 10.1080/10584587.2021.1911336. [Google Scholar] [CrossRef]
14. S. Magdy, Y. Abouelseoud, and M. Mikhail, “Privacy preserving search index for image databases based on SURF and order preserving encryption,” IET Image Process., vol. 14, no. 5, pp. 874–881, 2020. doi: 10.1049/iet-ipr.2019.0575. [Google Scholar] [CrossRef]
15. S. Gupta, K. Thakur, and M. Kumar, “2D-human face recognition using SIFT and SURF descriptors of face’s feature regions,” Vis. Comput., vol. 37, no. 3, pp. 447–456, 2021. doi: 10.1007/s00371-020-01814-8. [Google Scholar] [CrossRef]
16. B. M. S. Hasan and A. M. Abdulazeez, “A review of principal component analysis algorithm for dimensionality reduction,” J. Soft Comput. Data Mining, vol. 2, no. 1, pp. 20–30, 2021. [Google Scholar]
17. D. Huang, F. Jiang, K. Li, G. Tong, and G. Zhou, “Scaled PCA: A new approach to dimension reduction,” Manage. Sci., vol. 68, no. 3, pp. 1678–1695, 2022. doi: 10.1287/mnsc.2021.4020. [Google Scholar] [CrossRef]
18. C. Happ and S. Greven, “Multivariate functional principal component analysis for data observed on different (dimensional) domains,” J. Am. Stat. Assoc., vol. 113, no. 522, pp. 649–659, 2018. doi: 10.1080/01621459.2016.1273115. [Google Scholar] [CrossRef]
19. A. Kunimatsu, N. Kunimatsu, K. Kamiya, T. Watadani, H. Mori and O. Abe, “Comparison between glioblastoma and primary central nervous system lymphoma using MR image-based texture analysis,” Magn. Reson. Med. Sci., vol. 17, no. 1, pp. 50–57, 2018. doi: 10.2463/mrms.mp.2017-0044. [Google Scholar] [PubMed] [CrossRef]
20. W. Xu, Y. Cai, D. He, J. Lin, and F. Zhang, “FAST-LIO2: Fast direct lidar-inertial odometry,” IEEE Trans. Robot., vol. 38, no. 4, pp. 2053–2073, 2022. doi: 10.1109/TRO.2022.3141876. [Google Scholar] [CrossRef]
21. Y. Liu et al., “Robust feature matching via advanced neighborhood topology consensus,” Neurocomputing, vol. 421, no. 1, pp. 273–284, 2021. doi: 10.1016/j.neucom.2020.09.047. [Google Scholar] [CrossRef]
22. Y. Chen et al., “Fast neighbor search by using revised kd tree,” Inf. Sci., vol. 472, no. 1, pp. 145–162, 2019. doi: 10.1016/j.ins.2018.09.012. [Google Scholar] [CrossRef]
23. Q. Wu, Y. Chen, J. P. Wilson, X. Liu, and H. Li, “An effective parallelization algorithm for DEM generalization based on CUDA,” Environ. Model. Softw., vol. 114, no. 2, pp. 64–74, 2019. doi: 10.1016/j.envsoft.2019.01.002. [Google Scholar] [CrossRef]
24. Y. Lu, Y. Li, B. Song, W. Zhang, H. Chen and L. Peng, “Parallelizing image feature extraction algorithms on multi-core platforms,” J. Parallel Distr. Comput., vol. 92, pp. 1–14, 2016. doi: 10.1016/j.jpdc.2016.03.001. [Google Scholar] [CrossRef]
25. M. Denham and K. Laneri, “Using efficient parallelization in graphic processing units to parameterize stochastic fire propagation models,” J. Comput. Sci., vol. 25, no. 6154, pp. 76–88, 2018. doi: 10.1016/j.jocs.2018.02.007. [Google Scholar] [CrossRef]
26. M. S. Reis, G. Estrela, C. E. Ferreira, and J. Barrera, “Optimal Boolean lattice-based algorithms for the U-curve optimization problem,” Inf. Sci., vol. 471, pp. 97–114, 2019. [Google Scholar]
27. K. Zhao, X. Jin, J. Ji, J. Wang, H. Ma and X. Zhu, “Individual identification of Holstein dairy cows based on detecting and matching feature points in body images,” Biosyst. Eng., vol. 181, no. 2, pp. 128–139, 2019. doi: 10.1016/j.biosystemseng.2019.03.004. [Google Scholar] [CrossRef]
28. J. Feng, J. Fu, Z. Lin, C. Shang, and X. Niu, “Layered infill area generation from triply periodic minimal surfaces for additive manufacturing,” Comput-Aided Design, vol. 107, pp. 50–63, 2019. [Google Scholar]
29. Z. Chang, D. Xie, F. Li, J. M. Phillips, and R. Balasubramonian, “Efficient oblivious query processing for range and knn queries,” IEEE Trans. Knowl. Data Eng., vol. 34, no. 12, pp. 5741–5754, 2021. doi: 10.1109/TKDE.2021.3060757. [Google Scholar] [CrossRef]
30. L. Hu and S. Nooshabadi, “High-dimensional image descriptor matching using highly parallel KD-tree construction and approximate nearest neighbor search,” J. Parallel Distr. Comput., vol. 132, no. 3, pp. 127–140, 2019. doi: 10.1016/j.jpdc.2019.06.003. [Google Scholar] [CrossRef]
31. J. Hu et al., “Adjusting switching granularity of load balancing for heterogeneous datacenter traffic,” IEEE/ACM Trans. Netw., vol. 29, no. 5, pp. 2367–2384, 2021. doi: 10.1109/TNET.2021.3088276. [Google Scholar] [CrossRef]
32. S. Bora, B. Walker, and M. Fidler, “The tiny-tasks granularity trade-off: Balancing overhead versus performance in parallel systems,” IEEE Trans. Parallel Distrib. Syst., vol. 34, no. 4, pp. 1128–1144, 2023. doi: 10.1109/TPDS.2022.3233712. [Google Scholar] [CrossRef]
33. C. Pagetti, J. Forget, F. Boniol, M. Cordovilla, and D. Lesens, “Multi-task implementation of multi-periodic synchronous programs,” Discrete Event Dyn. Syst., vol. 21, no. 3, pp. 307–338, 2011. doi: 10.1007/s10626-011-0107-x. [Google Scholar] [CrossRef]
34. F. Glaser, G. Tagliavini, D. Rossi, G. Haugou, Q. Huang and L. Benini, “Energy-efficient hardware-accelerated synchronization for shared-L1-memory multiprocessor clusters,” IEEE Trans. Parallel Distrib. Syst., vol. 32, no. 3, pp. 633–648, 2020. doi: 10.1109/TPDS.2020.3028691. [Google Scholar] [CrossRef]
Cite This Article
 Copyright © 2024 The Author(s). Published by Tech Science Press.
This work is licensed under a Creative Commons Attribution 4.0 International License , which permits unrestricted use, distribution, and reproduction in any medium, provided the original work is properly cited.
 Downloads
 Citation Tools