
 Submit a Paper
 Propose a Special lssue
 Open Access
CORRECTION

Correction: Applying Customized Convolutional Neural Network to Kidney Image Volumes for Kidney Disease Detection
1 Department of Computer Science, Prince Sattam Bin Abdulaziz University, Al-Kharj, 11942, Saudi Arabia
2 Faculty of Computing and Information Technology, King Abdulaziz University, Jeddah, 21589, Saudi Arabia
3 Department of Electrical and Computer Engineering, Lebanese American University, Byblos, Lebanon
* Corresponding Author: Ali Altalbe. Email:
Computer Systems Science and Engineering 2024, 48(4), 1075-1081. https://doi.org/10.32604/csse.2024.054179
Issue published 17 July 2024
This article is a correction of:
Applying Customized Convolutional Neural Network to Kidney Image Volumes for Kidney Disease Detection
Read original article
 View Full Text
 Download PDF
Abstract
This article has no abstract.In the article “Applying Customized Convolutional Neural Network to Kidney Image Volumes for Kidney Disease Detection” by Ali Altalbe, Abdul Rehman Javed (Computer Systems Science and Engineering, 2023, Vol. 47, No. 2, pp. 2119–2134. DOI: 10.32604/csse.2023.040620), the authors intend to update information of the dataset and update a couple of numerical values to percentage form. Initially, the authors provided information where test dataset split criteria were missing. Further, the authors run the experiments again and the results get improved a little. The authors did not make any changes in the Experiments.
The authors wish to apologize for any inconvenience caused due to the fact that the author could have improved the paper presentation of the paper so that the reader can easily understand. Please check the following updates:
1. Abstract: 1st page-The author requests to update the second last sentence in the Abstract in percentage form:
Original Content: “Results reveal that the proposed approach accurately classifies kidney disease with a considerable accuracy of 0.992%, 0.994% precision, 0.982% recall, and 0.987% F1-score.”
Updated Content: “Results reveal that the proposed approach accurately classifies kidney disease with a considerable accuracy of 99.94%, 99.95% precision, 99.92% recall, and 99.94% F1-score. The code is publicly available at [https://drive.google.com/file/d/1cipo96h7mK4Gp-91IbqgjXixRzrbRJ2Y/view?usp=sharing].”
2.Page 2121: 2nd and 3rd Bullet:
• Original Content:
The dataset CT kidney disease having normal, stone, cyst, and tumor classes is used with 12,446 unique instances in the produced dataset, 3709 of which are from cysts, 5077 from normal data, 1377 from stones, and 2283 from tumors.
• Results reveal that the proposed approach achieves the best accuracy of 99.94% compared to traditional methods and existing studies.
Updated Content: The dataset CT kidney disease having normal, stone, cyst, and tumor classes is used with 12,446 unique instances. Results reveal that the proposed approach achieves the best accuracy of 99.94% compared to traditional methods and existing studies.
3. Page 2123:
Original Content: Table 1 (3rd row): 0.911%
Updated Content: Table 1 (3rd row): 91.1%
4. Page 2124:
Original Content: Section 3.2: This phase performed the data preparation stage to improve the model’s performance. Every dataset of kidney disease Dicom images includes undesirable places and areas. Therefore, re-scaling or resizing the images is essential to eliminate unnecessary space and use only the pertinent information. The first pre-processing step is resizing the images according to the typical size requirement of NN models after transferring DICOM images into jpg files. The dataset is assessed by discovering the 11,200 images belonging to 4 classes, 626 images corresponding to 4 classes, and 620 images belonging to 4 classes by re-scaling through the image data generated. Images of various shapes, sizes, and widths can be found in the Dicom image dataset for kidney disease. To get the best results, resizing the images to be the same height and width is required. In this research, each image is resized 227 by 227 pixels for a CNN and uses bilinear interpolation. Bilinear interpolation transforms an image with matching pixels whenever possible, chooses and assigns the proper intensity distribution to each pixel, and produces a smoother-looking image. As a result, we found 12,446 files belonging to 4 classes cyst, normal, stone, and tumor, using the 9957 files for training.
Updated Content: Section 3.2: This phase performed the data preparation stage to improve the model’s performance. Every dataset of kidney disease Dicom images includes undesirable places and areas. Therefore, re-scaling or resizing the images is essential to eliminate unnecessary space and use only the pertinent information. The first pre-processing step is resizing the images according to the typical size requirement of NN models after transferring DICOM images into jpg files. Images of various shapes, sizes, and widths can be found in the Dicom image dataset for kidney disease. To get the best results, resizing the images to be the same height and width is required. In this research, each image is resized 227 by 227 pixels for a CNN and uses bilinear interpolation. Bilinear interpolation transforms an image with matching pixels whenever possible, chooses and assigns the proper intensity distribution to each pixel, and produces a smoother-looking image. As a result, we found 12,446 files belonging to 4 classes cyst, normal, stone, and tumor.
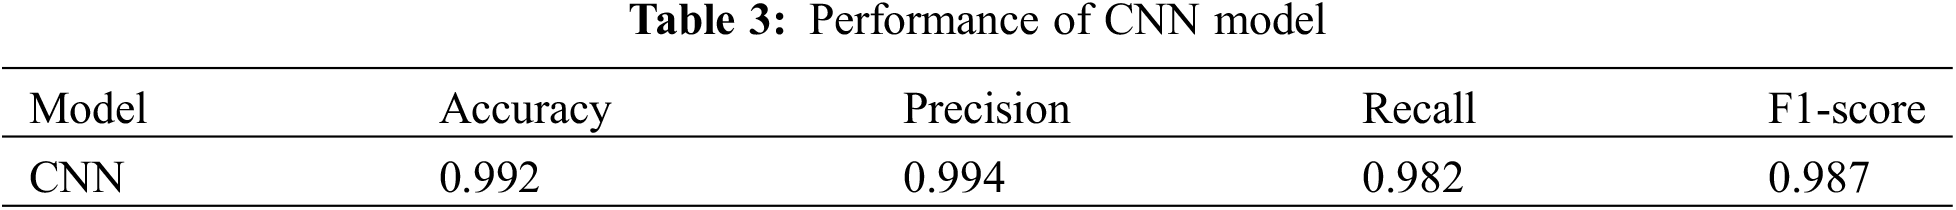
5. Page 2129:
Original Content: Section 4.2, Section 5: The results of the proposed model are provided in Table 3. The CNN model accurately detects kidney illness, either cyst, normal, stone, or tumor, by achieving 0.992% accuracy, 0.994% precision, 0.982% recall, and 0.987% F1-score. The proposed approach is implemented in a convolutional neural network model. The convolutional neural network’s accuracy, loss, precision, and recall during training and validation are graphically shown in Fig. 4. The first graph represents the precision model in Fig. 4. A blue line represents the training precision curve; an orange line represents the validation precision curve. At the 0th epoch, the training precision is 0.65%; after various fluctuations between falls and gains, it reached about 0.95% precision at the 8th epoch. At the 0th epoch, validation precision is 0.75%; however, it fluctuates between drops and gains until reaching 0.95% precision at the 8th epoch. The second graph represents the recalled model. A blue line represents the training recall curve, while an orange line represents the validation recall curve. The training recall is 0.2% at the 0th epoch and varied between drops and gains until it reached roughly 1.0% at the 8th epoch. Validation recall is 0.6% at the 0th epoch but bounces between dips and gains until it reaches 1.0% at the 8th.
The third graph in Fig. 5 represents the accuracy model. A blue line represents the training accuracy curve, while an orange line shows the validation accuracy curve. Training accuracy started around 0.5% at the 0th epoch and improved to about 1.0% at the 8th. At the 0th epoch, validation accuracy initiated about 0.7% and improved to roughly 1.0% by the 8th. The last graph depicts the loss model. During the training phase, the loss fluctuates at each epoch. The orange line in the loss curve indicates the validation loss, and the blue line is the training loss curve. Training loss initiated from 1.0% at the 0th epoch, after various fluctuations between falls and gains, decreased to 0.2% at the 8th epoch. Validation loss is 0.8% at the 0th; however, it fluctuates between drops and gains until reaching 0.1% loss at the 8th epoch.
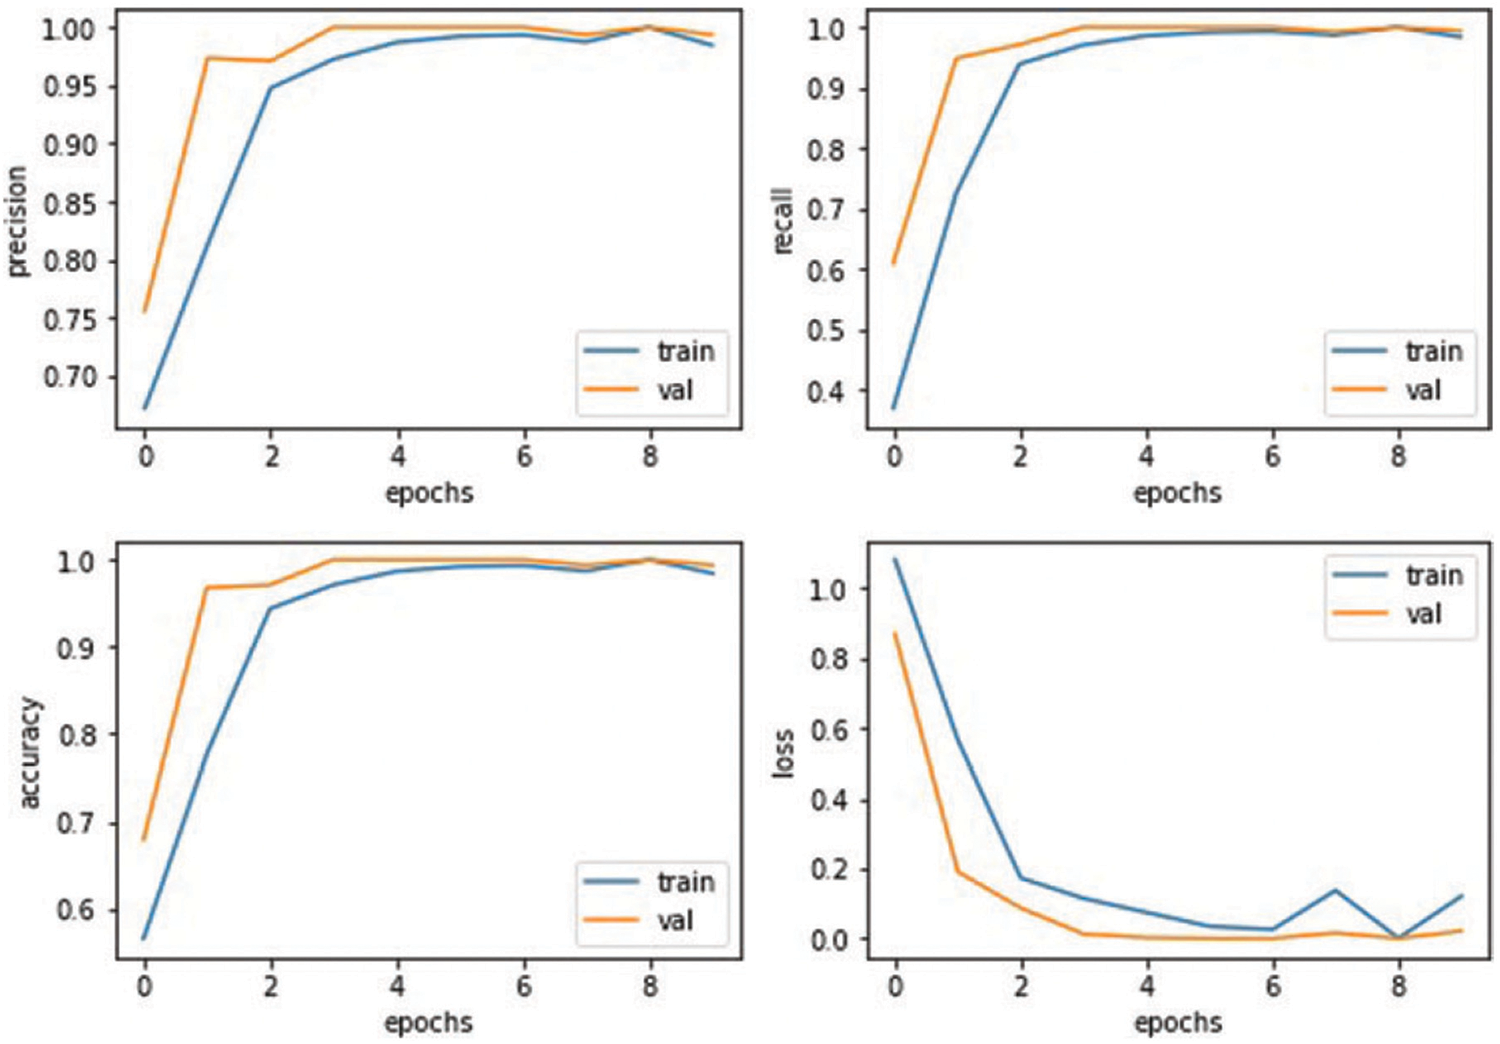
Figure 5: Results based on various evaluation metrics of CNN architecture
Fig. 6 graphically shows the confusion matrix of the proposed approach. For CNN model, it diagnoses kidney disease in four categories: cysts, normal, stone, and tumor. Because it has more continuous, better true positive and negative results and fewer false positive and negative values, the proposed technique performs better.

Figure 6: Confusion matrix of the proposed model
The comparison of the suggested model with existing techniques is presented in Table 4. In [9] researcher provides the outcomes in terms of accuracy 90%. In [36] author gave the result in terms of accuracy of 97.5% and precision of 99%. The provided results clearly show that the suggested model outperforms the existing techniques.

Kidney disease is a severe medical issue that considerably increases mortality risk and morbidity worldwide. Renal failure could result from kidney damage if not regularly diagnosed and treated. Computer-assisted diagnostics are necessary to help clinicians’ and experts’ diagnostic decisions since chronic renal disease is becoming more prevalent, fewer experts are available, and diagnosis and treatment are costly. Several methods have been used in the ML and DL domains of medical image processing in the early phases of disease detection and prediction. This research proposes the deep learning CNN model for classifying kidney disease using NN models after transferring DICOM images into jpg files. Second, the proposed model retrieves the features using a convolutional neural network. The proposed model performs best, obtaining 0.992% accuracy, 0.994% precision, 0.982% recall, and 0.987% F1-score. The findings demonstrate that the proposed approach is more effective in identifying kidney disease, including cysts, tumors, or normal kidney disease. Future research would use a combination of extraction, optimization, and ensemble deep learning models to study the performance of the suggested approach. Additionally, the generalizability of the model will be examined using other datasets.
Updated Content:
Section 4.2, Section 5: The results of the proposed model are provided in Table 3. The CNN model accurately detects kidney illness, either cyst, normal, stone, or tumor, by achieving accuracy of 99.94%, 99.95% precision, 99.92% recall, and 99.94% F1-score. The proposed approach is implemented in a convolutional neural network model. The convolutional neural network’s accuracy, loss, precision, and recall during training and validation are graphically shown in Fig. 5. The first graph represents the precision curves where blue line represents the training precision curve; an orange line represents the validation precision curve. At the 0th epoch, the training precision is 0.65; after various fluctuations between falls and gains, it reached about 0.99 at the 8th epoch. At the 0th epoch, validation precision starts around 0.76; however, it also reaches to around 0.985. The second graph on the right side represents the recall curves. The training recall is 0.3 at the 0th epoch and varied between drops and gains until it reached roughly 0.99 at the 8th epoch. Validation recall start from 0.35 at the 0th epoch and reaches around 1.0.


Figure 5: Results based on various evaluation metrics of CNN architecture.
The third graph in Fig. 5 represents the accuracy curves of the model. Training accuracy started around 0.5 at the 0th epoch and improved to about 1.0 at the 8th. At the 0th epoch, validation accuracy initiated from about 0.65 and improved to around 1.0 by the 8th. The last graph depicts the loss model. During the training phase, the loss fluctuates at most of the epoch. Training loss initiated from 1.0 at the 0th epoch, after various fluctuations between falls and gains, decreased to 0.05 at the 8th epoch. Validation loss is 0.95 at the 0th; however, it fluctuates between drops and gains until reaching 0.1 loss at the 8th epoch.
Fig. 6 graphically shows the confusion matrix of the proposed approach. For CNN model, it diagnoses kidney disease in four categories: cysts, normal, stone, and tumor. Because it has more continuous, better true positive and negative results and fewer false positive and negative values, the proposed technique performs better.
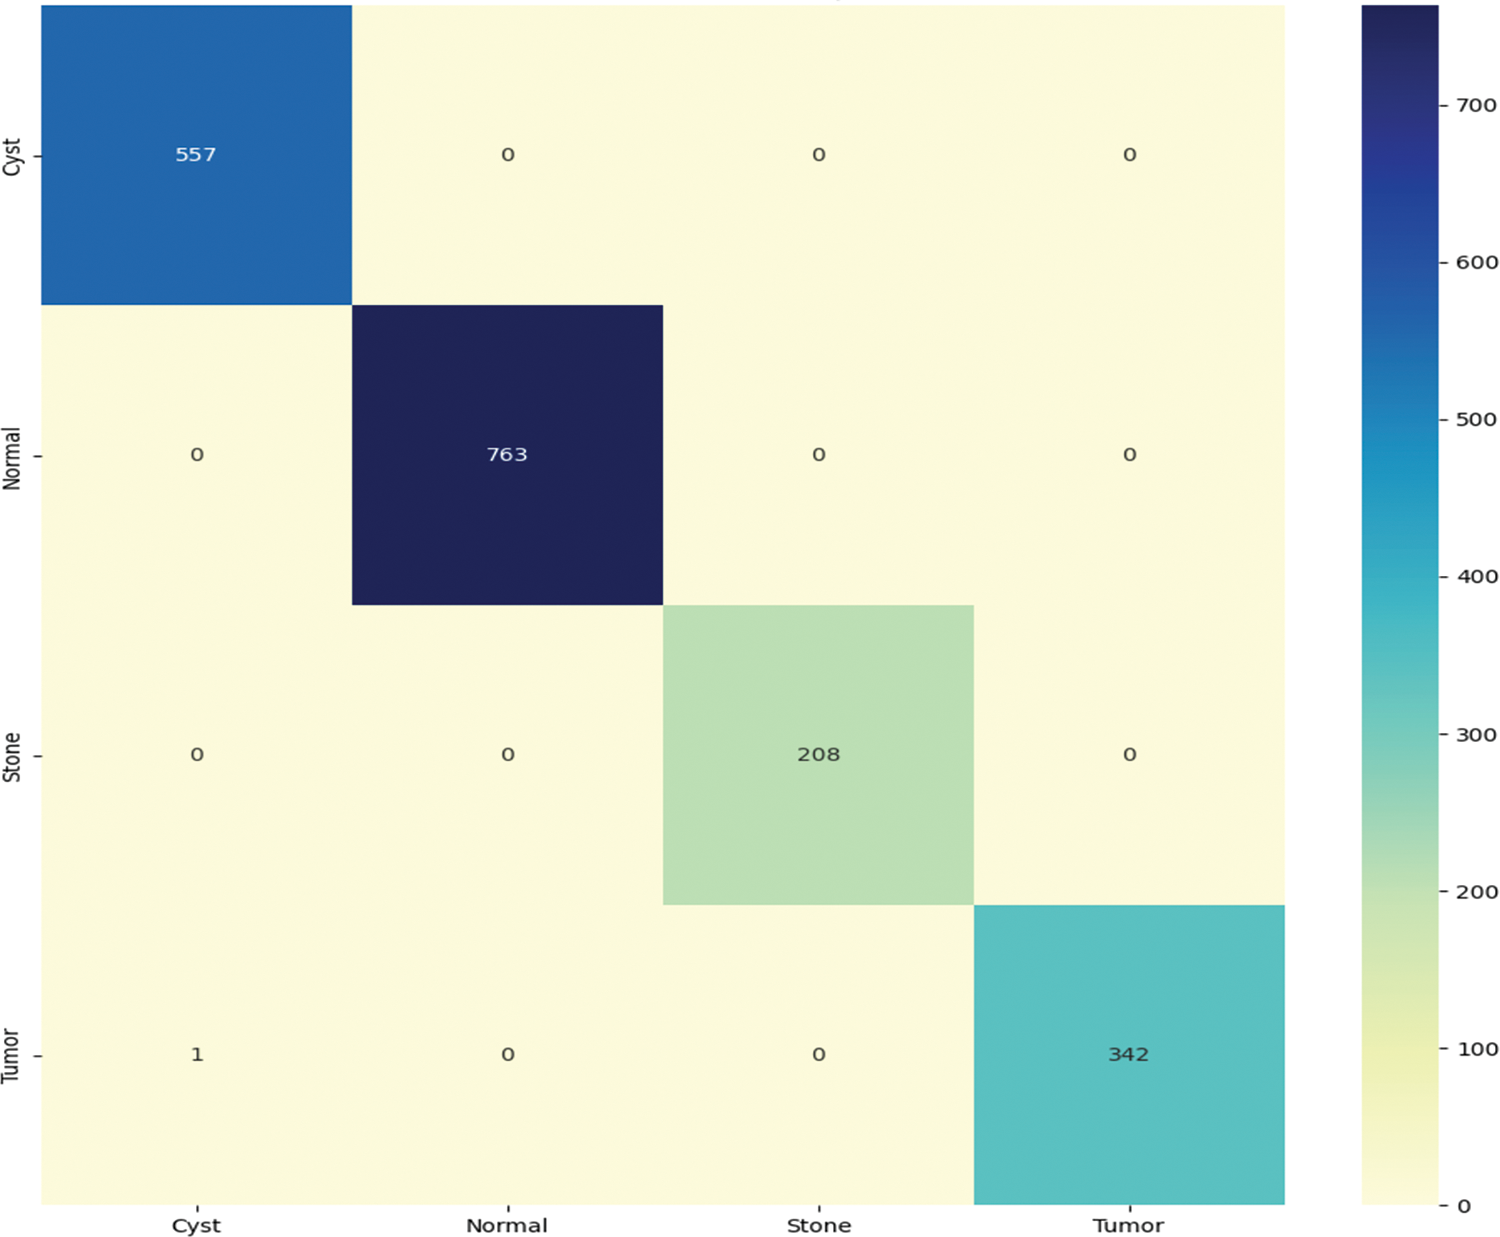
Figure 6: Confusion matrix of the proposed model
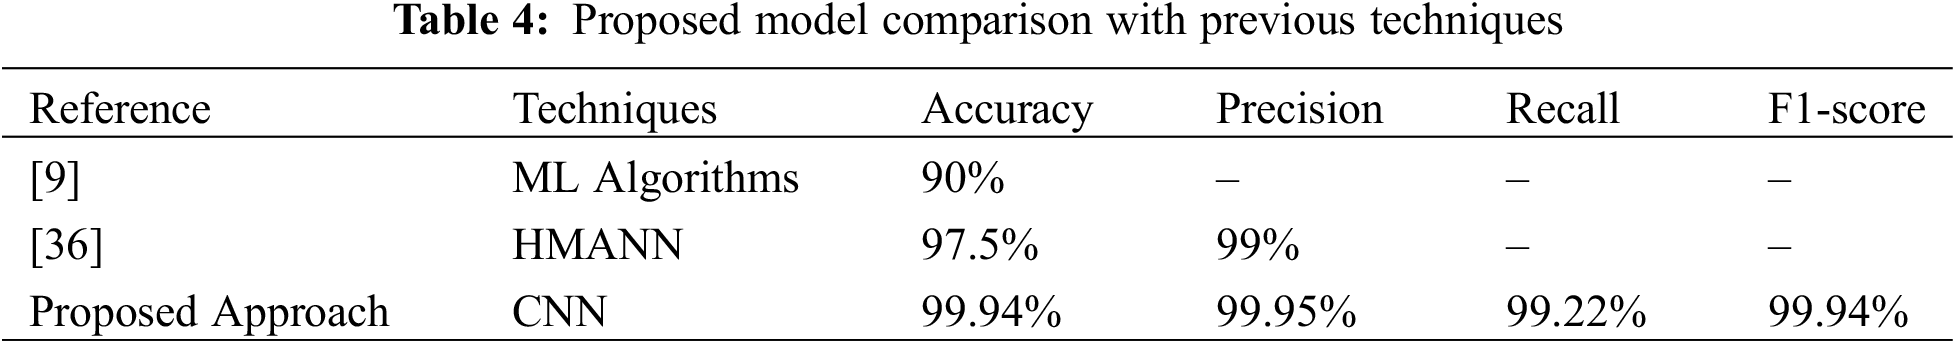
The comparison of the suggested model with existing techniques is presented in Table 4. In [9] researcher provides the outcomes in terms of accuracy 90%. In [36] author gave the result in terms of accuracy of 97.5% and precision of 99%. The provided results clearly show that the suggested model outperforms the existing techniques.
Kidney disease is a severe medical issue that considerably increases mortality risk and morbidity worldwide. Renal failure could result from kidney damage if not regularly diagnosed and treated. Computer-assisted diagnostics are necessary to help clinicians’ and experts’ diagnostic decisions since chronic renal disease is becoming more prevalent, fewer experts are available, and diagnosis and treatment are costly. Several methods have been used in the ML and DL domains of medical image processing in the early phases of disease detection and prediction. This research proposes the deep learning CNN model for classifying kidney disease using NN models after transferring DICOM images into jpg files. Second, the proposed model retrieves the features using a convolutional neural network. The proposed model performs best, obtaining accuracy of 99.94%, 99.95% precision, 99.92% recall, and 99.94% F1-score. The findings demonstrate that the proposed approach is more effective in identifying kidney disease, including cysts, tumors, or normal kidney disease. Future research would use a combination of extraction, optimization, and ensemble deep learning models to study the performance of the suggested approach. Additionally, the generalizability of the model will be examined using other datasets.
The authors state that the scientific conclusions are unaffected. This correction was approved by the Computer Systems Science and Engineering Editorial Office. The original publication has also been updated.
Cite This Article
 Copyright © 2024 The Author(s). Published by Tech Science Press.
This work is licensed under a Creative Commons Attribution 4.0 International License , which permits unrestricted use, distribution, and reproduction in any medium, provided the original work is properly cited.
 Downloads
 Citation Tools