
 Submit a Paper
 Propose a Special lssue
 Open Access
ARTICLE
A Multivariate Relevance Frequency Analysis Based Feature Selection for Classification of Short Text Data
Department of Computing, Coimbatore Institute of Technology, Coimbatore, 641014, India
* Corresponding Author: Saravanan Arumugam. Email:
Computer Systems Science and Engineering 2024, 48(4), 989-1008. https://doi.org/10.32604/csse.2024.051770
Received 14 March 2024; Accepted 07 May 2024; Issue published 17 July 2024
 View Full Text
 Download PDF
Abstract
Text mining presents unique challenges in extracting meaningful information from the vast volumes of digital documents. Traditional filter feature selection methods often fall short in handling the complexities of short text data. To address this issue, this paper presents a novel approach to feature selection in text classification, aiming to overcome challenges posed by high dimensionality and reduced accuracy in the face of increasing digital document volumes. Unlike traditional filter feature selection techniques, the proposed method, Multivariate Relevance Frequency Analysis, offers a tailored solution for diverse text data types. By integrating positive, negative, and dependency relevance computations, the proposed approach effectively prunes features, enhancing classification performance. Extensive experimental analysis has been performed for the proposed model and compared with several standard existing feature selection models on five datasets involving short and long texts using four standard classifiers. The results indicate that the proposed model has the highest macro-F1 score of 94% for the SMS dataset, 78.1% for the SLS dataset, 89.4% for the AYSC dataset, 71.32% for the Reuters dataset, and 98.63% for the 20Newsgroup dataset. The statistical analysis also indicates that the proposed model provides better performance with both short texts such as messages and reviews as well as long texts containing documents, with superior performance for short-text data. The comparative analysis shows that the proposed model offers better performance than many other standard filtration models.Keywords
The internet has become more influential in today’s digital world, due to which the usage of information technologies and communication devices such as smartphones and personal digital assistants has increased considerably [1]. An increase in the use of such technologies also increases digital data, which is in the form of text, audio, video, and images. More specifically, electronic documents in the form of texts, such as web pages, electronic mails, short message services, news feeds, e-books, digital libraries, and social media platforms like Facebook, Twitter, Instagram, blogs, reviews, comments, and so on, are dominating the world. Unlike any other data type, there is an immediate requirement for the automatic processing of text documents to get meaningful information, as it is very difficult to gather useful data manually [2]. As a result, text mining emerged as a solution for extracting information from text data.
To handle a large amount of data, text classification could be used to categorise the data, which makes the process of accessing and searching simpler. Text classification, or text categorisation, is the process of labelling unlabeled text data in the form of documents or messages with predefined labels [3]. Many digital platforms, including e-commerce sites, social media, and online communication, have adopted the categorisation of text data, making it quite popular. Some of the popular applications of text categorisation are automatic content tagging [4], spam detection or spam filtering in emails and short messages [5], sentiment analysis [6], categorisation of documents [7], web pages [8], and more. There are various ways to represent the text document in a format suitable for processing, which can be grouped as static representation, context-based, knowledge-based, probabilistic, and linguistic techniques [9]. Yet the vector space model of static representation has gained huge attention. With the entire text content as a vector space, each word in the text content will be a feature. The value of the features is provided by various term weighting techniques, such as the frequency of occurrence of the words or term frequency-inverted document frequency (TF-IDF) [10]. This method ignores the ordering of the words in the input text and is named the Bag of Words (BoW) approach [11].
The high-dimensional vector space is the most important challenge in categorising text documents. This excessive number of features not only leads to an increase in computational time complexity but also reduces the accuracy of the classification process [12]. One of the solutions is to perform text preprocessing to reduce the number of features. It converts data into a small set of terms, removing stop words and applying stemming to reduce the number of terms in the text corpus [13,14]. Some words are irrelevant or less significant for categorization even after preprocessing. Thus, feature selection (FS) helps find important features by removing irrelevant features, improving accuracy, and reducing training time [15]. Once the significant features relevant to classification are selected, various classifiers can be applied to classify the text. The most common conventional classifiers employed for the text data are support vector machines (SVM), k nearest neighbour (kNN), Naïve Bayes (NB), decision trees (DT), and neural networks (NN) [16].
Generally, four types of FS commonly exist including filter, wrapper, embedded, and hybrid approaches [17]. Simple yet effective, the filter approach uses statistical analysis to compute each feature’s score, selecting the features with the highest scores for the classification process. The wrapper and embedded approaches employ classification algorithms to select the optimal feature subset, while the hybrid approach combines these models for feature selection. Though the wrapper, hybrid, and embedded approaches offer improved accuracy, they suffer from high computational costs, and yet the results are biased by the classification algorithm used. Thus, fast and unbiased filter methods are preferred over other models [18]. The literature anticipates numerous FS models to improve classification accuracy. These methods use complex deep learning and optimisation algorithms, demonstrating impressive performance in text classification tasks. However, most methods require high computational costs and show bias towards the specific classification algorithms. Many statistical methods eventually emerged to overcome these limitations by selecting significant features and improving classification accuracy [19]. Though several models exist for FS in text data, there is still a need to improve the performance of the selection techniques.
To address this research gap, this paper presents a novel filter feature selection (FFS) approach that uses relevance frequency (RF), a term weighting technique, to select features from a text document. Instead of using a simple relevance frequency, a multivariate relevance frequency analysis (MRF-FS) is proposed for feature selection. Initially, the pre-processing is applied to the data, and the features are extracted. The next phase employs novel term weighting with relative term frequencies, which uses term frequency, document frequency, and class frequency to evaluate the feature weights. This step refines the feature set by pruning features with low weights and selecting only features with higher weights, focusing the computational resources on the more relevant terms, thereby improving the overall efficiency. Further, the MRF evaluates the positive significance of terms present in each category’s documents, the negative relevance of terms’ absence, and the dependency relevance of terms’ existence and absence. This holistic assessment enhances feature significance evaluation, potentially selecting more informative text categorisation features. The model is tested on short- and long-text datasets and compared to other conventional models. Though the method uses simple statistical analysis, it offers an improved solution to address the research gap in FS for text classification. Thus, this study contributes to effective FS for classifying short texts. This research primarily makes the following contributions:
• To introduce feature pruning using term weighting that applies relative term frequencies, facilitating the selection of the top k words from each document.
• To propose a multivariate relevance frequency analysis for feature selection that applies positive relevance, negative relevance, and dependency relevance computations.
• To assess the performance of the proposed model by conducting an extensive experiment with four classifiers using various performance metrics.
• To compare the effectiveness of the proposed model statistically with existing standard FFS models and state-of-the-art models.
The organisation of the paper is as follows: Section 2 provides information about the proposed study. Section 3 details the proposed multivariate relevance frequency for feature selection. Section 4 delves into the experimental study, detailing the datasets and performance metrics utilised, analysing the results, comparing them with existing state-of-the-art models, and conducting a statistical analysis. Section 5 concludes the work and outlines potential future enhancements.
The literature suggests several filter approaches to selecting significant features through statistical analysis without the need for classification algorithms. These are considered to be primary choices in many applications as they are simple to implement and require minimal execution time. Document frequency (DF) is a widely used univariate method, while term variance (TV) considers removing terms with low variance, and term strength (TS) evaluates significance based on similar document occurrences [20]. With this as a base, several statistical methods, such as information gain (IG), chi-square (CHI), mutual information (MI), correlation, odd ratio (OR), Gini index (GI), and inverse document frequency (IDF), were proposed to identify the significant features in the text classification. Specifically, IG evaluates the amount of information contributed by the term based on its presence or absence, while CHI evaluates the dependency between the term and the class using the χ2 distribution [21]. The feature score using MI is computed based on the dependency between the term and the class, while the correlation score is computed based on the linear relationship between the term and the specific class [22]. As OR computes the odd ratio of terms in positive class as well as negative class [23], GI estimates the degree of random probability of a term being categorised incorrectly [24], and IDF measures the significance of a term by its common or rare presence in the given corpus.
Based on its probability distribution, entropy evaluates the amount of information a term possesses. Despite the use of numerous statistical models in FS for text documents, research has proven that IG and CHI outperform DF, IG, MI, CHI, and TS. Researchers have enhanced these statistical methods to improve the accuracy of classification. An improved IG that uses error frequency information and a balance factor for FS in text classification was proposed [25]. An improved GI model was proposed that can reduce the dimensions locally and globally [26]. Laplacian Score (LS) was used to assess the feature that specifies its local conserving power [27]. Instead, to improve efficiency, these statistical models were often combined with soft computing methods like ant colony optimisation (ACO), genetic algorithm (GA), and so on [28].
The relative discrimination criterion (RDC) is an approach that computes a term’s importance by comparing its document frequencies in a specific class to others, thereby identifying its discrimination capability [29]. The multivariate relative discrimination criterion (MRDC) is better than the RDC method because it takes into account both duplicate and relevant features while classifying the data [30]. Distinguishing feature selector (DFS) and minimal-redundancy-maximal-relevance (mRMR) filter approaches estimate class discrimination capability and minimise redundancy, while normalised difference measure (NDM) uses balanced accuracy but may not be suitable for imbalanced datasets [31]. The proportional rough feature selector (PRFS) utilises rough set theory to classify regions as positive, negative, or boundary based on document classification terms [32]. The comprehensively measured FS (CMFS), a local FS method, uses maximum and weighted sum approaches to calculate feature relevance in globalisation processes [33]. Researchers proposed a new inherent distinguishing feature selector (IDFS) that can select informative features in unbalanced datasets and assign higher scores to negative features [34].
Two other metrics specifically used for FS are Acc and Acc2, which utilise local policy. To perform the FS, Acc evaluates the positive and negative information of the terms, whereas Acc2 computes the average Acc values. The detailed explanations for the two methods were discussed by Şahin and Kılıç. The relevance frequency FS (RFFS) model utilises both RF and DF approaches for effective FS. Furthermore, existing studies have reported that traditional methods for sparse and ambiguous short texts are effective but require refinement because they frequently fail with context-relevant elements [35]. Researchers also proposed prompt learning [36] and transfer learning [37] for short-text classification. However, it is difficult to parallelize and process word sequences using deep learning methods. Another study improved short text categorisation by adding reviewers’ mental traits and fine-tuning the Bert model at the language level [38].
More recently, an analytical study assessed a heterogeneous ensemble model for text classification, combining features from local and global selection methods, using OR and discriminative feature selector (DFSS) as local methods and DFS and NDM as global methods, and proved that the ensemble models enhance performance [39]. The author extended their work by introducing a new method, feature- and class-based weighted sum (FCWS), considering both class and feature information [40]. The method was tested using the DFSS, OR, and CHI methods and proved to be effective with the DFSS and CHI methods. Researchers proposed an extensive feature selector (EFS) that utilizes corpus-based and class-based probabilities for FS, demonstrating its superior effectiveness over other filter-based techniques [41]. The brilliant probabilistic feature selector (BPFS), a novel filter-based FS method, assigns fair scores to unique and sparse features in order to select informative features and has proven to be more successful than other models [42]. Despite the literature proposing several methods for text classification, FS remains an ongoing research topic due to the need for effective models to classify the ever-increasing volume of digital documents. Many of these methods have some limitations due to class imbalance, computational complexity, low performance, and classification bias. Improving classification accuracy and reducing time complexity in the FS process are the primary issues to address in such models.
Relevance frequency (RF) was originally proposed for computing weights for the terms in the process of text classification. Like other popular term-weighting measures such as IG, CHI, MI, and TF-IDF, RF has also been used in the process of FS and has proven to be effective in its performance. In this paper, an FFS method is proposed that makes use of the idea of MRF in the selection of text features. Fig. 1 presents the overall concept of the proposed MRF analysis, an FFS method for text classification. The proposed approach is divided into four phases: 1) feature extraction through preprocessing; 2) feature pruning using relative term frequency-based term weighting; 3) MRF analysis-based FS; and 4) text classification and evaluation.
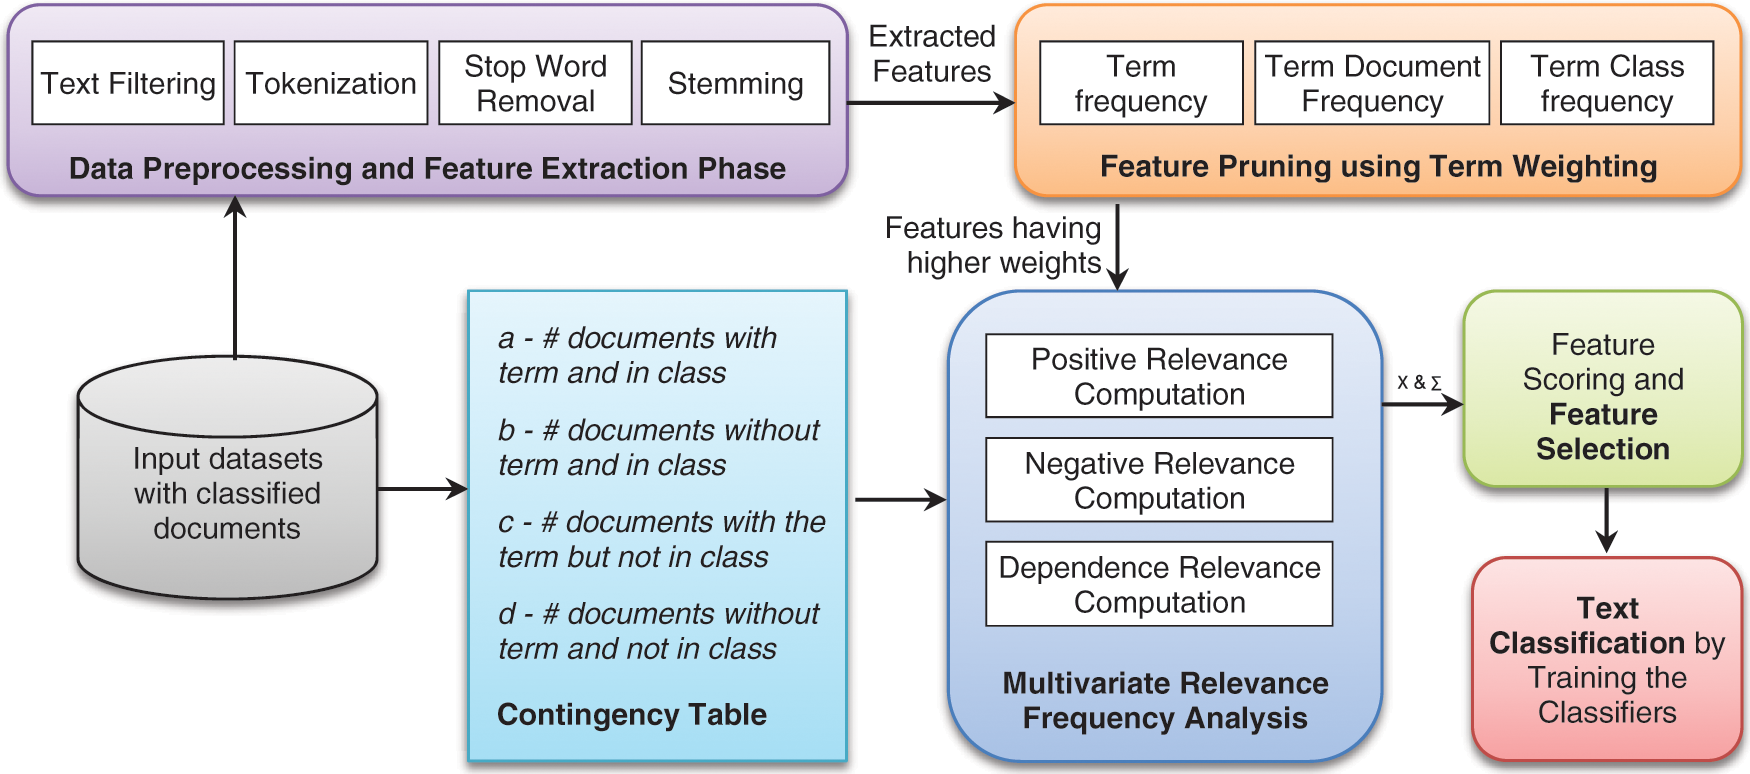
Figure 1: The proposed feature selection framework
3.1 Data Preprocessing and Feature Extraction Phase
The given input data, in the form of text content, must be transformed into a data structure in the form of a vector representation for further processing. Here, the text must undergo a sequence of preprocessing steps that transform the given input data into a suitable structure. BoW is a commonly used method for text data, where each term in a document is denoted by its frequency without considering grammar or order. The document contains thousands of terms, but not all of them are significant for knowledge extraction, so the terms are preprocessed. The most common steps are stop word removal, stemming, and tokenization [43]. In the proposed model, text filtering, tokenization, stop word removal, and stemming, are used to preprocess the data. The various preprocessing steps in the feature extraction phase are listed below:
• Text filtering: It removes data types like images, numbers, symbols (@, #, $, %, *), and other tags and converts the uppercase to lowercase letters, resulting in plain text [44].
• Tokenization: This process divides the text stream into meaningful terms or elements. This set of tokens will be the input for the next preprocessing step.
• Stop word removal: Removing stop words from tokens, such as articles, prepositions, connectors, and pronouns, significantly reduces processing time for various features.
• Stemming: This step reduces the term to its root form by removing the suffixes (the terms controlling to control, making to mak). The proposed model employs the Porter stemmer algorithm to decrease the distinct terms in the corpus, thereby enhancing processing speed.
3.2 Feature Pruning with Term Weighting
Even after the preprocessing phase, processing a large number of features will demand more computational resources. The proposed model reduces complexity by computing term weights and selecting the terms with the highest scores for further analysis. Therefore, the top k words from each document are selected using a simple statistical proportion, incorporating conventional metrics like TF and TDF, which indicate the term’s significance within the document, corpus, and class. However, it uses the term class frequency (TCF) as a normalisation technique to effectively optimise the weights. Eq. (1) provides the formula to compute the term weighting.
Here
The TF for a term t in the document d can be computed as the ratio of
The TDF representation for a term t in the document corpus D can be computed as the ratio of
The TCF representation for a term t in class C can be computed as the ratio of
Normally, the terms that occur in only one class have a minimum number of term frequencies and document frequencies. Conversely, unique terms within a class may have low term weighting, which could potentially hinder their selection as significant for further processing. Also, common terms in documents from different classes are high in frequency, but this does not help in classification. Thus, TCF is a more effective method for normalising term weighting based on its significance in different class groups, optimising term scores appropriately.
3.3 Multivariate Relevance Frequency (MRF) Analysis
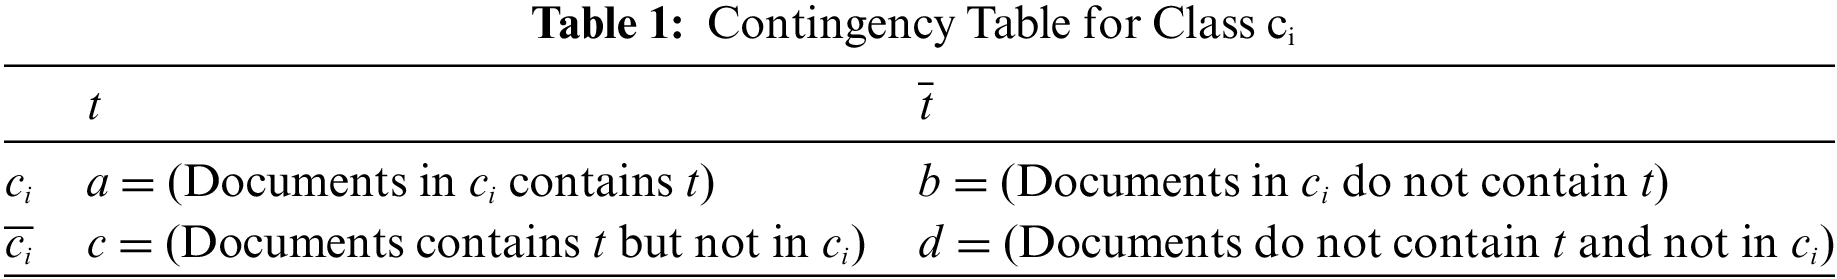
The proposed method requires understanding four significant variables related to terms and categories, also known as contingency table elements, as shown in Table 1 [1]. The variable a represents the number of documents that contain the term tj and belong to ith class ci. This can be represented in a set language as
3.3.1 Positive Relevance Frequency (PRF)
The PRF analysis evaluates the documents containing the terms that belong to and do not belong to a target class. More precisely, the positive relevance score for each class is assessed in such a way that the score will be higher when the term is present in a majority of documents in class ci than in other classes. The formula to compute the PRF is given in Eq. (5) [1].
Here, max(1, c) is included, which uses 1 when the value of c is 0, to prevent division errors caused by c = 0. However, when a is 1, the logarithmic operator may produce 0 and so the constant 2 is introduced. Thus, if the term tj more frequently appears in a class ci (a would be higher) or is seen rarely outside the class ci (c would be lower), the positive feature score of tj will be high. Conversely, if a term tj is seen rarely in class ci (a would be lower) or is seen frequently outside the class ci (c would be higher), the positive relevance score of tj will become low concerning the class.
3.3.2 Negative Relevance Frequency (NRF)
NRF analysis, unlike PRF analysis, evaluates documents in the absence of a specific term that belongs to or does not belong to a target class. The negative relevance score for each class is evaluated in such a way that the score will be higher in the absence of term tj in a minority of the documents in class ci than in other classes. Eq. (6) provides the formula to compute the NRF.
Thus, if the term tj does not appear in a majority of the documents outside the class ci (the d value will be higher) or does not appear in a minority of the documents within the class ci (the b value will be lower), the negative relevance score of tj will be high concerning the class ci. Instead, if a term tj does not appear in the minimum documents outside the class ci (the d value will be lower) or does not appear in the majority of the documents inside the class ci (the b value will be higher), then the negative relevance score of tj will become low with respect to the class.
3.3.3 Dependency Relevance Frequency (DRF)
The DRF analysis combines both PRF and NRF to provide more accurate values. For text classification to be effective, the term must be frequently present in the specific class but not outside of it. This indicates that the variables a and d must be high. On the other hand, the number of documents that do not contain the term in a specific class and the number of documents containing the term outside the class must be the minimum for effective text classification. Thus, the DRF utilises all the variables a, b, c, and d to compute the scores, and the formula is given in Eq. (7).
Thus, consider the term tj, which appears in the majority of the documents within the class ci but not in the majority of the documents outside the class ci (a, d will be higher), or the term tj, which does not appear in the minority of the documents within the class but appears in a minority of documents outside the class (b, c values will be lower). This indicates that the dependency relevance score of tj will be high concerning the target class ci. Conversely, if the term tj appears in a minority of the documents within the class ci but not in a minority of the documents outside the class (a, d values will be lower), or if the term tj does not appear in a significant number of documents within the class but appears in a significant number of documents outside the class (b, c values will be higher), then the dependency relevance score of tj specific to class ci will be low.
Once the PRF, NRF, and DRF are evaluated, the final feature scoring can be computed by summing the product of the positive relevance score, negative relevance score, and dependency relevance score of a term with respect to all the classes. The formula is given in Eq. (8).
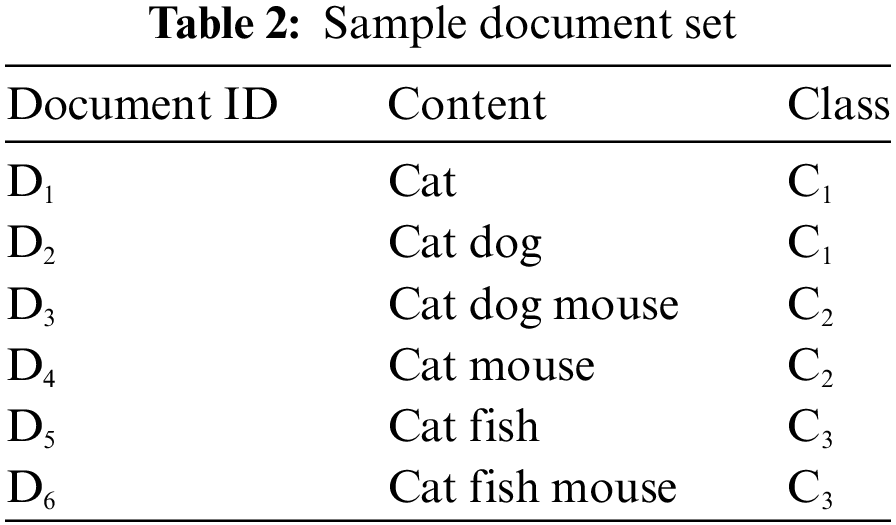
Here n is the number of classes in the dataset, and so i varies from 1 to n, indicating c1, c2, …, cn. The product of all the relevance frequencies obtained for the terms for each class is summed together to obtain the final result. For illustration, consider the sample set of documents containing the terms cat, dog, mouse, and fish, as given in Table 2. In this example, the term cat is present in all the documents {D1, D2, D3, D4, D5, D6}, irrespective of the classes {C1, C2, C3}. Thus, it may not be effective in the classification process. On the other hand, the term fish is available in the documents {D5, D6} that belong to class C3, and so it is effective in classifying the documents in class C3. Table 3 presents the detailed computation of the proposed model.
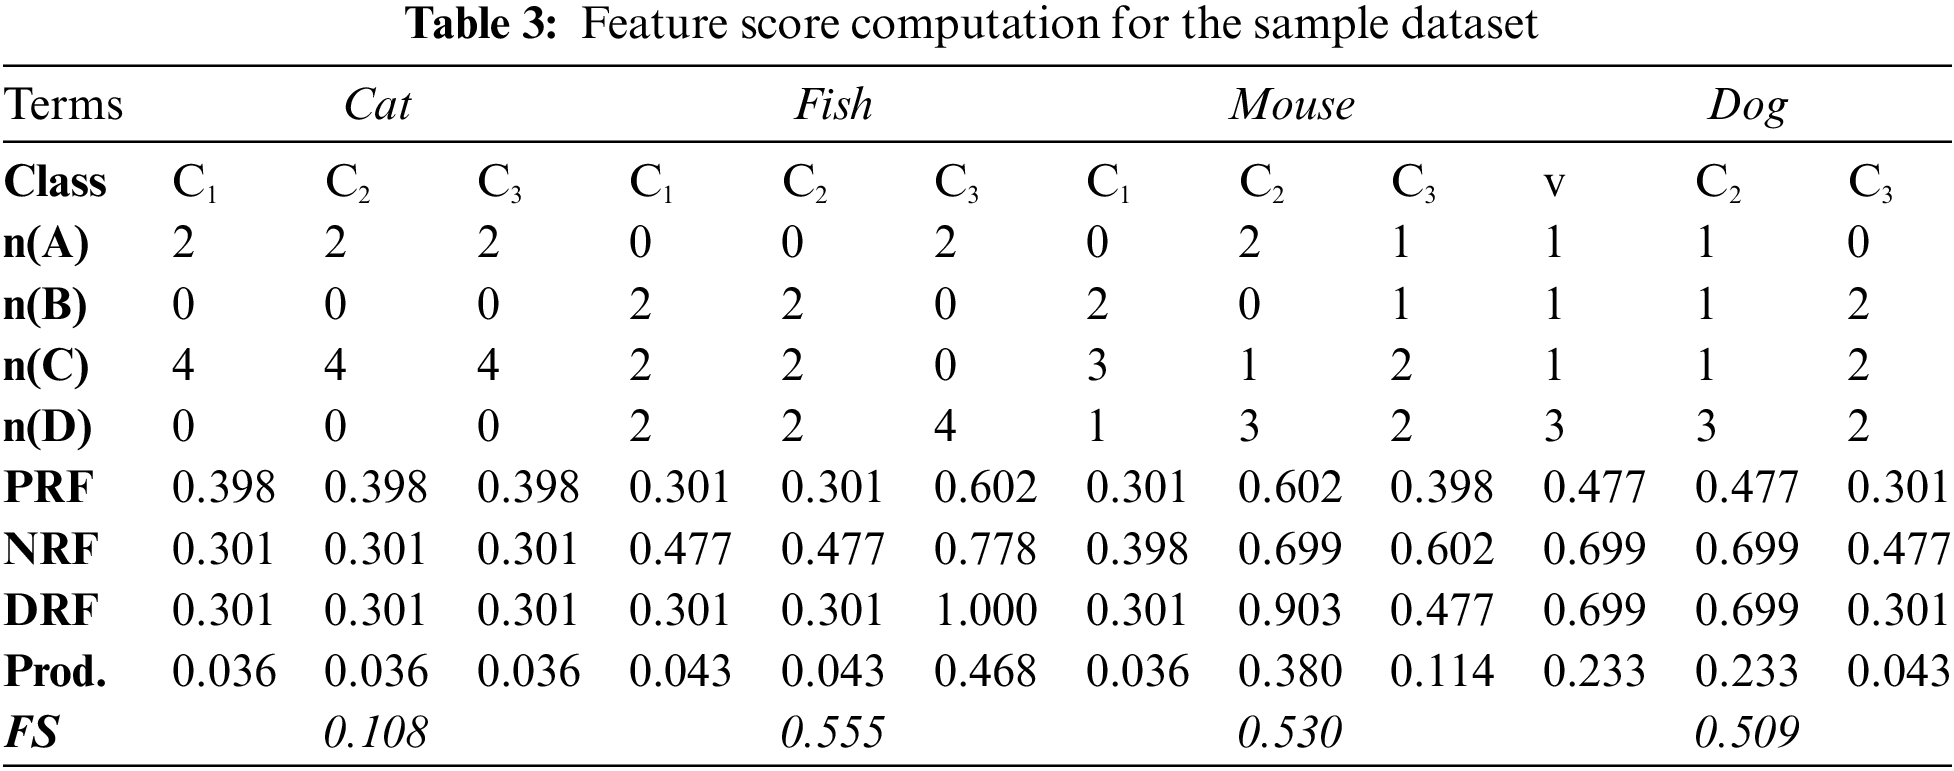
From the analysis, it is clear that fish has the highest score of 0.555, which helps to distinguish class C3 from other classes. Thus, all the documents containing fish could be classified as C3. The mouse has the next highest score, with 0.53, as the terms are contained in all two documents {D3, D4} in class C2 and D6 in class C3. Also, the term cat has the lowest score of 0.108, because it appears uniformly across all categories, lacking discriminatory power for document classification.
Text classification assigns text data to predefined categories using natural language processing and machine learning, which is challenging because of the unstructured format. Relevant features, missing data, and classification algorithms influence classification accuracy, which is crucial in analysing process performance. Selecting the significant feature greatly helps to improve the prediction accuracy. Despite the availability of numerous classification algorithms in machine learning, only a few algorithms find widespread use in text classification. The literature more frequently uses classifiers like SVM, DT, kNN, and NB for text categorisation [42]. Thus, the study evaluates the performance of a proposed FS algorithm using linear SVM, DT, multinominal NB, and kNN classification algorithms, comparing it with existing filter models.
The implementation of the proposed feature selection is carried out using Python on a machine equipped with an Intel Pentium CPU (6405 U, 2.40 GHz) and 8 GB of RAM, running the 64-bit Windows 10 operating system. The text preprocessing steps, such as converting text to lowercase, removing non-text elements, tokenization, stop word removal, and stemming using Porter stemmer algorithms, are performed using the NLTK library. The proposed metric is then applied to select features, varying the feature size from 20 to 1000, and the results are recorded. For classification, the Weka tool, a popular open-source software written in Java, is utilised [1]. Specifically, SVM is implemented using LibSVM, DT using J48, NB, and kNN with k value 5 are evaluated by selecting the best parameters through grid search functionality, and the results are recorded for evaluation.
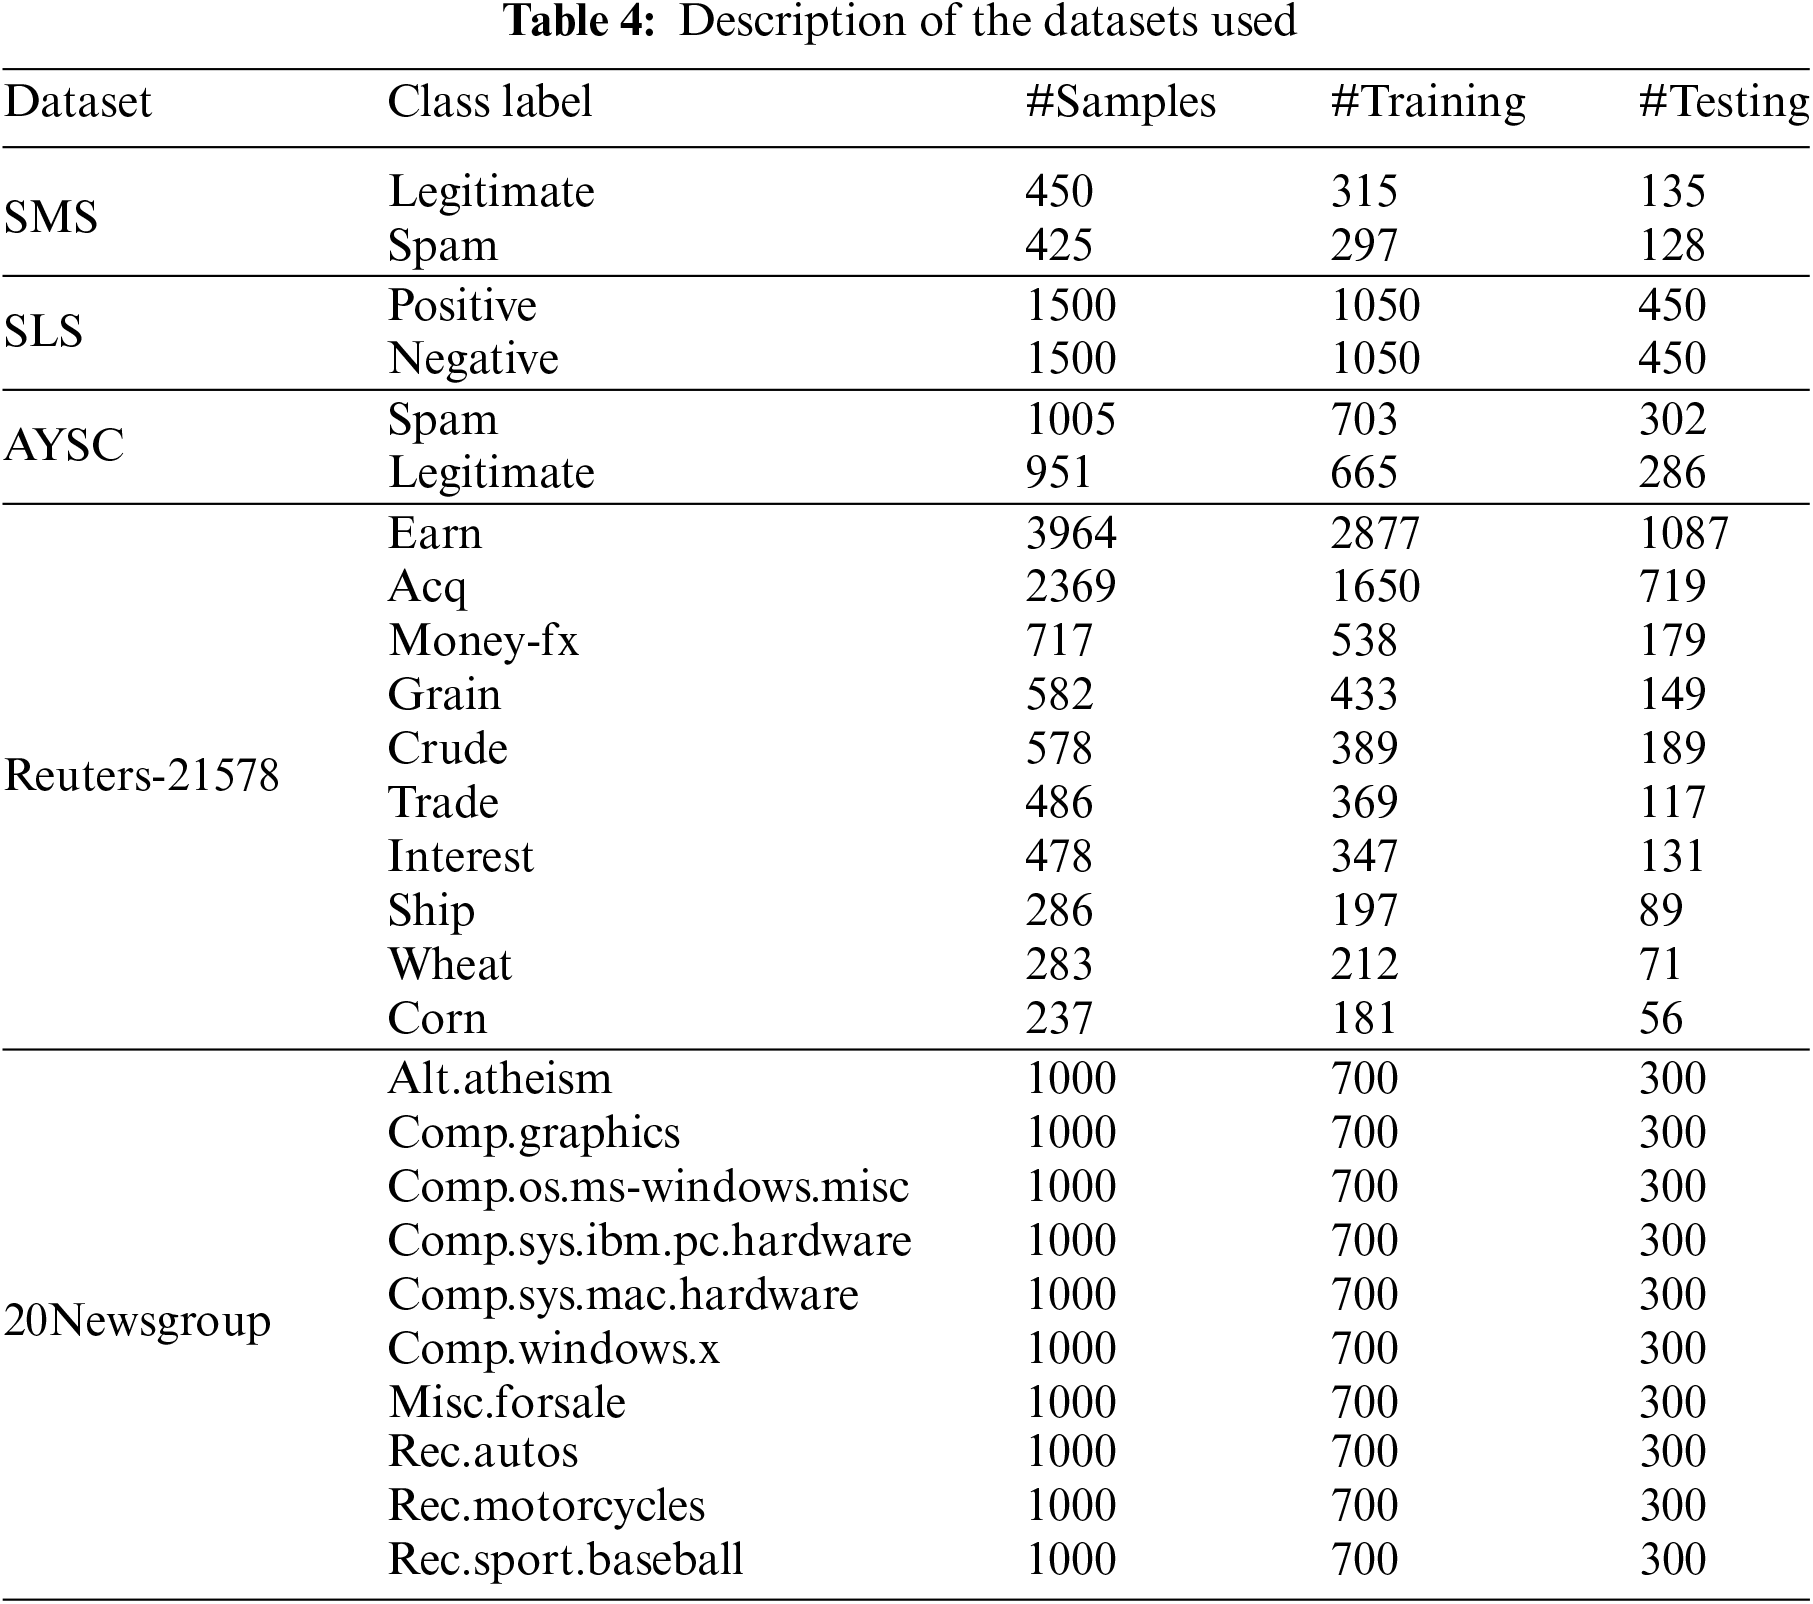
To evaluate the performance of the proposed MRF-FS, five different datasets are used in which first three are short text datasets and other two are long text datasets [2]. These datasets are downloaded from various data repositories, such as UCI machine learning and GitHub. The first dataset is the Short Message Service (SMS) dataset, which comprises 875 English text messages classified as spam and legitimate [45]. The second is the Sentiment Labelled Sentences (SLS), involving 3000 sentences of positive and negative comments about the product, hotel, and film extracted from websites [46]. The third dataset is the All YouTube Spam Collection (AYSC), which extracts 1956 reviews or user comments from 5 YouTube videos classified as legitimate and spam [47]. The other two datasets are Reuters-21578 and 20Newsgroup. The unbalanced Reuters-21578 dataset comprises 21,578 news articles, arranged into 135 classes [31]. The 20Newsgroup dataset is a balanced collection of 20,000 documents grouped into 20 categories [20]. For the study, the top 10 classes of the Reuters-21578 and 20Newsgroup datasets were selected. Table 4 presents the summary of the datasets used in the study.
To evaluate the performance of any classification model, precision (P), recall (R) and F1-measure (F1) are most widely used. In addition to these three metrics, text classification also employs macro-F1. Precision is the ratio of correct positive predictions to the total positive predictions that includes both correct and incorrect positive predictions, and the average score across all classes is the overall precision. The ratio of correct positive predictions to positive documents identified properly or erroneously is recall, and the average recall across all classes is the overall recall. Micro-F1 is the harmonic mean of precision and recall values for all classes, making it better suited for balanced datasets. Macro-F1 is the average of the F1-measure for each class with equal weights, making it better for imbalanced datasets. Eqs. (9)–(12) present the formulas for computing precision, recall, micro-F1, and macro-F1. Here c represents the number of classes and
4.3.1 Analysis with Short-Text Datasets
Initially, the three datasets with binary classes, such as SMS, SLS, and AYSC with the number of features 1825, 3078, and 2380, respectively, are used to analyse the performance of the proposed model. More specifically, the performance of the proposed MRF-FS model is compared with other models such as DFS, MMR, IG, GI, NDM, and PRFS using SVM, kNN, DT, and NB classifiers by varying the feature size. Since all three short-text datasets used here are unbalanced, macro-F1 is a fair choice. Thus, the macro-F1 values are recorded for each FS method for all four classifiers by selecting the top-ranked 10, 20, 50, 200, 500, and 1500 features. Tables 5–7 present the experimental results, with bold values highlighting the models with the highest scores.
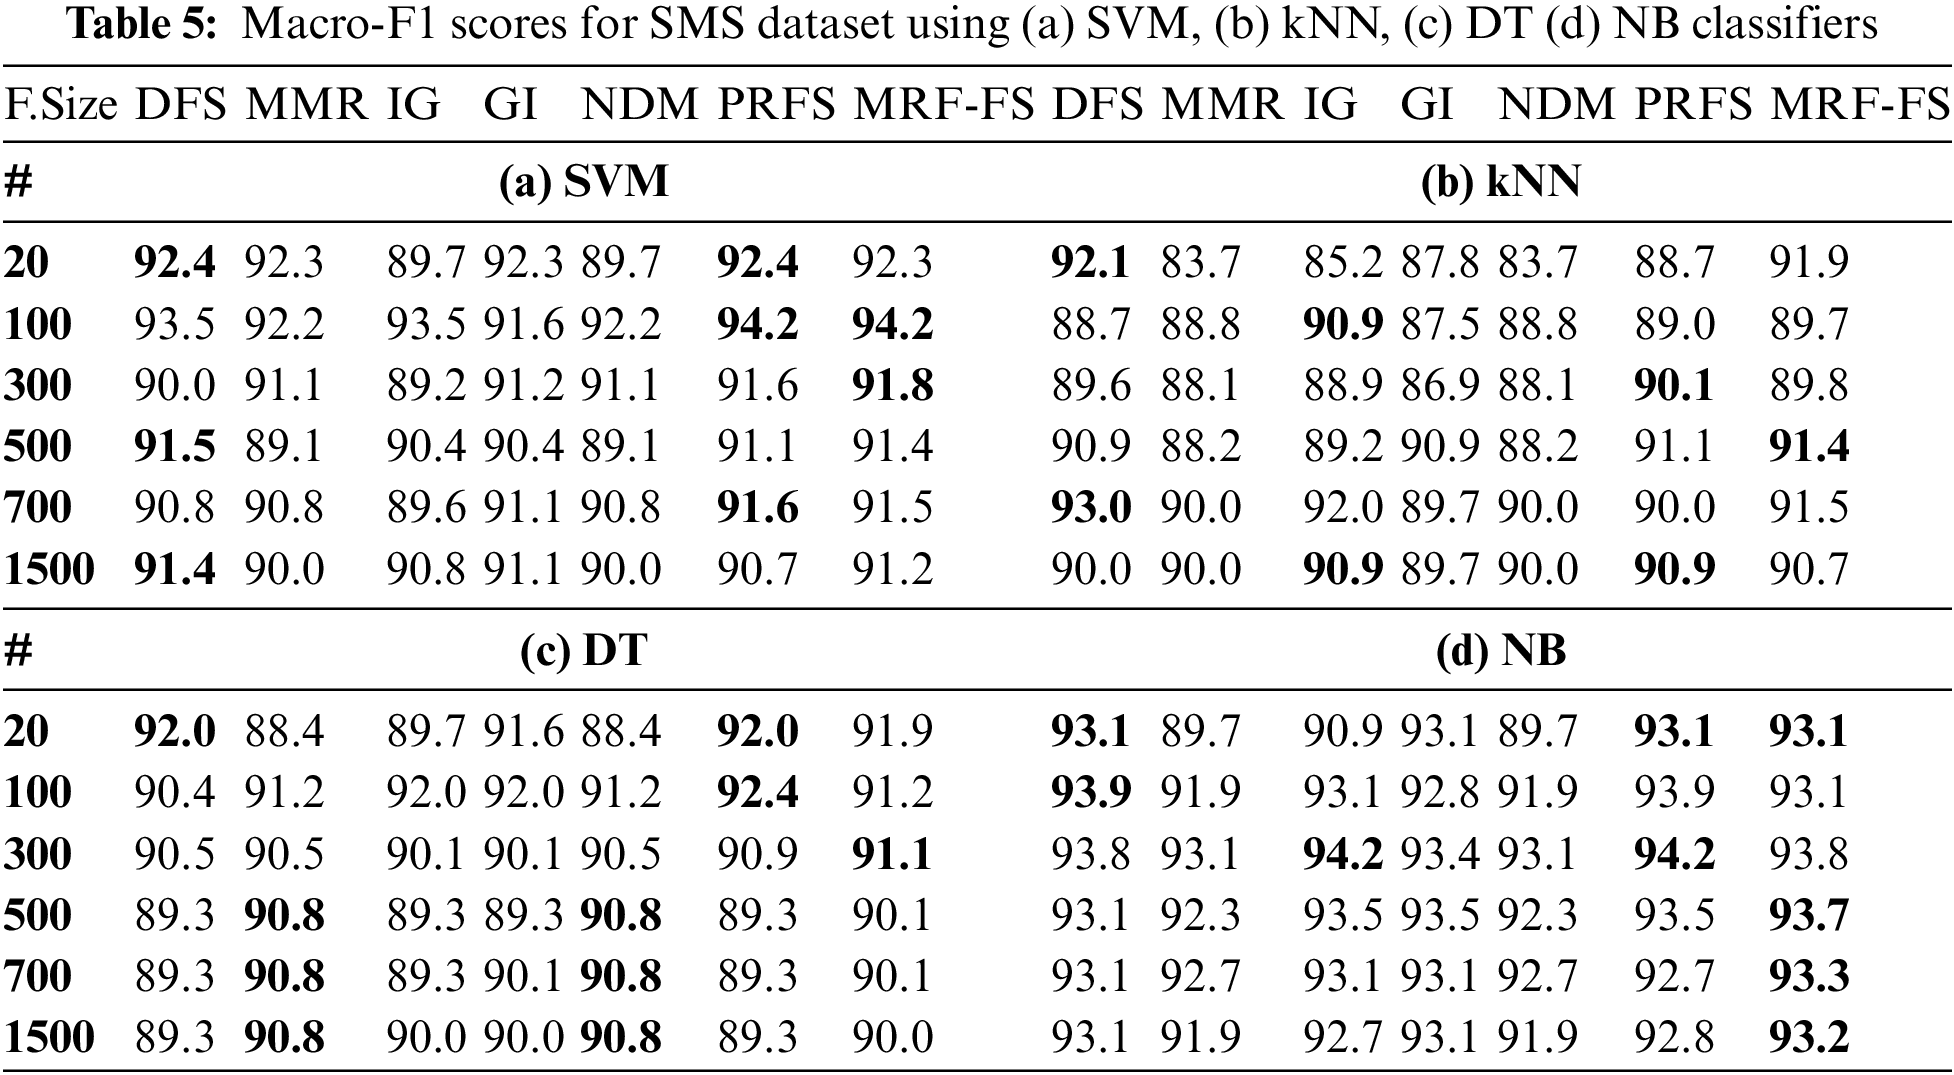
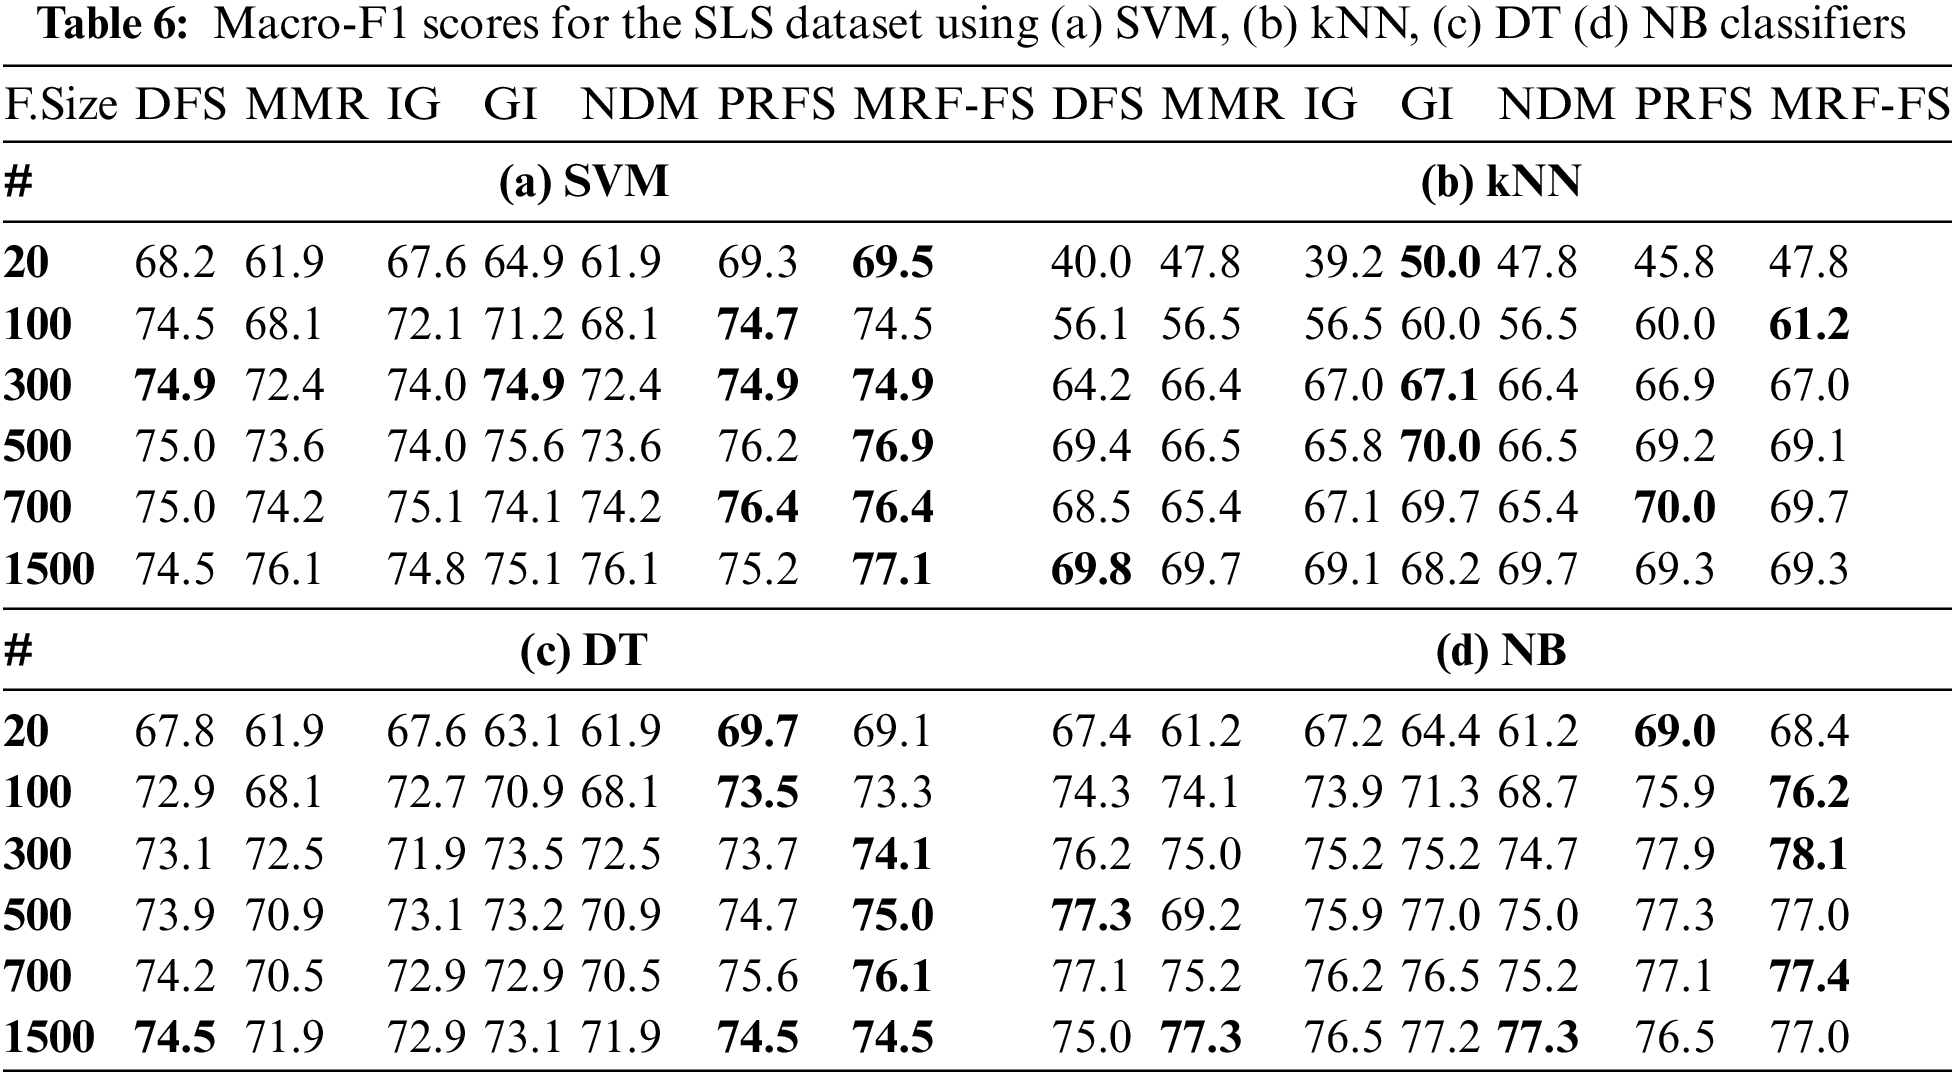
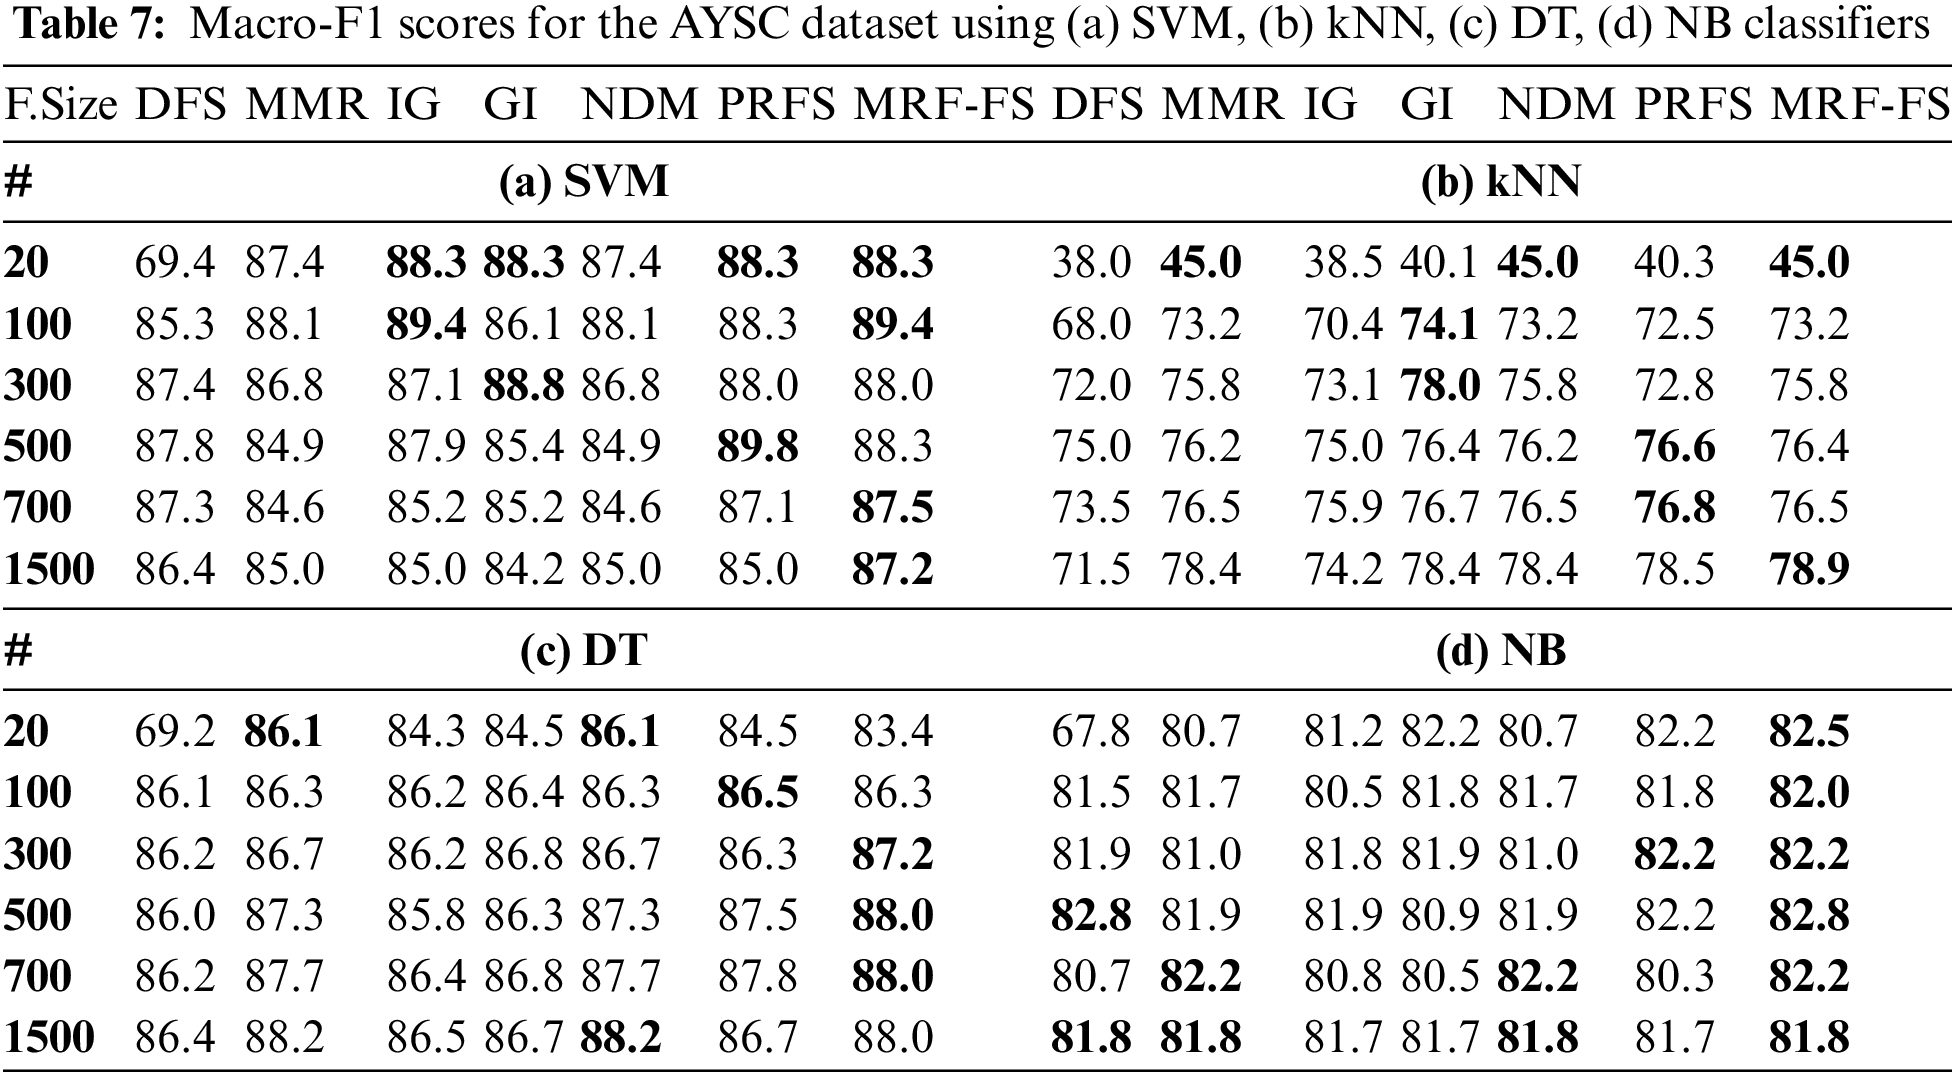
The analysis reveals that the proposed model outperforms the other six models. More precisely, it offers the macro-F1 between 89.7% and 94.2% for the SMS dataset, between 61.2% and 78.1% for the SLS dataset, and between 73.2% and 89.4% for the AYSC dataset. Though the MRF-FS model offers the highest performance for 36 cases out of 72 experiments, it has the highest scores for 8 cases for the SMS dataset, 13 cases for the SLS dataset, and 15 cases for the AYSC dataset among the 24 experiments performed on each dataset considering all the classifiers.
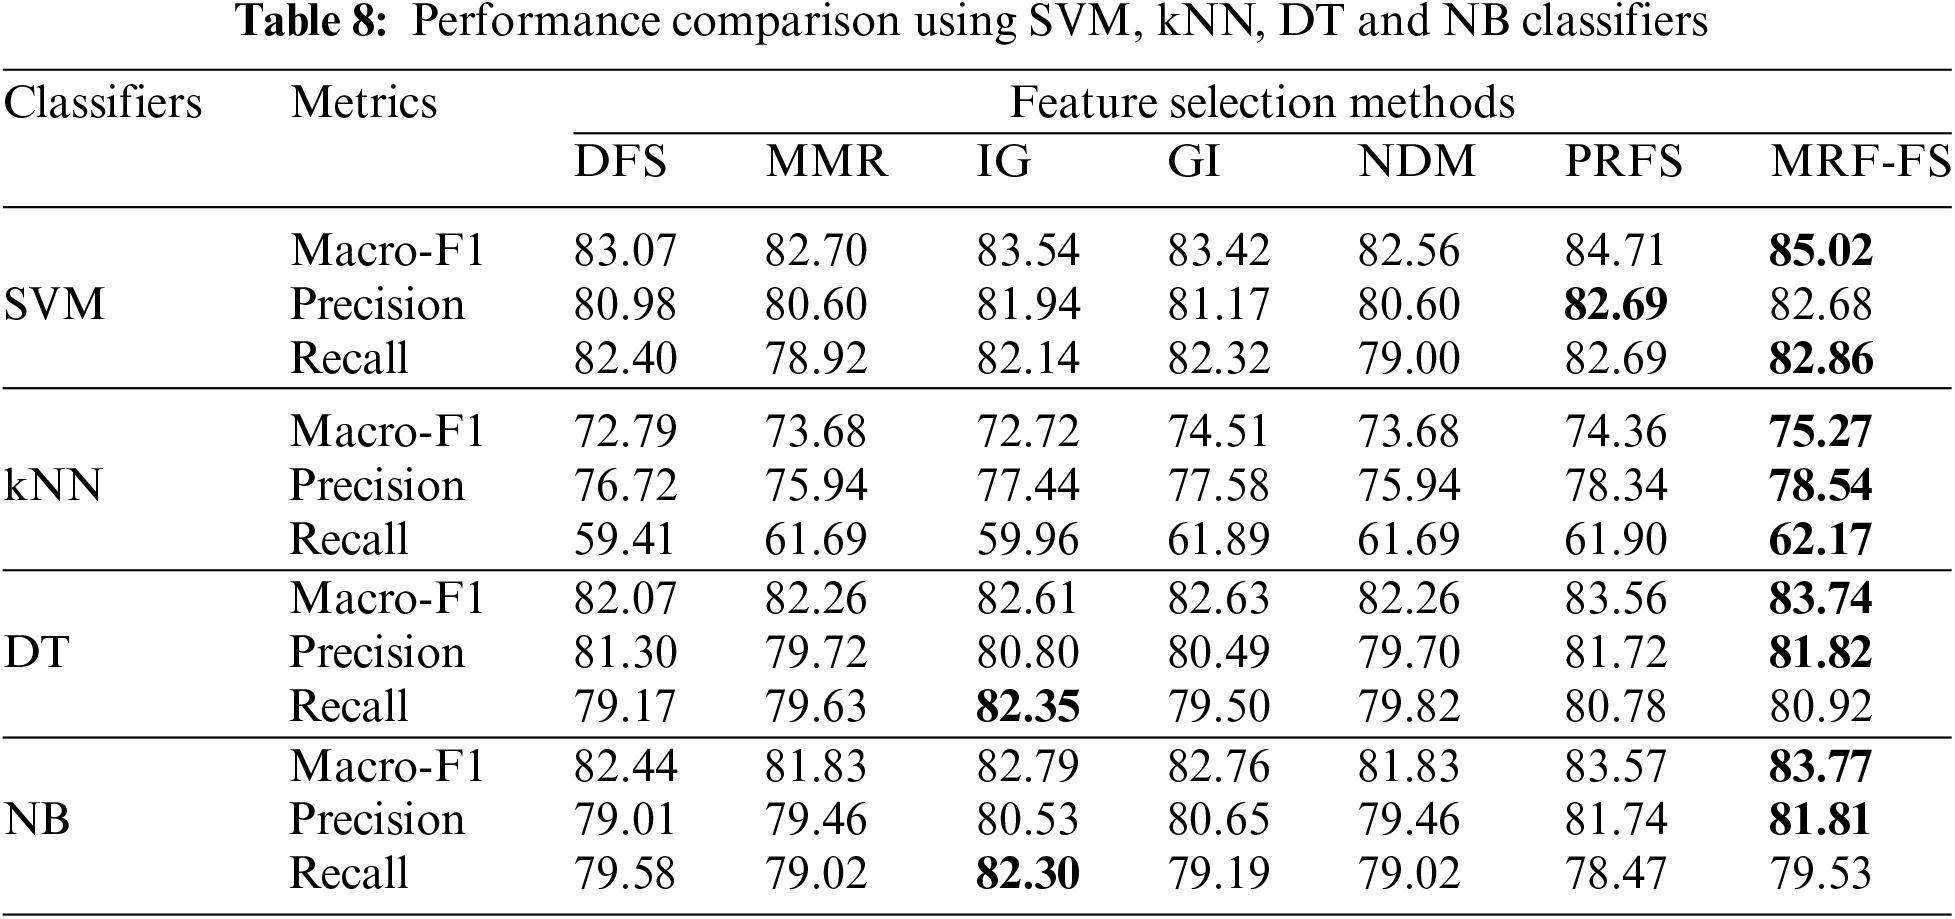
Moreover, Table 8 presents the results, highlighting the highest values with bold letters, and compares the average precision, recall, and macro-F1 values for all feature sizes, including 10, 20, 50, 200, 500, and 1500 features, with the three datasets (SMS, SLS, and AYSC). From the obtained mean values, the proposed method offers better results than other models. Specifically, the highest macro-F1 score is obtained for all the classifiers, whereas the highest precision is obtained for kNN, DT, and NB classifiers, and the highest recall is obtained for SVM and kNN classifiers. The overall results indicate that MRF-FS offers optimum results.
4.3.2 Analysis with Long-Text Datasets
Furthermore, DT, SVM, and MNB classifiers are also used to classify feature subsets of varying sizes, including 20, 50, 100, 200, 500, and 1000 features, from the total features of 16,867 and 50,419 for the Reuters-21578, 20Newsgroup datasets, respectively. The macro-F1 and micro-F1 scores are computed for the analysis, and the results of the proposed methods are compared with the various existing state-of-the-art models as reported [42]. The results are demonstrated in Table 9 for the Reuters dataset and Table 10 for the 20Newsgroup dataset, with bold values indicating the highest scores among all the models used in the comparative analysis for each classifier and underlined values representing the highest scores among all the classifiers. The results indicate that there is no single effective method for all feature sizes across the two datasets. However, the proposed MRF-FS method shows significantly more efficient performance than the other models.
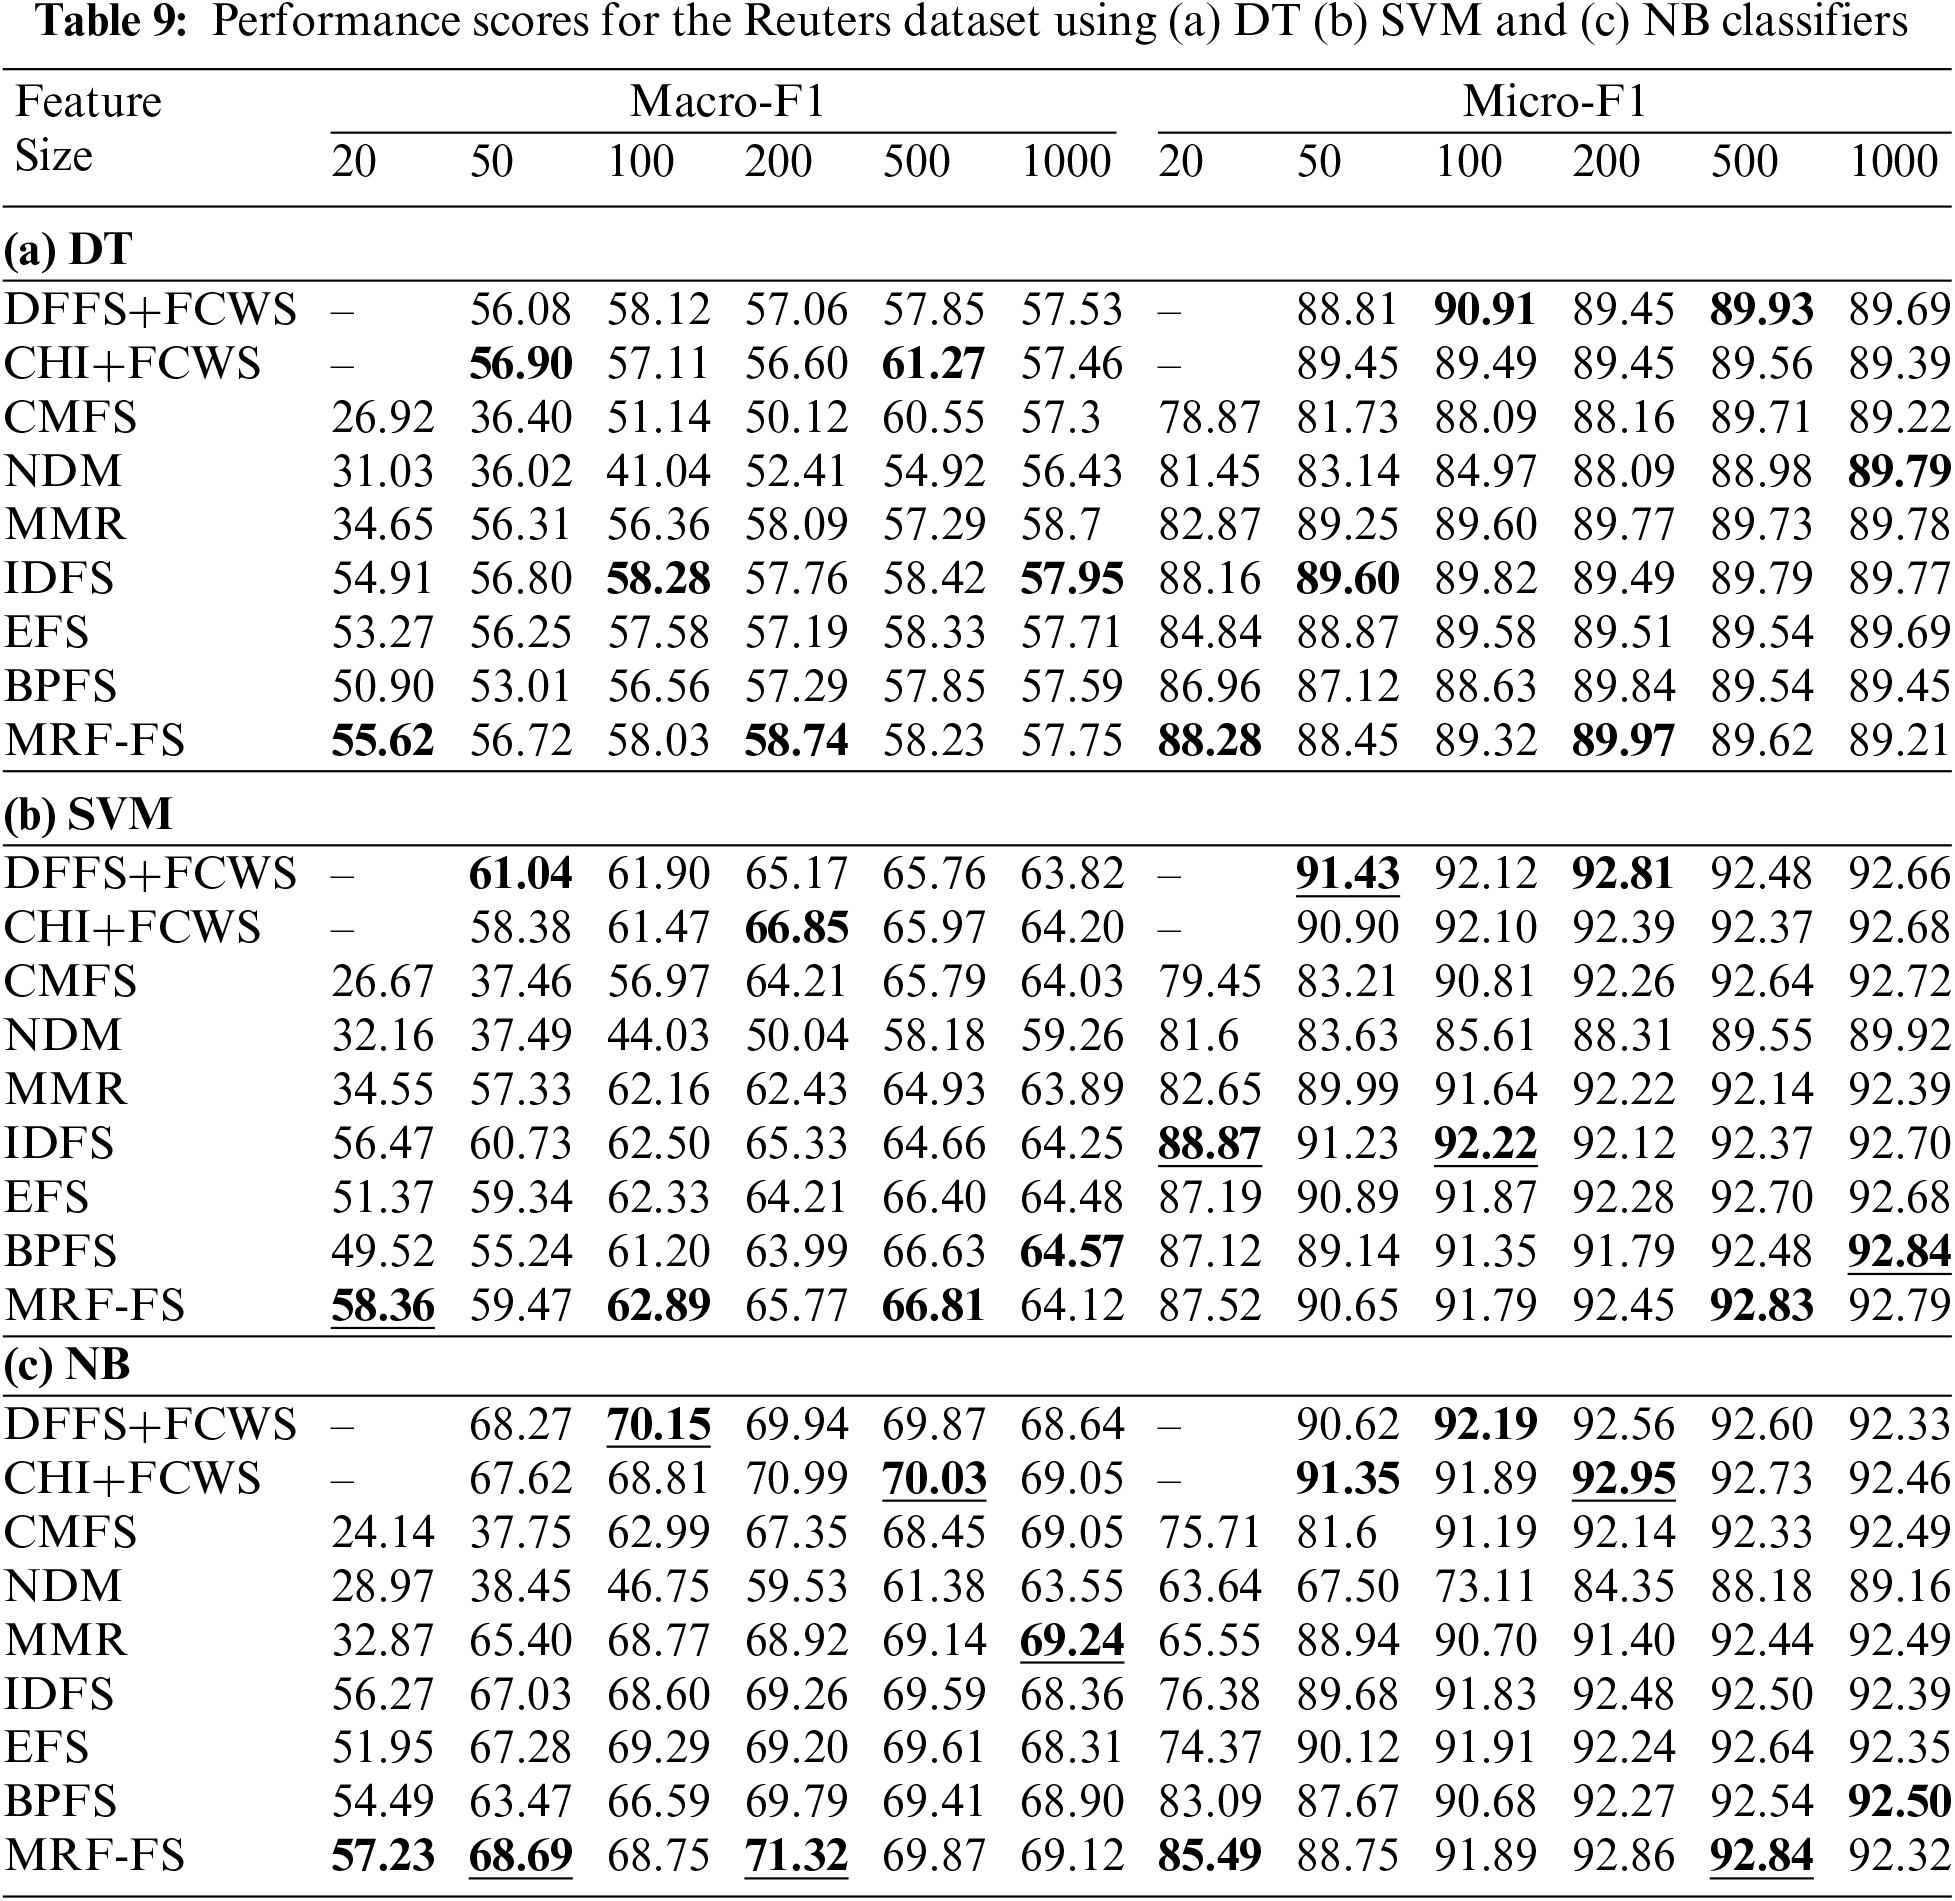
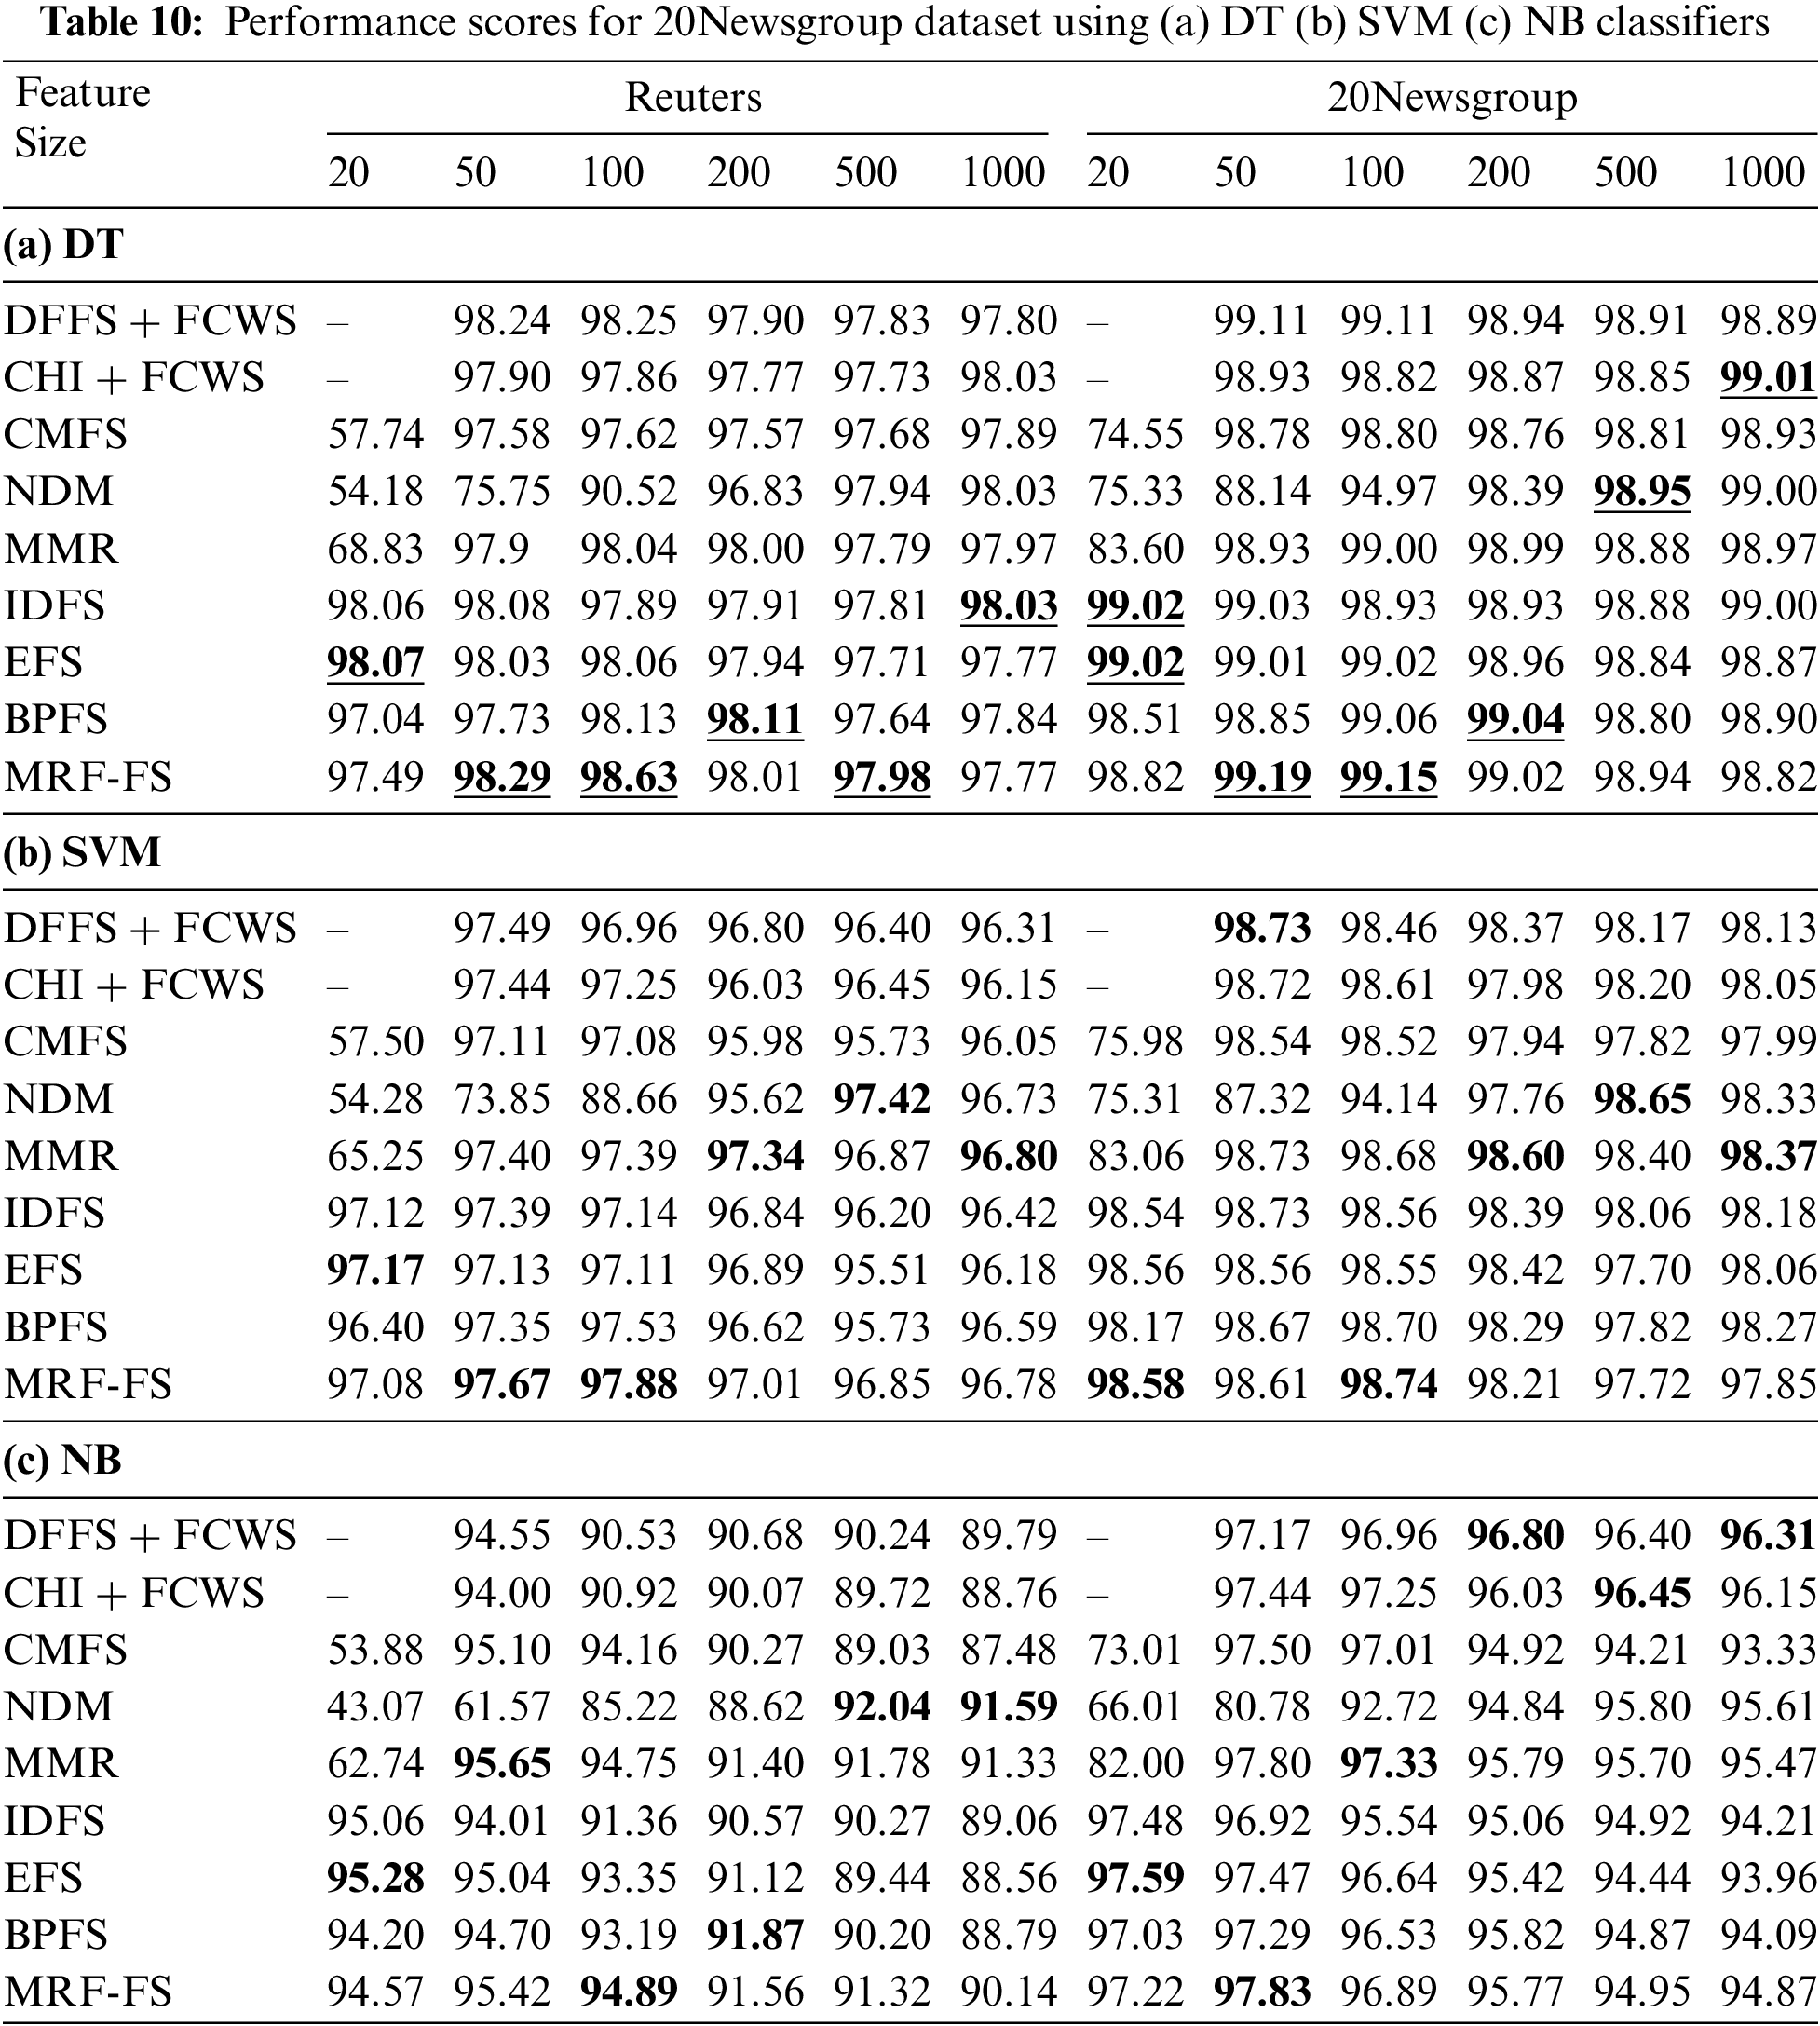
Table 9 shows that the proposed model achieves the highest macro-F1 of 71.32% for Reuters datasets, while CHI + FCWS, using the NB classifier, achieves the highest micro-F1 of 92.95% with a feature size of 200. With the DT classifier, CHI + FCWS (61.27%) achieves the highest macro-F1 and micro-F1 with 500 features, while DFFS + FCWS (90.91%) achieves the highest with 100 features. However, CHI + FCWS (66.85%) with 200 features and BPFS (92.84%) with 1000 features achieve the highest macro-F1 and micro-F1 with the SVM classifier. The proposed model has a macro-F1 score of 55.62% to 71.32% for the Reuters dataset; however, the DT classifier performs between 55.62% and 58.74%, the SVM classifier between 58.36% and 66.81%, and the NB classifier between 57.23% and 71.32%.
As shown in Table 10, the proposed model with 100 features got the highest macro-F1 score of 98.63% and the micro-F1 score of 99.19% for 20Newsgroup using the DT classifier. The proposed model with 100 features achieves the highest macro-F1 (98.63%) and micro-F1 (99.19%) with the DT classifier. Similarly, the proposed model with 100 features achieves the highest macro-F1 (97.88%) and micro-F1 (98.74%) with the SVM classifier. However, the NB classifier achieves the highest macro-F1 and micro-F1 with MMR (95.65%) and MRF-FS (97.83%) with 50 features, respectively. While the proposed model has the macro-F1 score between 90.14% and 98.63% for the 20Newsgroup dataset, it ranges between 97.49% and 98.63% for the DT, between 96.78% and 97.88% for the SVM, and between 90.14% and 95.42% for the NB classifiers, respectively.
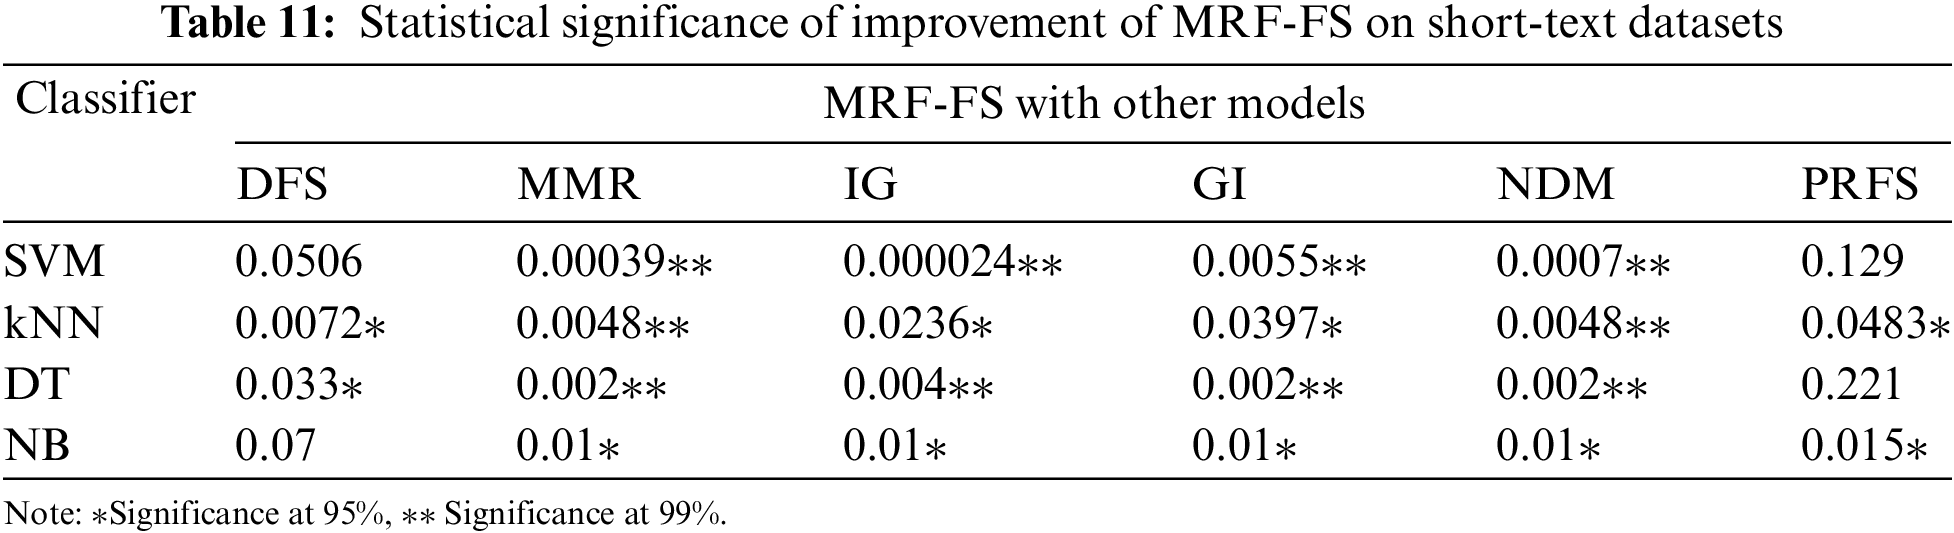
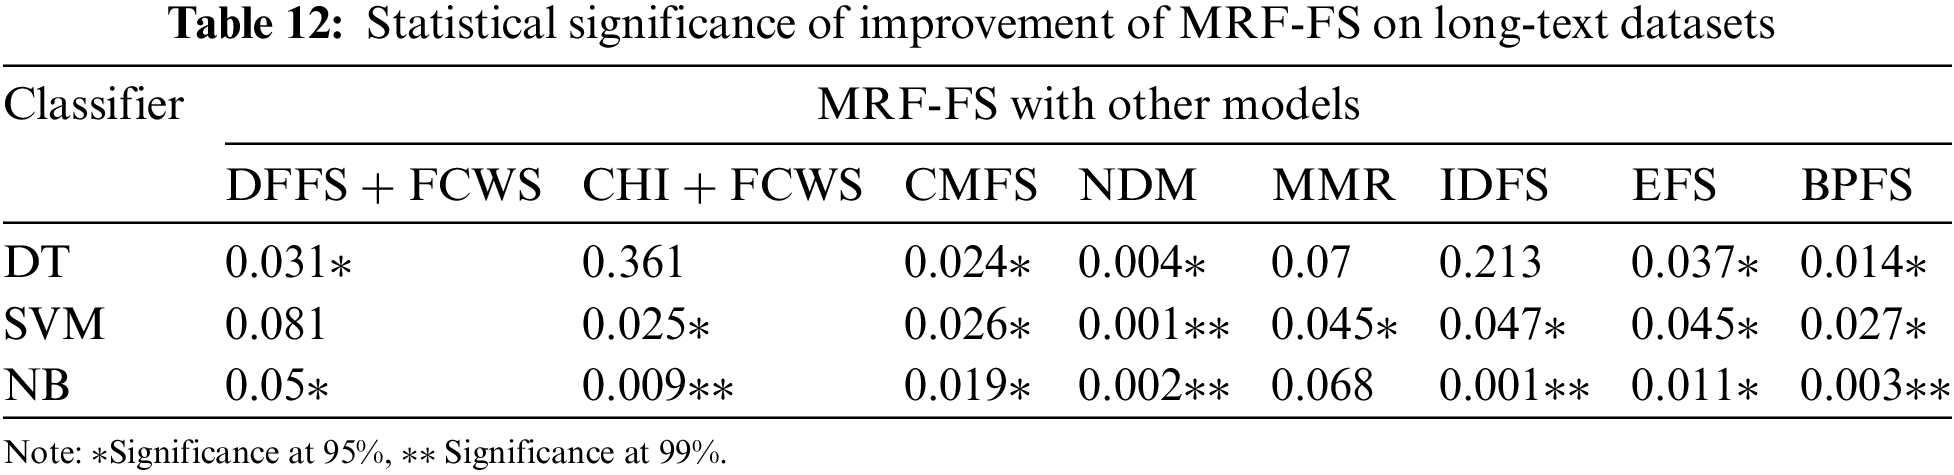
To support the evidence obtained from the experimental study, a statistical analysis has been carried out using a paired t-test to validate the performance of the proposed model. A paired t-test is a commonly used statistical analysis performed between two sets of data that belong to the same group. Table 11 presents the p-values obtained from the one-tailed paired t-test for the macro-F1 values shown in Tables 5–7 for the short-text datasets (SMS, SLS, and AYSC). Similarly, Table 12 presents the p-values obtained for the macro-F1 values shown in Tables 9–10 for the long-text datasets (Reuters and 20Newsgroup). The significance levels are denoted by p-values, where values below 0.05 indicate statistical significance. The proposed model demonstrated superior performance compared to other techniques, with statistical evidence at 99% and 95% confidence levels for SVM, kNN, DT, and NB classifiers. Moreover, most of the p-values are less than 0.05, indicating statistical significance at the 95% confidence level, except for a few cases. More precisely, while comparing the results, it is clear that the p-values in Table 11 are highly significant than the p-values in Table 12. This demonstrates the superiority of the proposed model with short-text data, as the performance gain is more significant than long-text multi-class datasets.
This study proposes a multivariate relevance frequency analysis for text classification feature selection. Initially, a relevance frequency is used as a term weighting technique to select features. Subsequently, the multivariate relevance frequency assesses the positive, negative, and dependency relevance of terms within each category. An experimental study is performed with several standard existing feature selection models on five datasets involving short texts (SMS, SLS, and AYSC datasets) and long texts (Reuters and 20Newsgroup datasets) using four classifiers: SVM, kNN, DT, and NB. The results have been analysed using various performance metrics, including precision, recall, macro-F1 and micro-F1 metrics. Results show that the proposed model has the highest macro-F1 scores of 94% for the SMS dataset, 78.1% for the SLS dataset, 89.4% for the AYSC dataset, 71.32%, and 98.63% for the Reuters and 20Newsgroup datasets. Statistical analysis reveals superior performance for short-text data. Though the method uses simple statistical computation, it offers an improved solution to address the research gap in feature selection for text classification. Future studies aim to expand the application of this model beyond text mining and evaluate its performance using different evaluation metrics. The scalability and performance of the proposed model must be evaluated with real-time processing. Further, the performance of the model should be assessed with advanced classification models and its applicability beyond text mining.
Acknowledgement: None.
Funding Statement: The author received no specific funding for this study.
Author Contributions: The author confirms contributions to the paper as follows: Study conceptualization, design, data collection, analysis, and manuscript preparation: A. Saravanan.
Availability of Data and Materials: The data that support the findings of this study are openly available at data repositories: SMS dataset at https://archive.ics.uci.edu/dataset/228/; AYSC dataset at https://archive.ics.uci.edu/dataset/380/; Reuters-21578 at https://archive.ics.uci.edu/dataset/137/; 20Newsgroup datasets at https://archive.ics.uci.edu/dataset/113; SLS dataset at https://github.com/tarunsharma87/sentiment-analysis-python/blob/master/Dataset/.
Conflicts of Interest: The author declares that he has no conflicts of interest to report regarding the present study.
References
1. D. Ö. Şahin and E. Kılıç, “Two new feature selection metrics for text classification,” Automatika : časopis za automatiku, mjerenje, elektroniku, računarstvo i komunikacije, vol. 60, no. 2, pp. 162–171, 2019. doi: 10.1080/00051144.2019.1602293. [Google Scholar] [CrossRef]
2. O. Amaral, M. I. Azeem, S. Abualhaija, and L. C. Briand, “NLP-based automated compliance checking of data processing agreements against GDPR,” IEEE Trans. Softw. Eng., vol. 49, no. 9, pp. 4282–4303, 2023. doi: 10.1109/TSE.2023.3288901. [Google Scholar] [CrossRef]
3. P. Katarzyna, P. Mirosław, M. Tomasz, K. Maria, and Z. Michał, “A multi-label text message classification method designed for applications in call/contact centre systems,” Appl. Soft Comput., vol. 45, pp. 1–20, 2023. [Google Scholar]
4. E. Ovando-Becerril and H. Calvo, “Design of an automatic tagging algorithm for the development of a non-literal language corpus in spanish,” Comput. Sist., vol. 27, no. 4, pp. 899–907, 2023. [Google Scholar]
5. F. Jáñez-Martino, R. Alaiz-Rodríguez, V. González-Castro, E. Fidalgo, and E. Alegre, “Classifying spam emails using agglomerative hierarchical clustering and a topic-based approach,” Appl. Soft Comput., vol. 139, pp. 1–16, 2023. [Google Scholar]
6. Z. Mi and H. Zhan, “Text mining attitudes toward climate change: Emotion and sentiment analysis of the twitter corpus,” Weather Clim., Soc., vol. 15, no. 2, pp. 277–287, 2023. [Google Scholar]
7. N. Eligüzel, C. Cetinkaya, and T. Dereli, “A novel approach for text categorization by applying hybrid genetic bat algorithm through feature extraction and feature selection methods,” Expert. Syst. Appl., vol. 202, pp. 1–12, 2022. [Google Scholar]
8. A. H. M. Alaidi, R. A. M. Alairaji, H. T. H. S. ALRikabi, I. A. Aljazaery, and S. H. Abbood, “Dark web illegal activities crawling and classifying using data mining techniques,” Int. J. Interact. Mobile Technol., vol. 16, no. 10, pp. 122–139, 2022. doi: 10.3991/ijim.v16i10.30209. [Google Scholar] [CrossRef]
9. N. Kale, R. P. Dahake, and K. V. Metre, “Text summarization based on human behavioural learning model,” J. Integ. Sci. Technol., vol. 12, no. 2, pp. 741–741, 2024. [Google Scholar]
10. D. Nagumothu, P. W. Eklund, B. Ofoghi, and M. R. Bouadjenek, “Linked data triples enhance document relevance classification,” Appl. Sci., vol. 11, no. 14, pp. 1–21, 2021. [Google Scholar]
11. P. K. Diderot, K. S. Sankaran, M. Jawarneh, H. Pallathadka, J. L. Arias-Gonzáles and D. T. Sanchez, “Evaluation of chabot text classification using machine learning,” Convers. Artif. Intell., pp. 199–218, 2024. doi: 10.1002/9781394200801.ch13. [Google Scholar] [CrossRef]
12. N. Arora and P. D. Kaur, “A Bolasso based consistent feature selection enabled random forest classification algorithm: An application to credit risk assessment,” Appl. Soft Comput., vol. 86, pp. 1–15, 2020. [Google Scholar]
13. K. Adnan and R. Akbar, “An analytical study of information extraction from unstructured and multidimensional big data,” J. Big Data, vol. 6, no. 1, pp. 1–38, 2019. [Google Scholar]
14. S. S. Bama, M. S. I. Ahmed, and A. Saravanan, “Enhancing the search engine results through web content ranking,” Int. J. Appl. Eng. Res., vol. 10, no. 5, pp. 13625–13635, 2015. [Google Scholar]
15. P. Dhal and C. Azad, “A comprehensive survey on feature selection in the various fields of machine learning,” Appl. Intell., vol. 52, pp. 4543–4581, 2022. doi: 10.1007/s10489-021-02550-9. [Google Scholar] [CrossRef]
16. X. Deng, Y. Li, J. Weng, and J. Zhang, “Feature selection for text classification: A review,” Multimed. Tools Appl., vol. 78, no. 3, pp. 3797–3816, 2019. doi: 10.1007/s11042-018-6083-5. [Google Scholar] [CrossRef]
17. H. Ming and W. Heyong, “Filter feature selection methods for text classification: A review,” Multimed. Tools Appl., vol. 83, no. 1, pp. 2053–2091, 2024. doi: 10.1007/s11042-023-15675-5. [Google Scholar] [CrossRef]
18. S. Günal, “Hybrid feature selection for text classification,” Turkish J. Elect. Eng. Comput. Sci., vol. 20, no. 2, pp. 1296–1311, 2012. [Google Scholar]
19. M. Cherrington, F. Thabtah, J. Lu, and Q. Xu, “Feature selection: Filter methods performance challenges,” in Proc. Int. Conf. Comput. Info. Sci., Sakaka, Saudi Arabia, Apr. 3–4, 2019, pp. 1–4. [Google Scholar]
20. S. K. Behera and R. Dash, “Performance enhancement of the unbalanced text classification problem through a modified chi square-based feature selection technique: A mod-chi based FS technique,” Int. J. Intell. Inf. Technol., vol. 18, no. 1, pp. 1–23, 2022. doi: 10.4018/IJIIT. [Google Scholar] [CrossRef]
21. W. H. Nugroho, S. Handoyo, Y. J. Akri, and A. D. Sulistyono, “Building multiclass classification model of logistic regression and decision tree using the chi-square test for variable selection method,” J. Hunan Univ. Natural Sci., vol. 49, no. 4, pp. 172–181, 2022. doi: 10.55463/issn.1674-2974. [Google Scholar] [CrossRef]
22. S. Jing et al., “Correlation analysis and text classification of chemical accident cases based on word embedding,” Process Saf. Environ. Prot., vol. 158, pp. 698–710, 2022. doi: 10.1016/j.psep.2021.12.038. [Google Scholar] [CrossRef]
23. F. Kamalov, F. Thabtah, and H. H. Leung, “Feature selection in imbalanced data,” Ann. Data Sci., vol. 10, no. 6, pp. 1527–1541, 2023. doi: 10.1007/s40745-021-00366-5. [Google Scholar] [CrossRef]
24. G. Fu, B. Li, Y. Yang, and C. Li, “Re-ranking and TOPSIS-based ensemble feature selection with multi-stage aggregation for text categorization,” Pattern Recognit. Lett., vol. 168, pp. 47–56, 2023. doi: 10.1016/j.patrec.2023.02.027. [Google Scholar] [CrossRef]
25. Z. Gao, Y. Xu, F. Meng, F. Qi, and Z. Lin, “Improved information gain-based feature selection for text categorization,” in Proc. IEEE Int. Conf. Wireless Comm., Vehicular Technol., Info. Theory Aerospace & Electron. Syst., Aalborg, Denmark, May 11–14, 2014, pp. 1–5. [Google Scholar]
26. H. Park and H. Kwon, “Improved Gini-index algorithm to correct feature-selection bias in text classification,” IEICE Trans. Inf. Syst., vol. 94, no. 4, pp. 855–865, 2011. [Google Scholar]
27. M. I. Quraishi and J. P. Choudhury, “Assessment, categorisation and prediction of the landslide-affected regions using soft computing and clustering techniques,” J. Inst. Eng. (IndiaSer. B, vol. 104, pp. 579–602, 2023. [Google Scholar]
28. M. K. Muddada, J. Vankara, S. S. Nandini, G. R. Karetla, and K. S. Naidu, “Multi-objective ant colony optimization (MOACO) approach for multi-document text summarization,” Eng. Proc., vol. 59, no. 1, pp. 1–16, 2024. [Google Scholar]
29. A. Rehman, K. Javed, H. A. Babri, and M. Saeed, “Relative discrimination criterion–A novel feature ranking method for text data,” Expert. Syst. Appl., vol. 42, no. 7, pp. 3670–3681, 2015. doi: 10.1016/j.eswa.2014.12.013. [Google Scholar] [CrossRef]
30. M. Labani, P. Moradi, F. Ahmadizar, and M. Jalili, “A novel multivariate filter method for feature selection in text classification problems,” Eng. Appl. Artif. Intell., vol. 70, pp. 25–37, 2018. doi: 10.1016/j.engappai.2017.12.014. [Google Scholar] [CrossRef]
31. A. Rehman, K. Javed, and H. A. Babri, “Feature selection based on a normalized difference measure for text classification,” Inform. Process. & Manag., vol. 53, no. 2, pp. 473–489, 2017. doi: 10.1016/j.ipm.2016.12.004. [Google Scholar] [CrossRef]
32. R. Cekik and A. K. Uysal, “A novel filter feature selection method using rough set for short text data,” Expert. Syst. Appl., vol. 160, pp. 1–26, 2020. [Google Scholar]
33. J. Yang, Y. Liu, X. Zhu, Z. Liu, and X. Zhang, “A new feature selection based on comprehensive measurement both in inter-category and intra-category for text categorization,” Inform. Process. & Manag., vol. 48, no. 4, pp. 741–754, 2012. doi: 10.1016/j.ipm.2011.12.005. [Google Scholar] [CrossRef]
34. M. S. Ali and K. Javed, “A novel inherent distinguishing feature selector for highly skewed text document classification,” Arab J. Sci. Eng., vol. 45, pp. 10471–10491, 2020. doi: 10.1007/s13369-020-04763-5. [Google Scholar] [CrossRef]
35. Y. Liu, P. Li, and X. Hu, “Combining context-relevant features with multi-stage attention network for short text classification,” Comput. Speech & Lang., vol. 71, pp. 1–14, 2022. [Google Scholar]
36. Y. Zhu, Y. Wang, J. Qiang, and X. Wu, “Prompt-learning for short text classification,” IEEE Trans. Knowl. Data Eng., pp. 1–13, 2023. doi: 10.1109/TKDE.2023.3332787. [Google Scholar] [CrossRef]
37. S. Bose, G. Su, and L. Liu, “Deep one-class fine-tuning for imbalanced short text classification in transfer learning,” in Proc. Int. Conf. on Adv. Data Mining and Appl, Shenyang, China, Aug. 21–23, 2023,pp. 339–351. [Google Scholar]
38. Y. Hu, J. Ding, Z. Dou, and H. Chang, “Short-text classification detector: A Bert-based mental approach,” Comput. Intell. Neurosci., vol. 2022, pp. 8660828, 2022. [Google Scholar] [PubMed]
39. B. Parlak, “Ensemble feature selection for single-label text classification: A comprehensive analytical study,” Neural Comput. Appl., vol. 35, no. 26, pp. 19235–19251, 2023. doi: 10.1007/s00521-023-08763-y. [Google Scholar] [CrossRef]
40. B. Parlak, “A novel feature and class-based globalization technique for text classification,” Multimed. Tools Appl., vol. 82, no. 24, pp. 37635–37660, 2023. doi: 10.1007/s11042-023-15459-x. [Google Scholar] [CrossRef]
41. B. Parlak and A. K. Uysal, “A novel filter feature selection method for text classification: Extensive Feature Selector,” J. Inf. Sci., vol. 49, no. 1, pp. 59–78, 2023. doi: 10.1177/0165551521991037. [Google Scholar] [CrossRef]
42. B. Parlak, “A novel feature ranking algorithm for text classification: Brilliant probabilistic feature selector (BPFS),” Comput. Intell., vol. 39, no. 5, pp. 900–926, 2023. doi: 10.1111/coin.v39.5. [Google Scholar] [CrossRef]
43. S. S. Bama, M. S. I. Ahmed, and A. Saravanan, “A mathematical approach for improving the performance of the search engine through web content mining,” J. Theor. & Appl. Inform. Technol., vol. 60, no. 2, pp. 343–350, 2014. [Google Scholar]
44. S. Arumugam and S. B. Subramani, “Similitude based segment graph construction and segment ranking for automatic summarization of text document,” Trends in Sci., vol. 19, no. 1, pp. 1719, 2022. doi: 10.48048/tis.2022.1719. [Google Scholar] [CrossRef]
45. M. T. Nuruzzaman, C. Lee, and D. Choi, “Independent and personal SMS spam filtering,” in Proc. IEEE Int. Conf. Comput. Inform. Technol., Paphos, Cyprus, Aug. 31–Sep. 2, 2011. [Google Scholar]
46. D. Kotzias, M. Denil, N. de Freitas, and P. Smyth, “From group to individual labels using deep features,” in Proc. ACM Int. Conf. on Knowl. Disc. Data Min., Barcelona, Spain, Aug. 25–29, 2015, pp. 597–606. [Google Scholar]
47. T. C. Alberto, J. V. Lochter, and T. A. Almeida, “TubeSpam: Comment spam filtering on YouTube,” in Proc. IEEE Int. Conf. on Mach. Learn. Appl., Miami, FL, USA, Dec. 9–11, 2015. [Google Scholar]
Cite This Article
 Copyright © 2024 The Author(s). Published by Tech Science Press.
This work is licensed under a Creative Commons Attribution 4.0 International License , which permits unrestricted use, distribution, and reproduction in any medium, provided the original work is properly cited.
 Downloads
 Citation Tools