
 Submit a Paper
 Propose a Special lssue
 Open Access
ARTICLE
3D Model Occlusion Culling Optimization Method Based on WebGPU Computing Pipeline
1 School of Computer Science, China University of Geosciences, Wuhan, 430074, China
2 Hubei Key Laboratory of Intelligent Geo-Information Processing, China University of Geosciences, Wuhan, 430074, China
3 State Key Laboratory of Biogeology and Environmental Geology, China University of Geosciences, Wuhan, 430074, China
4 Key Laboratory of Resource Quantitative Assessment and Geoscience Information, Ministry of Natural Resources, Wuhan, 430074, China
* Corresponding Author: Gang Liu. Email:
Computer Systems Science and Engineering 2023, 47(2), 2529-2545. https://doi.org/10.32604/csse.2023.041488
Received 24 April 2023; Accepted 01 June 2023; Issue published 28 July 2023
 View Full Text
 Download PDF
Abstract
Nowadays, Web browsers have become an important carrier of 3D model visualization because of their convenience and portability. During the process of large-scale 3D model visualization based on Web scenes with the problems of slow rendering speed and low FPS (Frames Per Second), occlusion culling, as an important method for rendering optimization, can remove most of the occluded objects and improve rendering efficiency. The traditional occlusion culling algorithm (TOCA) is calculated by traversing all objects in the scene, which involves a large amount of repeated calculation and time consumption. To advance the rendering process and enhance rendering efficiency, this paper proposes an occlusion culling with three different optimization methods based on the WebGPU Computing Pipeline. Firstly, for the problem of large amounts of repeated calculation processes in TOCA, these units are moved from the CPU to the GPU for parallel computing, thereby accelerating the calculation of the Potential Visible Sets (PVS); Then, for the huge overhead of creating pipeline caused by too many 3D models in a certain scene, the Breaking Occlusion Culling Algorithm (BOCA) is introduced, which removes some nodes according to building a Hierarchical Bounding Volume (BVH) scene tree to reduce the overhead of creating pipelines; After that, the structure of the scene tree is transmitted to the GPU in the order of depth-first traversal and finally, the PVS is obtained by parallel computing. In the experiments, 3D geological models with five different scales from 1:5,000 to 1:500,000 are used for testing. The results show that the proposed methods can reduce the time overhead of repeated calculation caused by the computing pipeline creation and scene tree recursive traversal in the occlusion culling algorithm effectively, with 97% rendering efficiency improvement compared with BOCA, thereby accelerating the rendering process on Web browsers.Keywords
In recent years, both computer and communication technologies are one of the main support services to realize the “Digital and Transparent Earth” [1]. Geospatial information science and technology is composed of 3D geological modeling, visualization, and other related disciplines [2]. However, it is very difficult for the 3D geological models to be visualized due to the large volume properties and complex hierarchical relationships. Especially for the rendering of large-scale 3D models on the Internet, many issues, such as the relatively poorer rendering performance, delayed displaying, and slower transmission of large amounts of data, still exist. Therefore, how to render and visualize graphics on the Internet with a higher efficiency has gradually become a hot research field in computer graphics.
In the scene of graphics rendering, different sizes of graphics often contain relatively significant occlusion relationships, thus only a small proportion of the corresponding scenes can be inspected from a specific viewpoint. Occlusion culling is the key technique for large scene rendering, which tries to cull out the invisible part of the scene and it will not have a great impact macroscopically. In this way, only the visible parts of the scene usually need to be transmitted to the GPU for rendering, which greatly reduces the rendering pressure of the computers to a large extent [3,4].
Research on occlusion culling can be divided into two ways: one is to depend on the off-line calculation, reducing the number of subsequent real-time rendering objects substantially; the other is to perform real-time calculations during rendering, thereby discarding the parts that do not need to be rendered in each frame. However, the former will lead to a long-time and low-efficiency calculation when the amounts of preprocessing are too large. The latter is a real-time dynamic calculation, which will occupy a large amount of memory and CPU resources, declining the machine’s rendering capability. For the problems that existed in the traditional occlusion culling, starting from the breaking occlusion culling, this paper proposed three specific acceleration algorithms to accelerate the 3D model rendering according to reducing the time consumption of off-line preprocessing.
The rest of this paper is organized as follows. Section 2 briefly discusses related works.Section 3 describes the details of the proposed methods. Section 4 shows the experimental results. Finally, Section 5 concludes the paper.
2.1 Occlusion-Culling-Related Algorithm
Early in the 1950s, specialists from abroad had already started the research of 3D geological modeling techniques. Accompanied by the development of computer technologies, based on the 3D virtual environment, a variety of demands, such as spatial information management, spatial analysis, and prediction, geological statistics, and interpretation, could be satisfied, in which not only a fine 3D geological model is obtained, but also a variety of corresponding geological characteristics are better described [5]. Thanks to the rapid development of computer graphics in recent years, a breakthrough has been made in both 3D visualization and rendering technologies, which plays an important role in utilizing 3D data and determining whether the data can be observed and used by human beings [6]. For improving the computer’s rendering efficiency and reducing the rendering pressure simultaneously, the concept of occlusion culling was proposed.
For example, Hierarchical Z-Buffering [7] is proposed in the 1990s, in which the space was separated by the Octree and down-sampled by the Z-Buffer. But each triangle in a certain scene needed to be checked caused a huge consumption of graphics processing. Reference [8] proposed the novel microarchitectural technique, the Omega-Test, in which the Coherent Hierarchical Culling (CHC) was introduced in the Z-Buffer algorithm, predicting the image visibility by using both Z-Test result information discarded by GPU and the frame-by-frame coherence. Reference [9] proposed the Coherent Hierarchical Culling algorithm, according to the spatiotemporal consistency between two adjacent frames, for the invisible objects in the previous frame, occlusion query is inserted without any rendering. By contrast, for the observed ones, their corresponding visibilities are updated according to the query, and the objects added in the adjacent frame will be rendered subsequently. Reference [10] have made some improvement on this basis, in which the objects observed in the previous stage are selected as the invisible ones, and the occlusion culling processes will be performed according to the depth of the given scene management tree.
Although these aforementioned methods could partly solve the problems of occlusion culling, some defects still exist, such as the CPU suspension and GPU starvation caused by occlusion query and the huge quantities of computing resources, especially for the cases of the visualization of the large-scale complicated scene on the Internet [11]. The 3D model visualization based on the web browser client, however, might bring a possible way to overcome these issues, which is more convenient and advanced than the traditional desktop [12]. Specifically, for a network-based 3D visualization system at or above the city level, the amount of rendering data might reach the TB magnitude, in which the higher demands are proposed on the web browser clients in terms of rendering or data transmission. In recent years, the graphics computing units could be transferred from CPU to GPU owing to the outstanding computing performance. For example, the GPU-based point-cloud rending computation reduces the computational burden on the CPU, which improves the whole rendering efficiency with one magnitude of performance higher than the hardware pipeline [13–15]. The problems of computing-intensive and slow rendering speed caused by the complicated 3D scene have always been one of the key factors for visualization. Reference [16] combined the visibility-judgement-based slice culling algorithm with the clipping algorithm, PVS-based culling algorithm, and ROAM strategy so that a new culling method with both improved ROAM and dynamic PVS is created. From the perspective of the graphics, it improves the calculation and retrieval efficiency of the geoscience data. However, due to the highly non-linear, complex, and nonstationary properties of the 3D geological models, how to render them with a higher efficiency still needs to be improved. Therefore, it becomes a possible way to solve this issue according to accelerating the computation speed by using the GPU units.
For the given 3D scene and viewing angle, the occlusion relationships could be judged and the invisible graphical objects will be discarded so that it can reduce the complexity and improve the realism for the whole scene, thereby realizing the low-load creation and network transmission, which is shown in Fig. 1 below [17].
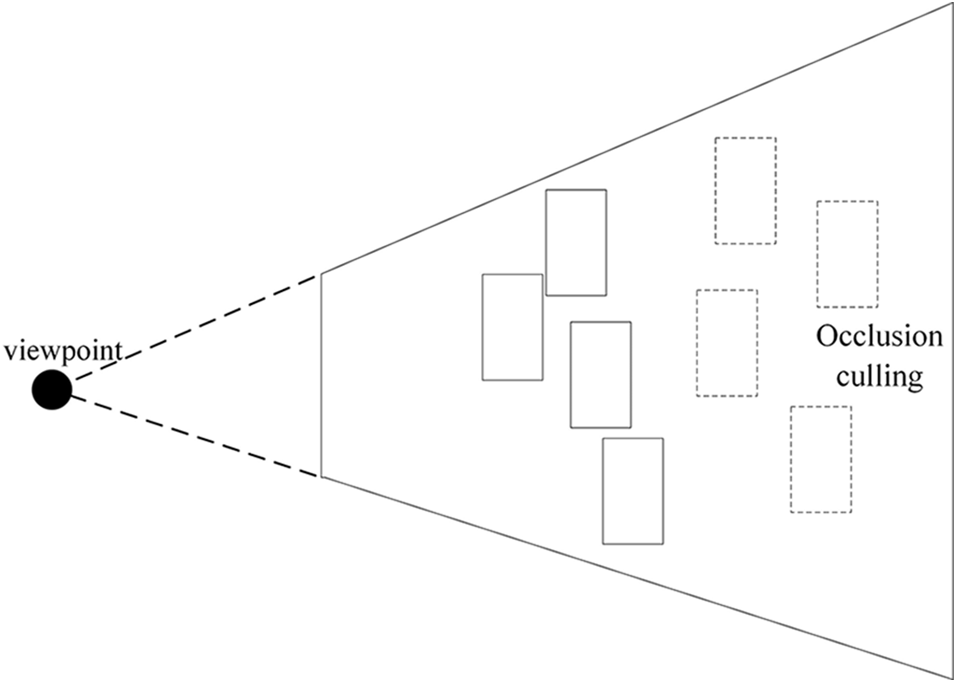
Figure 1: The schematic diagram of the occlusion culling algorithm
The common classifications for occlusion culling are described as follows [18]:
Based on the granularity, the occlusion can be divided into Object precision with object level and Image precision with pixel level.
According to the viewpoint, the occlusion culling can be divided into Point-based ones and Cell-based ones, which are calculated point by point and region by region respectively.
Based on the organization of the occlusion objects, they could be classified into Cell-and-Portal ones and Generic Scene ones. For the former one, the region will be divided into many cells, and different viewing frustums are rendered according to different cell structures and portals’ locations. For the latter one, there is no limitation of the occlusion objects.
According to the calculation-occurred time, it includes break-time and real-time occlusion culling. The pre-processing is conducted before rendering in the former one, while both the rendering and occlusion culling happens simultaneously in the latter one.
2.3 Break-Time Occlusion Culling Algorithm
For improving the frame rate of the real-time rendering, the reductant computing resources should be moved to the pre-processing steps in the Break-time Occlusion Culling Algorithm (BOCA) so that the Potentially Visible Sets (PVS) could be calculated in advance with a relatively lower rendering pressure [19]. The PVS refers to the candidate set of the non-occluded objects in the 3D scene obtained by the Break-time computing. PVS could finish the occlusion culling quickly when creating the 3D scene [20]. As is shown in Fig. 2, the white part is the objects of PVS in the current viewpoint, which are transmitted to the GPU to perform the rendering. In the same way, the objects in the gray part can be viewed as occlusion objects, which will be removed from the same viewpoint.
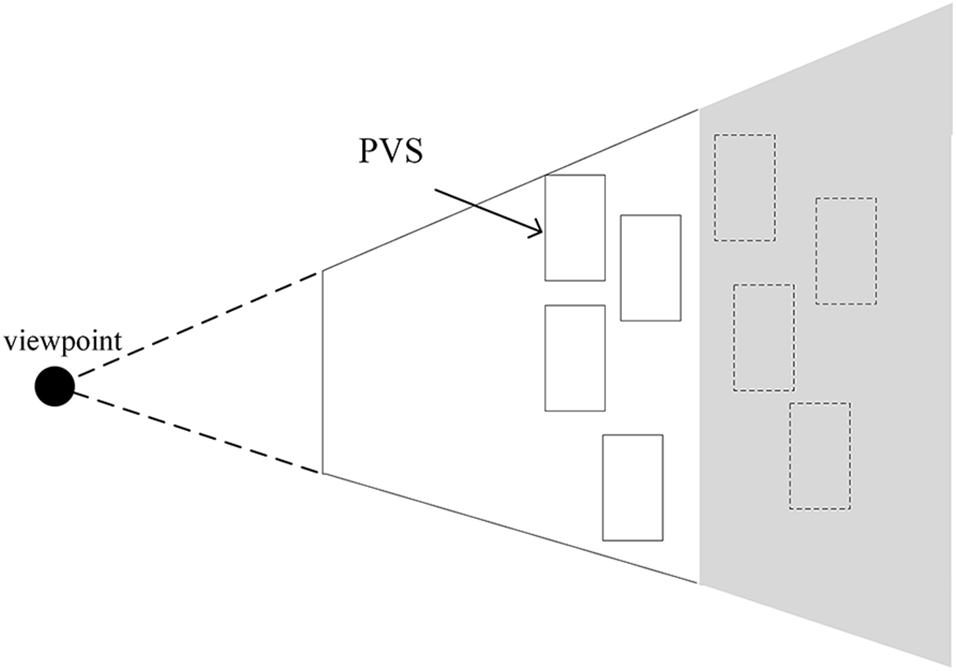
Figure 2: PVS diagram
The main process of BOCA includes four parts, named: Building the scene tree, intersection testing for overall rays iteratively, obtaining the PVS, and real-time rendering. The flow chart of BOCA is shown in Fig. 3:
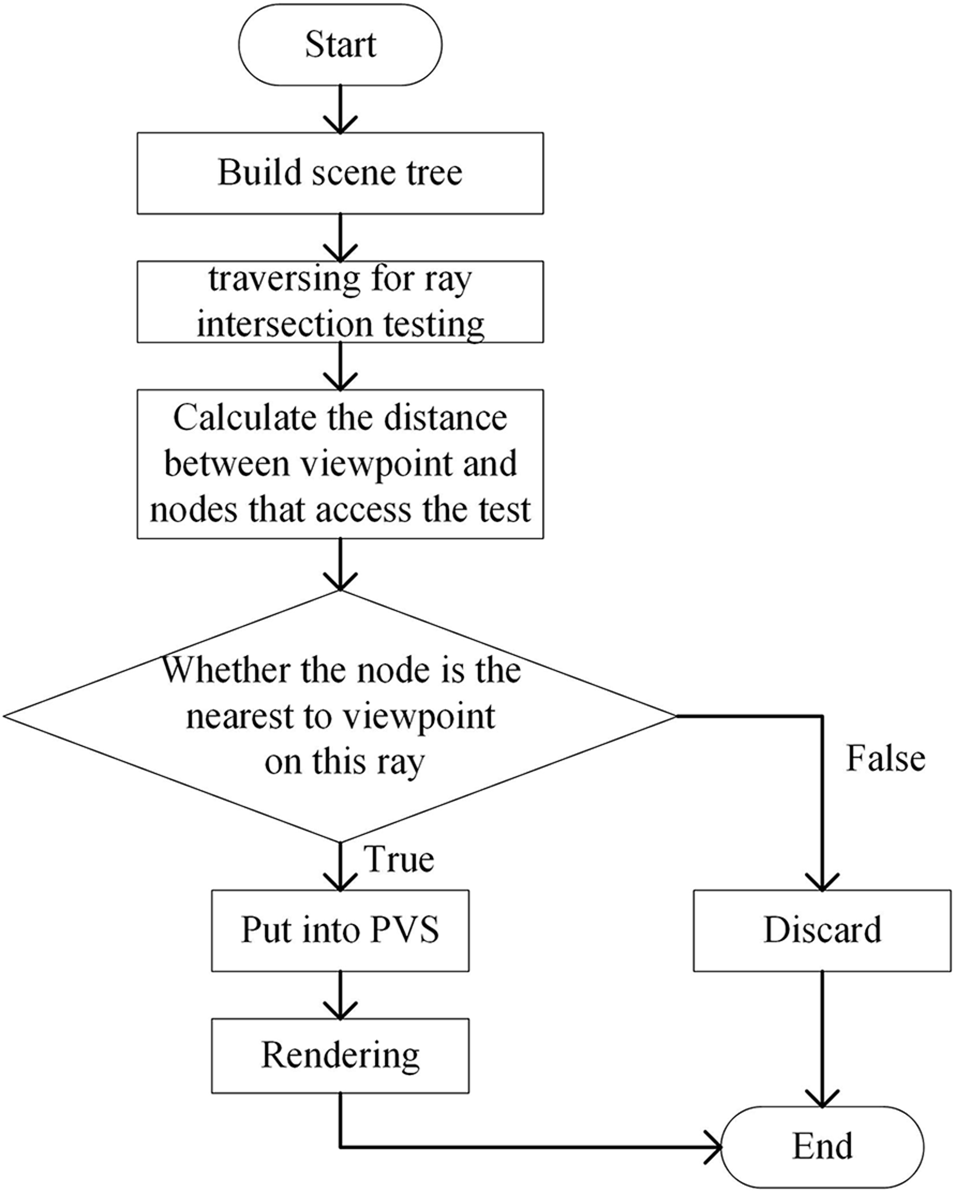
Figure 3: The flowchart of the BOCA
Pre-processing aims to get the PVS sets. For each viewpoint, many light rays via the objects are projected into it correspondingly so that the visible objects could be obtained. Therefore, for different viewpoints, many rays are launched from the corresponding coordinates to substitute direct-incident in the real environment. Then, the intersection test between the objects and rays in the scene is conducted. After that, the object initially intersected with each ray is selected and saved in the PVS. When all the rays are traversed in a certain viewpoint, the corresponding PVS is established. Repeating the operation many times and the PVS of all viewpoints is obtained.
For the BOCA, especially in the Web client, the problems of an unstable computing environment, longer computing time, and huge resource consumption are more significant. Specifically, when the BVH tree is constructed, parallel computing might exist between the intersection testing and distance calculation from the viewpoint to the selected bounding box (
Therefore, this paper proposed three occlusion culling algorithms based on WebGPU, including the Improved WebGPU-Computing-Pipeline-based Algorithm (IWCPA), the BVH-based Algorithm (BVHA), and the Strategy-Adjustment-based Algorithm (SAA). These algorithms will be described specifically in the next chapter.
A Graphics Processing Unit (GPU) is initially used as the electronic subsystem for graphics processing. For the unique architecture, however, a variety of algorithms could be implemented by the developers, named GPU Computing. WebGPU is a new graphics API that can bring all the functions of the GPUs to Web browsers [21]. Reference [22] used WebGPU to implement a peer-to-peer cluster, and matrix multiplication and Mandelbrot sets are adopted to evaluate the performance. The experimental results show that the problem of parallel computing can be extended, with a 75% improvement in efficiency. Therefore, the WebGPU is used to optimize the BOCA so that the time consumption of the rendering might be relatively reduced.
Before the concept of the pipeline is proposed, point-to-point information transmission could be conducted between CPU and GPU with a more frequent communication level. Being limited to the higher utilization frequency, the computing abilities of GPU cannot be fully presented. Fig. 4 shows the transmission speed among different memories. The WebGPU introduces the conception of rendering and computing pipeline so that the extra consumption between CPU and GPU is reduced. Meanwhile, Resource Binding is also introduced into it so that the global sharing of data among different pipelines could be possibly realized. The multi-dimensional data processing could make resource binding more convenient. Therefore, the WebGPU is used as the graphic API.
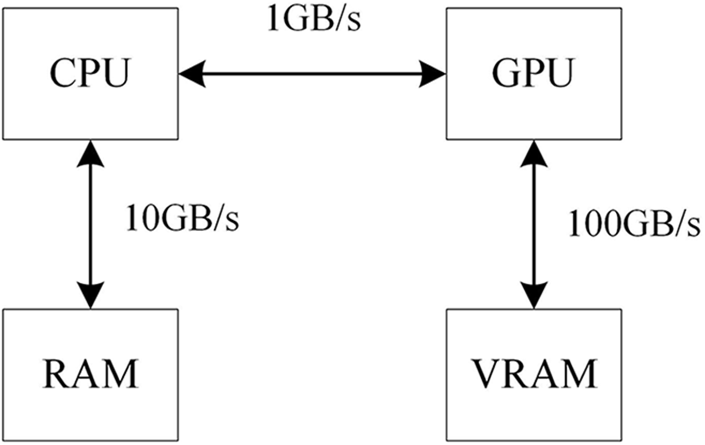
Figure 4: The bandwidth speed with different memory
Based on the WebGPU characteristics, the IWCPA is first proposed. Then, for the problem of huge overhead caused by the computing pipeline creation in the IWCPA, the BVHA is adopted. In practice, it can be found that a large time consumption is cost by the BVH traversing process in the BVHA, so the SAA is finally proposed. By traversing the BVH on GPU, SAA greatly improves the efficiency of this process. The flow chart of the three methods is shown in Fig. 5:
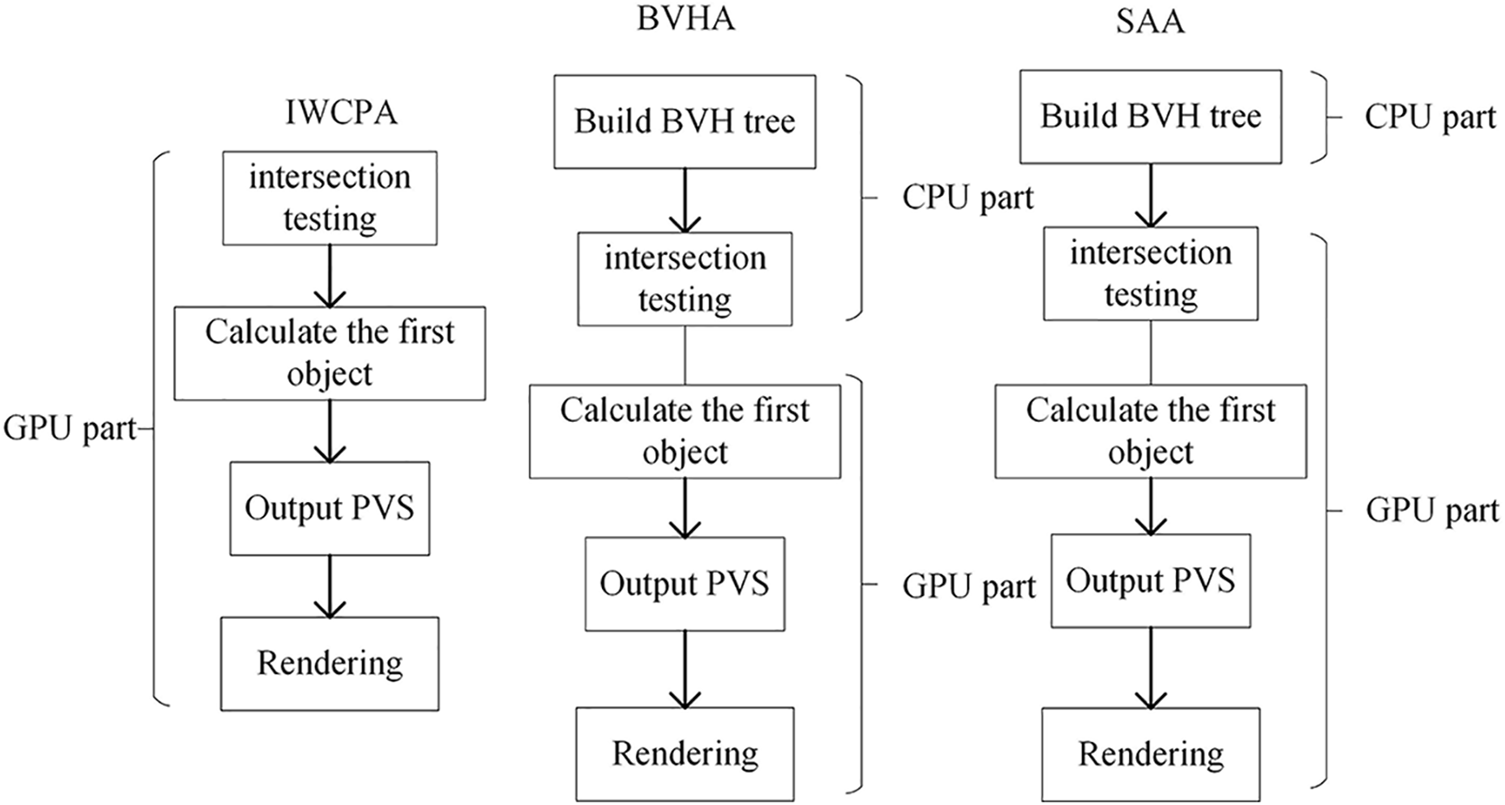
Figure 5: The thought flow chart of three methods
For the IWCPA, all the computing units are removed to the GPU with a relatively lower computing pressure on the CPU. The object selection is performed without the BVH, and although the parallel computing for the GPU is relatively stronger, all the objects in the scene cannot be obtained effectively in a very short period. Therefore, the BVH tree is introduced in the BVHA, in which the
3.3 BVH Scene Tree and Slab Algorithm
During the intersection texting for all the objects in the scene, each ray of the viewpoint should be calculated, with huge consumption of computing resources and time overhead. Therefore, for a certain scene, the space could be divided into many subspaces and calculated separately. Such the space division pattern could be regarded as the scene management tree. The common scene management tree includes Octree, KDtree, and so on.
BVH tree uses the bounding box with a simple geometric shape to approximately describe the complicated geometric objects, which can reduce the complexity of the 3D geological models and reduce the subsequent calculations [23,24]. It overcomes the disadvantages of low searching efficiency in Octree due to the spatial unbalanced aggregation for 3D geological models, which causes the depth of the Octree might be much deeper than usual [25]. Although the KD tree is better in searching efficiency, owing to the huge volume of characters of 3D geological models, it occupies a much larger computing memory [26]. Therefore, the BVH tree is adopted to manage the objects in the scene.
As is shown in Fig. 6, it shows the geological model and the corresponding BVH visualization in the southwestern region of Guizhou Province. For the constructed BVH tree in this paper, only the leaf nodes of the tree will contain the real object and non-leaf nodes will not contain it. Meanwhile, the Axis-aligned Bounding Box (AABB) is adopted to construct the BVH tree, which could be regarded as the smallest bounding box for the internal objects. Due to its simple geometric information, it can reduce the calculation process and ensure calculation precision, which reduces the probability of culling models in visible regions by mistake.
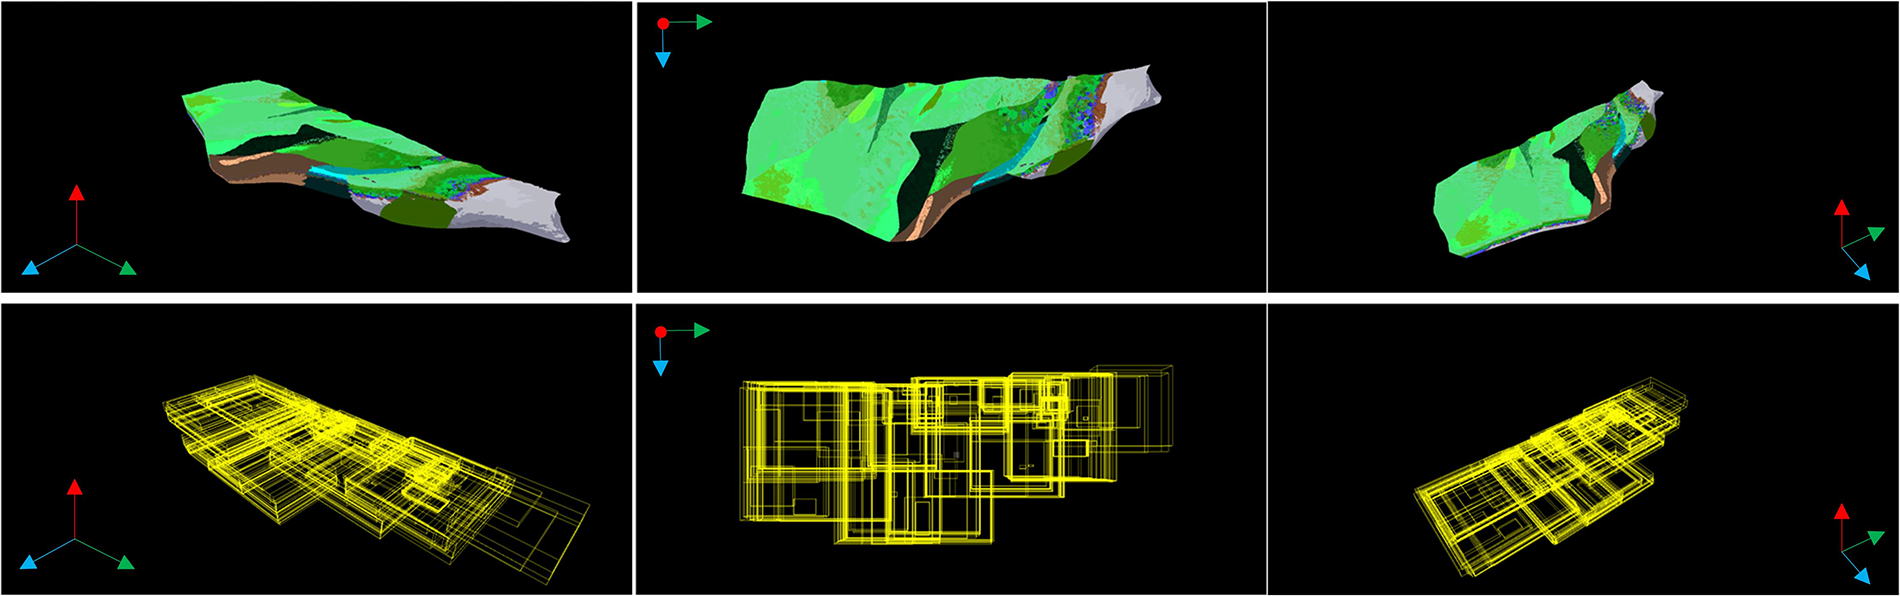
Figure 6: Geological models from different perspectives and their corresponding bounding boxes in southwestern Guizhou
Fig. 7 shows the BVH construction in the 2D space. Fig. 7a represents the corresponding bounding box, with serial numbers 1, 2, 3, and 4. Firstly, an AABB is constructed to surround all the bounding boxes, as shown in Fig. 7b. Then, the center coordinates with the longest axis are selected and divided into two nodes (bounding box), as is shown in the red part of Fig. 7c. Such iterations are repeated many times until all the bounding boxes of the real objects should correspond to a leaf node, as is shown in Fig. 7d.
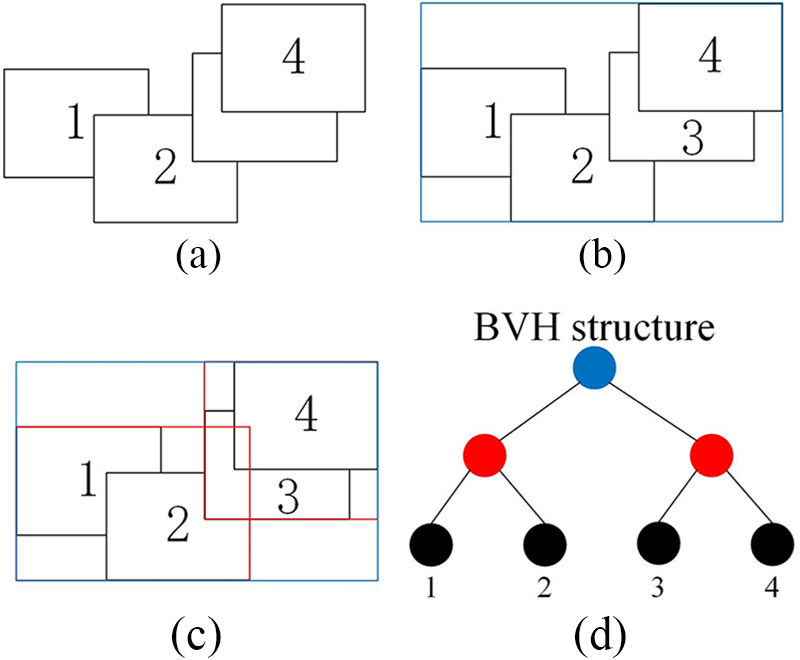
Figure 7: The build of the BVH Tree
Among various intersection testing methods, the slab is used in this paper [27]. The key to the slab is that the bounding box is regarded as the space in three pairs of parallel planes. If the ray is sandwiched by every pair of parallel planes and any part of them are remained, it will intersect the bounding box. For example, as is shown in Fig. 8, O is regarded as the viewpoint, and light is launched from it. A, B, C, and D represent the intersection point of the ray with planes
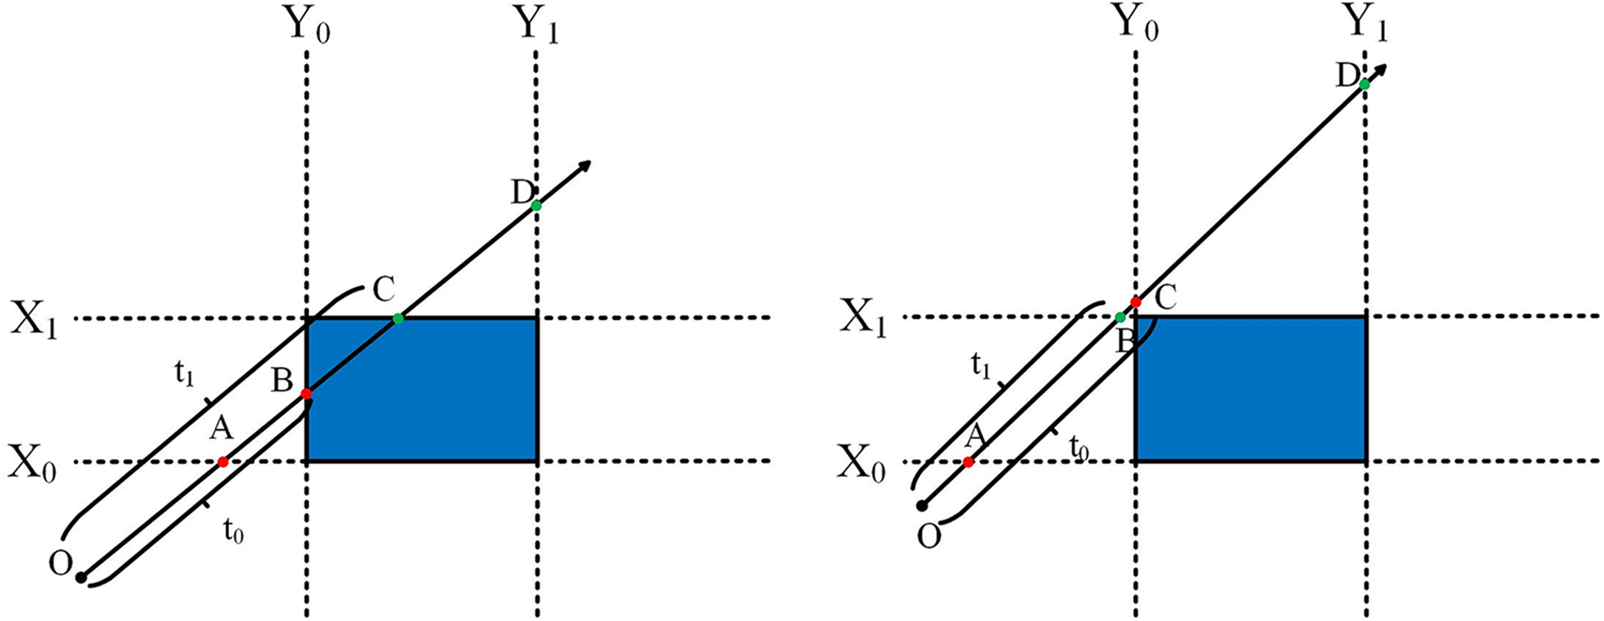
Figure 8: Semantic diagram of the slab algorithm. Among them,
3.4.1 Improved WebGPU-Computing-Pipeline-Based Algorithm
The key to IWCPA is that parallel computing is performed between the ray and the bounding box of the objects in the scene, with a 2D resource binding so that the calculation could be easily understood. The schematic diagram for parallel computing is shown in Fig. 9. During the 2D parallel computing of WebGPU, each calculation unit could be viewed as a parallel process, and both the ordinate and abscissa can be regarded as the ray and the bounding box of each corresponding object respectively. Each rectangular is viewed as a computing unit, and intersection testing could be performed on it. In the experiment, the 16 × 16 computing units are adopted to perform the parallel computing and 256 computing units could be finished at one time. In contrast, such a process could be finished according to serial computing 256 times for CPU, so the computing performance is significantly improved.
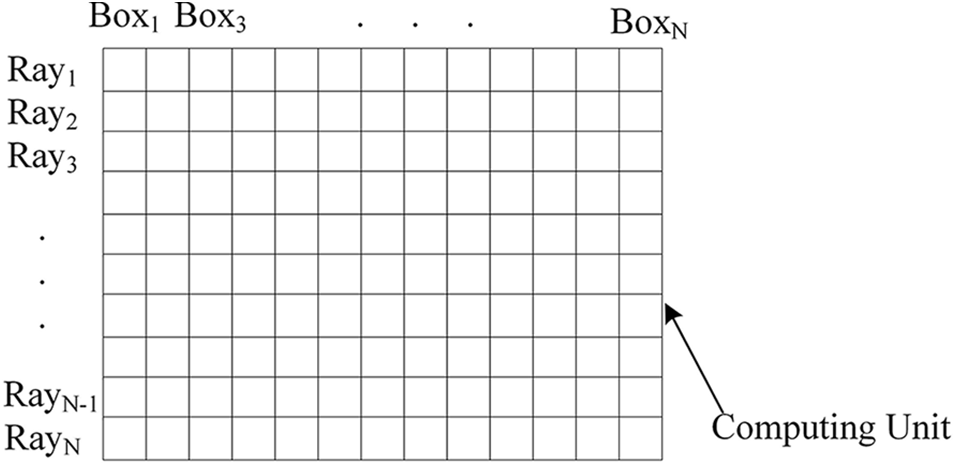
Figure 9: The schematic diagram of the concurrent calculation of IACPW
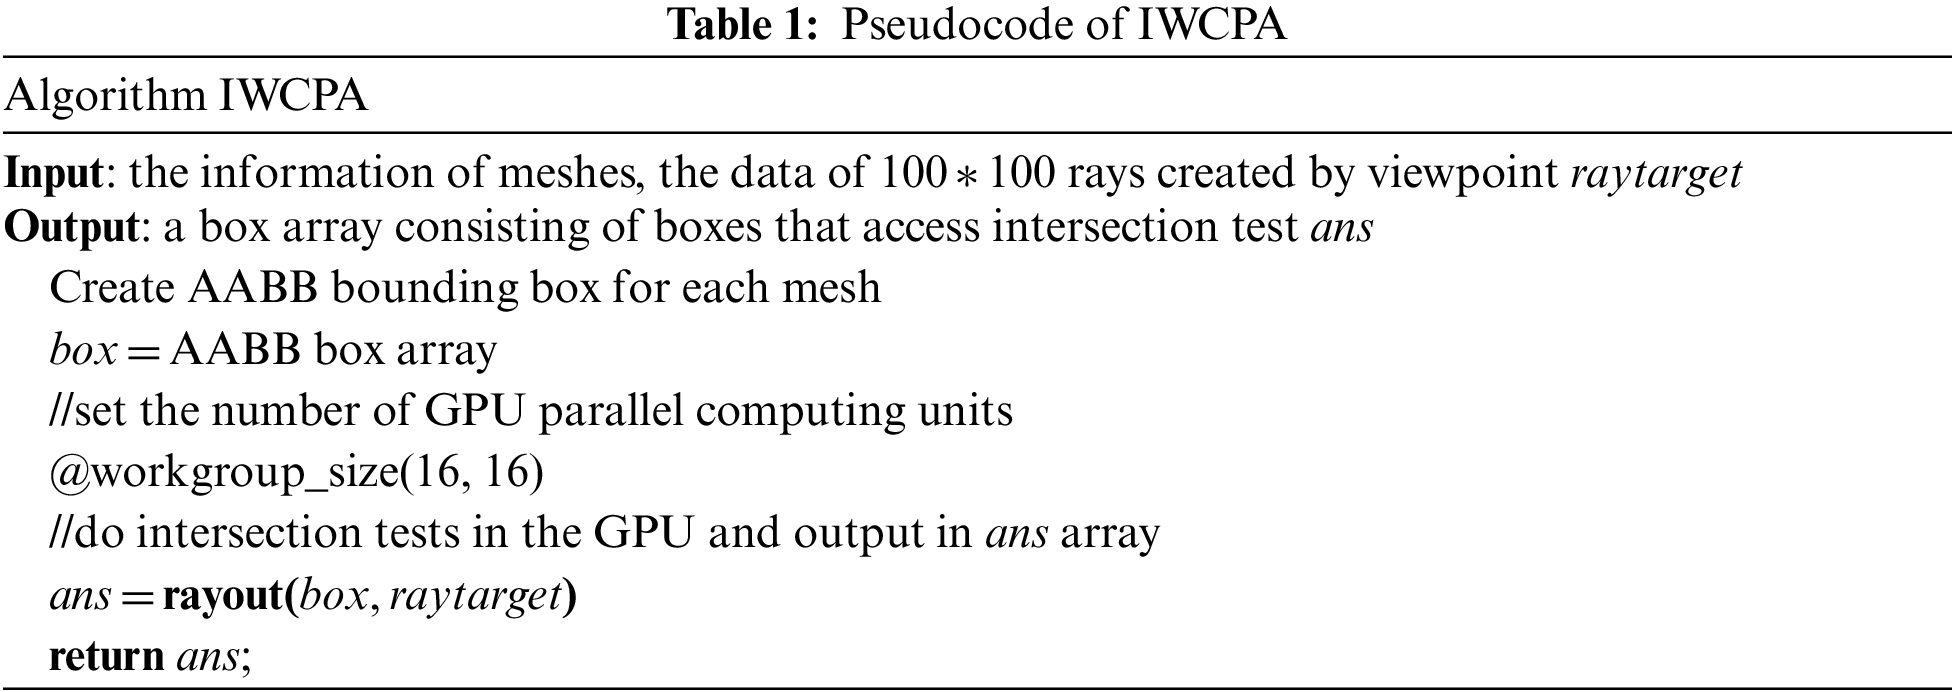
The main steps for IWCPA are as follows: firstly, the bounding box should be created according to the rendering requirements and meshes. After creating the AABB (as shown in Fig. 6), the information for both ray and AABB are transmitted into GPU, and the slab algorithm is used to perform the intersection testing between each ray and all bounding boxes. Take a certain ray as an example, if the ray intersects with one of the bounding boxes, then the distance between them will be returned. Otherwise, it will return an invalid value of −1. When the intersection testing is finished, the bounding boxes will be discarded with the return value −1, and others will be sorted by distance. The meshes which have the closest distance with the viewpoint will be input into PVS. Such operation will be repeated many times and finally, the PVS corresponds to the viewpoint that could be obtained, and finally, the corresponding data will be loaded and rendered by the rendering pipeline. The pseudocode of the IWCPA steps is shown in Table 1.
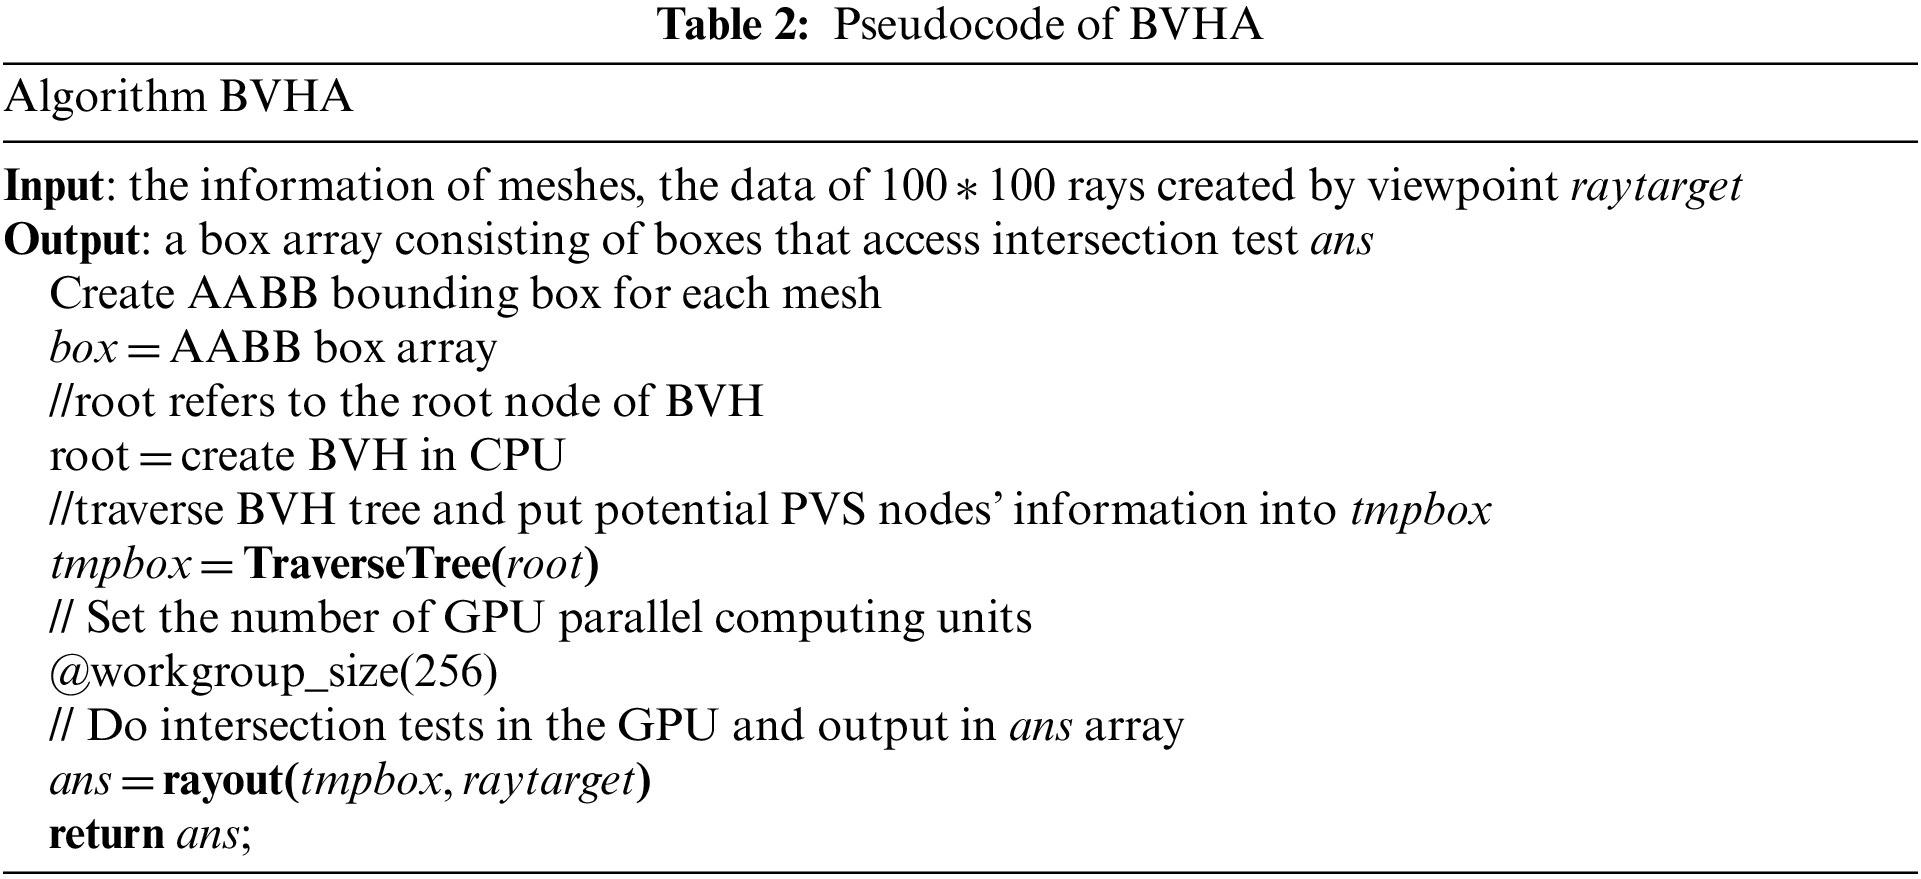
BVHA is combined with the IWCPA and BOCA. The BVH is firstly established to realize the object management in the scene and traverse the BVH to perform intersection testing. Based on it, the computing pipeline will be created, and all the nodes obtained by intersection testing will be input into the pipeline so that the
In the CPU, when traversing the non-leaf nodes, if it intersects with the ray, then continue traversing the corresponding child nodes and judging whether they intersect with the ray. When traversing the leaf nodes, if it intersects with the ray, then the corresponding internal 3D model will be recorded and input into PVS. Finally, the intersection testing for PVS is performed on GPU according to the slab algorithm.
After calculation on GPU, the rays derived from the viewpoint might intersect with many objects, but, due to the occlusion relationships among different objects, the first one intersected with the ray could be observed. Therefore, the nodes obtained by the intersection test will be further selected, and the objects first intersect with the ray will be input into PVS. Then, for the BVHA, the
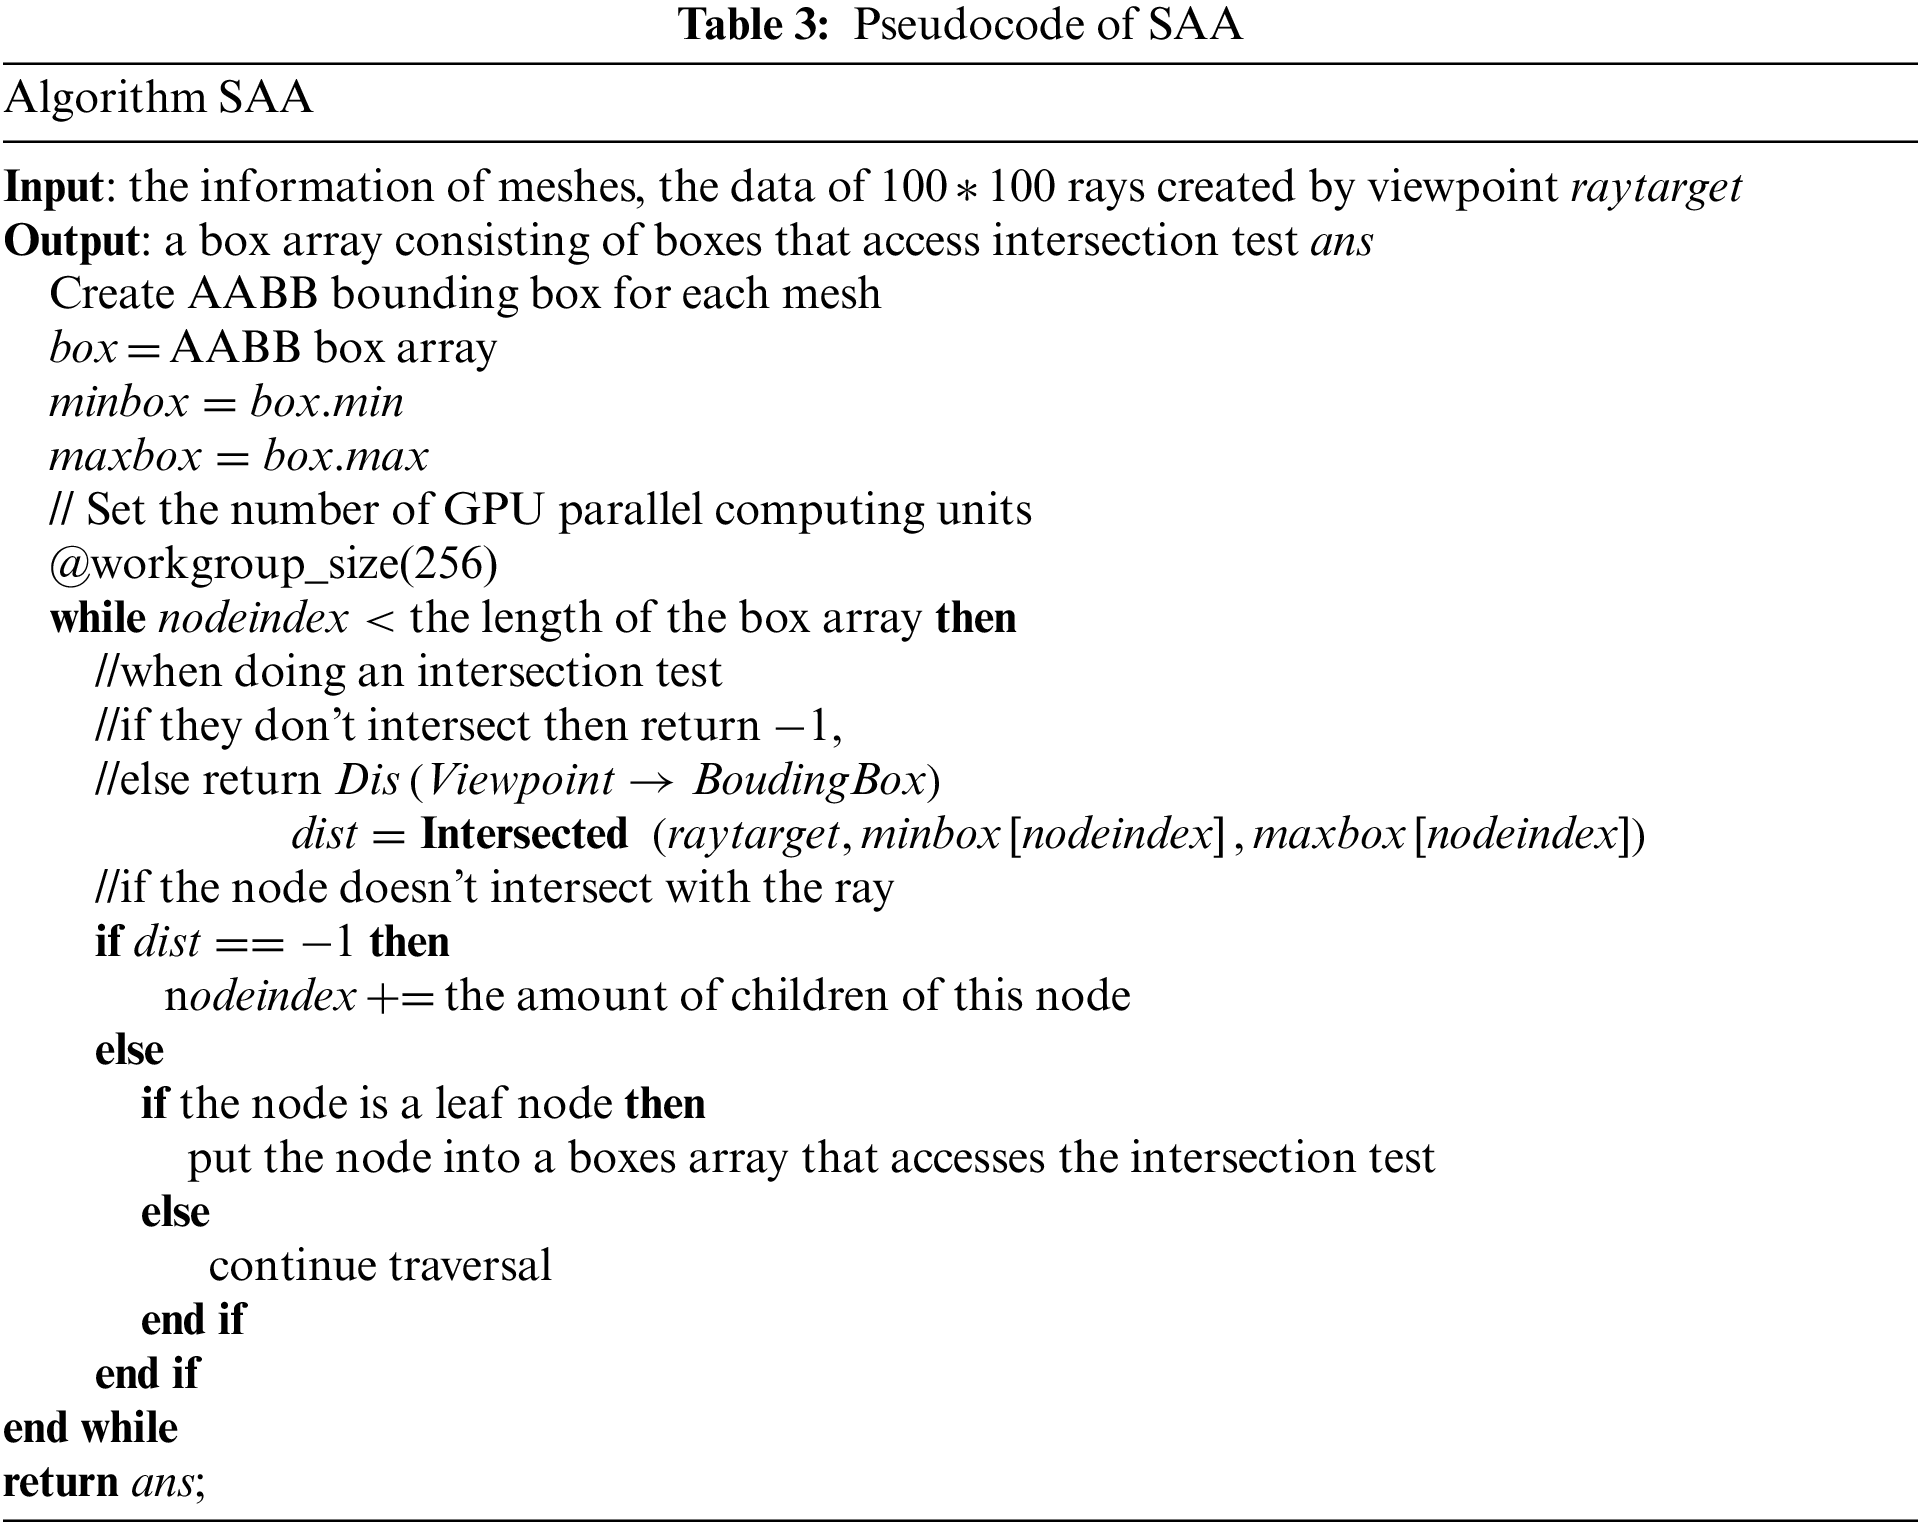
3.4.3 Strategy-Adjustment-Based Algorithm
The main process for SAA is that the computing pipeline is created after constructing BVH. The nodes in the BVH are passed into the computing pipeline in terms of an array according to the order of depth traversal, named
After constructing the AABB and BVH, the subsequent traversal, calculation, and rendering will be performed on GPU. Because the data cannot be transmitted in the form of tree structures, so traversing the BVH in depth-first order, and the results will be restored in the list, and intersection testing will be performed on GPU, which is shown in Fig. 10. If the node passed, continue to judge whether the corresponding sub-nodes exist. If not existing, then the
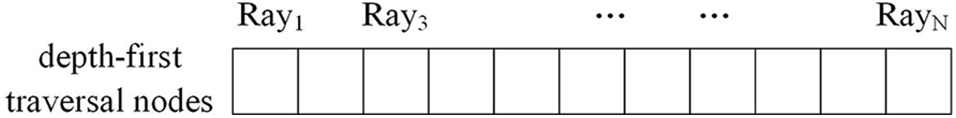
Figure 10: The schematic diagram of the concurrent calculation of SAA
In this paper, five 3D geological models with different scales are selected to verify the rendering efficiencies. The original models are visualized in Fig. 11, and the corresponding statistical information and experimental environment are shown in Tables 4 and 5 respectively.
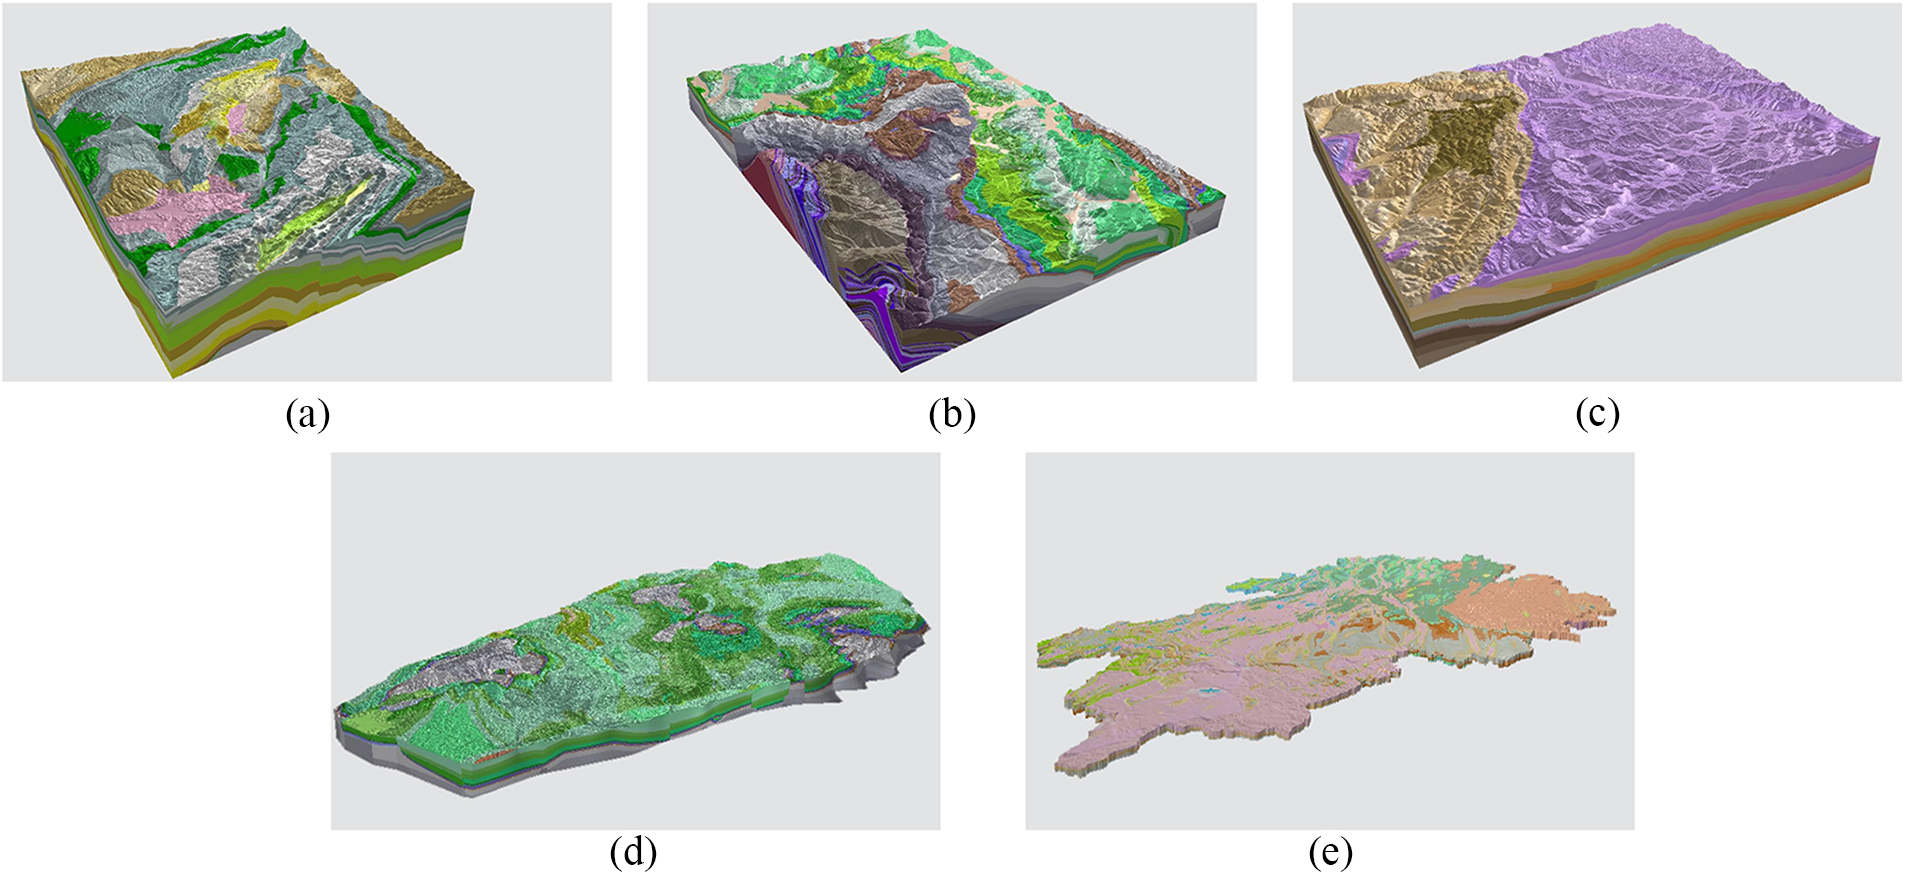
Figure 11: The visualization of original models. (a) represents model 1; (b) represents model 2; (c) represents model 3; (d) represents model 4; (e) represents model 5
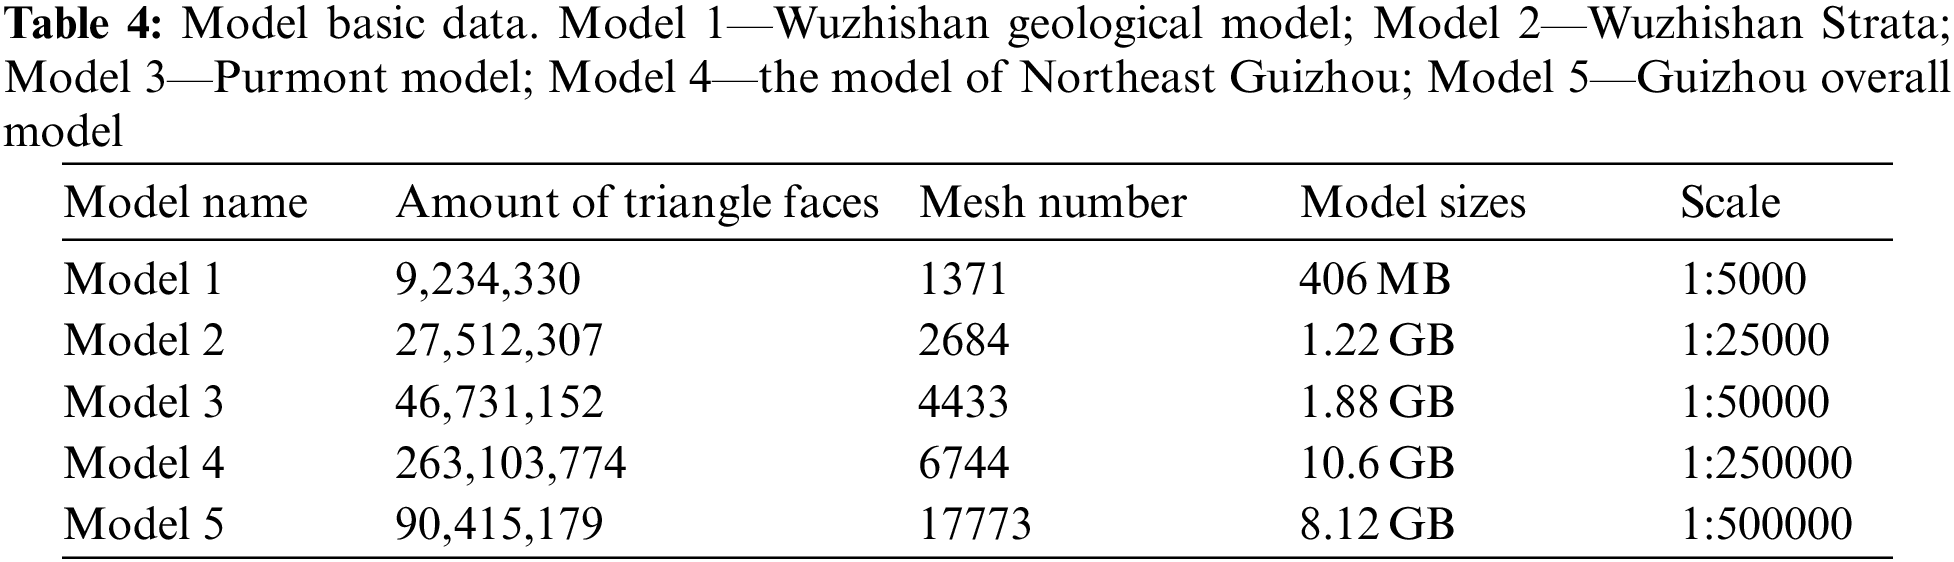
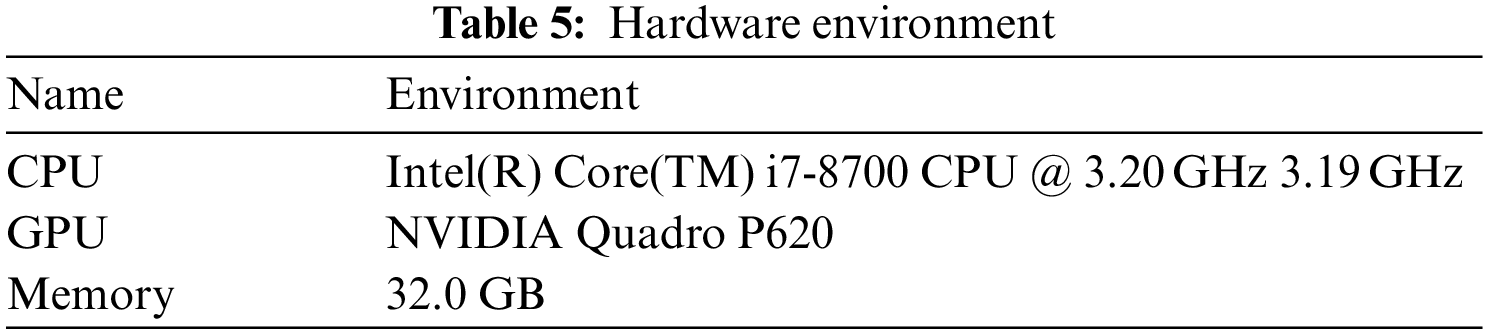
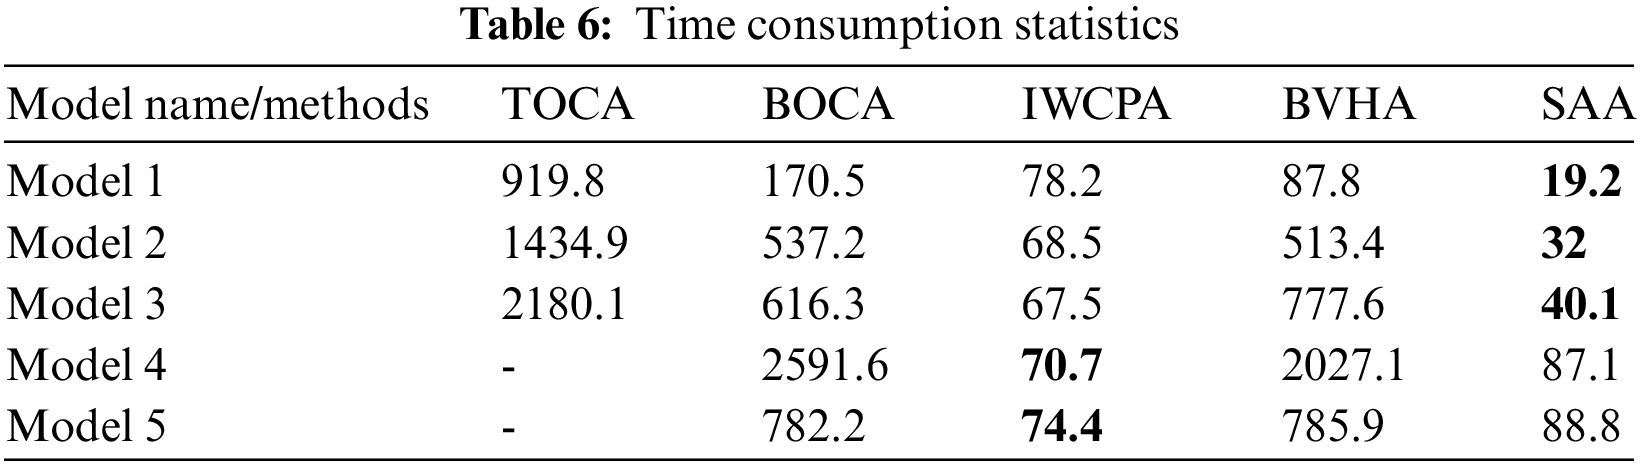
Table 6 represents the rendering time statistical results of five models based on different algorithms. Among them, due to the large scale of models 4 and 5, both of them will cause huge time consumption in TOCA and BOCA, so they will not participate in rendering time comparison analysis. As is seen, the IWCPA rendering efficiencies for all models are greater than the ones of TOCA. However, compared with the ones of BOCA, the rendering efficiencies improve by 54.1%, 87.2%, 89%, 97.3%, and 90.5%. The BVHA rendering time is relatively longer for five models, in which the efficiencies improve by 48.5%, 4.4%, −26.2%, 21.8%, and −0.5% respectively (“–” means the efficiency reduction) respectively compared with the ones of BOCA. SAA has the fastest rendering speed for models 1, 2, and 3, but the rendering speed is relatively slower than the ones of IWCPA for other models, in which the efficiencies improve by 88.74%, 94.04%, 93.49%, 96.64%, and 88.65% respectively compared with BOCA. As a result, SAA has the highest rendering efficiencies for large-volume 3D models, and the IWCPA rendering times consumption cannot be impacted by the model’s volume.
In addition, the coordinate (40000, 0, 0) was selected as the viewpoint V. The model’s center was placed on (0, 0, 0), and 10,000 rays were launched uniformly from V in the visible region according to the length-width ratio of the screen. Fig. 12 represents the results of both occlusion culling and completely rendering ones from the angle of V and overlook respectively. As is shown, the occlusion culling could reduce the rendering numbers, which the result is similar to the complete rendering ones. Meanwhile, the rendering effects of the three proposed methods are the same, because the rendering results mainly depend on the ray distribution and the bounding boxes, and the three proposed methods have the same spread of rays and configuration of bounding boxes, with the same rendering results.
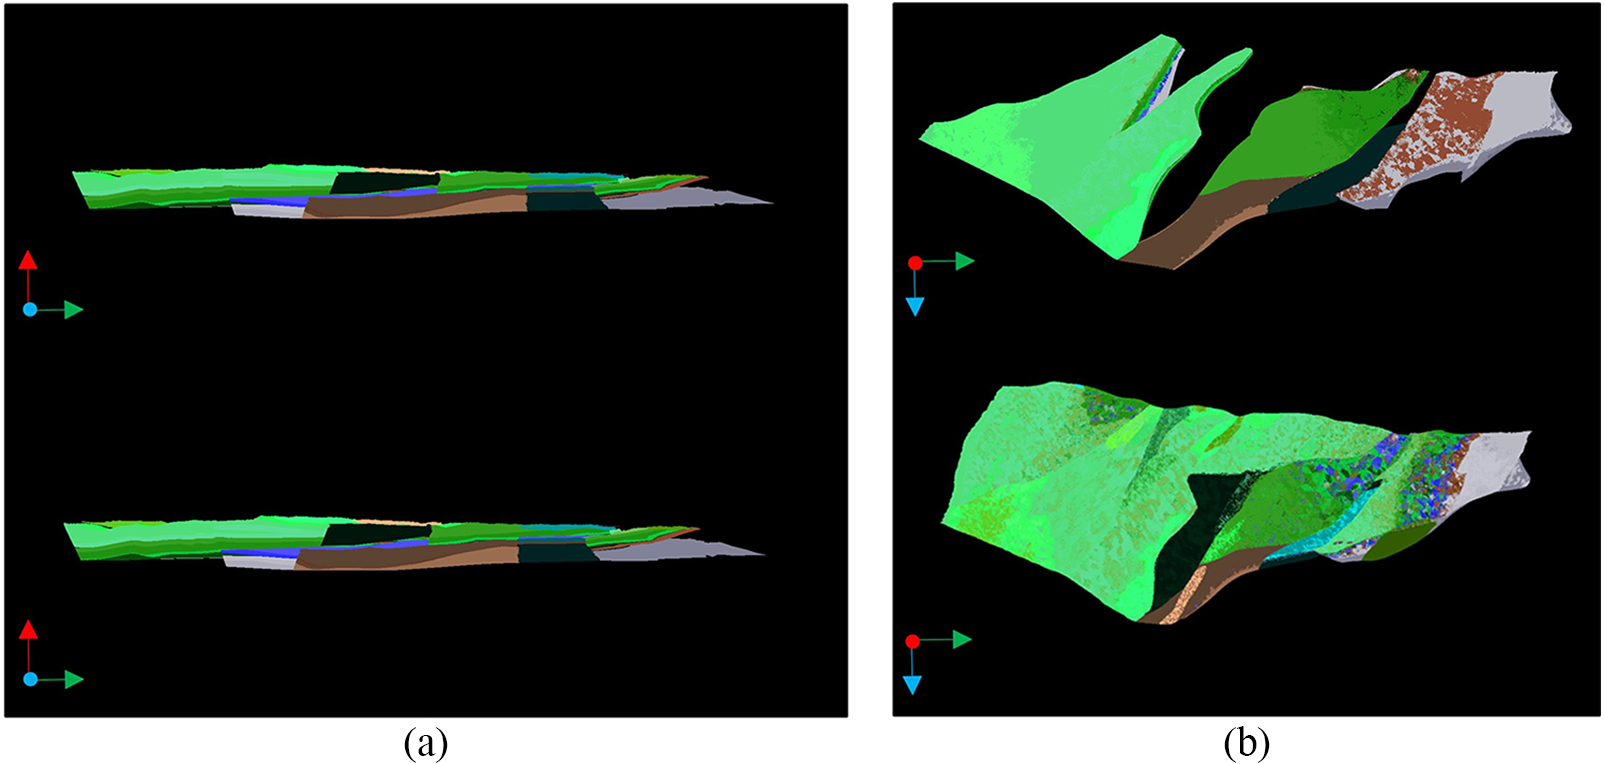
Figure 12: (a) Effect comparison figure from viewpoint; (b) Effect comparison figure of elimination effect
Take model 4 as an example, based on V, the corresponding rendering times are compared and visualized in Fig. 13, in which time consumption is the same in the three proposed methods. Among them, the rendering time for red regions is longer, with more PVS numbers, while the one for green regions is shorter, with fewer PVS numbers. The geological and detailed texture information of the original models is rendered effectively. It indicates that the occlusion culling algorithms mainly focus on the PVS rendering, which can reduce the rendering time consumption of invisible parts, accelerating the whole rendering efficiency with a relatively lower accuracy loss.
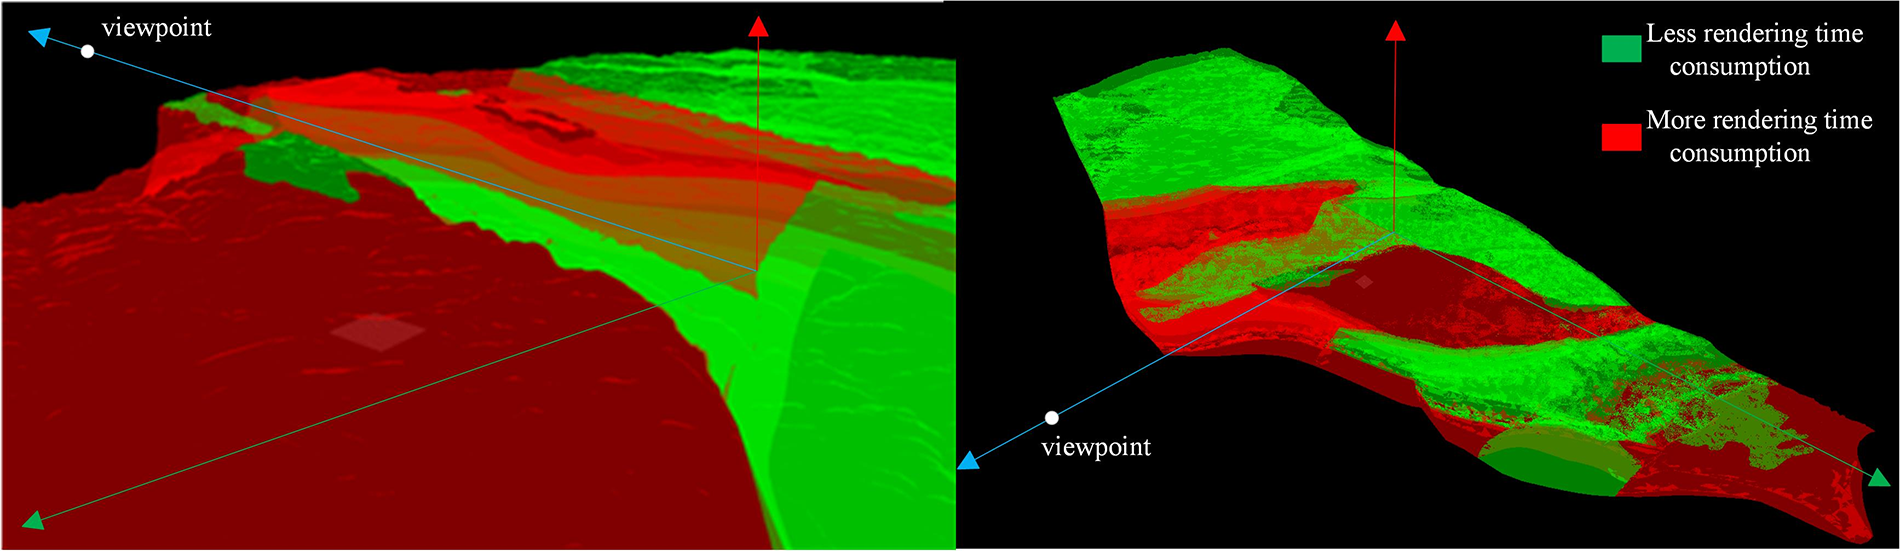
Figure 13: The ratio picture of rendering time consumption
In this paper, due to the problem of longer rendering time for large-scale 3D geological models, the IWCPA, BVHA, and SAA are proposed. For IWCPA, all the bounding boxes and rays are input into GPU to perform parallel computing. The scene management tree is introduced in BVHA, in which the BVH is established to perform intersection testing on the CPU, then the
Acknowledgement: This work is supported by the National Natural Science Foundation of China (42172333, 41902304, U1711267), the fund of the State Key Laboratory of Biogeology and Environmental Geology (2021), Science and Technology Strategic Prospecting Project of Guizhou Province ([2022]ZD003) and the Knowledge Innovation Program of Wuhan-Shuguang Project (2022010801020206). Also, we thank for the reviewers' and editor's careful works about this paper.
Funding Statement: This work is supported by the National Natural Science Foundation of China (42172333, 41902304, U1711267), the fund of the State Key Laboratory of Biogeology and Environmental Geology (2021), Science and Technology Strategic Prospecting Project of Guizhou Province ([2022]ZD003) and the Knowledge Innovation Program of Wuhan-Shuguang Project (2022010801020206).
Author Contributions: The authors confirm contribution to the paper as follows: study conception and design: Liming Ye, Gang Liu, Qiyu Chen; data collection: Kang Li, Junjie Zhang; analysis and interpretation of results: Liming Ye, Genshen Chen; draft manuscript preparation: Liming Ye, Wenyao Fan, Gang Liu, Genshen Chen. All authors reviewed the results and approved the final version of the manuscript.
Availability of Data and Materials: The analysis datasets during the current study are available from the corresponding author on reasonable request (liugang@cug.edu.cn).
Conflicts of Interest: The authors declare that they have no conflicts of interest to report regarding the present study.
References
1. Q. Y. Chen, G. Liu, X. G. Ma, Z. Yao, Y. P. Tian et al., “A virtual globe-based integration and visualization framework for aboveground and underground 3D spatial objects,” Earth Science Informatics, vol. 11, pp. 591–603, 2018. [Google Scholar]
2. M. S. Al-Buriahi, H. O. Tekin, E. Kavaz, B. T. Tonguc and Y. S. Rammah, “New transparent rare earth glasses for radiation protection applications,” Applied Physics A, vol. 125, no. 12, pp. 866, 2019. [Google Scholar]
3. M. Ibrahim, P. Rautek, G. Reina, M. Agus and M. Hadwiger, “Probabilistic occlusion culling using confidence maps for high-quality rendering of large particle data,” IEEE Transactions on Visualization and Computer Graphics, vol. 28, no. 1, pp. 573–582, 2021. [Google Scholar] [PubMed]
4. G. B. Lee, M. Jeong, Y. Seok and S. Lee, “Hierarchical raster occlusion culling,” Computer Graphics Forum, vol. 40, no. 2, pp. 489–495, 2021. [Google Scholar]
5. M. Secu, C. Secu and C. Bartha, “Optical properties of transparent rare-earth doped sol-gel derived nano-glass ceramics,” Materials, vol. 14, no. 22, pp. 68–71, 2021. [Google Scholar]
6. M. Steinbeck, R. Koschke and M. O. Rudel, “Comparing the evostreets visualization technique in two-and three-dimensional environments a controlled experiment,” in 2019 IEEE/ACM 27th Int. Conf. on Program Comprehension (ICPC), Montreal, MTL, Canada, pp. 231–242, 2019. [Google Scholar]
7. M. L. Hänel, J. Völkel and D. Henrich, “Multi camera placement via Z-buffer rendering for the optimization of the coverage and the visual hull,” arXiv preprint arXiv:2103.11211, 2021. [Google Scholar]
8. D. Corbalan-Navarro, J. L. Aragón, M. Anglada, E. De Lucas, J. M. Parcerisa et al., “Omega-test: A predictive early-z culling to improve the graphics pipeline energy-efficiency,” IEEE Transactions on Visualization and Computer Graphics, vol. 28, no. 12, pp. 4375–4388, 2021. [Google Scholar]
9. J. Bittner, M. Wimmer, H. Piringer and W. Purgathofer, “Coherent hierarchical culling: Hardware occlusion queries made useful,” Computer Graphics Forum, vol. 23, no. 3, pp. 615–624, 2004. [Google Scholar]
10. G. B. Lee and S. Lee, “Iterative GPU occlusion culling with BVH,” in Proc. High Performance Graphics, New York, NY, USA, pp. 1–2, 2022. [Google Scholar]
11. Y. P. Tian, C. L. Wu, Z. P. Weng, G. Liu, Z. T. Zhang et al., “Key technologies of geological big data visualization,” Bulletin of Geological Science and Technology, vol. 39, no. 4, pp. 29–36, 2020. [Google Scholar]
12. G. Liu, L. X. Ye, Q. Y. Chen, G. S. Chen and W. Y. Fan, “Abnormal event detection of city slope monitoring data based on multi-sensor information fusion,” Bulletin of Geological Science and Technology, vol. 41, no. 2, pp. 13–25, 2022. [Google Scholar]
13. Ł. Zawistowicz, “Occlusion culling method for visualization of urbanized areas,” M.S. Dissertation, Jagiellonian University, Poland, 2018. [Google Scholar]
14. D. Ganter and M. Manzke, “An analysis of region clustered BVH volume rendering on GPU,” Computer Graphics Forum, vol. 38, no. 8, pp. 13–21, 2019. [Google Scholar]
15. M. Schütz, B. Kerbl and M. Wimmer, “Rendering point clouds with compute shaders and vertex order optimization,” Computer Graphics Forum, vol. 40, no. 4, pp. 115–126, 2021. [Google Scholar]
16. G. Liu, C. L. Wu, Z. W. He, Z. P. Weng, Q. Zhu et al., “Design and application of 3D spatial database model for integrated management of aboveground and underground features,” Earth Science/Diqiu Kexue, vol. 36, no. 2, pp. 208, 2011. [Google Scholar]
17. Y. Wang, T. Lian, M. Wu and Q. Gao, “Point cloud registration based on octree and kd-tree index,” Eng. Surv. Mapp, vol. 26, pp. 35–40, 2017. [Google Scholar]
18. A. Majercik, C. Crassin, P. Shirley and M. McGuire, “A ray-box intersection algorithm and efficient dynamic voxel rendering,” Journal of Computer Graphics Techniques, vol. 7, no. 3, pp. 66–81, 2018. [Google Scholar]
19. J. Hladky, H. P. Seidel and M. Steinberger, “The camera offset space: Real-time potentially visible set computations for streaming rendering,” ACM Transactions on Graphics (TOG), vol. 38, no. 6, pp. 1–14, 2019. [Google Scholar]
20. A. Aldahir, “Evaluation of the performance of WebGPU in a cluster of WEB-browsers for scientific computing.” B.S. Dissertation, Umea University, Sweden, 2022. [Google Scholar]
21. N. Nguyen, “WebGPU-The new powerful successor, the future of web API,” B.S. Dissertation, South-Eastern Finland University of Applied Sciences, Finland, 2022. [Google Scholar]
22. T. Akenine-Möller, E. Haines and N. Hoffman, Real-Time Rendering. Boca Raton, FL, USA: Crc Press, 2019. [Google Scholar]
23. L. Dyken, P. Poudel, W. Usher, S. Petruzza, J. Y. Chen et al., “Graphwagu: GPU powered large scale graph layout computation and rendering for the Web,” in Eurographics Symp. on Parallel Graphics and Visualization, Rome, ROM, Italy, pp. 73–83, 2022. [Google Scholar]
24. R. C. Wang and D. Manocha, “Dynamic coherence-based EM ray tracing simulations in vehicular environments,” in 2022 IEEE 95th Vehicular Technology Conf.: (VTC2022-Spring), Helsinki, HEL, Finland, pp. 1–7, 2022. [Google Scholar]
25. M. Drewes and J. Hajer, “Heavy neutrinos in displaced vertex searches at the LHC and HL-LHC,” Journal of High Energy Physics, vol. 2020, no. 2, pp. 1–23, 2020. [Google Scholar]
26. Q. Y. Chen, G. Liu, X. C. Li, Z. T. Zhang and Y. Li, “A corner-point-grid-based voxelization method for the complex geological structure model with folds,” Journal of Visualization, vol. 20, pp. 875–888, 2017. [Google Scholar]
27. L. Liu, W. Chang, F. Demoullin, Y. H. Chou, M. Saed et al., “Intersection prediction for accelerated GPU ray tracing,” in MICRO-54: 54th Annual IEEE/ACM Int. Symp. on Microarchitecture, Athens, ATH, Greece, pp. 709–723, 2021. [Google Scholar]
Cite This Article
 Copyright © 2023 The Author(s). Published by Tech Science Press.
This work is licensed under a Creative Commons Attribution 4.0 International License , which permits unrestricted use, distribution, and reproduction in any medium, provided the original work is properly cited.
 Downloads
 Citation Tools