
 Submit a Paper
 Propose a Special lssue
 Open Access
ARTICLE
Rockburst Intensity Grade Prediction Model Based on Batch Gradient Descent and Multi-Scale Residual Deep Neural Network
1 School of Electrical and Information Engineering, Beijing University of Civil Engineering and Architecture, Beijing, 100044, China
2 Beijing Key Laboratory of Intelligent Processing for Building Big Data, Beijing University of Civil Engineering and Architecture, Beijing, 100044, China
3 State Key Laboratory for GeoMechanics and Deep Underground Engineering, China University of Mining & Technology, Beijing, 100083, China
* Corresponding Author: Mingkui Zhang. Email:
Computer Systems Science and Engineering 2023, 47(2), 1987-2006. https://doi.org/10.32604/csse.2023.040381
Received 16 March 2023; Accepted 20 April 2023; Issue published 28 July 2023
 View Full Text
 Download PDF
Abstract
Rockburst is a phenomenon in which free surfaces are formed during excavation, which subsequently causes the sudden release of energy in the construction of mines and tunnels. Light rockburst only peels off rock slices without ejection, while severe rockburst causes casualties and property loss. The frequency and degree of rockburst damage increases with the excavation depth. Moreover, rockburst is the leading engineering geological hazard in the excavation process, and thus the prediction of its intensity grade is of great significance to the development of geotechnical engineering. Therefore, the prediction of rockburst intensity grade is one problem that needs to be solved urgently. By comprehensively considering the occurrence mechanism of rockburst, this paper selects the stress index (), brittleness index (), and rock elastic energy index () as the rockburst evaluation indexes through the Spearman coefficient method. This overcomes the low accuracy problem of a single evaluation index prediction method. Following this, the BGD-MSR-DNN rockburst intensity grade prediction model based on batch gradient descent and a multi-scale residual deep neural network is proposed. The batch gradient descent (BGD) module is used to replace the gradient descent algorithm, which effectively improves the efficiency of the network and reduces the model training time. Moreover, the multi-scale residual (MSR) module solves the problem of network degradation when there are too many hidden layers of the deep neural network (DNN), thus improving the model prediction accuracy. The experimental results reveal the BGD-MSR-DNN model accuracy to reach 97.1%, outperforming other comparable models. Finally, actual projects such as Qinling Tunnel and Daxiangling Tunnel, reached an accuracy of 100%. The model can be applied in mines and tunnel engineering to realize the accurate and rapid prediction of rockburst intensity grade.Keywords
Rockburst is a sudden geological disaster that can cause significant damage within a short time period [1], including damage to engineering equipment, disturbing the construction progress, and threatening the personal safety of workers [2]. South African gold mines frequently suffer rockburst disasters. From 1975 to 1993, more than 3,000 workers died in rockburst accidents [3]. In recent years, nearly 200 coal mine projects have potentially experienced rockburst in China, more than 50 of which are ultra-deep coal mines above 800 m [4]. The rockburst frequency and damage degree increase with the mining depth [5]. The rockburst intensity grade determines the degree of damage caused by rockburst disasters. However, the complexity and suddenly of rockburst currently prevent the accurate prediction of the occurrence intensity. Therefore, numerous scholars have placed much attention on the prediction of the rockburst intensity grade [6–8].
Research on the prediction of rockburst intensity grade generally employs the single evaluation index prediction method and the comprehensive evaluation indexes prediction method. The most popular single evaluation index prediction methods include the E. Hoek method, the Turchaninov method, the Russenes criterion, etc. [9]. However, this approach only considers a few influencing factors and has the disadvantage of inaccurate prediction results. The comprehensive evaluation indexes prediction method was proposed for the complex mechanism of rockburst formation and has shown strong applicability in predicting the intensity grade of rockburst [10]. More and more scholars have applied machine learning and deep learning to predict the rockburst intensity grade [11–13]. Chen et al. [14] used the variable weight theory to optimize the weight of the prediction index and calculated the grade variable interval via the Matter-element extension theory, providing a new method for rockburst prediction in underground engineering. Pu et al. [15] relabeled original data following dimensionality reduction using an unsupervised learning method and subsequently applied a trained support vector classifier (SVC) model to output the rockburst intensity grade. Li et al. [16] used the kernel principal component analysis method and the improved support vector machine (SVM) to process the rockburst prediction indicators and perform sample training, achieving an accurate prediction effect. Ahmad et al. [17] designed an adaptive boosting classifier model for rockburst intensity classification through the AdaBoost algorithm. Li et al. [18] combined deep learning and ensemble models to propose a deep forest model with an outstanding predictive ability for rockburst disasters. Li et al. [19] proposed a rockburst intensity estimation method based on the improved entropy weight method-similar cloud model (IEWM-SCM), solving the inaccurate objective weight problem of the traditional entropy weight method.
In recent years, deep neural networks have been widely adopted in the prediction of rockburst intensity grade. Yin et al. [20] established an integrated model based on DNN, discussed the impact of unbalanced data sets on model accuracy and the fitting effect, and demonstrated the unique advantages of the ensemble model when dealing with imbalanced datasets. Gong et al. [21] proposed a prediction model based on the dropout and improved the Adam-based deep neural network (DA-DNN), which avoids the problem of determining the indicator weights, is entirely data-driven, reduces the influence of human factors, and can achieve deep relational learning in noisy, limited datasets. Cao et al. [22] proposed a deep neural network based on knowledge and data fusion, FDNet, which solves the multi-index screening problem of microseismic mining data with a high accuracy and robustness. Zhang [23] combined a DNN with Internet of Things technology to design a new multi-parameter monitoring platform for CM-induced rockburst, providing a new approach for the application of the rockburst industry.
Although the aforementioned rockburst intensity grade prediction methods have made much progress in the research field, they are generally associated with long training times and low accuracy. The length of model training time determines the progress of prediction research, and the accuracy of model prediction is more important. The consequences caused by false alarms in actual engineering are unimaginable, not only causing property damage but also endangering the personal safety of workers. To solve these two limitations, the current paper proposes and establishes the BGD-MSR-DNN rockburst intensity grade prediction model based on batch gradient descent and multi-scale residual deep neural network [24,25]. More specifically, the three rockburst evaluation indexes of stress index (
2.1 Model Implementation Process
The implementation process of the BGD-MSR-DNN rockburst intensity grade prediction model includes data pre-processing, model establishment, and model prediction, as shown in Fig. 1.
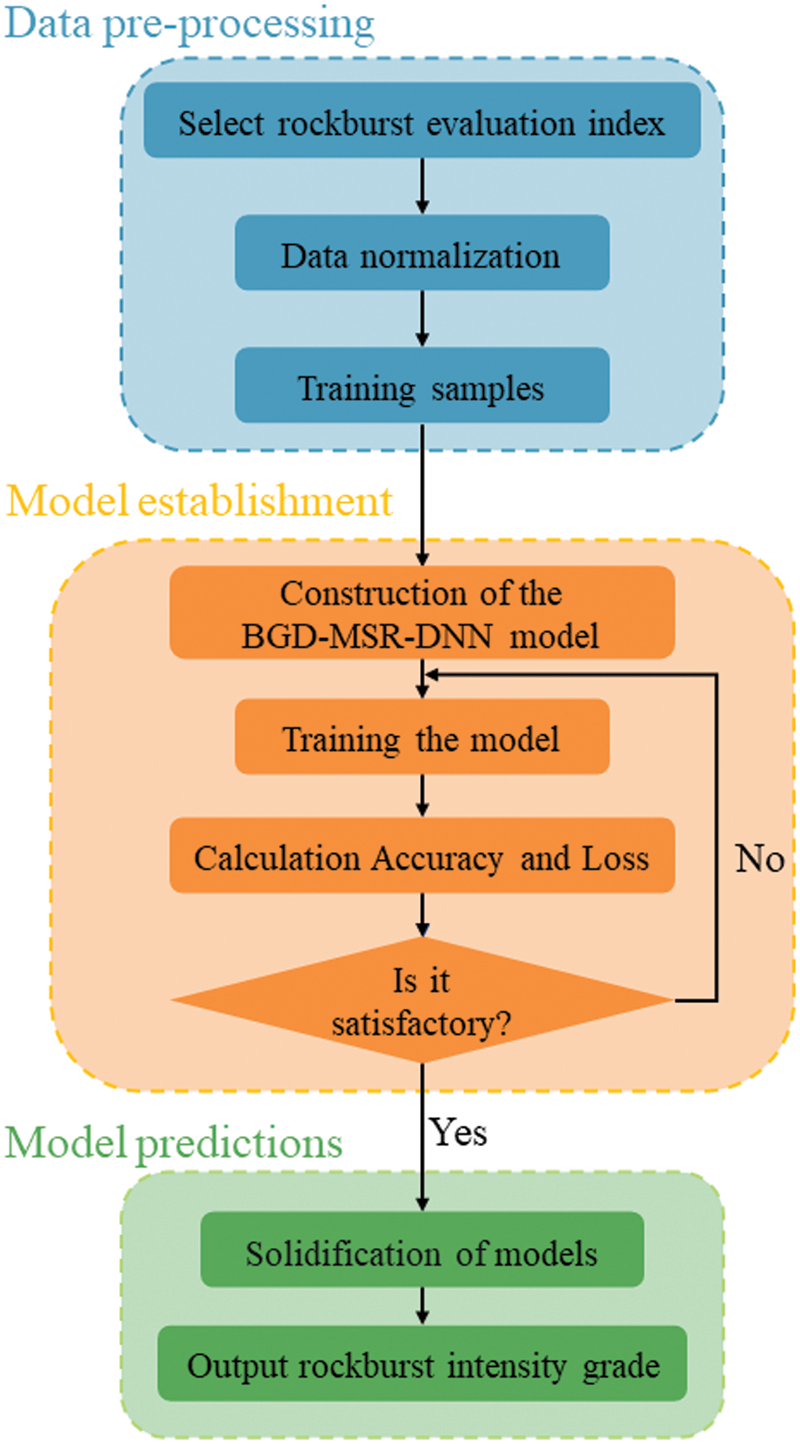
Figure 1: Model implementation process
The data pre-processing part takes typical rockburst sample data worldwide as data sets, selects the optimal based on multiple rockburst evaluation indexes, and normalizes the training samples before inputting them into the model. This step saves the time cost of the rockburst intensity grade and helps improve the accuracy of predicting the rockburst intensity grade. The model establishment part builds and trains the BGD-MSR-DNN model, calculates the Accuracy and Loss indicators of the model, and determines whether the two indicators meet the requirements. If the requirements are met, the model enters prediction step. If not, the model is retrained. The model predictions part solidifies the model, ensuring it meets the requirements. It inputs the rockburst sample data to be tested into the model and outputs the rockburst intensity grade.
Fig. 2 presents the overall framework of the BGD-MSR-DNN rockburst intensity grade prediction model established in this paper.
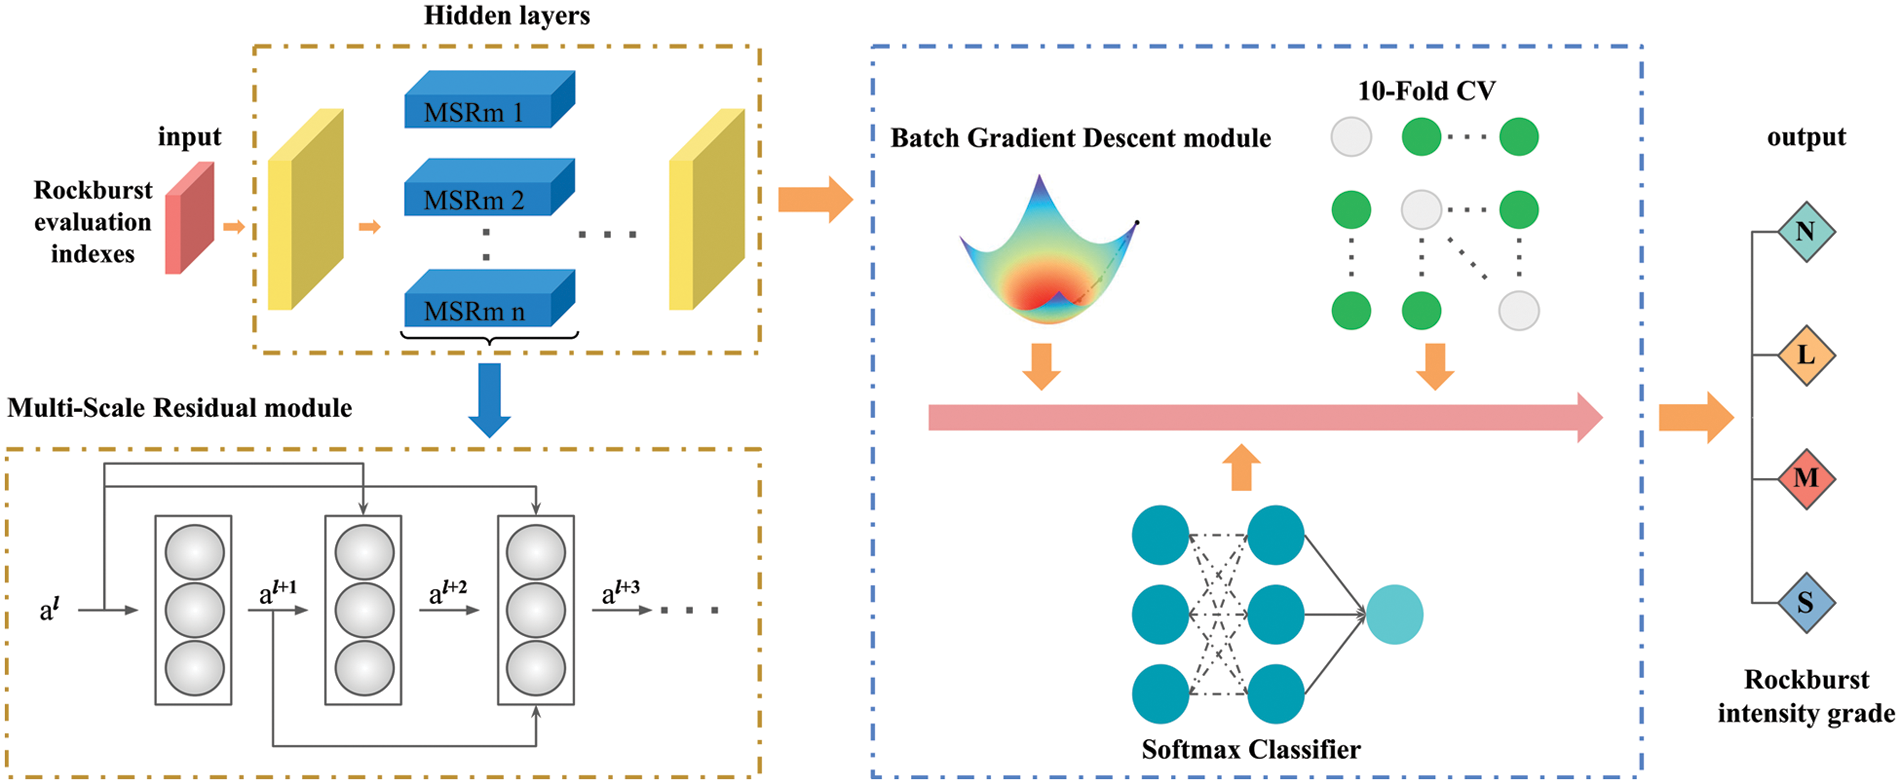
Figure 2: The overall framework of the BGD-MSR-DNN model
The BGD-MSR-DNN model adds an MSR module to the hidden layer of the DNN. Different connection methods in the module can make
Step 1: Take the rockburst evaluation indexes as the model input, normalize the data, improve gradient descent efficiency to determine the optimal solution, and accelerate the convergence speed. The specific equation is as follows:
where
Step 2: In the DNN forward propagation algorithm, parameter
To improve the convergence speed of the model, this paper uses the BGD module to optimize the backpropagation algorithm and selects the cross-entropy loss function. Then the loss function
where
Obtaining
where
Step 3: In a deep neural network, the more network layers, the larger the function space. In theory, the model’s performance will improve as the neural network’s depth deepens. Therefore, when constructing a DNN structure, as the number of network layers increases, the extracted features will be more prosperous and more abstract, and the classification accuracy will be higher [27]. However, the network’s performance does not improve with the increase of network layers. On the contrary, there will be a phenomenon of network degradation in which the accuracies of the training and test sets decrease. This results in problems such as decreased model accuracy and low generalization ability [28]. In this paper, MSR module is added to the model to solve the problem of network degradation when there are too many hidden layers in the DNN. In the multiscale residual module,
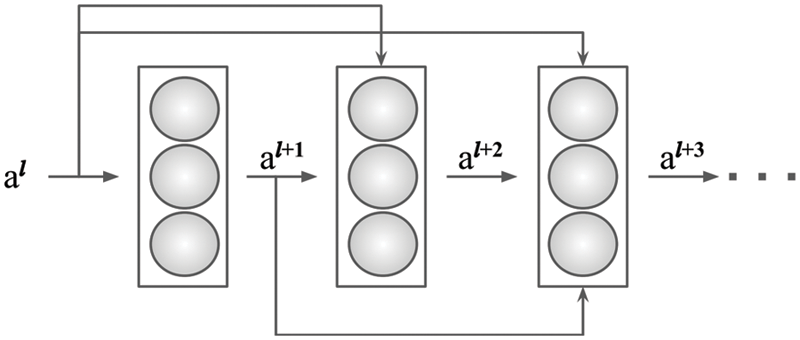
Figure 3: The MSR module structure
Step 4: The rockburst intensity grade prediction is a multi-classification problem, and thus the output component of the proposed model employs the Softmax activation function [29], which is described as follows:
In Eq. (10),
Step 5: To improve the model’s generalization ability, this paper first adopts a 10-fold cross-validation method [30] to randomly divide the rockburst sample data into 10 parts, nine of which are for training, and one is for verification. The training and verification process is performed 10 times and the optimal of the 10 prediction results
To verify the performance of the BGD-MSR-DNN model, this paper collected 350 sample data of rockburst from global research related to rockburst, including 149 data from [31], 129 data from [32], 68 data from [33], and 4 data from [34] (Table 1), including projects related to mine engineering, deep tunnels, and large underground caverns worldwide. The data includes the maximum tangential stress of the surrounding rock of the cave wall (
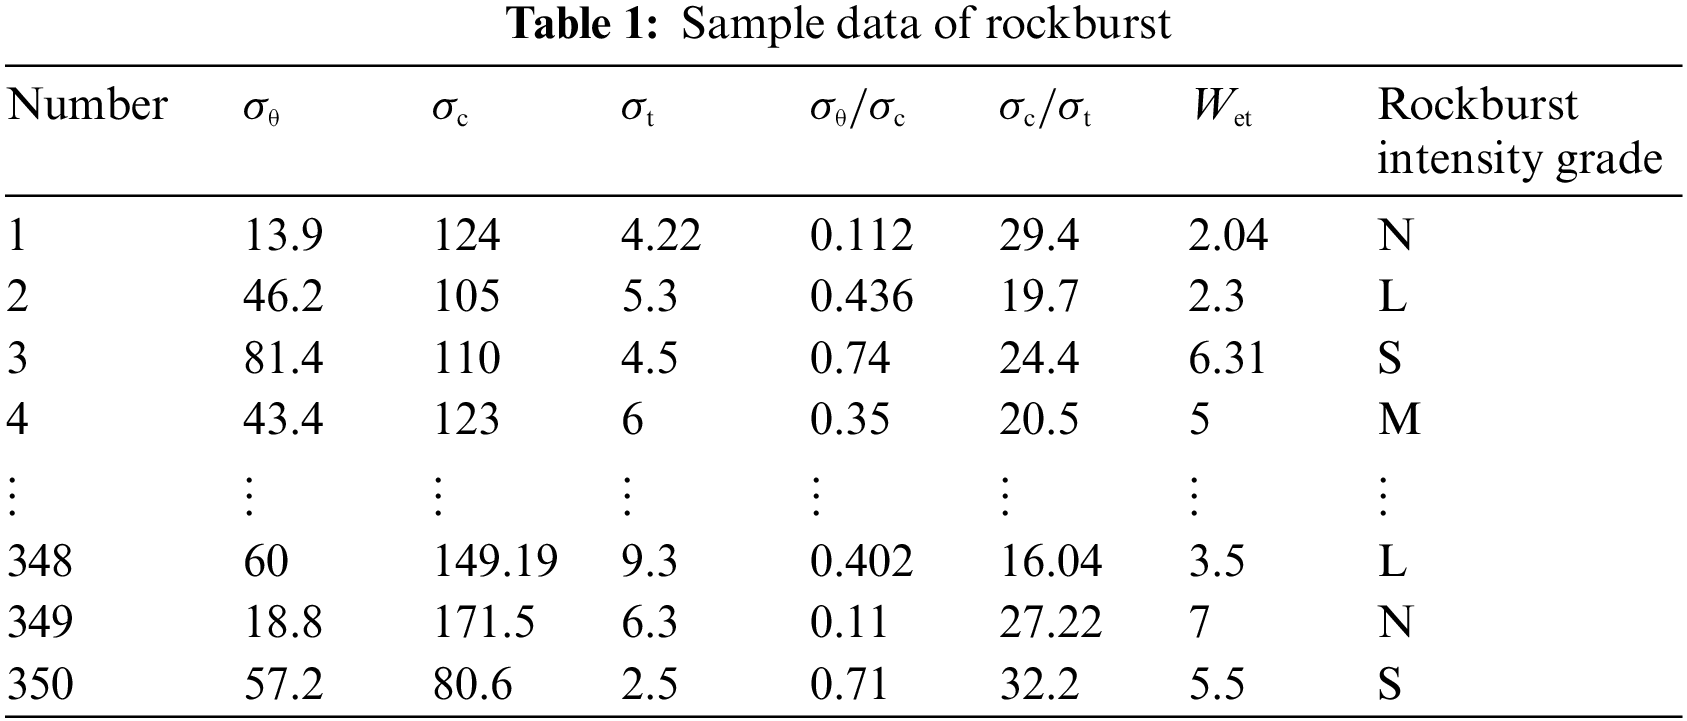
Among the 350 rockburst samples, there were 51 cases (14.6%) of none rockburst, 104 cases (29.7%) of light rockburst, 138 cases (39.4%) of moderate rockburst, and 57 cases of strong rockburst (16.3%). The proportion of samples of each category is shown in Fig. 4. The data quantity of the moderate rockburst sample is significantly higher than that of the other three sample data. This results in an unbalanced sample category, which leads to inaccurate experimental results. To reduce the impact of this phenomenon on the experiment, this paper uses random undersampling to randomly select samples from the moderate rockburst category to form data sets [35].
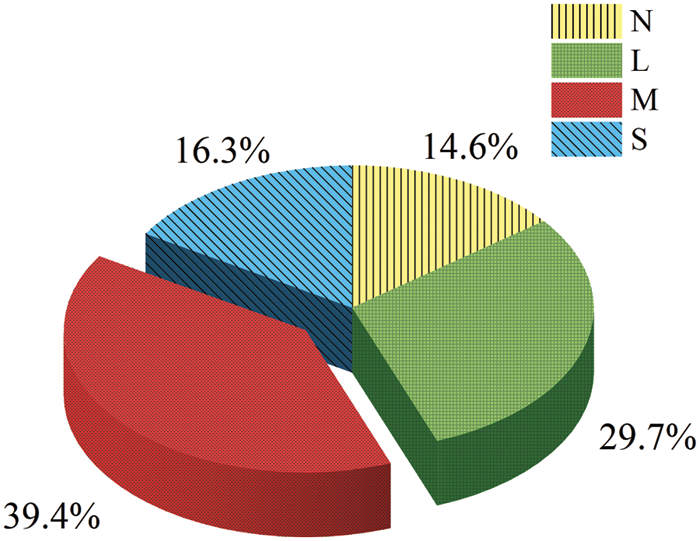
Figure 4: The proportion of samples of each category
3.2 Selection of Rockburst Evaluation Indexes
Rockburst occurrence is a function of numerous factors and its formation mechanism is complex. Table 2 reports the rockburst intensity grade criteria proposed by scholars based on the factors affecting rockburst [36], where
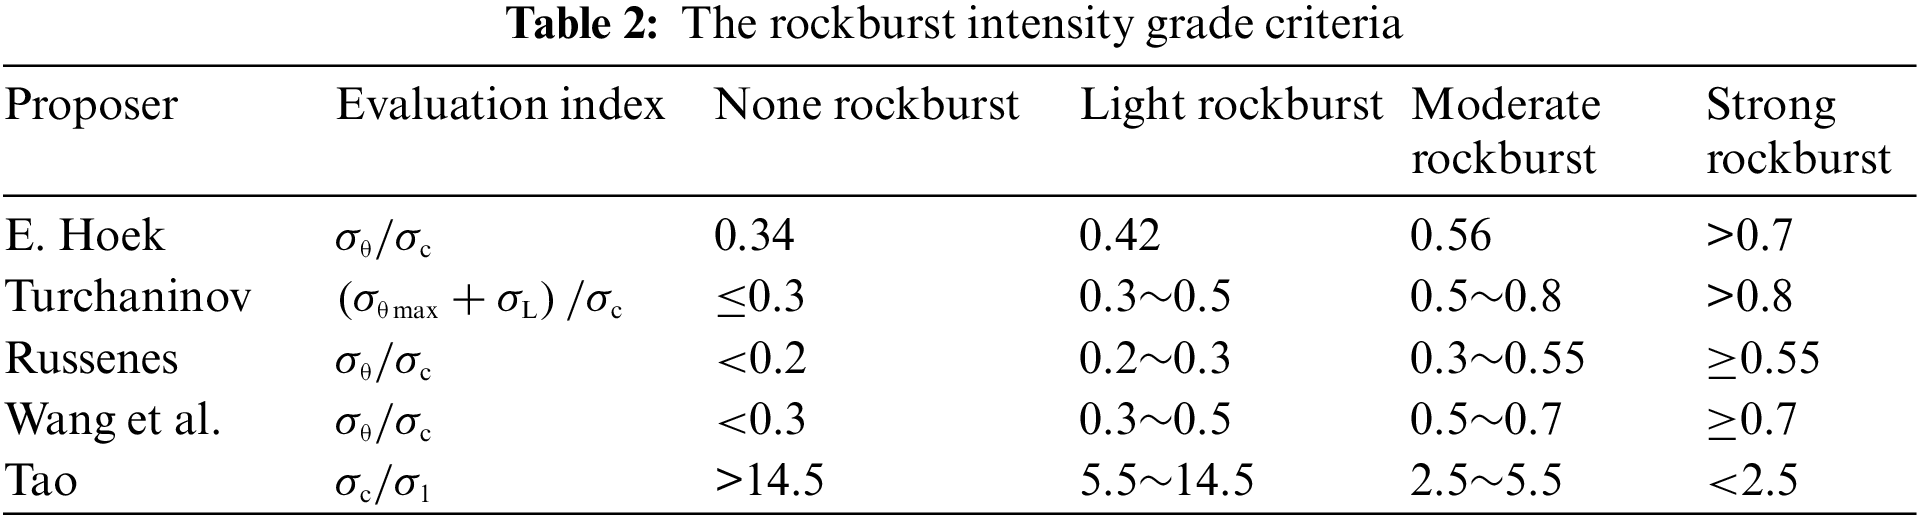
It can be seen from Table 2, all the proposed approaches use a single evaluation index, and thus their prediction effect is not ideal. Due to the complex mechanism of rockburst and many influencing factors, the correlation between evaluation index will affect the prediction results of rockburst intensity grade. In order to improve the prediction performance of the model, this paper uses the Spearman coefficient method to obtain and analyze the correlation coefficient between the evaluation index, as shown in Table 3.
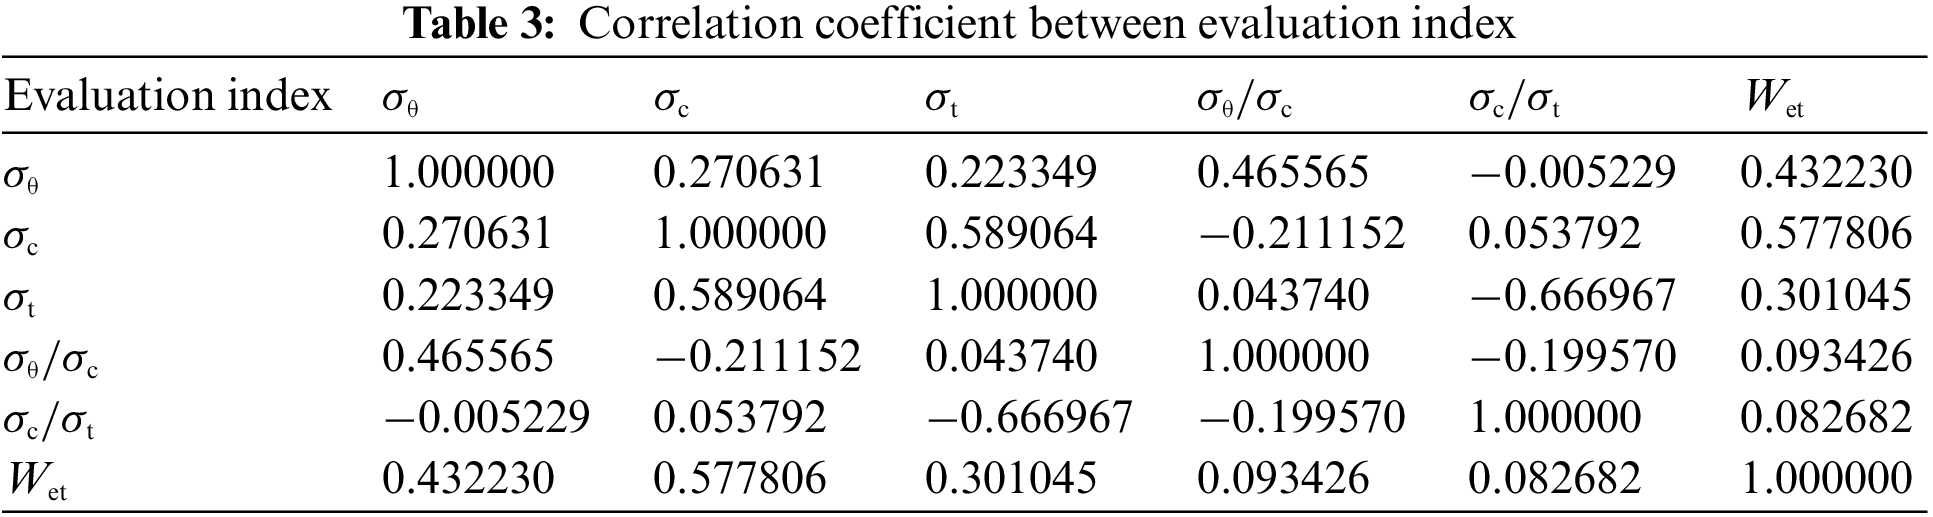
The correlation coefficient indicates the degree of linear correlation between each index in the rockburst sample data. Table 3 reveals that the majority of the correlation coefficients between each index are below 0.5 after the analysis using the Spearman coefficient method, with a moderate, weak, very weak, or no correlation. To further improve the accuracy of model prediction, this paper selects
According to the optimal rockburst evaluation indexes selected in Section 3.2, with
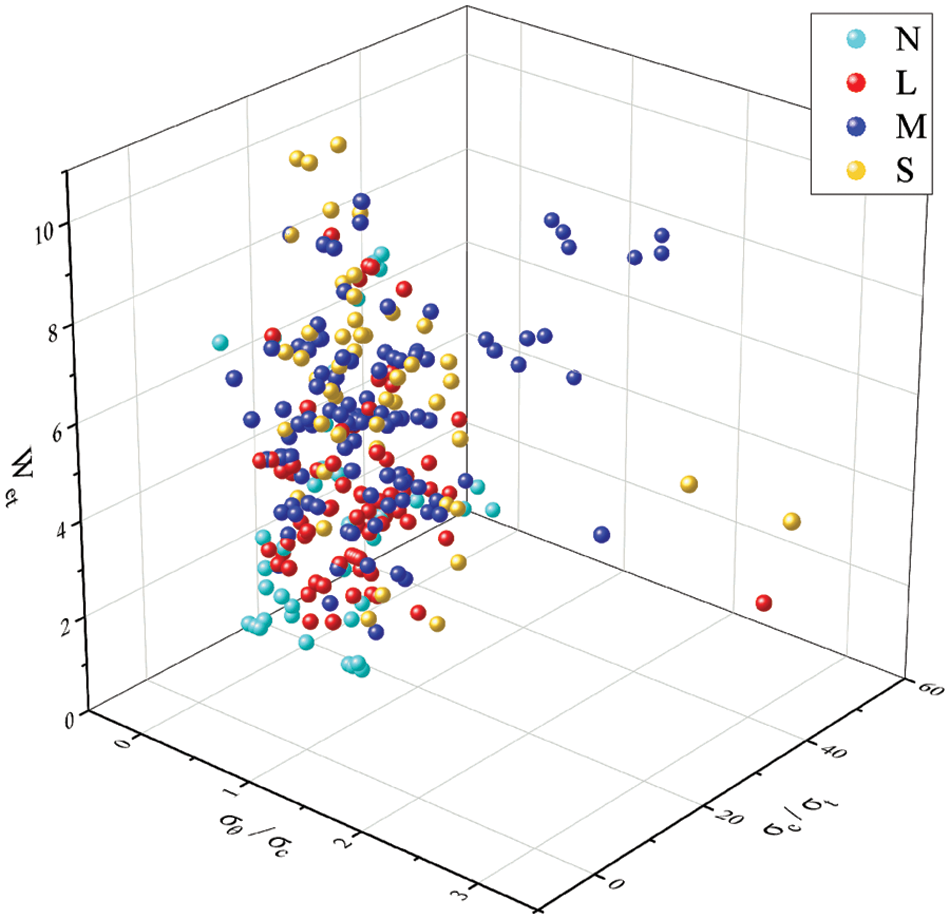
Figure 5: A three-dimensional distribution graph of rockburst sample data
To further evaluate the rockburst sample data, outliers were detected using boxplots of the three evaluation indexes
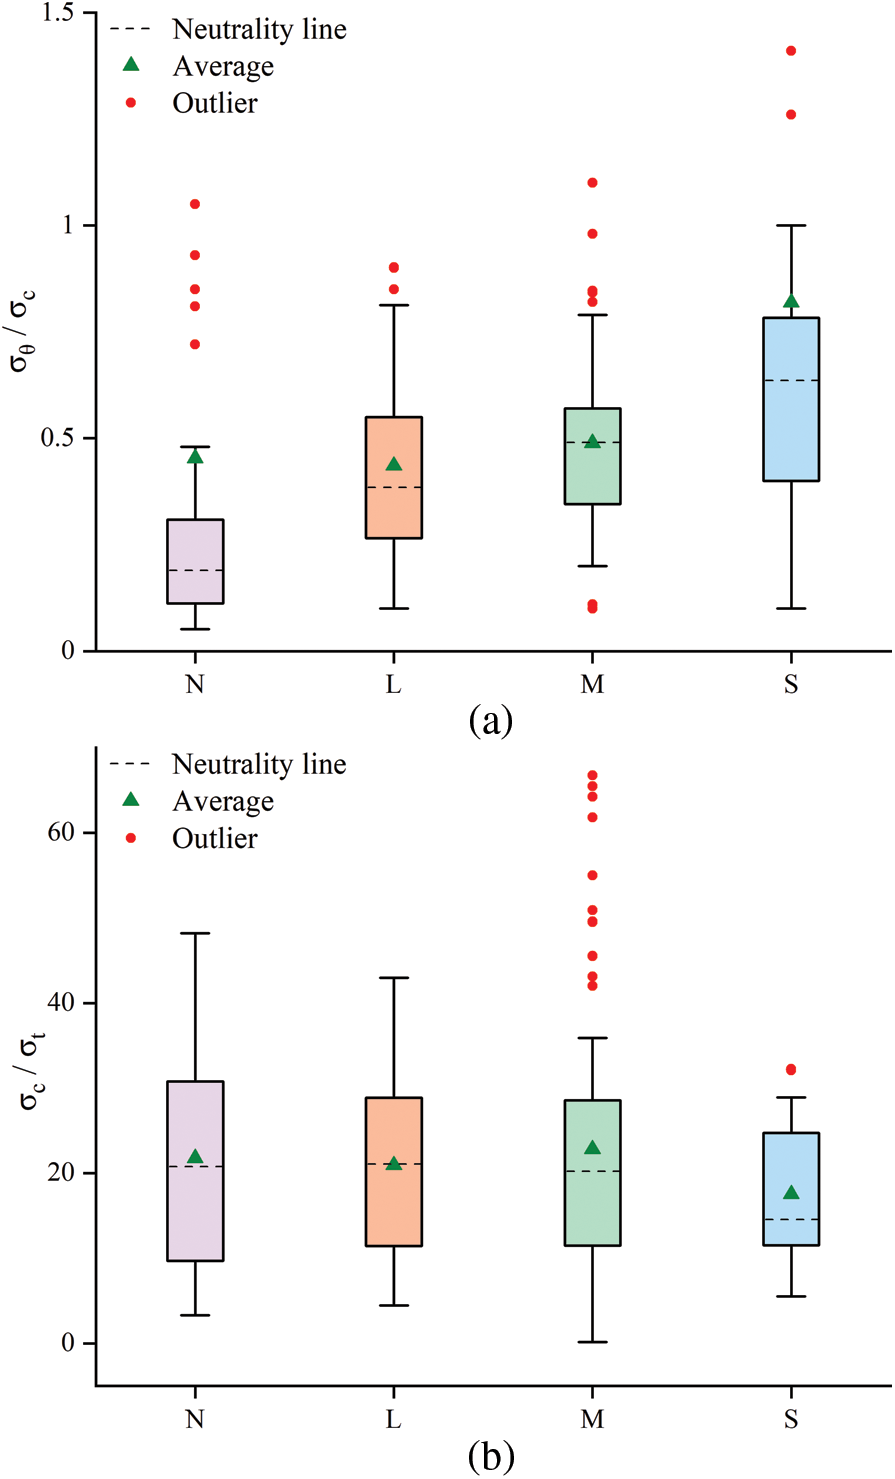
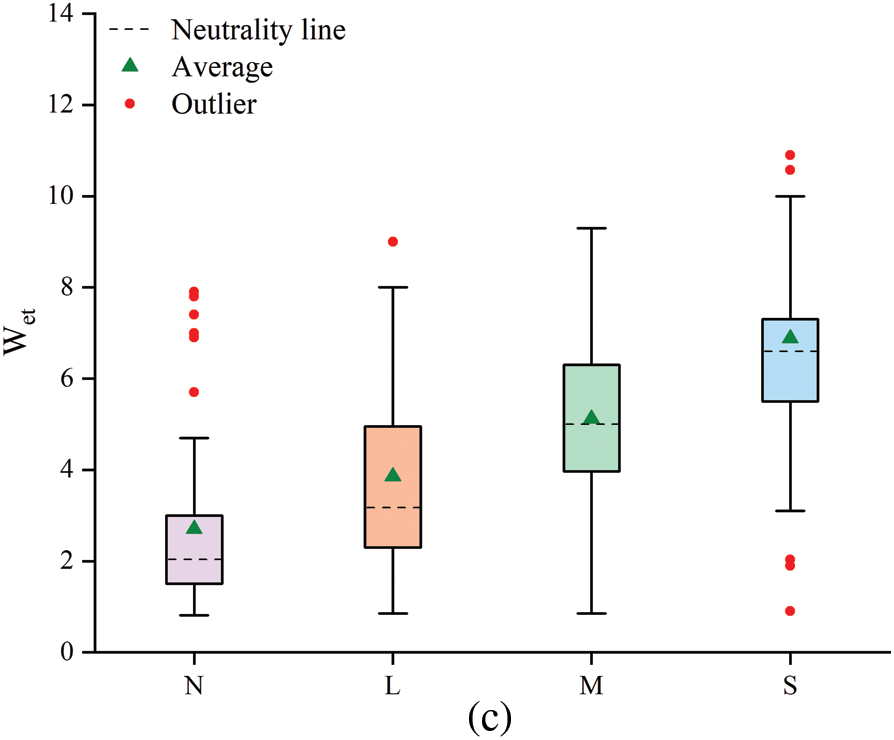
Figure 6: Box plot of rockburst evaluation indexes
This article is coded in Python in PyCharm software, using TensorFlow-1.14.0 as the deep learning framework. The main libraries used are SKlearn-0.19.1 and Numpy-.19.5. The second is the primary experimental parameter settings in the experiment. The type of multi-classification is set to 4, the total training batch is 1000, the printing batch interval is 4, the number of hidden layer nodes is 10, the learning rate of the model is 0.06, and the loss function is cross-entropy loss function.
This paper uses several evaluation metrics to evaluate the comprehensive performance of the proposed model, including Accuracy, Precision, Recall, and F1-score [38]. The higher the evaluation metrics, the better the test model’s performance. The formula and descriptions of each indicator are described in Table 4.
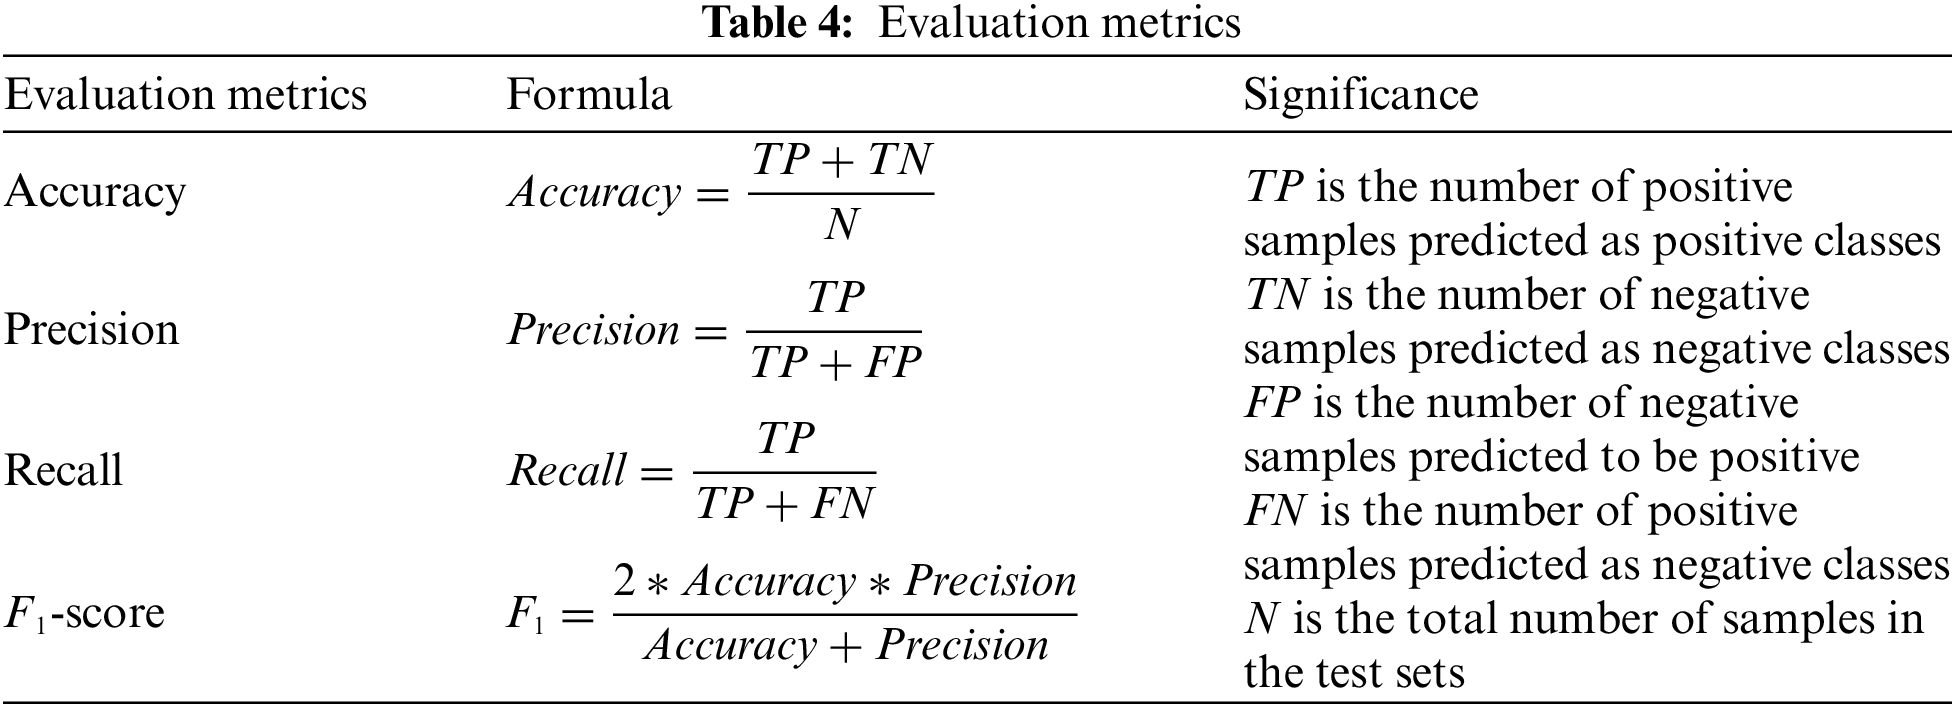
To verify the effectiveness of the BGD-MSR-DNN model in the prediction of rockburst intensity grade, this paper first divides the rockburst sample data into training and test sets at a ratio of 9:1. These sets are input into the k-nearest neighbors (KNN) model, probabilistic neural network (PNN) model, SVM model, particle swarm optimization-support vector machine (PSO-SVM) model, DNN model, and BGD-MSR-DNN model for training. The test sets are then used to evaluate the prediction performance of each model. Fig. 7 presents the confusion matrix derived from the prediction results of each model.
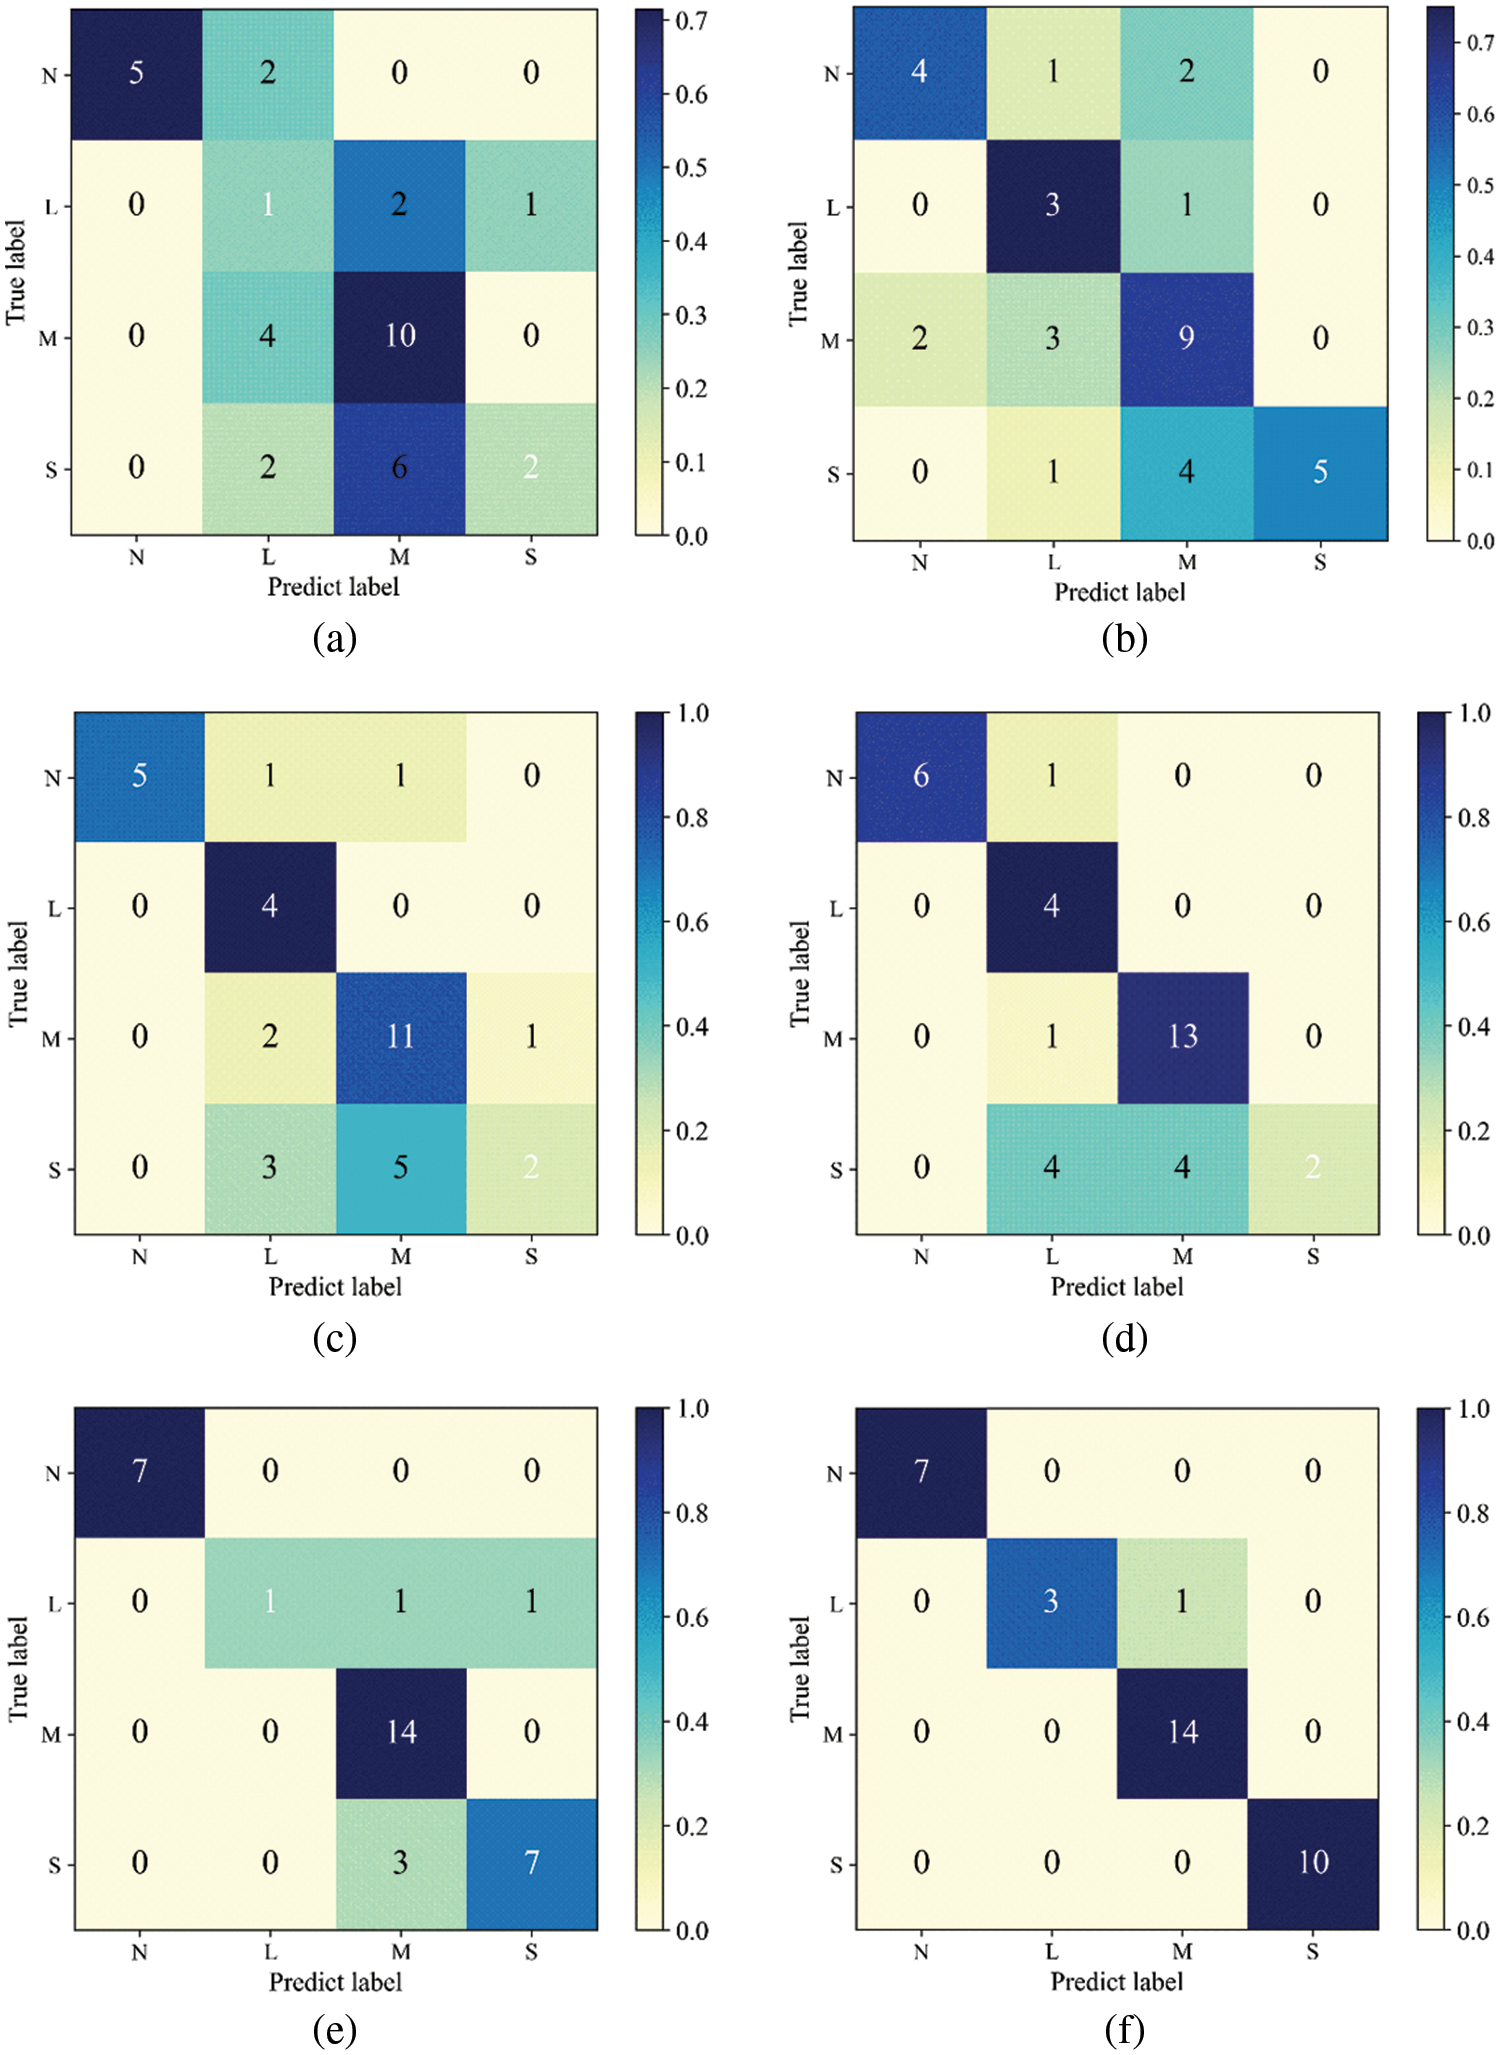
Figure 7: Confusion matrix: (a) KNN model; (b) PNN model; (c) SVM model; (d) PSO-SVM model; (e) DNN model; (f) BGD-MSR-DNN model
Fig. 7 shows the distribution of the real category and the predicted category when each model predicts. The darker the color of the diagonal line of the confusion matrix, the more the number of predicted categories is the same as the real category. It can be seen that the BGD-MSR-DNN model predicts the best results. The model evaluation metrics detailed in Section 4.1 are employed to analyze the prediction results. Accuracy, Precision, Recall, and F1-score of rockburst intensity grade prediction models were calculated by confusion matrix, and the performance of different models was analyzed based on four evaluation metrics. Table 5 reports the evaluation metrics of the six rockburst intensity grade prediction models. The best results are indicated in bold.
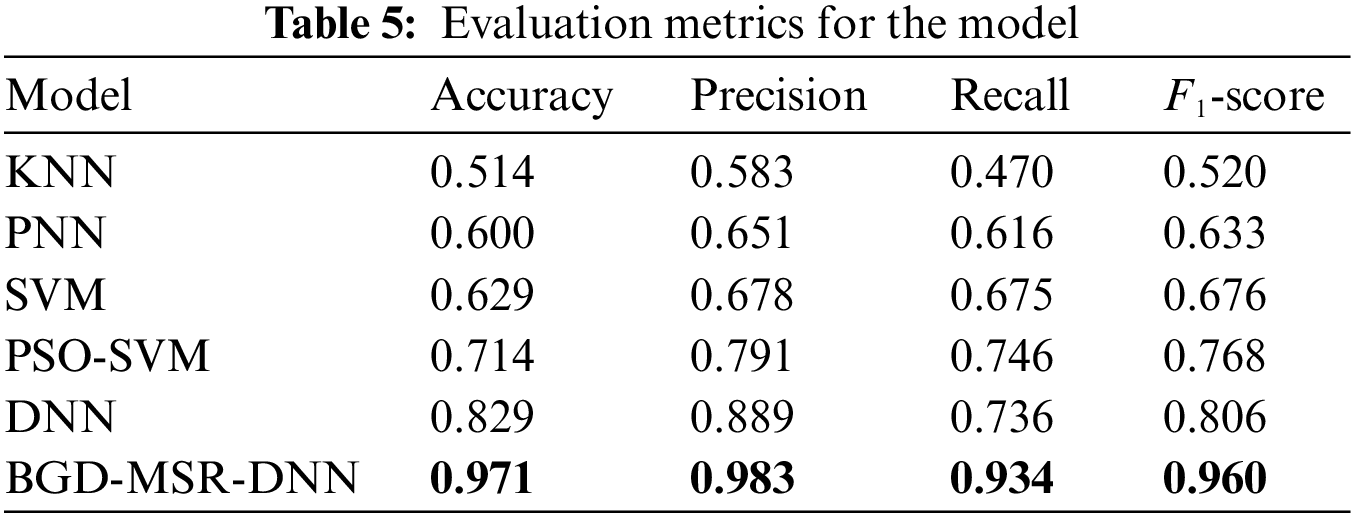
It can be seen from Table 5 that four evaluation metrics of the BGD-MSR-DNN model are the best compared with other models under the same test sets. Four evaluation metrics of the BGD-MSR-DNN model surpass those of the other models. The Accuracy rate reached 97.1%, exceeding the KNN model (51.4%), PNN model (60%), SVM model (62.9%), PSO-SVM model (71.4%), and the DNN (82.9%) model by 45.7%, 37.1%, 34.2%, 25.7%, and 14.2%, respectively. It shows that the prediction performance of the deep learning model has been dramatically improved compared with the machine learning model. Moreover, the BGD-MSR-DNN model outperformed the original DNN model by 9.4%, 19.8%, and 15.4% in three evaluation metrics of Precision, Recall, and F1-score, and corresponding values were much higher than the other comparable models. It proves that adding the BGD module and MSR module to the DNN network structure has achieved ideal results and improved the model’s prediction accuracy. In addition, comparing the evaluation metrics of the SVM model and the PSO-SVM model, the DNN model, and the BGD-MSR-DNN model, it can be found that the prediction performance of the combined classifier is much more excellent than that of a single classifier. Combination classifiers can also make up for the limitations of single classifiers in predicting rockburst intensity grade.
To prove the necessity of the BGD module and MSR module, In the ablation experiments in this section, the model performance after adding the BGD module and MSR module is verified by comparing the prediction performance of the DNN model, BGD-DNN model, MSR-DNN model, and BGD-MSR-DNN model. The results of the ablation experiments are shown in Table 6, and the best results are indicated in bold.
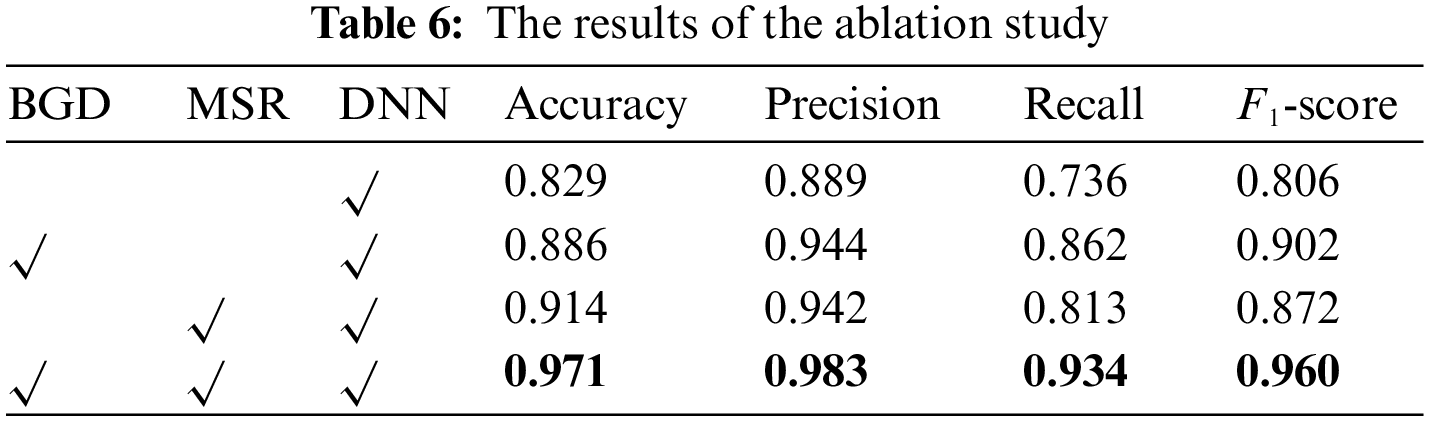
The experimental results in Table 6 show that when the BGD-DNN model is added with the BGD module in the DNN network structure, the two evaluation metrics of Recall and F1-score are respectively increased by 12.6% and 9.6% compared with the DNN model, because the BGD module can update parameters faster when processing data sets with fewer samples, thus significantly improving the efficiency of the network; When the MSR-DNN model of the MSR module is added to the DNN network structure, the DNN model has increased by 8.5%, 7.7% and 6.6% in the three evaluation metrics of Accuracy, Recall and F1-score, respectively, because the MSR module effectively solves the problem of network degradation when there are too many hidden layers of DNN, it dramatically improves the accuracy of model prediction; When the BGD-MSR-DNN model with both the BGD module and the MSR module is added to the DNN network structure, the accuracy of prediction is significantly improved compared with the other three models. It shows that the model’s prediction accuracy is related to the BGD and MSR modules. It also proves the effectiveness of the BGD-MSR-DNN model in predicting the rockburst intensity grade.
In addition, ablation experiments found that the BGD-MSR-DNN model with BGD module and MSR module has significantly improved in various evaluation metrics compared with the original DNN model. Therefore, the DNN model and the BGD-MSR-DNN model are selected for further analysis and comparison, and the comparison results are shown in Fig. 8 and Fig. 9. It can be seen from the figure that with the increase of iteration rounds, the Accuracy curve and Loss curve of the two models tend to be stable, but the curve of the BGD-MSR-DNN model fluctuates less. At the same time, the training time of the BGD-MSR-DNN model is significantly lower than that of the DNN model, indicating that the BGD-MSR-DNN model has better convergence speed and better prediction performance.
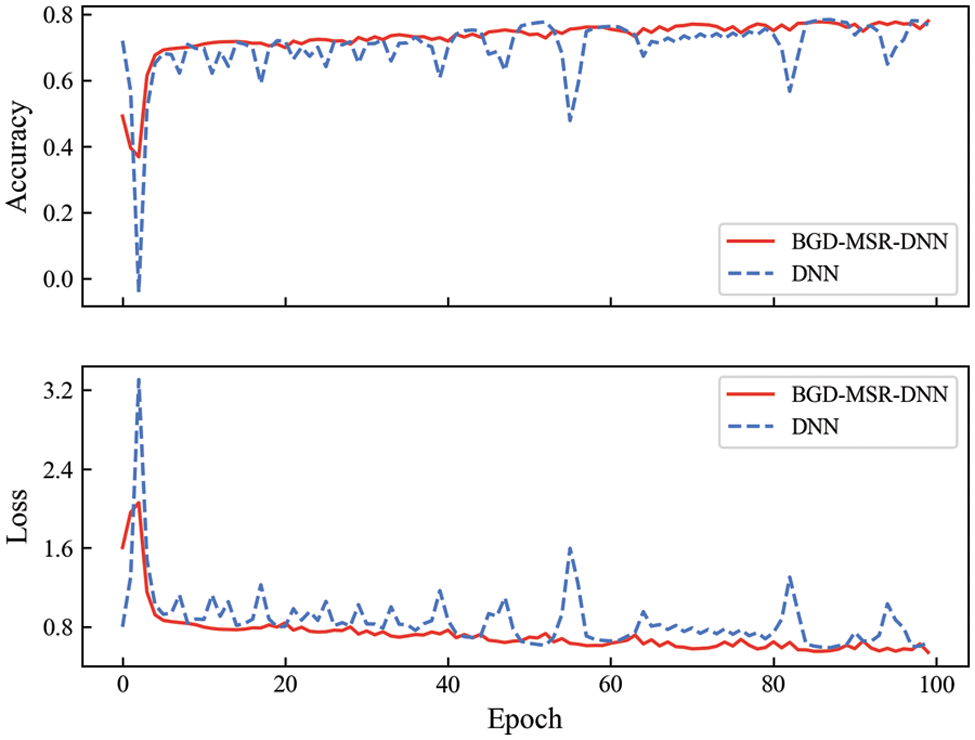
Figure 8: Comparison of accuracy and loss
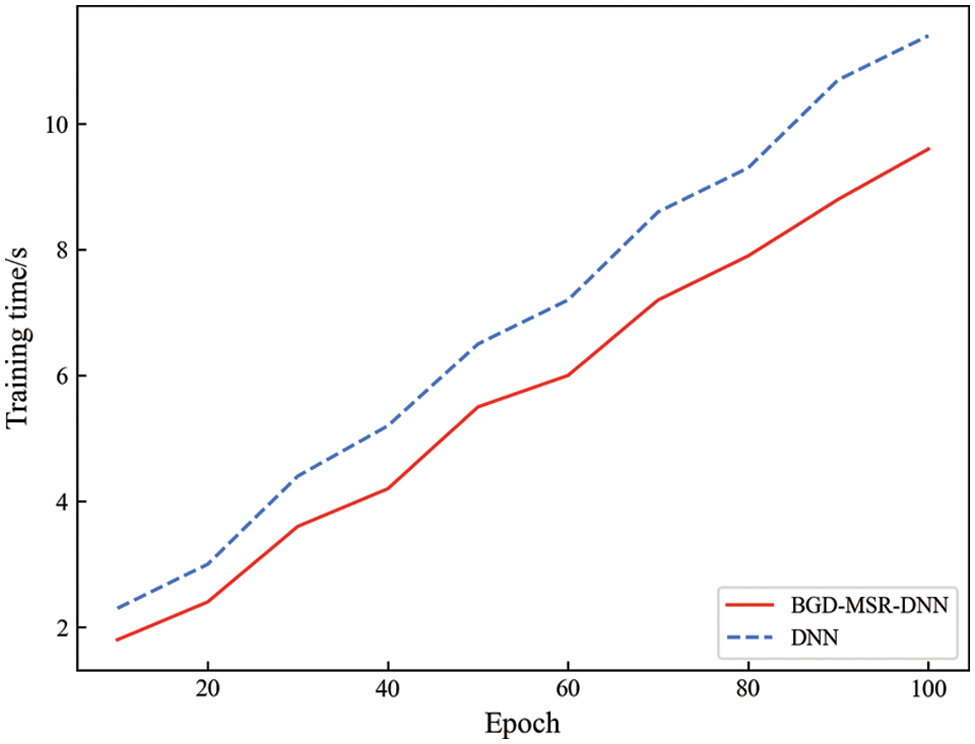
Figure 9: Comparison of training time
To verify the sensitivity of the hyperparameters existing in the BGD module during model prediction, we continuously search and obtain values manually and then conduct prediction experiments. The values during the experiment are shown in Table 7.
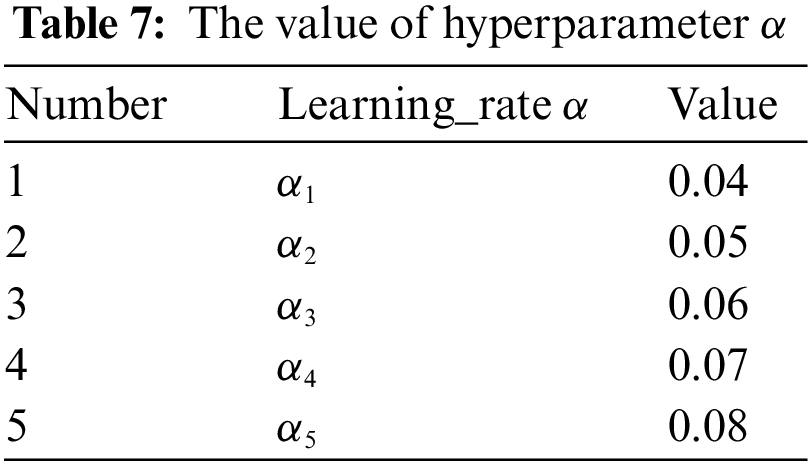
Finally, through experiments, the evaluation metrics curves of the hyperparameter
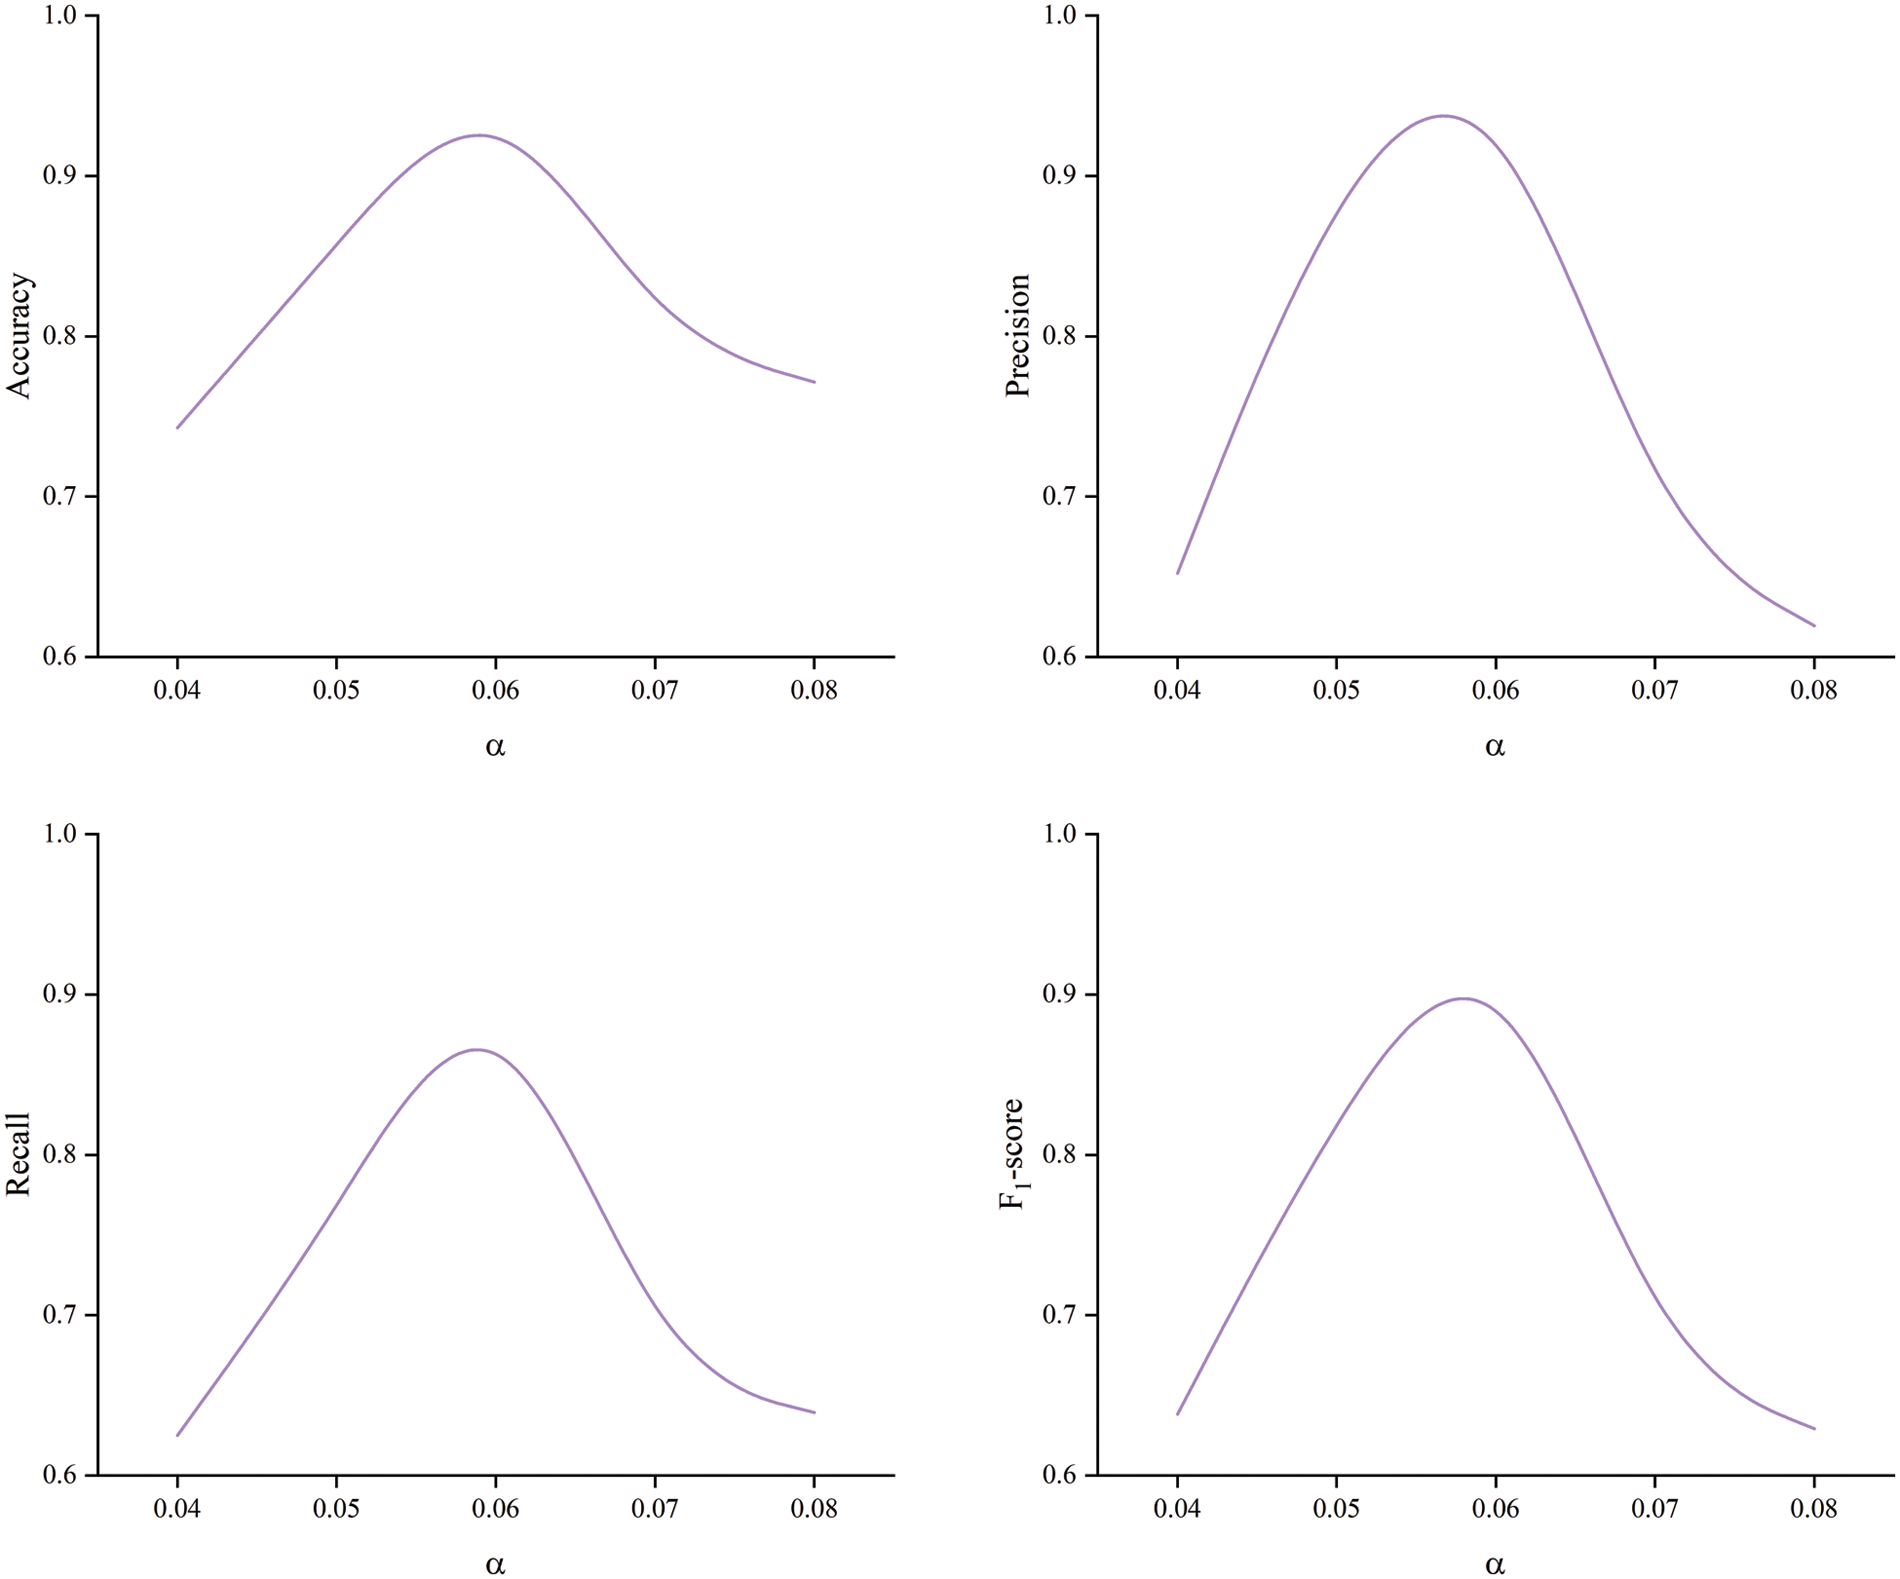
Figure 10: Model evaluation metrics curves
5 Applications in Practical Engineering
To further verify the prediction performance of the BGD-MSR-DNN model, this paper collected 20 sets of engineering data from actual projects such as the Qinling Tunnel and Daxiangling Tunnel. These include six groups of none rockburst, three groups of light rockburst, six groups of moderate rockburst, and five groups of strong rockburst (Table 8). The three rockburst evaluation indexes
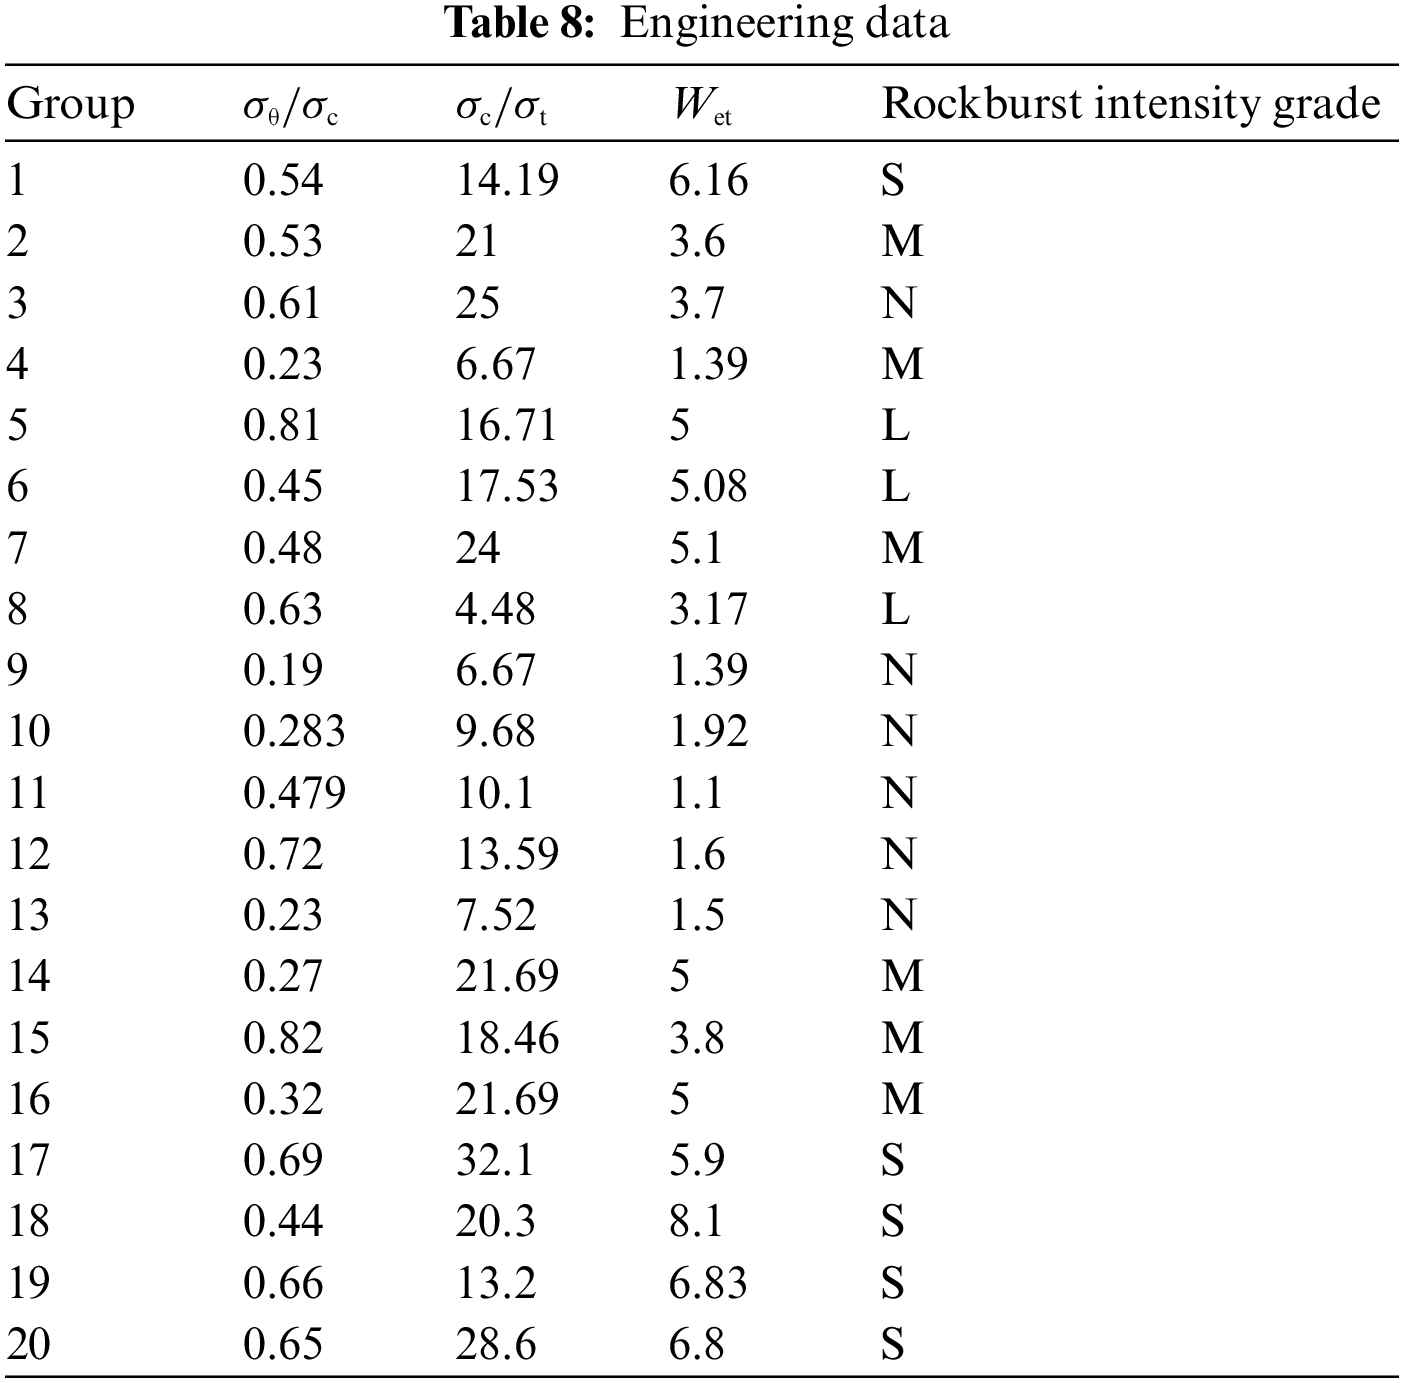
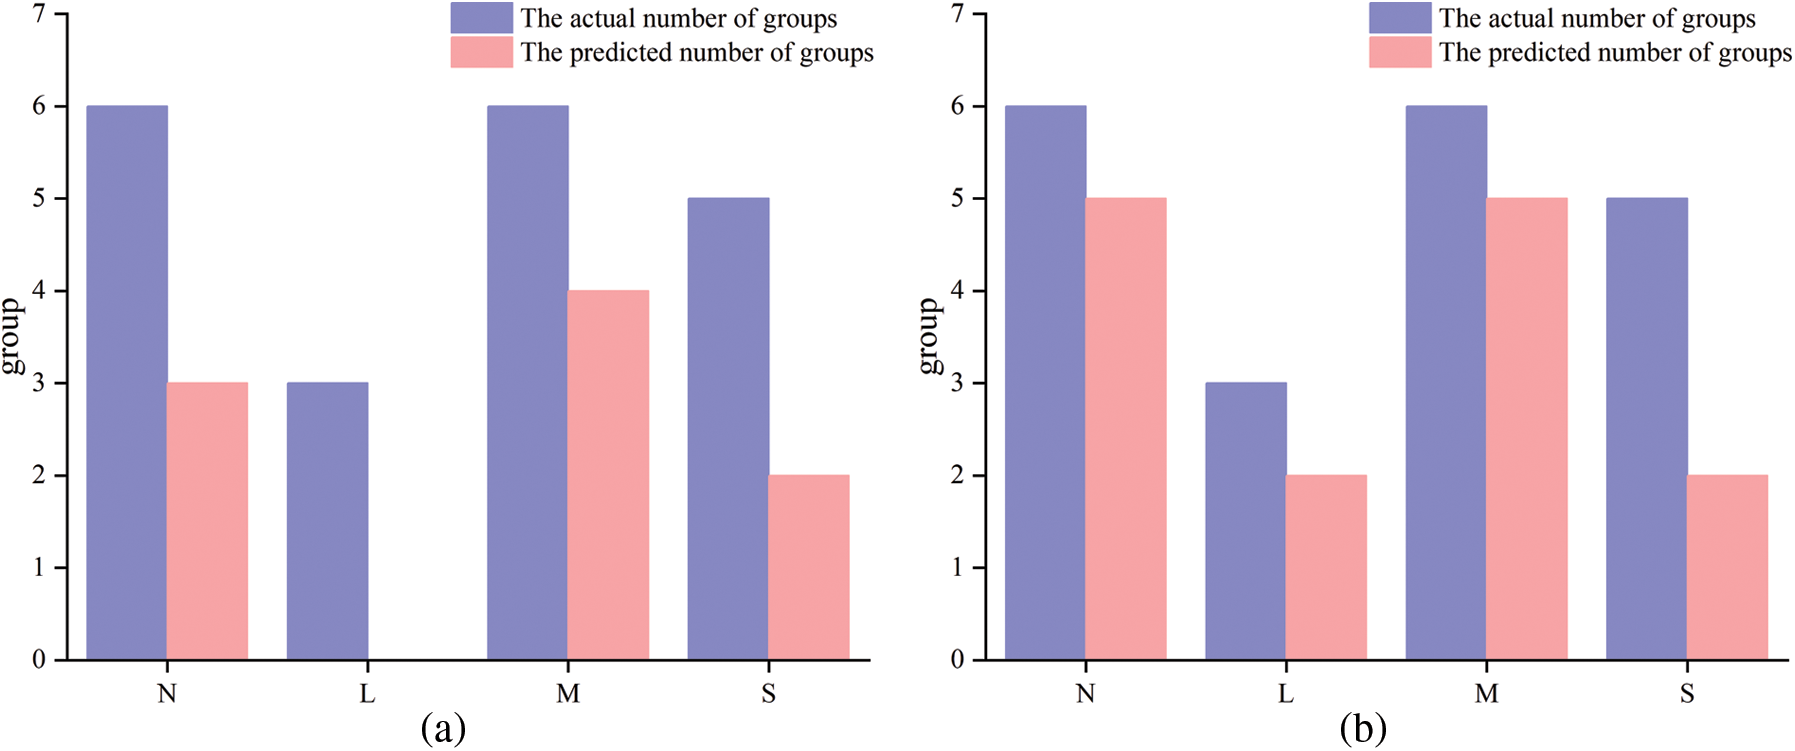
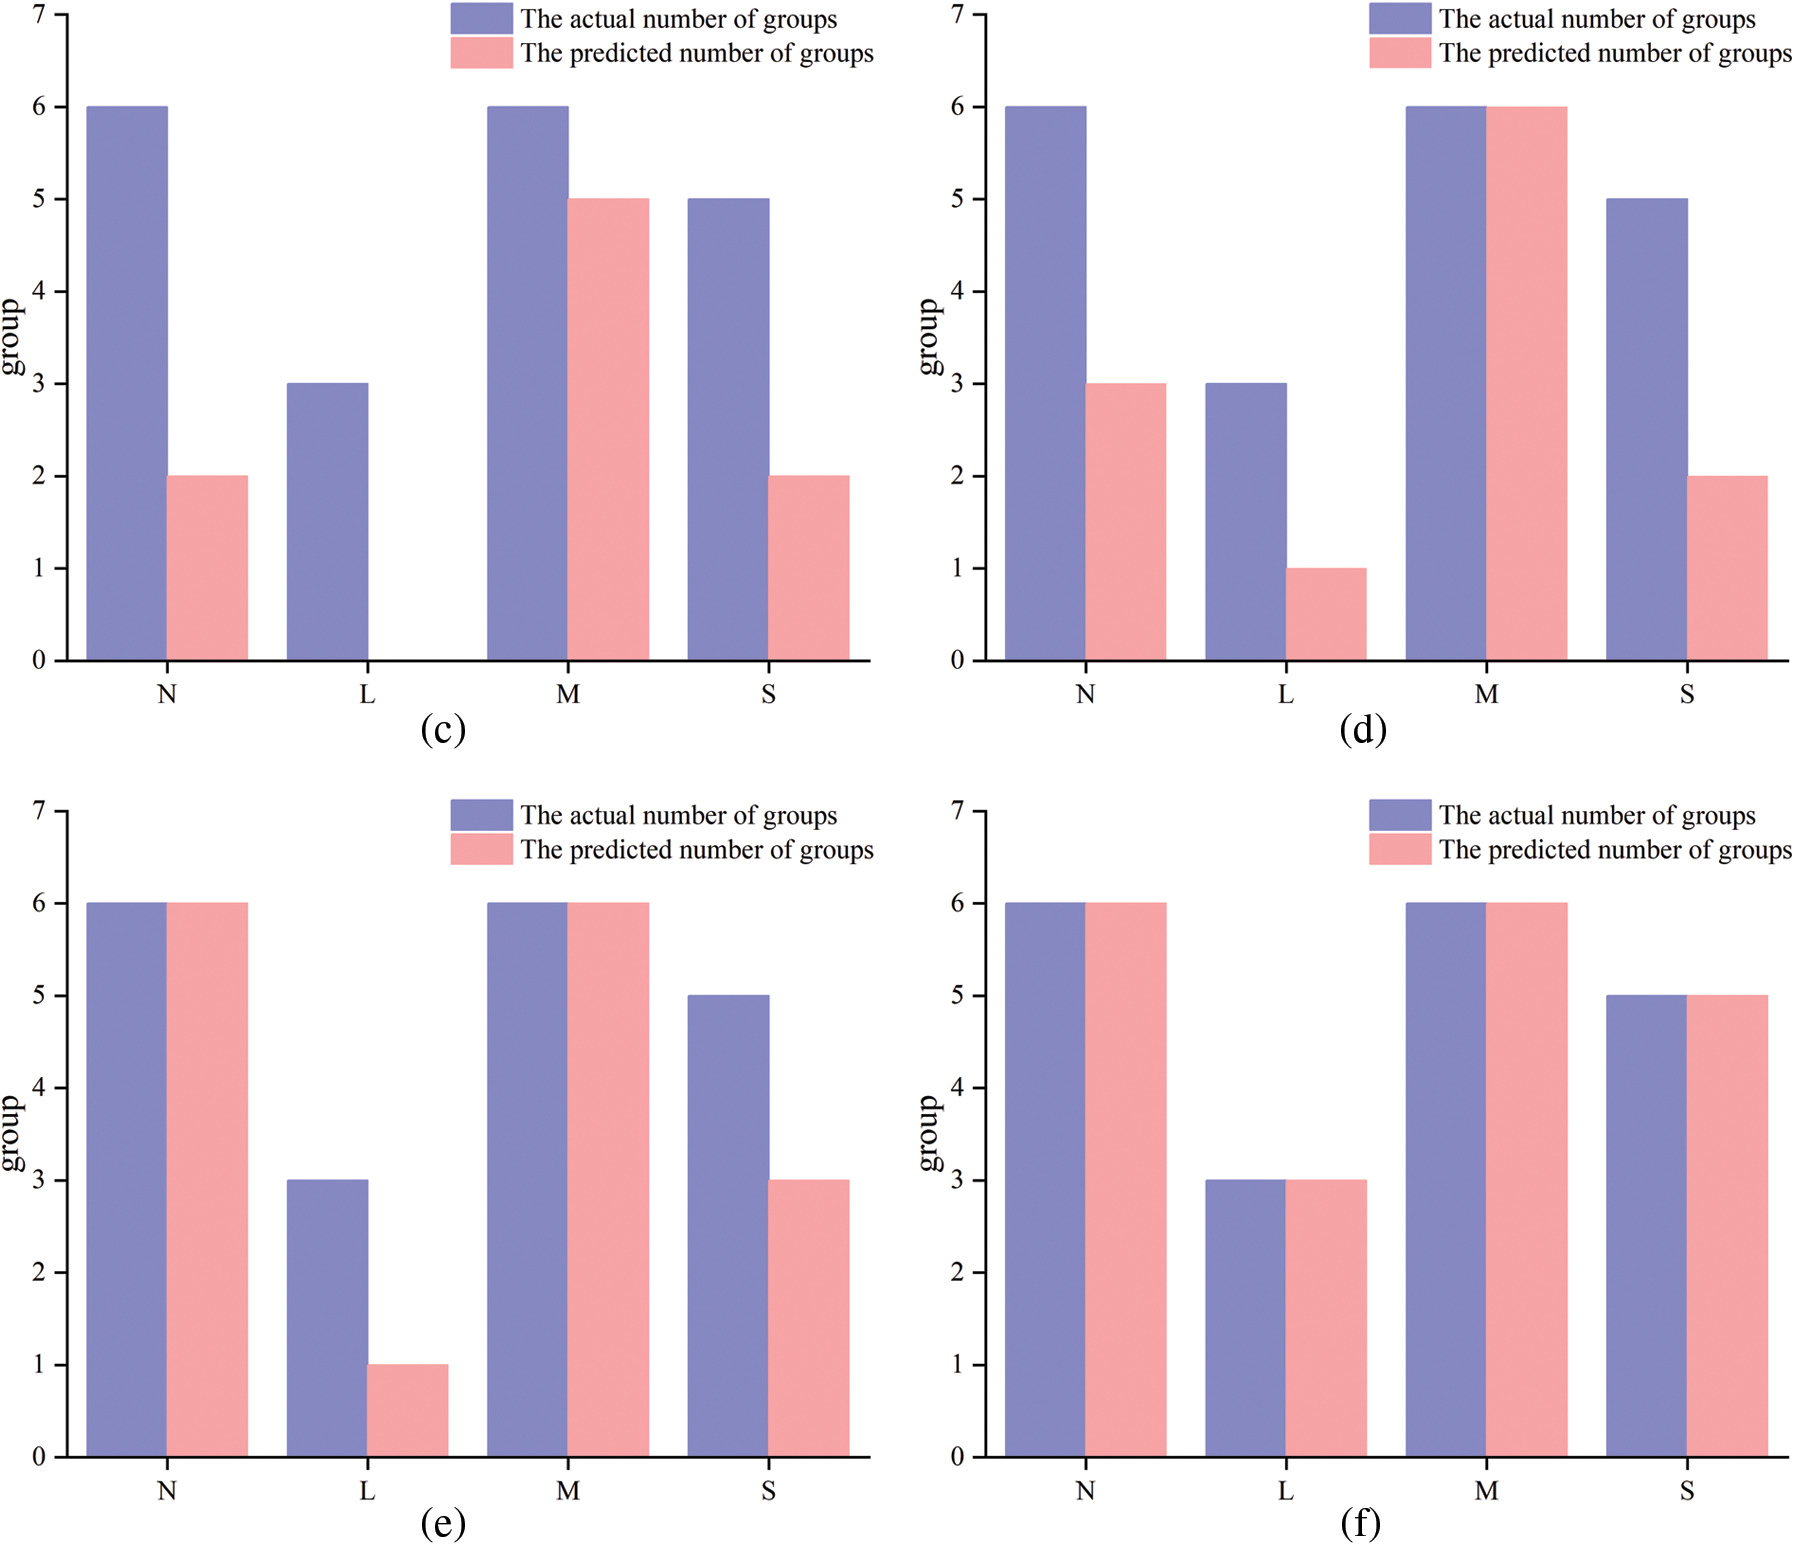
Figure 11: The result of the model prediction: (a) KNN model; (b) PNN model; (c) SVM model; (d) PSO-SVM model; (e) DNN model; (f) BGD-MSR-DNN model
In Fig. 11, the purple histogram represents the number of real engineering data groups with grades N, L, M, and S, and the pink histogram represents the number of rockburst intensity grade groups predicted by the model, when the heights of the histograms of the two colors are closer, it proves that the accuracy of the model prediction is higher. The BGD-MSR-DNN model established in this paper can predict 100% of the rockburst intensity grade of 20 engineering data sets. The accuracy rate is also better than other comparable models. Using the BGD-MSR-DNN model, the rockburst intensity grade is predicted rapidly and accurately. In addition, the newly acquired rockburst data in the project can be used as training sets and input into the model for training, which can optimize the model's prediction performance, thereby improving the generalization ability and robustness of the model.
In this paper, by comprehensively considering the mechanism of rockburst during mine and tunnel constructions, the
This paper proposes and establishes the BGD-MSR-DNN rockburst intensity grade prediction model based on batch gradient descent and a multi-scale residual deep neural network. The BGD and MSR modules are simultaneously integrated into the DNN network structure. This effectively improve the convergence speed of the model as well as the network degradation caused by too many network layers.
A total of 35 test sets were selected to analyze the prediction results of the BGD-MSR-DNN model. The results showed that the Accuracy rate of the BGD-MSR-DNN model reached 97.1%, which was 14.2% higher than that of the original DNN model. At the same time, three evaluation metrics of Precision, Recall, and F1-score have increased by 9.4%, 19.8%, and 15.4%. They are significantly better than other comparable models, which proves the effectiveness of the BGD-MSR-DNN rockburst intensity prediction model.
Finally, the model’s performance was tested using two actual projects, the Qinling Tunnel and Daxiangling Tunnel. The results showed that the prediction accuracy of the proposed model was 100%, which was a significant improvement compared to other comparable models. The proposed approach can effectively reduce economic loss and avoid casualties in actual engineering, proving its feasibility in mine and tunnel engineering.
Acknowledgement: Thanks are due to the parents, teachers, students, and editors for their support.
Funding Statement: This research was funded by State Key Laboratory for GeoMechanics and Deep Underground Engineering & Institute for Deep Underground Science and Engineering, Grant Number XD2021021, and BUCEA Post Graduate Innovation Project under Grant, Grant Number PG2023092.
Conflicts of Interest: The authors declare that they have no conflicts of interest to report regarding the present study.
References
1. M. Wu, Y. C. Ye, Q. H. Wang and N. Y. Hu, “Development of rockburst research: A comprehensive review,” Applied Sciences, vol. 12, no. 3, pp. 974, 2022. [Google Scholar]
2. F. J. Yang, H. Zhou, H. B. Xiao, M. U. Azhar, Y. Zhu et al., “Numerical simulation method for the process of rockburst,” Engineering Geology, vol. 306, pp. 106760, 2022. [Google Scholar]
3. M. F. Cai, “Prediction and prevention of rockburst in metal mines–A case study of Sanshandao gold mine,” Journal of Rock Mechanics and Geotechnical Engineering, vol. 8, no. 2, pp. 204–211, 2016. [Google Scholar]
4. D. Li, J. F. Zhang, Y. T. Sun and G. C. Li, “Evaluation of rockburst hazard in deep coalmines with large protective island coal pillars,” Natural Resources Research, vol. 30, no. 2, pp. 1835–1847, 2021. [Google Scholar]
5. L. P. Dai, Y. H. Pan, C. G. Zhang, A. W. Wang, I. Canbulat et al., “New criterion of critical mining stress index for risk evaluation of roadway rockburst,” Rock Mechanics and Rock Engineering, vol. 55, no. 8, pp. 4783–4799, 2022. [Google Scholar]
6. L. W. Zhang, X. Y. Zhang, J. Wu, D. K. Zhao and H. Fu, “Rockburst prediction model based on comprehensive weight and extension methods and its engineering application,” Bulletin of Engineering Geology and the Environment, vol. 79, no. 9, pp. 4891–4903, 2020. [Google Scholar]
7. D. Y. Li, Z. D. Liu, P. Xiao, J. Zhou and D. J. Armaghani, “Intelligent rockburst prediction model with sample category balance using feedforward neural network and bayesian optimization,” Underground Space, vol. 7, no. 5, pp. 833–846, 2022. [Google Scholar]
8. M. Zhang, “Classification prediction of rockburst in railway tunnel based on hybrid PSO-BP neural network,” Geofluids, vol. 2022, pp. 1–8, 2022. [Google Scholar]
9. R. S. Faradonbeh, S. S. Haghshenas, A. Taheri and R. Mikaeil, “Application of self-organizing map and fuzzy c-mean techniques for rockburst clustering in deep underground projects,” Neural Computing and Applications, vol. 32, no. 12, pp. 8545–8559, 2020. [Google Scholar]
10. H. L. Qu, L. H. Yang, J. B. Zhu, S. Chen, B. W. Li et al., “A multi-index evaluation method for rockburst proneness of deep underground rock openings with attribute recognition model and its application,” International Journal of Rock Mechanics and Mining Sciences, vol. 159, pp. 105225, 2022. [Google Scholar]
11. W. Z. Liang, A. Sari, G. Y. Zhao, S. D. McKinnon and H. Wu, “Short-term rockburst risk prediction using ensemble learning methods,” Natural Hazards, vol. 104, no. 2, pp. 1923–1946, 2020. [Google Scholar]
12. Y. T. Sun, G. C. Li, J. F. Zhang and J. D. Huang, “Rockburst intensity evaluation by a novel systematic and evolved approach: Machine learning booster and application,” Bulletin of Engineering Geology and the Environment, vol. 80, no. 11, pp. 8385–8395, 2021. [Google Scholar]
13. Y. G. Xue, G. K. Li, Z. Q. Li, P. Wang and H. M. Gong, “Intelligent prediction of rockburst based on Copula-MC oversampling architecture,” Bulletin of Engineering Geology and the Environment, vol. 81, no. 5, pp. 209, 2022. [Google Scholar]
14. J. H. Chen, Y. Chen, S. Yang, X. D. Zhong and X. Han, “A prediction model on rockburst intensity grade based on variable weight and matter-element extension,” PLoS One, vol. 14, no. 6, pp. e0218525, 2019. [Google Scholar] [PubMed]
15. Y. Y. Pu, D. B. Apel and H. W. Xu, “Rockburst prediction in kimberlite with unsupervised learning method and support vector classifier,” Tunnelling and Underground Space Technology, vol. 90, pp. 12–18, 2019. [Google Scholar]
16. Y. F. Li, C. Wang, J. K. Xu, Z. H. Zhou, J. H. Xu et al., “Rockburst prediction based on the KPCA-APSO-SVM model and its engineering application,” Shock and Vibration, vol. 2021, pp. 1–12, 2021. [Google Scholar]
17. M. Ahmad, H. Y. Katman, R. A. Al-Mansob, F. Ahmad, M. Safdar et al., “Prediction of rockburst intensity grade in deep underground excavation using adaptive boosting classifier,” Complexity, vol. 2022, pp. 1–10, 2022. [Google Scholar]
18. D. Y. Li, Z. D. Liu, D. J. Armaghani, P. Xiao and J. Zhou, “Novel ensemble tree solution for rockburst prediction using deep forest,” Mathematics, vol. 10, no. 5, pp. 787, 2022. [Google Scholar]
19. M. L. Li, K. G. Li, Q. C. Qin, R. Yue and G. Xu, “Rockburst estimation model based on IEWM-SCM and its application,” Environmental Earth Sciences, vol. 82, no. 3, pp. 88, 2023. [Google Scholar]
20. X. Yin, Q. S. Liu, Y. C. Pan, X. Huang, J. Wu et al., “Strength of stacking technique of ensemble learning in rockburst prediction with imbalanced data: Comparison of eight single and ensemble models,” Natural Resources Research, vol. 30, no. 2, pp. 1795–1815, 2021. [Google Scholar]
21. S. Gong, Y. Tan and W. Wang, “Prediction and evaluation of coal mine coal bump based on improved deep neural network,” Geofluids, vol. 2021, pp. 7794753, 2021. [Google Scholar]
22. A. Y. Cao, Y. Q. Liu, X. Yang, S. Li and Y. P. Liu, “FDNet: Knowledge and data fusion-driven deep neural network for coal burst prediction,” Sensors, vol. 22, no. 8, pp. 3088, 2022. [Google Scholar] [PubMed]
23. J. R. Zhang, “Exploration on coal mining-induced rockburst prediction using internet of things and deep neural network,” Journal of Supercomputing, vol. 78, no. 12, pp. 13988–14008, 2022. [Google Scholar]
24. Z. Li, X. Xu, D. Zhang and P. Zhang, “Cross-modal hashing retrieval based on deep residual network,” Computer Systems Science and Engineering, vol. 36, no. 2, pp. 383–405, 2021. [Google Scholar]
25. F. A. Alhaidari, S. A. Al-Dossary, I. A. Salih, A. M. Salem, A. S. Bokir et al., “Automatic channel detection using dnn on 2d seismic data,” Computer Systems Science and Engineering, vol. 36, no. 1, pp. 57–67, 2021. [Google Scholar]
26. R. F. Elsheikh, “Covid-19’s pandemic relationship to saudi arabia’s weather using statistical analysis and gis,” Computer Systems Science and Engineering, vol. 42, no. 2, pp. 813–823, 2022. [Google Scholar]
27. H. Y. Zhang and X. G. Luo, “The role of knowledge creation-oriented convolutional neural network in learning interaction,” Computational Intelligence and Neuroscience, vol. 2022, pp. 1–12, 2022. [Google Scholar]
28. B. W. Shen, H. Zhang, C. Li, T. H. Zhao and Y. N. Liu, “Deep learning method for RNA secondary structure prediction with pseudoknots based on large-scale data,” Journal of Healthcare Engineering, vol. 2021, pp. 1–9, 2021. [Google Scholar]
29. H. H. Gao, B. Y. Qiu, R. J. Duran Barroso, W. Hussain, Y. S. Xu et al., “TSMAE: A novel anomaly detection approach for internet of things time series data using memory-augmented autoencoder,” IEEE Transactions on Network Science and Engineering, pp. 1–14, 2022. [Google Scholar]
30. S. Soltane, S. Alsharif and S. M. S. Eldin, “Classification and diagnosis of lymphoma’s histopathological images using transfer learning,” Computer Systems Science and Engineering, vol. 40, no. 2, pp. 629–644, 2021. [Google Scholar]
31. J. Guo, J. W. Guo, Q. L. Zhang and M. Huang, “Research on rockburst classification prediction based on BP-SVM model,” IEEE Access, vol. 10, pp. 50427–50447, 2022. [Google Scholar]
32. J. Zhou, X. B. Li and X. Z. Shi, “Long-term prediction model of rockburst in underground openings using heuristic algorithms and support vector machines,” Safety Science, vol. 50, no. 4, pp. 629–644, 2012. [Google Scholar]
33. S. Afraei, K. Shahriar and S. H. Madani, “Developing intelligent classification models for rock burst prediction after recognizing significant predictor variables, Section 1: Literature review and data preprocessing procedure,” Tunnelling and Underground Space Technology, vol. 83, pp. 324–353, 2019. [Google Scholar]
34. G. Xu, K. Li, M. L. Li, Q. C. Qin and R. Yue, “Rockburst intensity level prediction method based on FA-SSA-PNN model,” Energies, vol. 15, no. 14, pp. 5016, 2022. [Google Scholar]
35. C. Liu, R. Antypenko, I. Sushko and O. Zakharchenko, “Intrusion detection system after data augmentation schemes based on the VAE and CVAE,” IEEE Transactions on Reliability, vol. 71, no. 2, pp. 1000–1010, 2022. [Google Scholar]
36. B. B. Yang, M. M. He, Z. Q. Zhang, J. W. Zhu and Y. S. Chen, “A new criterion of strain rockburst in consideration of the plastic zone of tunnel surrounding rock,” Rock Mechanics and Rock Engineering, vol. 55, no. 3, pp. 1777–1789, 2022. [Google Scholar]
37. Y. G. Xue, C. H. Bai, D. H. Qiu, F. M. Kong and Z. Q. Li, “Predicting rockburst with database using particle swarm optimization and extreme learning machine,” Tunnelling and Underground Space Technology, vol. 98, pp. 103287, 2020. [Google Scholar]
38. A. A. Alsheikhy, A. S. Azzahrani, A. K. Alzahrani and T. Shawly, “An effective diagnosis system for brain tumor detection and classification,” Computer Systems Science and Engineering, vol. 46, no. 2, pp. 2021–2037, 2023. [Google Scholar]
Cite This Article
 Copyright © 2023 The Author(s). Published by Tech Science Press.
This work is licensed under a Creative Commons Attribution 4.0 International License , which permits unrestricted use, distribution, and reproduction in any medium, provided the original work is properly cited.
 Downloads
 Citation Tools