 Open Access
ARTICLE
A Novel Computationally Efficient Approach to Identify Visually Interpretable Medical Conditions from 2D Skeletal Data
1 Tiger Analytics, Chennai, 600041, India
2 College of Engineering Guindy, Anna University, Chennai, 600025, India
* Corresponding Author: Praveen Jesudhas. Email:
Computer Systems Science and Engineering 2023, 46(3), 2995-3015. https://doi.org/10.32604/csse.2023.036778
Received 12 October 2022; Accepted 28 December 2022; Issue published 03 April 2023
Abstract
Timely identification and treatment of medical conditions could facilitate faster recovery and better health. Existing systems address this issue using custom-built sensors, which are invasive and difficult to generalize. A low-complexity scalable process is proposed to detect and identify medical conditions from 2D skeletal movements on video feed data. Minimal set of features relevant to distinguish medical conditions: AMF, PVF and GDF are derived from skeletal data on sampled frames across the entire action. The AMF (angular motion features) are derived to capture the angular motion of limbs during a specific action. The relative position of joints is represented by PVF (positional variation features). GDF (global displacement features) identifies the direction of overall skeletal movement. The discriminative capability of these features is illustrated by their variance across time for different actions. The classification of medical conditions is approached in two stages. In the first stage, a low-complexity binary LSTM classifier is trained to distinguish visual medical conditions from general human actions. As part of stage 2, a multi-class LSTM classifier is trained to identify the exact medical condition from a given set of visually interpretable medical conditions. The proposed features are extracted from the 2D skeletal data of NTU RGB + D and then used to train the binary and multi-class LSTM classifiers. The binary and multi-class classifiers observed average F1 scores of 77% and 73%, respectively, while the overall system produced an average F1 score of 69% and a weighted average F1 score of 80%. The multi-class classifier is found to utilize 10 to 100 times fewer parameters than existing 2D CNN-based models while producing similar levels of accuracy.Keywords
The onset of fatal diseases such as cardiac arrest or brain stroke could start with relatively milder symptoms such as a headache or chest pain. There are high chances for these symptoms to go unnoticed either due to a shortage of medical professionals or due to the ignorance/carelessness of the patients. These are further exacerbated when the patient is alone and does not have frequent human contact. Early diagnosis of these symptoms could result in timely treatment and faster recovery in patients. Given this context, automated detection of medical conditions without human intervention could help notify medical professionals and can significantly help facilitate timely medical help.
Recent technological advances have helped identify medical conditions [1,2] and treat them. Rapid advances have been made in detecting cardiovascular diseases [3], Parkinson’s disease from gait [4], sensing and treating myocardial infarction [5] and more applications like identifying the fall of old adults by a variety of methods [6,7].
Existing medical condition identification systems are developed considering the medical condition to be diagnosed and the data source sensors. A category of these systems [8] is built with proximity sensors such as accelerometers [9], audio [10], wifi [11], infrared [12,13], depth maps [8], etc., to identify instances such as human fall, heart diseases and other such medical conditions. These systems are very accurate in identifying medical conditions due to the presence of specialized hardware. Despite their higher accuracy, they are tough to scale and often require a sensor or hardware specific to the data source and medical condition. Along with hardware, the ability to pass these signals via the network for further processing is also often a requirement. These limitations result in these approaches being primarily restricted to diagnostic centers and preventing deployment in day-to-day use.
Besides sensor-based systems, medical condition identification based on video camera inputs and depth maps have been employed in various cases, such as for elderly help, fall detection, depression detection [14,15], etc. Though not as accurate as sensors attached to the body, these approaches are much less invasive and could be scaled. In terms of equipment, they require video cameras and depth sensors or devices such as Kinect. Some of these systems directly utilize RGB data at a frame level as features. In contrast, others extract the Skeletal data from RGB data with pose estimation algorithms [16] and then utilize it to identify medical conditions.
RGB sequences refer to data captured from a video camera where three 2D-Matrices R, G and B are available for every frame in the video sequence. Models related to 3D-CNN [17,18] and 2D-CNN with LSTM [19] are directly trained on RGB data to identify medical conditions. Directly training with the RGB data could result in the model getting overfitted with the background and texture information which doesn’t represent the nature of medical conditions. Skeletal data sequences refer to the location of different joints in the human body captured across a sequence of frames. They can be processed directly utilizing Graph convolutional networks (GCN) [20,21] or Spatiotemporal graphs [22]. These approaches give good results when trained with extensive data, but their results are less interpretable and have a chance of getting overfitted. They also require sophisticated hardware for training and inference.
This paper focuses on developing a low-complexity, highly interpretable process to identify medical conditions from the 2D skeletal data. In alignment with the objective, the below contributions have been made:
• A sampling procedure to utilize skeletal data at specific time instances to compensate for variation in action duration across different subjects and instances.
• Derived three categories of skeletal features representing the actions associated with medical conditions, namely: angular motion features (AMF), positional variation features (PVF) and global displacement features (GDF). These features are subsequently validated on the NTU (RGB) skeletal datasets to show their discriminative capability.
• Development of a 2-stage classifier. The first stage identifies if a given video sequence represents a medical condition. The second stage classifies the medical condition. The results are validated using the NTU (RGB) skeletal dataset.
The rest of the paper is organized as follows. Section 2 details the overall problem to be solved in conjunction with the scope of this work. The different types of features extracted from a temporal and spatial perspective are elaborated on in Section 3, along with their respective validation. Section 4 describes and validates the classifiers trained with the derived skeletal features for medical condition detection and identification. Section 5 captures the experimental results and comparison with other approaches. A summary of this work and its future developments are mentioned in Section 6.
2 Overall Context and Proposed Work
In this section, the medical condition detection and identification system, as defined in Fig. 1, are explored along with the scope of our work. The overall system consists of a camera device to extract footage at about 30 fps. The data at every frame is available in an RGB format. Pose estimation algorithms such as Openpose are applied to the input video to extract the 2D skeleton data at a frame level. It is observed that the recent pose estimation algorithms are close to 100% in accuracy and can also extract the skeletons from video feeds in real-time with minimal latency. Considering the process of video acquisition and extraction of 2D skeletons to be well-solved, we focus our efforts on identifying medical conditions from the 2D skeletal data.
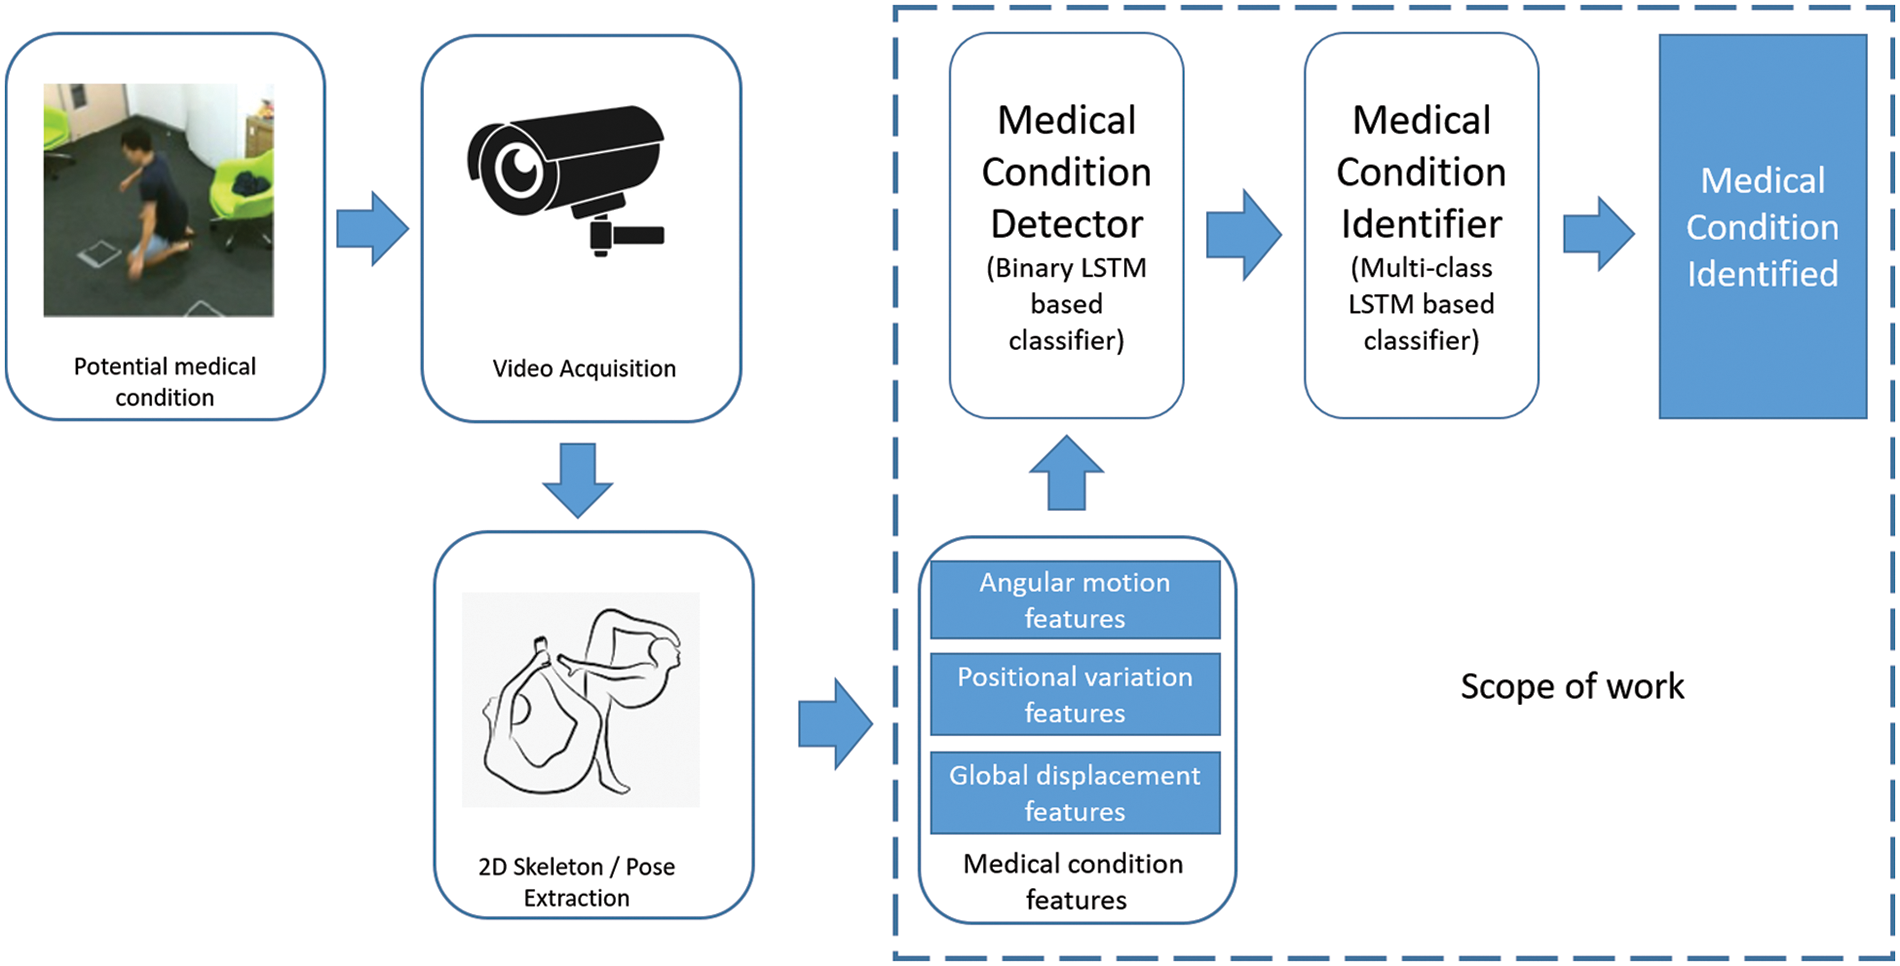
Figure 1: Medical condition identification-overall approach
The 2D Skeletal data consists of 25 joints per person per frame represented by their (x, y) coordinates which translates to 25 * 2 = 50 features per frame. As could be noted, the feature size is significantly less when compared to the feature space of the RGB data, which for a standard resolution frame is 640 * 480 * 3 = 921600. This results in lower model complexity, fewer data samples for model training and a better representation of action without involving background, texture and other covariates.
This paper proposes three significant contributions to the medical condition identification system defined in Fig. 1, which are outlined in Sections 2.1 to 2.3.
2.1 Medical Condition Feature Derivation
A medical condition such as falling, headache, etc., is usually accompanied by changes in the sudden movement of elbows, knees and other regions in the 2D skeletal data. Representative features are explicitly derived to detect and identify medical conditions. These features are observed to be reasonably interpretable in nature and align closely with skeletal movement during medical conditions.
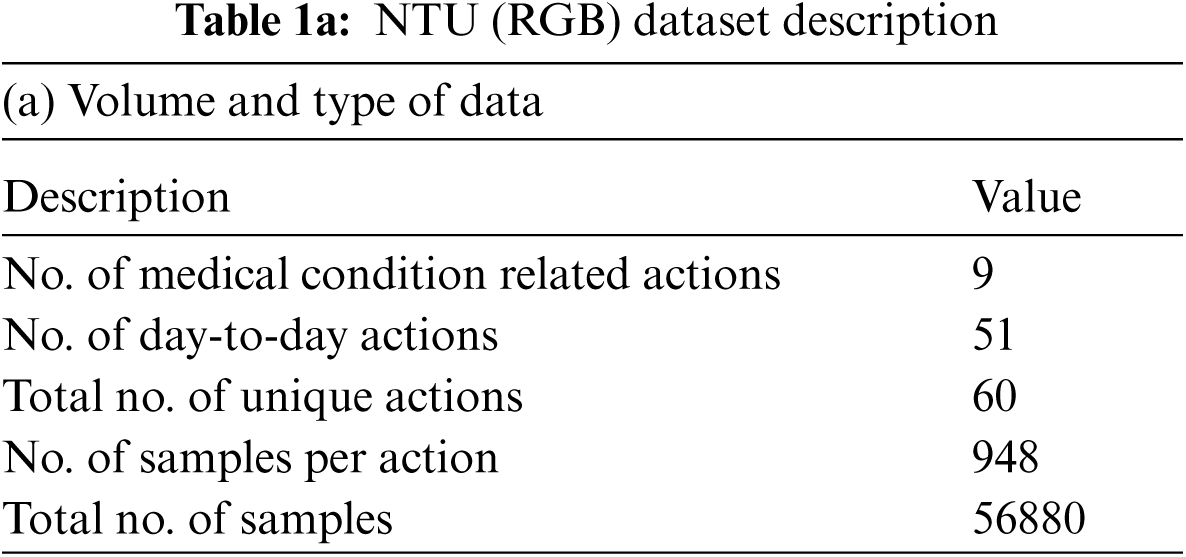
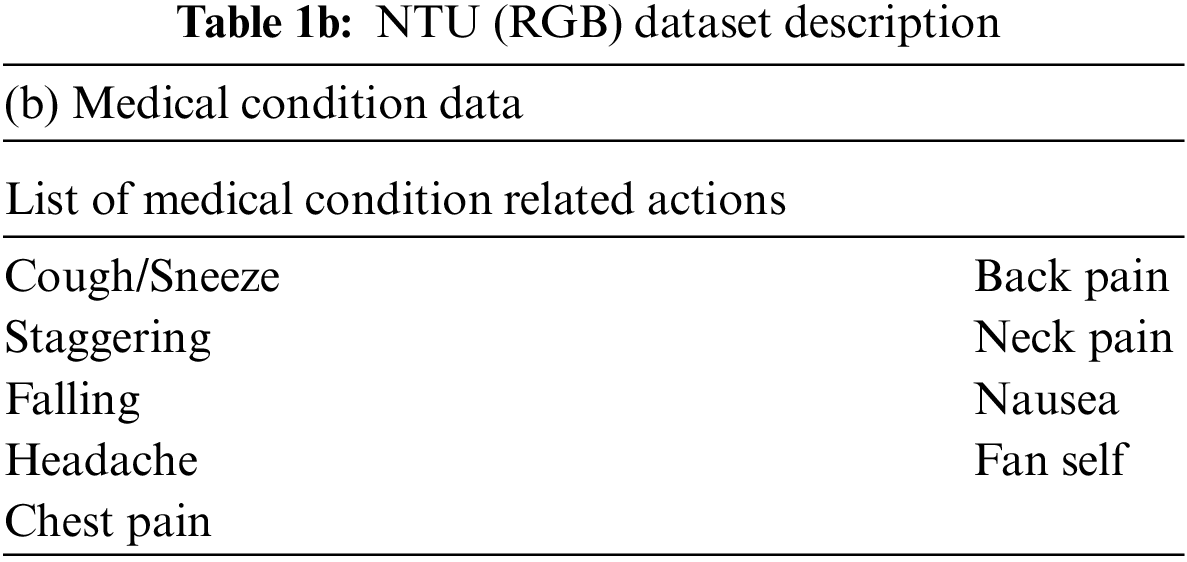
Three categories of derived features are computed, namely the: angular motion features (AMF) to represent the angular variation in joints, positional variation features (PVF) to capture variation in relative position and global displacement features (GDF) to capture the movement of the entire body. These features are elaborated in Section 3 and rigorously validated on the NTU (RGB) [23] medical condition dataset defined in Table 1.
2.2 Medical Condition Detector
The objective of the medical condition detector is to process incoming video sequences and notify when a potential medical condition has occurred. The features derived from 2D skeletal data are utilized to identify these medical conditions’ occurrence. The derived features are computed at a frame level and aggregated over an action, resulting in multi-dimensional time-series data. Different types of time series classifiers, such as distance [24] and recurrent neural net (RNN) [25] classifiers, are explored to select the suitable model for training. It is observed that distance-based classifiers such as the K-NN generally have dynamic time warping (DTW) [24] as a distance measure. This requires computation and comparison of distance with all other samples resulting in delay during model inference. In RNN-based networks, the vanilla RNN is prone to exploding gradients and the gated Recurrent networks (GRU) [26] are not very efficient in capturing long-term and short-term dependencies.
Considering the above factors, the LSTM [27] is selected as the model for training the medical condition detector due to its stability, faster inference and better learning capability. The detector is trained as a binary classifier where the derived skeletal features of medical conditions are aggregated together as one label. All the features corresponding to day-to-day actions are represented with the alternate label. The ability of the classifier to distinguish medical conditions from regular actions is validated with the NTU dataset [23]. The medical condition detector is elaborated more in Section 4.
2.3 Medical Condition Identifier
The medical condition identifier categorizes the exact nature of the condition after successful detection. Derived 2D skeletal features are used to train the multi-class LSTM model to identify the medical condition. Data samples of each medical condition are collated and their respective 2D skeletal features are computed. This data is then used to train a multi-class LSTM where each class represents features derived from its corresponding medical condition. The details of the medical condition identifier and its validation is detailed in Section 4.
3 Feature Extraction and Validation
This section focuses on choosing the minimal interpretable set of features from 2D skeletal data to distinguish medical actions across space and time. From a time-based perspective, the video at the appropriate frequency level is sampled based on the duration of action. In terms of space, we utilize broadly three types of features, which are: angular motion features (AMF), positional variation features (PVF) and global displacement features (GDF).
3.1 Frame Sampling and Selection
Based on observations, a single action takes about four to ten seconds, depending on the speed at which a human being does medical condition-associated action. In a general case, videos are encoded at 30 fps, representing each action by frames ranging anywhere between 120 to 300. It is to be noted that immediate successive frames contain much less information than previous frames since the human body does not change positions significantly at 1/30th of a second. Hence, it’s essential to filter only the informative frames for further processing.
The duration for a specific medical condition-associated action could vary based on the test subject and different instances across time for the same subject. When the duration is shorter, it contains more information in consecutive frames and needs to sample at a higher frequency. On a similar note, for actions taking longer duration, the information in successive frames is less and it is generally acceptable to sample at lower frequencies. Given this, we propose an approach where the number of frames encoded in action is fixed as a constant (K), based on which the frequency of video sampling
To compute the sampling frequency, the time steps of interest are calculated using Eq. (1). Post which the sampling frequency is calculated using Eq. (2). This process ensures that the same action at a shorter duration is sampled at a higher frequency and the ones at a longer duration are sampled at a lower frequency.
3.2 Derivation of Skeletal Features
Medical conditions generally have specific characteristics that could be utilized to select the right features. For instance, the nature of the action involved is particular to the person and does not involve any additional object or interaction with other people. Additionally, the background and locality have lesser relevance to the nature of the medical condition. Based on these characteristics domain specific custom features are derived from skeletal data and presented below:
3.2.1 Angular Motion Features (AMF)
Any occurrence of a medical condition should invariably result in the movement of different limbs of the human body. These variations are captured by the angle variation at a joint (Such as the elbow or knee) produced by two adjacent limbs. The pattern of variations of these angles is quite sensitive and representative of the medical condition. These angles are invariant to the video’s size and the morphological dimensions of the human performing the action. For every joint of interest, we form a triangle with the joint and the two adjacent points given in Table 2. This procedure is illustrated in Fig. 2. The different sides of the triangle are computed by finding the Euclidean distance between the corresponding coordinates. The angle made by the joint along its two adjacent sides is then calculated using the cosine formula in Eq. (3). This procedure is followed across each frame for a given action for all the joints. The dimension of the feature vector is given by (10,

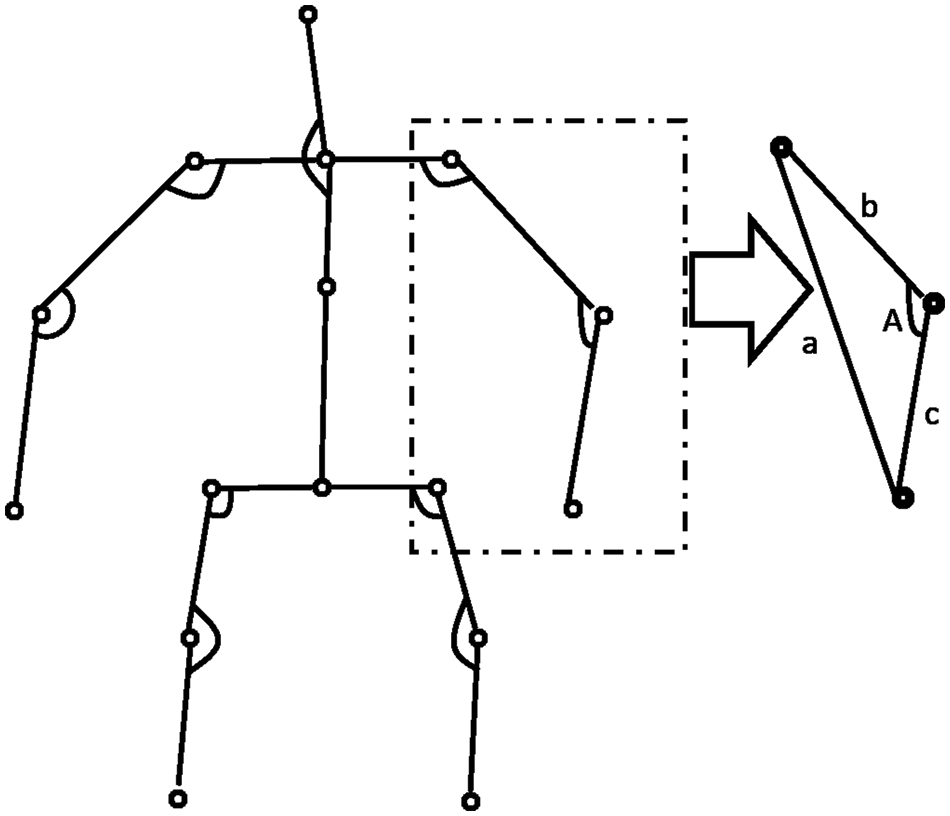
Figure 2: Computation of angular motion features

The AMF features constitute a 10-dimensional time series capturing the variation in the joint angles across time. For every action, the average time series across different samples (also called a barycenter) is computed for each of the ten joint angles. The variance of the barycenter [28] time series signal across each dimension for the different actions is listed in Table 3. Intuitively, higher variations are observed in regions where its corresponding action has more significant movement. For instance, high variations are observed around the knee region in the falling medical condition. There are variations in the elbow region for actions such as headache or chest pain. Additionally, the AMF features are used to train a classifier to distinguish the nine different medical actions in NTU RGB+D skeletal dataset and the F1 Score is shown in Table 4. Based on the results, these features help determine medical conditions and are the most effective among the three proposed features discussed in this paper.


3.2.2 Positional Variation Features (PVF)
Along with the motion of limbs in the human body, the positions of joints change relative to the reference during a medical condition. The relative position features capture the orientation of the nine different joints in the human body from the chest-mid region. The chest-mid region is closer to the body’s center and is considered the reference or centroid. These features are computed across time for the different sampled frames of interest. The angular direction of each joint of interest from the reference for a given frame is captured as part of the positional variation features (PVF), as illustrated in Fig. 3. The different points of interest considered for feature computation are shown in Table 5. The algorithm for computing the positional variation features (PVF) based on the nine medical actions in NTU RGB+D skeletal dataset is shown in Algorithm 2.
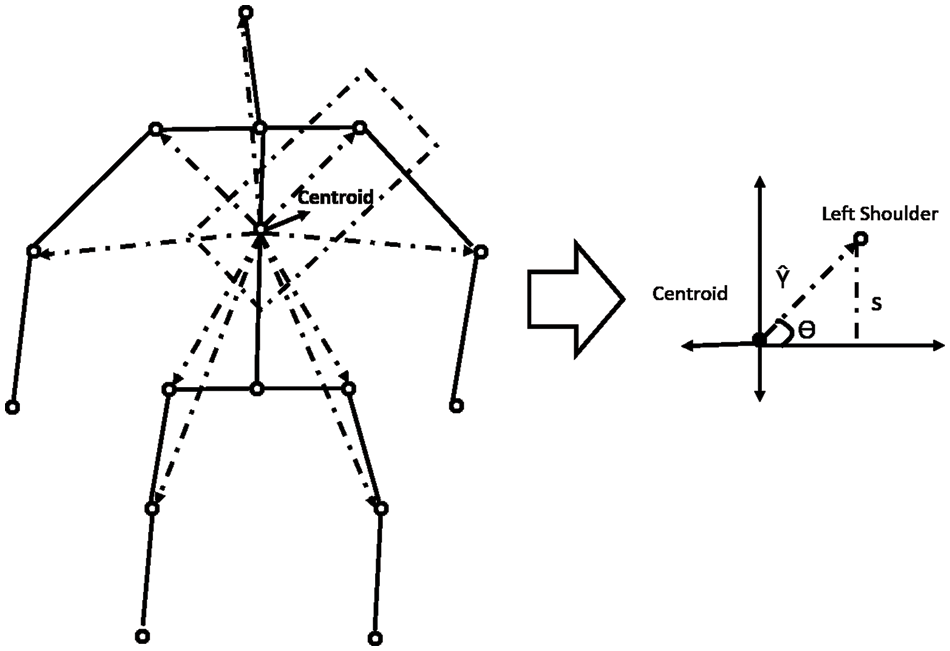
Figure 3: Computation of positional variation features

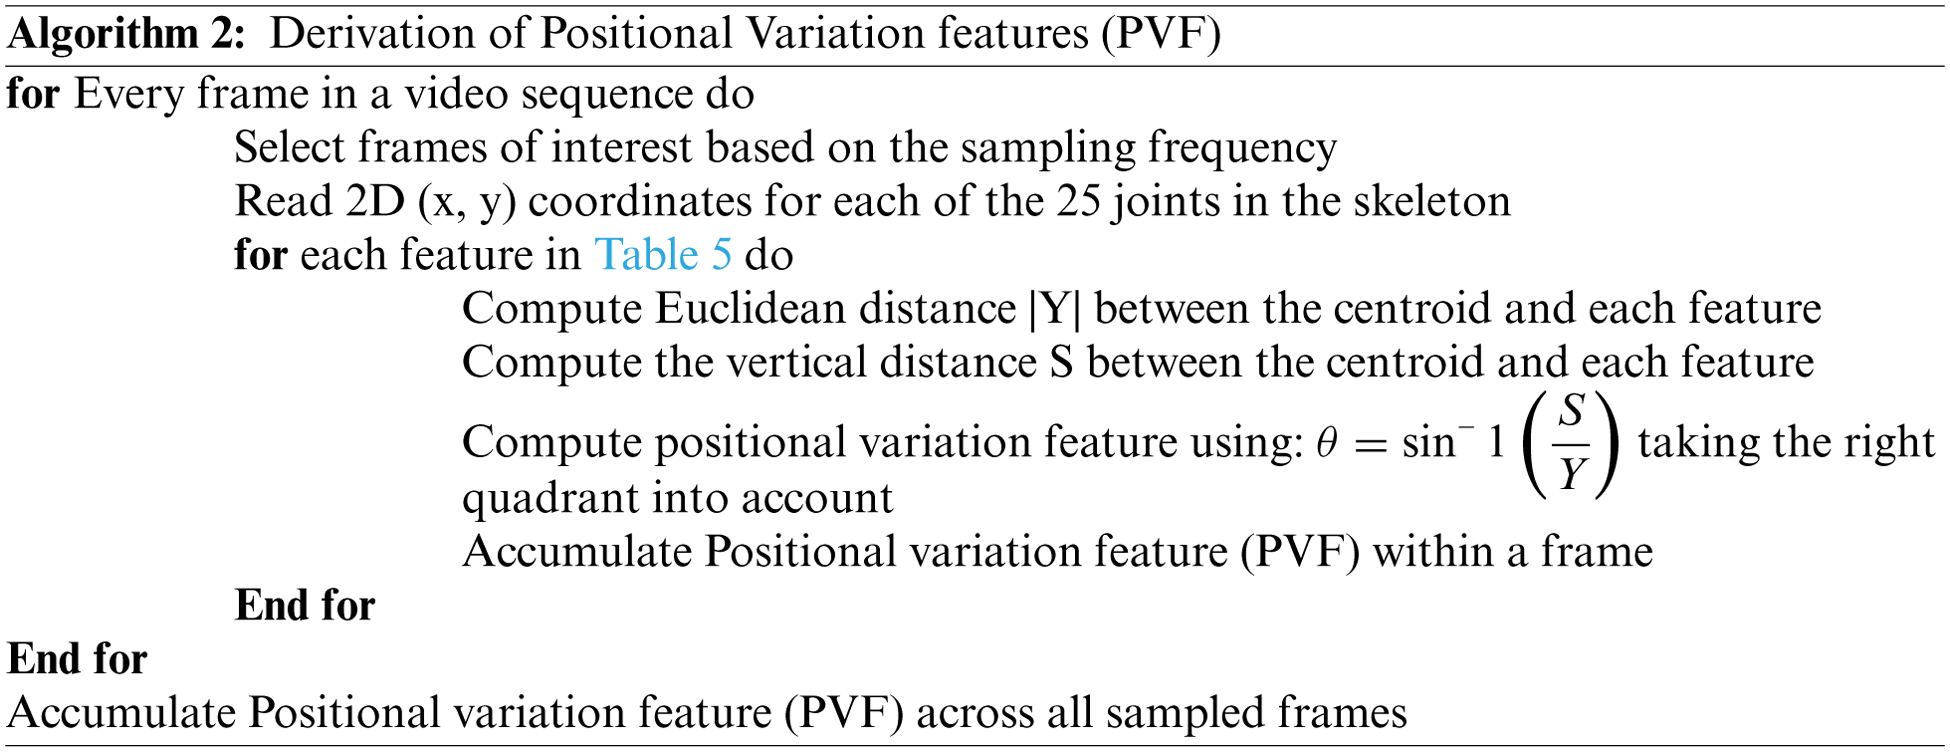
Overall, for an action having

Additionally, the PVF features are used to train a classifier to distinguish the nine different medical actions in NTU RGB + D skeletal dataset, and the associated F1 Score is shared in Table 4. Based on the results, it could be inferred that these features help distinguish medical conditions. Though not as crucial as the angular motion features (AMF), they still contribute to the overall accuracy improvement, as captured in Table 4.
3.2.3 Global Displacement Features (GDF)
During a medical condition, apart from the motion of joints and limbs in a skeleton, the entire human body could result in variations of position across time. To capture this variation, the global displacement features are extracted to model the direction of the shift in the human skeleton over time in the sampled frames of skeletal data. These features are helpful when the human moves over the course of action. The direction of each centroid in subsequent frames relative to the centroid region in the first frame is computed as the global displacement feature (GDF). This process is illustrated in Fig. 4 and calculated with Eqs. (4) and (5). The chest-mid region in the skeletal data is considered a centroid for computation purposes. Like the previous approach, the variation of barycenter computed across the different medical conditions in the NTU RGB + D skeletal dataset is presented in Table 7. The algorithm for computing the global displacement features (GDF) on nine medical actions in NTU RGB + D skeletal dataset is shared in Algorithm 3.
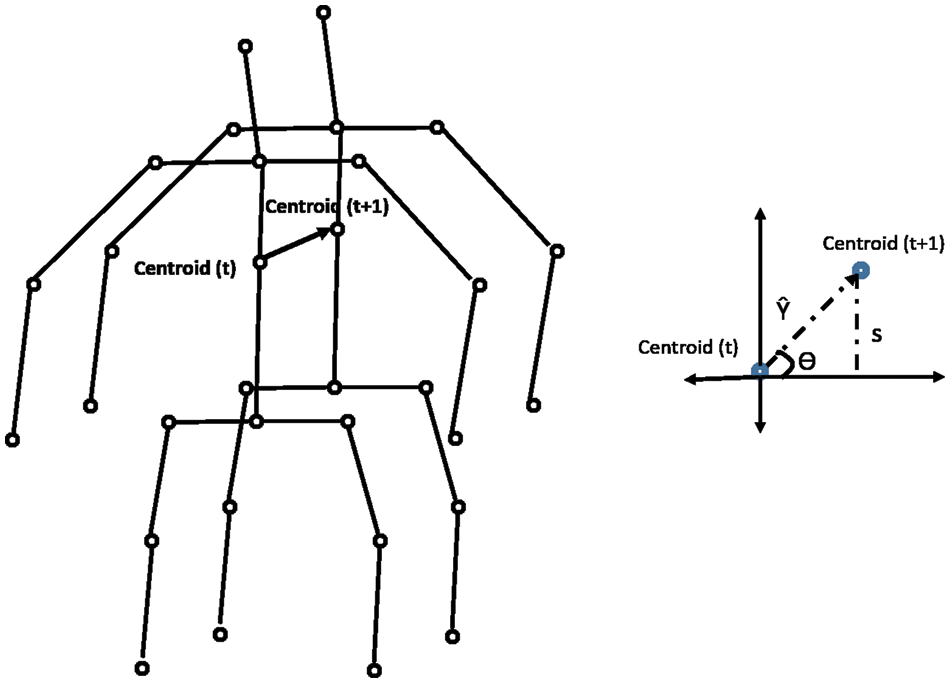
Figure 4: Computation of global displacement features

Additionally, the GDF feature is used to train a classifier to distinguish the nine different medical actions in NTU RGB + D skeletal dataset and the associated F1 Score is shown in Table 4. Based on the results, it could be inferred that these features capture actions when a significant change in the position of the whole body occurs, as denoted by the higher F1 score for a falling medical condition. This feature might not be directly beneficial, but it improves accuracy with the angular motion features (AMF) and positional variation features (PVF).

4 Medical Condition Identification Framework
As per the proposed framework, the incoming RGB video feeds from a commercial camera are used to extract 2D skeletal data with pose estimation modules such as Openpose. Derived features elaborated in Section 3 are computed from the 2D skeletal data to distinguish and identify medical conditions. As shown in Fig. 5, a two-stage process is proposed to identify the medical conditions from the derived skeletal features.
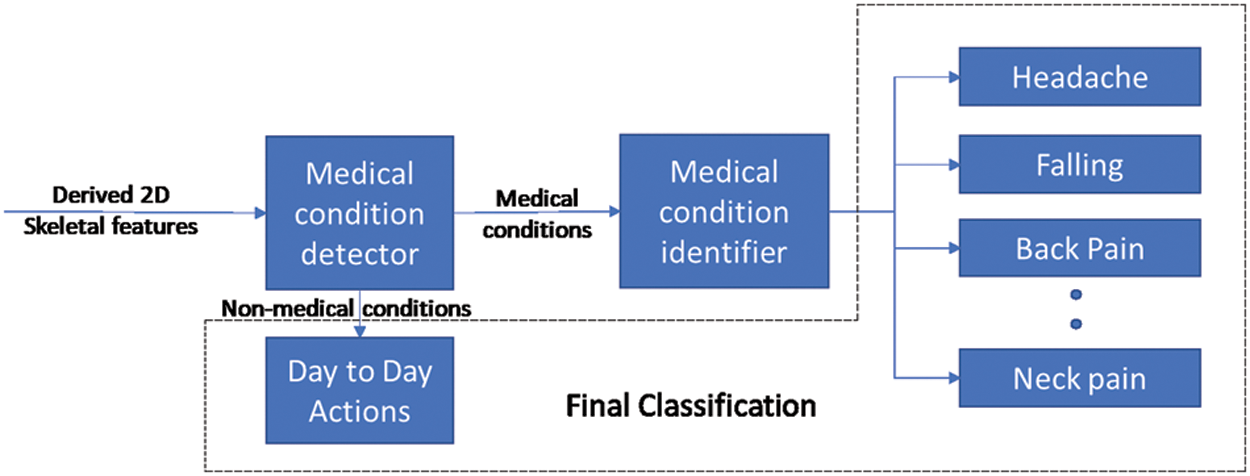
Figure 5: Overall framework
The first stage involves the development of a binary classifier to distinguish a potential medical condition from other day-to-day actions. By the end of this stage, timely notifications could be provided to inform the concerned systems/people that a possible medical condition has occurred. After detecting the occurrence of a medical condition in stage 1, a multi-class classifier in stage 2 is used to identify the medical condition. The multi-class classifier is trained with derived skeletal features about each medical condition such that each class corresponds to a specific medical condition.
Sections 4.1 & 4.2 elaborate on developing the classifiers for detecting and identifying medical conditions. In Section 4.3, the effectiveness of the 2-stage classifier is analyzed and computed.
4.1 Medical Condition Detection
The medical condition detection system aims to classify a short action video as a potential medical condition. Medical condition data in NTU (RGB) [23] is used to train a binary LSTM classifier to detect a medical condition. Among the 60 actions represented in the NTU (RGB) dataset, nine actions relevant to medical conditions are grouped into one class denoting medical conditions and the other actions are grouped within day-to-day actions. The sampling frequency is varied based on the duration of the action to ensure that 30 samples are available per action. This sampling process is based on the procedure described in Section 3.1.
The derived features described in Sections 3.2 to 3.4 are computed on these data samples and then used to train a binary LSTM classifier. Stochastic learning methods such as Adam Optimizer [29] are used for training due to their faster convergence and lesser data requirement at each iteration than batch-based training algorithms [30–32]. The hyperparameters used to train the classifier, such as the batch size, no of LSTM units and no of epochs, are selected after observing the accuracy curves for train and test data. These experimental results are detailed in Section 5.
The medical condition detector is found to provide a macro average F1 score accuracy of 0.77. The confusion matrix and performance metrics of the classifier are shown in Fig. 6 and Table 8, respectively.
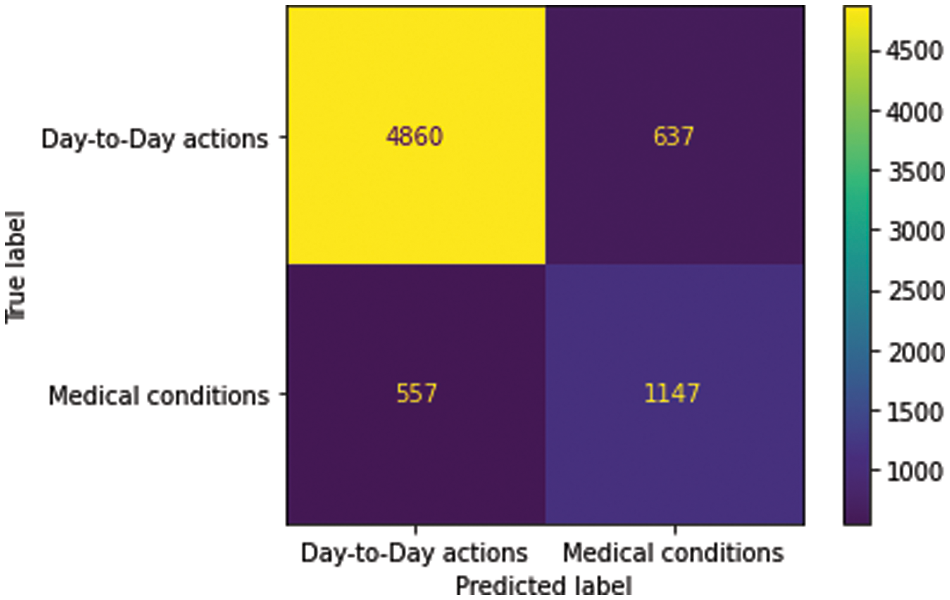
Figure 6: Confusion matrix–medical condition detetor

4.2 Medical Condition Identification
As part of the 2-stage process to identify the occurrence of a medical condition, the second stage involves the development of a multi-class classifier to determine the exact medical condition that has occurred. This classifier is only utilized on video data already detected as a potential medical condition by the stage 1 binary classifier. The nine different medical conditions present in the NTU (RGB) dataset [23] are utilized for training the multi-class classifier, with every medical condition representing a particular class. Thirty samples per action are selected based on the process outlined in Section 3.1.
An LSTM-based model is used to train the multi-class classifier utilizing Adam Optimizer for similar reasons. Hyperparameters such as the batch size, no of LSTM units and no of epochs are selected after observing the training and validation data accuracy curves. This process is detailed in Section 5.
Among the nine medical actions available in the NTU RGB + D skeletal dataset, a macro average F1 score of 0.73 was achieved. The performance metrics and the confusion matrix for the LSTM trained with the best configuration are presented in Table 9 and Fig. 7, respectively.

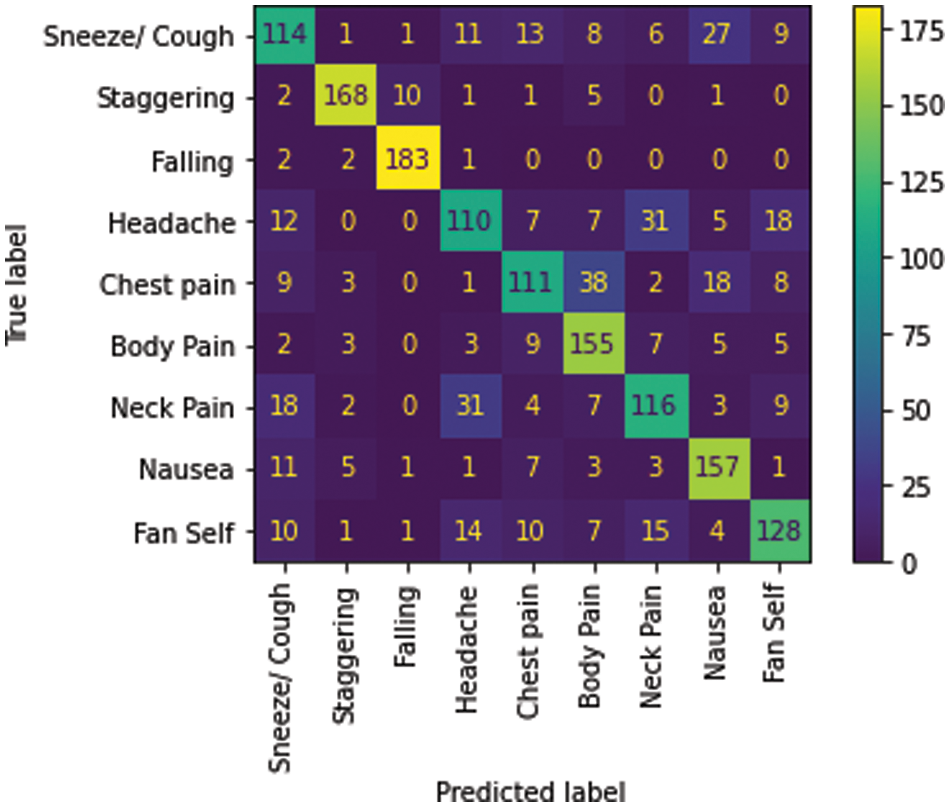
Figure 7: Confusion matrix–Medical condition identifier
4.3 Evaluation of the Two-Stage Framework
The 2-stage classifier processes day-to-day actions more often than medical conditions, which rarely occur. Most of these day-to-day actions are filtered by the stage 1 binary classifier, and only the actions detected as medical conditions are passed to the stage 2 medical condition identifier. This process results in the improvement of overall accuracy. The processing of test data with actual labels and the number of samples across the 2-stage classifier is explained in Fig. 8.
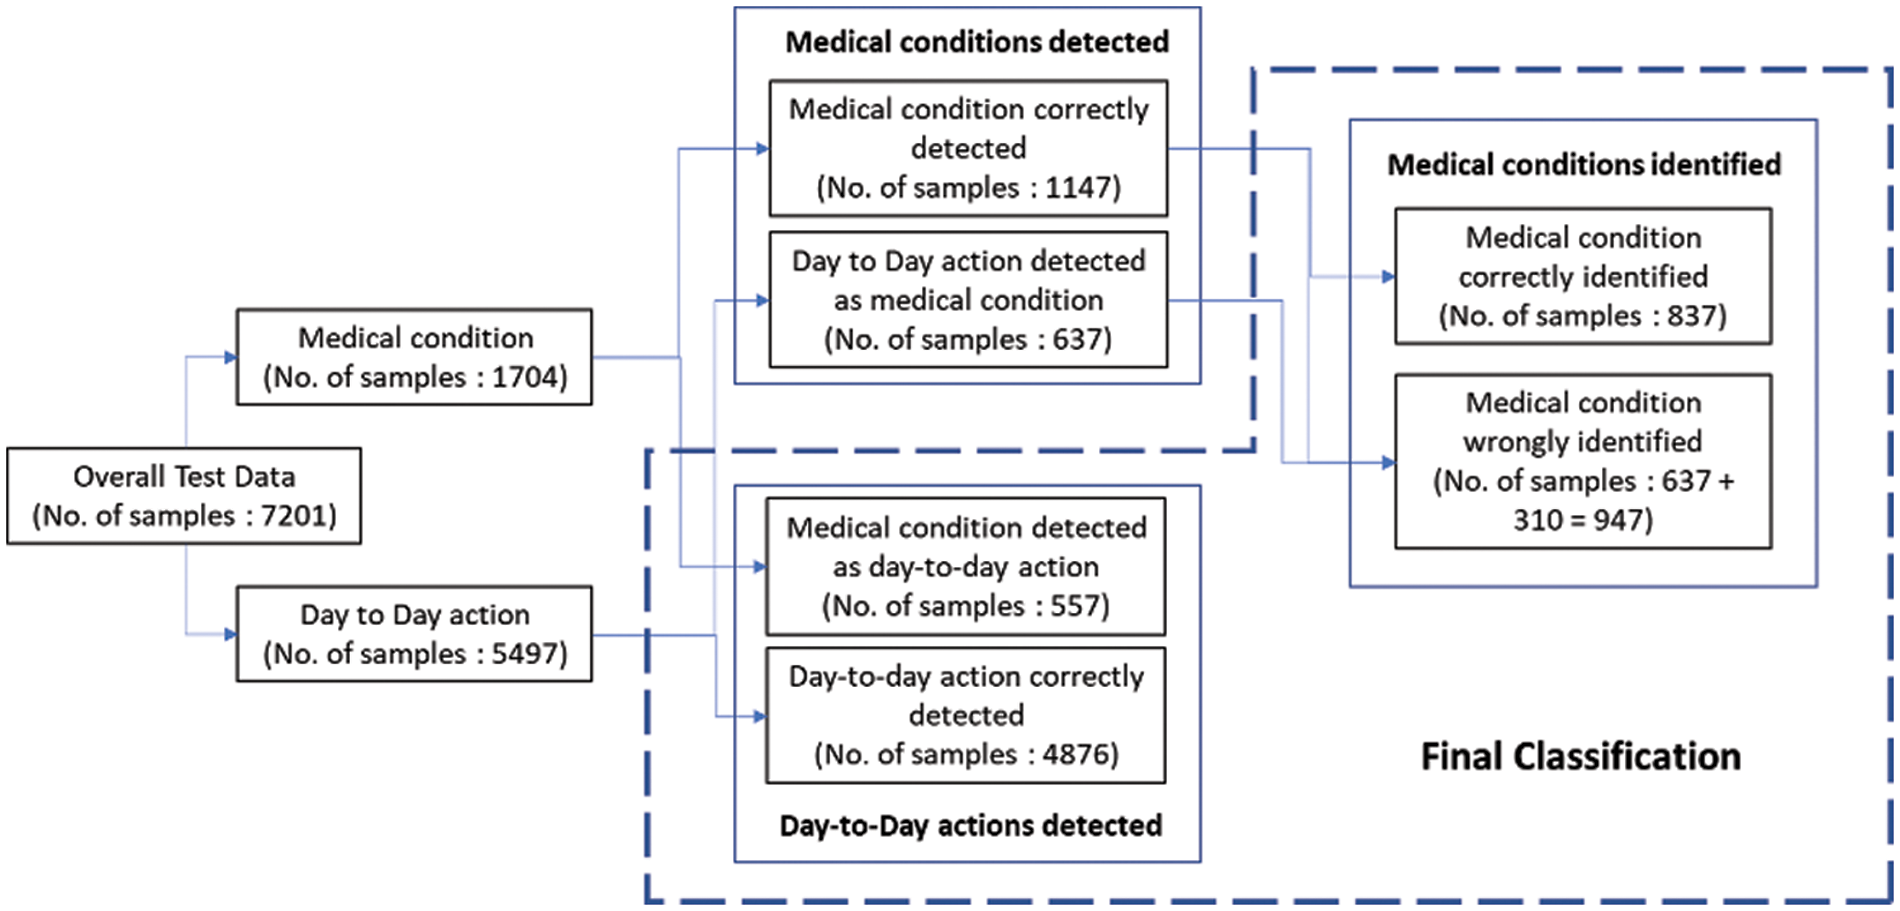
Figure 8: Test data flow in framework
The final classes that are identified are the day-to-day actions and the specific medical conditions. The test data samples classified in different categories are listed in Table 10. The weighted F1 score of the overall system with test data is 80%. The relevant accuracy metrics of the overall system are listed in Table 11.


The performance evaluation for the medical condition detection and identification classifiers are detailed in Section 5.1. The results are compared to related work in Section 5.2.
The binary and multi-class classifier’s hyperparameters are tuned by evaluating different configurations. The train and test data are segregated using an 80:20 stratified split for both classifiers. A dropout of 50% is introduced into the classifier to prevent overfitting. The batch size and the number of LSTM units are determined by observing the train and test accuracy curves shown in Figs. 7 and 8 for the binary and multiclass classifiers, respectively.
We select batch size 16 and LSTM with 200 units as the ideal configuration for the binary classifier after observing the saturation of accuracy post 200 LSTM units and the accuracy curves being more stable in this configuration. The confusion matrix and performance metrics for the binary classifier are shared in Fig. 9 and Table 10, respectively.
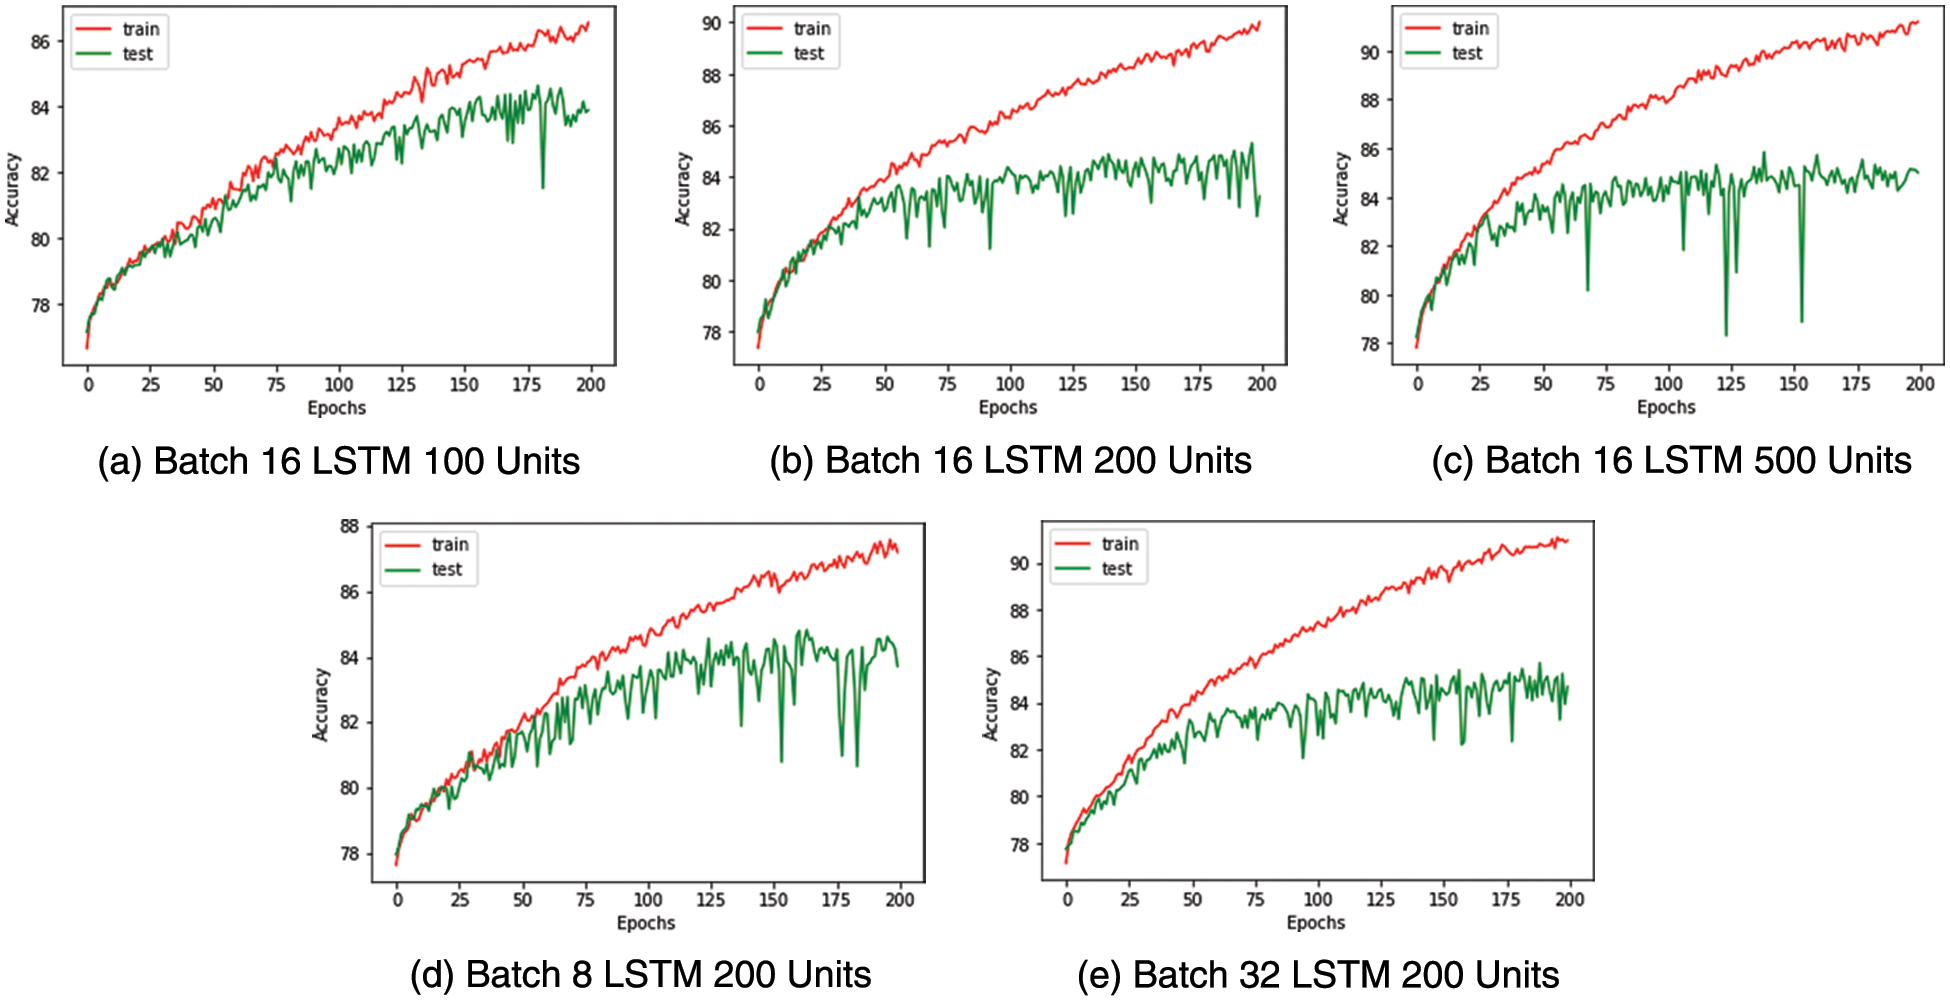
Figure 9: Medical condition detection-test train accuracy curves
Similarly, for the multiclass classifier used to identify medical conditions, batch size eight and LSTM with 200 units are selected as the ideal configuration after observing the saturation of accuracy post 200 LSTM units and the accuracy curves being more stable with a batch size of 8. The confusion matrix and performance metrics for the multi-class classifier are captured in Fig. 10 and Table 11, respectively.
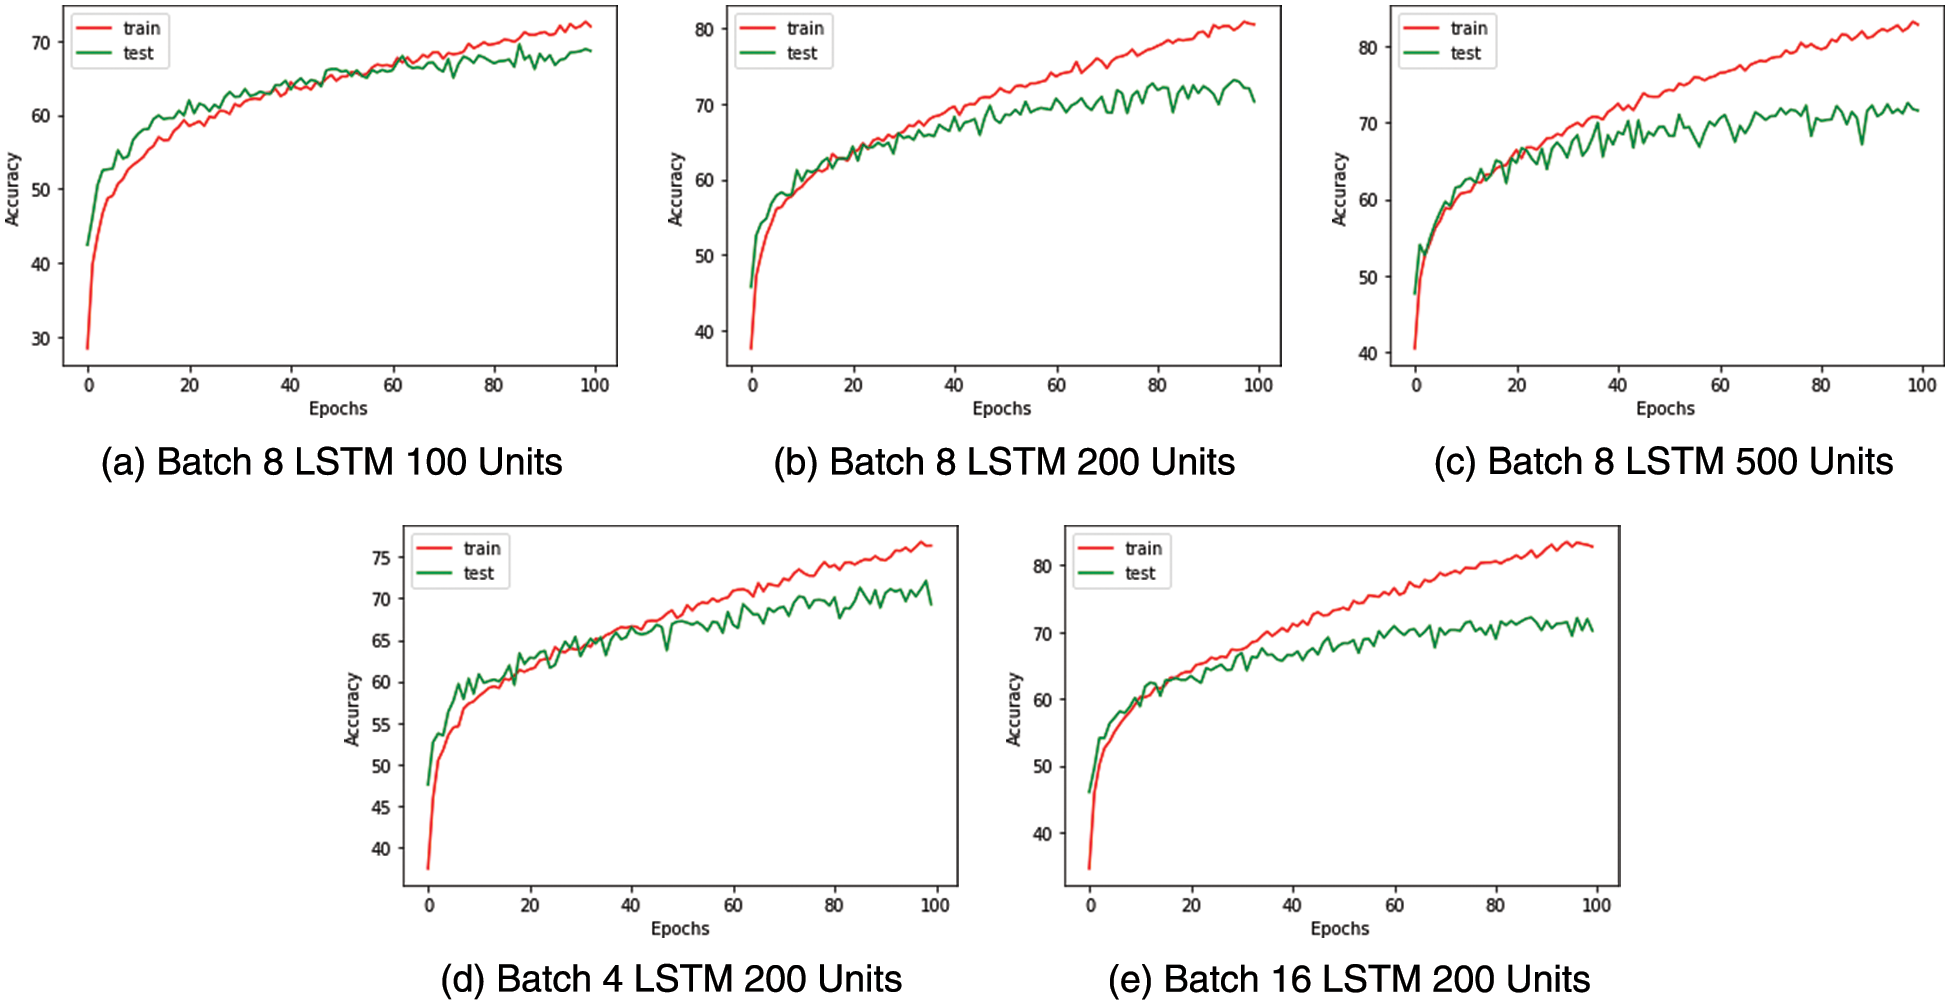
Figure 10: Medical condition identification-train test accuracy curves
The multi-class classifier works very well in identifying conditions such as falling and staggering where the F1 score is above 0.9, as shown in Table 11. This is a result of the unique nature of these actions compared to the other actions. Less unique actions such as headache, cough and neck pain have relatively lower accuracy with an F1 score below 0.7. It is found from the confusion matrix that some instances of cough have wrongly been classified as nausea and vice versa. Similarly, we note that there are misclassifications of headache with neck pain due to the proximity between these impact regions and the similarity in their actions.
Thus, the classifiers built for detecting and identifying medical conditions have shown the capability to distinguish actions on test data, despite the minimal features used.
In this section, the accuracy and complexity of our system are compared with existing work. To compare the complexity of this system, the number of parameters present in the binary and multiclass classifiers is calculated. This number is then compared with the parameters required by other generic CNN-based deep neural networks [33] that classify actions from 2D skeletal data. Table 12 captures the complexity and accuracy of different 2D CNN-based approaches [33] on NTU RGB+D 2D skeletal data and compares them with our classifier metrics. It is observed from Table 10 that 2D CNN-based classifiers producing an accuracy like our approach require 10 to 100 times more parameters compared to our multi-class classifier.

Table 13 compares the classifiers discussed in this paper with sophisticated LSTM and GCN-based classifiers that detect action from 3D skeletal data. It can be observed that the binary and multiclass classifiers proposed for identifying medical conditions show comparable results to generic classifiers despite utilizing the 2D skeletal data and, on average five times fewer frames compared to the other classifiers listed.
From Table 14, it could be inferred that despite our fall identification system utilizing 2D skeletal information and being more generic with the capability also to identify other medical conditions, it can provide comparable results to dedicated fall identification systems based on 3D skeletal data.
Thus, we present a working procedure to detect and identify visual medical conditions in a non-invasive manner and have tested its accuracy on a standard NTU RGB + D 2D skeletal dataset. Our approach is highly scalable due to using common RGB data, which could be made available from traditional surveillance cameras. Our system tested on NTU RGB + D 2D skeletal data has produced average F1 scores of 77% for medical condition detection and 73% for medical condition identification. The developed system shows high accuracy in identifying differentiable medical conditions, moderate accuracy with difficult-to-discern actions and high interpretability. The number of parameters in the medical condition identification classifier is lesser by a factor of 10 to 100 compared to other deep learning classifiers on 2D skeletal data with comparable accuracy. This proves that our system is very computationally efficient and can be implemented on commodity hardware.
Due to its high scalability and non-invasive nature, the system could be utilized to monitor medical conditions such as cough and headache, which could be representative of highly infectious diseases during times of pandemic. For real-world usage, the system accuracy needs to be improved further, especially for the difficult to discern medical conditions. Based on this goal, we plan to explore and research more granular features related to medical conditions and possibly augment skeletal data with representative features derived from RGB images and depth-based data for improved accuracy.
Funding Statement: The authors received no specific funding for this study.
Conflicts of Interest: The authors declare that they have no conflicts of interest to report regarding the present study.
References
1. P. P. Fathimathul Rajeena and R. Sivakumar, “Brain tumor classification using image fusion and efpa-svm classifier,” Intelligent Automation & Soft Computing, vol. 35, no. 3, pp. 2837–2855, 2023. [Google Scholar]
2. S. Kumar and K. V. Kumar, “Integrated privacy preserving healthcare system using posture-based classifier in cloud,” Intelligent Automation & Soft Computing, vol. 35, no. 3, pp. 2893–2907, 2023. [Google Scholar]
3. A. Rath, D. Mishra, G. Panda, S. C. Satapathy and K. Xia, “Improved heart disease detection from ECG signal using deep learning based ensemble model,” Sustainable Computing: Informatics and Systems, vol. 35, no. 3, pp. 100732, 2022. [Google Scholar]
4. L. Abou, J. Peters, E. Wong, R. Akers, M. S. Dossou et al., “Gait and balance assessments using smartphone applications in Parkinson’s disease: A systematic review,” Journal of Medical Systems, vol. 45, no. 9, pp. 1–20, 2021. [Google Scholar]
5. J. A. Reyes-Retana and L. C. Duque-Ossa, “Acute myocardial infarction biosensor: A review from bottom up,” Current Problems in Cardiology, vol. 46, no. 3, pp. 100739, 2021. [Google Scholar] [PubMed]
6. J. Yin, J. Han, C. Wang, B. Zhang and X. Zeng, “A skeleton-based action recognition system for medical condition detection,” in Proc. IEEE Biomedical Circuits and Systems Conf. (BioCAS), Nara, Japan, pp. 1–4, 2019. [Google Scholar]
7. V. Lobanova, V. Slizov and L. Anishchenko, “Contactless fall detection by means of multiple bioradars and transfer learning,” Sensors, vol. 22, no. 16, pp. 6285, 2022. [Google Scholar] [PubMed]
8. P. Pareek and A. Thakkar, “A survey on video-based human action recognition: Recent updates, datasets, challenges and applications,” Artificial Intelligence Review, vol. 54, no. 3, pp. 2259–2322, 2021. [Google Scholar]
9. D. Liang and E. Thomaz, “Audio-based activities of daily living (adl) recognition with large-scale acoustic embeddings from online videos,” Proceedings of the ACM on Interactive, Mobile, Wearable and Ubiquitous Technologies, vol. 3, no. 1, pp. 1–18, 2019. [Google Scholar]
10. G. Yao, T. Lei and J. Zhong, “A review of convolutional-neural-network-based action recognition,” Pattern Recognition Letters, vol. 118, no. 2, pp. 14–22, 2019. [Google Scholar]
11. X. Li, Y. He and X. Jing, “A survey of deep learning-based human activity recognition in radar,” Remote Sensing, vol. 11, no. 9, pp. 1068, 2019. [Google Scholar]
12. A. Akula, A. K. Shah and R. Ghosh, “Deep learning approach for human action recognition in infrared images,” Cognitive Systems Research, vol. 50, no. 4, pp. 146–154, 2018. [Google Scholar]
13. I. Morawski and W. N. Lie, “Two-stream deep learning architecture for action recognition by using extremely low-resolution infrared thermopile arrays,” in Int. Workshop on Advanced Imaging Technology (IWAIT), Yogyakarta, Indonesia, pp. 164–169, 2020. [Google Scholar]
14. Y. Ghadi, N. Khalid, S. A. Alsuhibany, T. A. Shloul, A. Jalal et al., “An intelligent healthcare monitoring framework for daily assistant living,” Computers, Materials & Continua, vol. 72, no. 2, pp. 2597–2615, 2022. [Google Scholar]
15. M. Tadalagi and A. M. Joshi, “Autodep: Automatic depression detection using facial expressions based on linear binary pattern descriptor,” Medical & Biological Engineering & Computing, vol. 59, no. 6, pp. 1339–1354, 2021. [Google Scholar]
16. W. Kim, J. Sung, D. Saakes, C. Huang and S. Xiong, “Ergonomic postural assessment using a new open-source human pose estimation technology (OpenPose),” International Journal of Industrial Ergonomics, vol. 84, no. 4, pp. 103164, 2021. [Google Scholar]
17. H. Wu, J. Liu, X. Zhu, M. Wang and Z. J. Zha, “Multi-scale spatial-temporal integration convolutional tube for human action recognition,” in Proc. Twenty-Ninth Int. Conf. on Artificial Intelligence, Yokohama, Japan, pp. 753–759, 2021. [Google Scholar]
18. M. Dong, Z. Fang, Y. Li, S. Bi and J. Chen, “AR3D: Attention residual 3D network for human action recognition,” Sensors, vol. 21, no. 5, pp. 1656, 2021. [Google Scholar] [PubMed]
19. A. Zhu, Q. Wu, R. Cui, T. Wang, W. Hang et al., “Exploring a rich spatial-temporal dependent relational model for skeleton-based action recognition by bidirectional LSTM-CNN,” Neurocomputing, vol. 414, no. 44, pp. 90–100, 2020. [Google Scholar]
20. C. Xu, R. Liu, T. Zhang, Z. Cui, J. Yang et al., “Dual-stream structured graph convolution network for skeleton-based action recognition,” ACM Transactions on Multimedia Computing, Communications and Applications (TOMM), vol. 17, no. 4, pp. 1–22, 2021. [Google Scholar]
21. L. Shi, Y. Zhang, J. Cheng and H. Lu, “Skeleton-based action recognition with directed graph neural networks,” in Proc. IEEE/CVF Conf. on Computer Vision and Pattern Recognition, Long Beach, CA, USA, pp. 7912–7921, 2019. [Google Scholar]
22. C. Jing, P. Wei, H. Sun and N. Zheng, “Spatiotemporal neural networks for action recognition based on joint loss,” Neural Computing and Applications, vol. 32, no. 9, pp. 4293–4302, 2020. [Google Scholar]
23. A. Shahroudy, J. Liu, T. T. Ng and G. Wang, “Ntu RGB + D: A large scale dataset for 3D human activity analysis,” in Proc. IEEE Conf. on Computer Vision and Pattern Recognition, Boston, MA, USA, pp. 1010–1019, 2015. [Google Scholar]
24. J. Trelinski and B. Kwolek, “CNN-based and DTW features for human activity recognition on depth maps,” Neural Computing and Applications, vol. 33, no. 21, pp. 14551–14563, 2021. [Google Scholar]
25. C. Goller and A. Kuchler, “Learning task-dependent distributed representations by backpropagation through structure,” in Proc. Int. Conf. on Neural Networks (ICNN), Washington, DC, USA, pp. 347–352, 1996. [Google Scholar]
26. S. Behera, R. Misra and A. Sillitti, “Multiscale deep bidirectional gated recurrent neural networks based prognostic method for complex non-linear degradation systems,” Information Sciences, vol. 554, no. 13, pp. 120–144, 2021. [Google Scholar]
27. S. Hochreiter and J. Schmidhuber, “Long short-term memory,” Neural Computation, vol. 9, no. 8, pp. 1735–1780, 1997. [Google Scholar] [PubMed]
28. A. Lahreche and B. Boucheham, “A fast and accurate similarity measure for long time series classification based on local extrema and dynamic time warping,” Expert Systems with Applications, vol. 168, no. 6, pp. 114374, 2021. [Google Scholar]
29. I. K. M. Jais, A. R. Ismail and S. Q. Nisa, “Adam optimization algorithm for wide and deep neural network,” Knowledge Engineering and Data Science, vol. 2, no. 1, pp. 41–46, 2019. [Google Scholar]
30. K. Levenberg, “A method for the solution of certain non-linear problems in least squares,” Quarterly of Applied Mathematics, vol. 2, no. 2, pp. 164–168, 1944. [Google Scholar]
31. S. S. Malalur, M. T. Manry and P. Jesudhas, “Multiple optimal learning factors for the multi-layer perceptron,” Neurocomputing, vol. 149, no. 5, pp. 1490–1501, 2015. [Google Scholar]
32. P. Jesudhas, M. T. Manry, R. Rawat and S. Malalur, “Analysis and improvement of multiple optimal learning factors for feed-forward networks,” in Proc. Int. Joint Conf. on Neural Networks, San Jose, California, USA, pp. 2593–2600, 2011. [Google Scholar]
33. S. Aubry, S. Laraba, S. Tilmanne and T. Dutoit, “Action recognition based on 2D skeletons extracted from RGB videos,” in Proc. MATEC Web Conf., pp. 2034, 2019. [Google Scholar]
34. J. Liu, A. Shahroudy, D. Xu and G. Wang, “Spatio-temporal lstm with trust gates for 3D human action recognition,” in Proc. European Conf. on Computer Vision, Amsterdam, Netherlands, pp. 816–833, 2016. [Google Scholar]
35. S. Yan, Y. Xiong and D. Lin, “Spatial temporal graph convolutional networks for skeleton-based action recognition,” in Proc. Thirty-Second AAAI Conf. on Artificial Intelligence, New Orleans, Louisiana, USA, pp. 7444–7452, 2018. [Google Scholar]
36. J. Liu, G. Wang, P. Hu, L. Y. Duan and A. C. Kot, “Global contextaware attention lstm networks for 3D action recognition,” in Proc. IEEE Conf. on Computer Vision and Pattern Recognition, Honolulu, Hawaii, USA, pp. 1647–1656, 2017. [Google Scholar]
37. A. Shojaei-Hashemi, P. Nasiopoulos, J. J. Little and M. T. Pourazad, “Video-based human fall detection in smart homes using deep learning,” in Proc. IEEE Int. Symp. on Circuits and Systems (ISCAS), Florence, Italy, pp. 1–5, 2018. [Google Scholar]
Cite This Article
 Copyright © 2023 The Author(s). Published by Tech Science Press.
This work is licensed under a Creative Commons Attribution 4.0 International License , which permits unrestricted use, distribution, and reproduction in any medium, provided the original work is properly cited.


 Submit a Paper
 Propose a Special lssue
 View Full Text
 Download PDF

 Downloads
 Citation Tools